
#marketresearch
marketresearch
42,794 views
105 Discussing
Hot
Latest

YOUR OPINION CAN FUND YOUR FIRST TRADE. Seriously.
What if the first money in your trading account came from answering questions instead of risking money on the market?
Paid research is a real side hustle — but there’s a big difference between clicking through endless $0.20 surveys and getting selected for a proper research interview.
Here are three places worth checking:
🔹 Prolific — academic and commercial studies. You can see the estimated time and reward before accepting. Cashout starts at $6/£6 via PayPal, but new users may face a waitlist.
🔹 User Interviews — interviews, focus groups and product research. Poland is on its participant country list. Rewards depend on the study and may come as digital gift cards rather than cash.
🔹 Respondent — research interviews and professional studies. Some sessions pay considerably more than ordinary surveys, but screeners are unpaid, selection isn't guaranteed, and rewards are delivered through Tremendous.
And here's the catch: this isn't a daily salary. You may apply to several studies and qualify for none. Your location, profession, language and experience all affect your chances.
My advice? Don't build a trading strategy around survey income. Build a small reserve with it. Every dollar earned without risking your own capital is a dollar you didn't have to deposit.
Would you trade with money earned from sharing your opinions? Or does that sound like too much work for too little reward?
I'll prepare deeper research on the opportunities that get the most interest. If this topic deserves a full investigation, let me know through likes and comments.
#PaidSurveys #SideHustle #makemoneyonline #MarketResearch #ExtraIncome
YOUR OPINION CAN FUND YOUR FIRST TRADE. Seriously.
What if the first money in your trading account came from answering questions instead of risking money on the market?
Paid research is a real side hustle — but there’s a big difference between clicking through endless $0.20 surveys and getting selected for a proper research interview.
Here are three places worth checking:
🔹 Prolific — academic and commercial studies. You can see the estimated time and reward before accepting. Cashout starts at $6/£6 via PayPal, but new users may face a waitlist.
🔹 User Interviews — interviews, focus groups and product research. Poland is on its participant country list. Rewards depend on the study and may come as digital gift cards rather than cash.
🔹 Respondent — research interviews and professional studies. Some sessions pay considerably more than ordinary surveys, but screeners are unpaid, selection isn't guaranteed, and rewards are delivered through Tremendous.
And here's the catch: this isn't a daily salary. You may apply to several studies and qualify for none. Your location, profession, language and experience all affect your chances.
My advice? Don't build a trading strategy around survey income. Build a small reserve with it. Every dollar earned without risking your own capital is a dollar you didn't have to deposit.
Would you trade with money earned from sharing your opinions? Or does that sound like too much work for too little reward?
I'll prepare deeper research on the opportunities that get the most interest. If this topic deserves a full investigation, let me know through likes and comments.
#PaidSurveys #SideHustle #makemoneyonline #MarketResearch #ExtraIncome
What if the first money in your trading account came from answering questions instead of risking money on the market?
Paid research is a real side hustle — but there’s a big difference between clicking through endless $0.20 surveys and getting selected for a proper research interview.
Here are three places worth checking:
🔹 Prolific — academic and commercial studies. You can see the estimated time and reward before accepting. Cashout starts at $6/£6 via PayPal, but new users may face a waitlist.
🔹 User Interviews — interviews, focus groups and product research. Poland is on its participant country list. Rewards depend on the study and may come as digital gift cards rather than cash.
🔹 Respondent — research interviews and professional studies. Some sessions pay considerably more than ordinary surveys, but screeners are unpaid, selection isn't guaranteed, and rewards are delivered through Tremendous.
And here's the catch: this isn't a daily salary. You may apply to several studies and qualify for none. Your location, profession, language and experience all affect your chances.
My advice? Don't build a trading strategy around survey income. Build a small reserve with it. Every dollar earned without risking your own capital is a dollar you didn't have to deposit.
Would you trade with money earned from sharing your opinions? Or does that sound like too much work for too little reward?
I'll prepare deeper research on the opportunities that get the most interest. If this topic deserves a full investigation, let me know through likes and comments.
#PaidSurveys #SideHustle #makemoneyonline #MarketResearch #ExtraIncome

1
328

·
--
$OPN ($OPN ) — Market Research Before You Trade
{future}(OPNUSDT)
OPINION ($OPN ) is positioning itself as a “People’s Terminal for Global Economic Trading” — a prediction-market infrastructure designed to let users trade macroeconomic data, predictions, and real-world events on-chain.
Key fundamentals
• Total supply: 1B OPN
• Initial circulating supply: 198.5M (19.85%)
• Day-1 real float: ~18.85%
• Funding raised: ~$25.3M across Seed, Pre-A and Series A
• Core products: Opinion.Trade, Opinion AI, Opinion Metapool & Opinion Protocol
• Reported platform activity: $22.9B cumulative notional volume and 242K+ wallets
• Token utility: Data access, VIP benefits, fee reductions and governance
The important part: supply risk
At launch, approximately 9.15% of total supply was classified as retail-related distribution, including airdrops and ecosystem incentives, while 9.7% was institution/project-controlled through liquidity and marketing allocations.
That makes the post-listing wallet flows and future unlocks particularly important.
A strong product narrative doesn't automatically mean a strong token price.
For $OPN, I will watch:
→ Exchange inflows/outflows
→ Investor & team wallet movements
→ Future token unlocks
→ Real platform usage
→ Trading volume vs. incentives
→ Liquidity depth
→ Growth of prediction-market users
→ Development of AI oracle and institutional products
My view
Fundamentals: Interesting
Narrative: Strong
Adoption: Worth monitoring
Tokenomics: Requires caution
Key risk: Future supply pressure + early-holder selling
This is research, not a buy/sell recommendation. Price action and on-chain data should be evaluated alongside the fundamentals.
If you found this research useful, consider tipping/supporting the research. It helps me continue producing independent market reports and on-chain analysis.
Research first. Risk management always.
#OPNUSDT #MarketResearch
$OPN ($OPN ) — Market Research Before You Trade
OPINION ($OPN ) is positioning itself as a “People’s Terminal for Global Economic Trading” — a prediction-market infrastructure designed to let users trade macroeconomic data, predictions, and real-world events on-chain.
Key fundamentals
• Total supply: 1B OPN
• Initial circulating supply: 198.5M (19.85%)
• Day-1 real float: ~18.85%
• Funding raised: ~$25.3M across Seed, Pre-A and Series A
• Core products: Opinion.Trade, Opinion AI, Opinion Metapool & Opinion Protocol
• Reported platform activity: $22.9B cumulative notional volume and 242K+ wallets
• Token utility: Data access, VIP benefits, fee reductions and governance
The important part: supply risk
At launch, approximately 9.15% of total supply was classified as retail-related distribution, including airdrops and ecosystem incentives, while 9.7% was institution/project-controlled through liquidity and marketing allocations.
That makes the post-listing wallet flows and future unlocks particularly important.
A strong product narrative doesn't automatically mean a strong token price.
For $OPN , I will watch:
→ Exchange inflows/outflows
→ Investor & team wallet movements
→ Future token unlocks
→ Real platform usage
→ Trading volume vs. incentives
→ Liquidity depth
→ Growth of prediction-market users
→ Development of AI oracle and institutional products
My view
Fundamentals: Interesting
Narrative: Strong
Adoption: Worth monitoring
Tokenomics: Requires caution
Key risk: Future supply pressure + early-holder selling
This is research, not a buy/sell recommendation. Price action and on-chain data should be evaluated alongside the fundamentals.
If you found this research useful, consider tipping/supporting the research. It helps me continue producing independent market reports and on-chain analysis.
Research first. Risk management always.
#OPNUSDT #MarketResearch
OPINION ($OPN ) is positioning itself as a “People’s Terminal for Global Economic Trading” — a prediction-market infrastructure designed to let users trade macroeconomic data, predictions, and real-world events on-chain.
Key fundamentals
• Total supply: 1B OPN
• Initial circulating supply: 198.5M (19.85%)
• Day-1 real float: ~18.85%
• Funding raised: ~$25.3M across Seed, Pre-A and Series A
• Core products: Opinion.Trade, Opinion AI, Opinion Metapool & Opinion Protocol
• Reported platform activity: $22.9B cumulative notional volume and 242K+ wallets
• Token utility: Data access, VIP benefits, fee reductions and governance
The important part: supply risk
At launch, approximately 9.15% of total supply was classified as retail-related distribution, including airdrops and ecosystem incentives, while 9.7% was institution/project-controlled through liquidity and marketing allocations.
That makes the post-listing wallet flows and future unlocks particularly important.
A strong product narrative doesn't automatically mean a strong token price.
For $OPN , I will watch:
→ Exchange inflows/outflows
→ Investor & team wallet movements
→ Future token unlocks
→ Real platform usage
→ Trading volume vs. incentives
→ Liquidity depth
→ Growth of prediction-market users
→ Development of AI oracle and institutional products
My view
Fundamentals: Interesting
Narrative: Strong
Adoption: Worth monitoring
Tokenomics: Requires caution
Key risk: Future supply pressure + early-holder selling
This is research, not a buy/sell recommendation. Price action and on-chain data should be evaluated alongside the fundamentals.
If you found this research useful, consider tipping/supporting the research. It helps me continue producing independent market reports and on-chain analysis.
Research first. Risk management always.
#OPNUSDT #MarketResearch
1
416

📰 Market Research — $A2Z
━━━━━━━━━━━━━━━━━
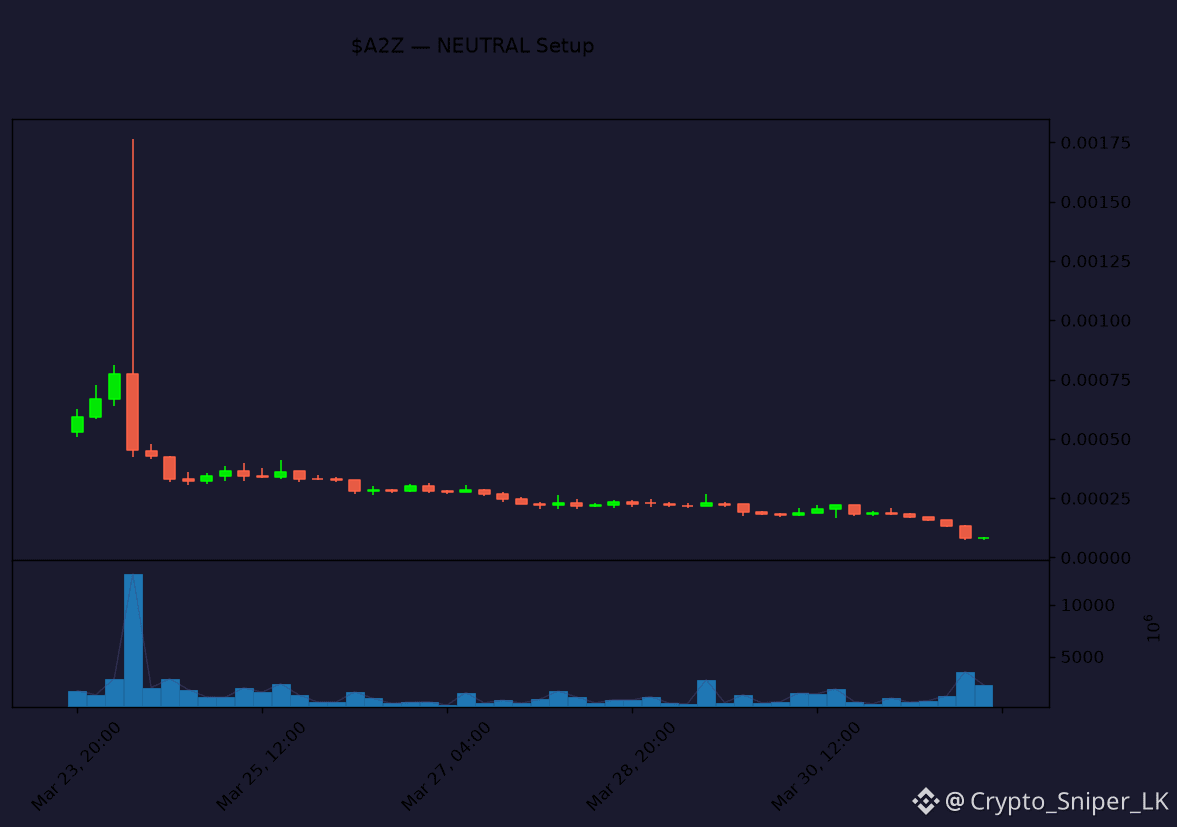
The cryptocurrency market is currently experiencing a severe liquidity contraction, characterized by aggressive sell-offs across low-cap assets and a significant deviation from average 24-hour volume trends. Sentiment remains deeply bearish as speculative capital exits high-beta positions, leading to widespread volatility and capitulation events.
$A2Z, $ACA, and $DEGO are leading the downside, each shedding over 50% in value as selling pressure overwhelms order books. $A2Z shows extreme fragility with a 54% drop, while $ACA struggles to find a floor after a 59% decline over the last 48 hours. $DEGO exhibits a critical breakdown, trading near its 4H support level of $0.02 after failing to hold the $0.08 resistance zone. The scarcity of green candles across these assets—with $ACA and $DEGO printing only 2 out of 12—signals a lack of institutional bid support and deep oversold conditions on RSI indicators. MACD momentum remains firmly in bearish territory, suggesting further downside risk unless volume spikes significantly to reclaim key moving averages.
Market participants are rotating away from speculative altcoins, with no clear narrative strength emerging as capital flees to safety. The lack of sector-specific resilience underscores a broader risk-off environment where even established DeFi and infrastructure tokens are facing heavy liquidation.
Key levels to watch include Bitcoin dominance, which must stabilize to prevent further altcoin bleeding; a breach below current support levels for these top movers would confirm a deeper structural breakdown. Traders should prioritize capital preservation and avoid catching falling knives, as the current volatility poses a high risk of further liquidity traps.
━━━━━━━━━━━━━━━━━
#A2Z #MarketResearch #CryptoAnalysis
🔔 Follow for daily market research & signals!
📰 Market Research — $A2Z
━━━━━━━━━━━━━━━━━
The cryptocurrency market is currently experiencing a severe liquidity contraction, characterized by aggressive sell-offs across low-cap assets and a significant deviation from average 24-hour volume trends. Sentiment remains deeply bearish as speculative capital exits high-beta positions, leading to widespread volatility and capitulation events.
$A2Z, $ACA, and $DEGO are leading the downside, each shedding over 50% in value as selling pressure overwhelms order books. $A2Z shows extreme fragility with a 54% drop, while $ACA struggles to find a floor after a 59% decline over the last 48 hours. $DEGO exhibits a critical breakdown, trading near its 4H support level of $0.02 after failing to hold the $0.08 resistance zone. The scarcity of green candles across these assets—with $ACA and $DEGO printing only 2 out of 12—signals a lack of institutional bid support and deep oversold conditions on RSI indicators. MACD momentum remains firmly in bearish territory, suggesting further downside risk unless volume spikes significantly to reclaim key moving averages.
Market participants are rotating away from speculative altcoins, with no clear narrative strength emerging as capital flees to safety. The lack of sector-specific resilience underscores a broader risk-off environment where even established DeFi and infrastructure tokens are facing heavy liquidation.
Key levels to watch include Bitcoin dominance, which must stabilize to prevent further altcoin bleeding; a breach below current support levels for these top movers would confirm a deeper structural breakdown. Traders should prioritize capital preservation and avoid catching falling knives, as the current volatility poses a high risk of further liquidity traps.
━━━━━━━━━━━━━━━━━
#A2Z #MarketResearch #CryptoAnalysis
🔔 Follow for daily market research & signals!
━━━━━━━━━━━━━━━━━
The cryptocurrency market is currently experiencing a severe liquidity contraction, characterized by aggressive sell-offs across low-cap assets and a significant deviation from average 24-hour volume trends. Sentiment remains deeply bearish as speculative capital exits high-beta positions, leading to widespread volatility and capitulation events.
$A2Z, $ACA, and $DEGO are leading the downside, each shedding over 50% in value as selling pressure overwhelms order books. $A2Z shows extreme fragility with a 54% drop, while $ACA struggles to find a floor after a 59% decline over the last 48 hours. $DEGO exhibits a critical breakdown, trading near its 4H support level of $0.02 after failing to hold the $0.08 resistance zone. The scarcity of green candles across these assets—with $ACA and $DEGO printing only 2 out of 12—signals a lack of institutional bid support and deep oversold conditions on RSI indicators. MACD momentum remains firmly in bearish territory, suggesting further downside risk unless volume spikes significantly to reclaim key moving averages.
Market participants are rotating away from speculative altcoins, with no clear narrative strength emerging as capital flees to safety. The lack of sector-specific resilience underscores a broader risk-off environment where even established DeFi and infrastructure tokens are facing heavy liquidation.
Key levels to watch include Bitcoin dominance, which must stabilize to prevent further altcoin bleeding; a breach below current support levels for these top movers would confirm a deeper structural breakdown. Traders should prioritize capital preservation and avoid catching falling knives, as the current volatility poses a high risk of further liquidity traps.
━━━━━━━━━━━━━━━━━
#A2Z #MarketResearch #CryptoAnalysis
🔔 Follow for daily market research & signals!
ACAUS0.00%
13
📰 Market Research — $ACT
━━━━━━━━━━━━━━━━━
### MARKET OVERVIEW
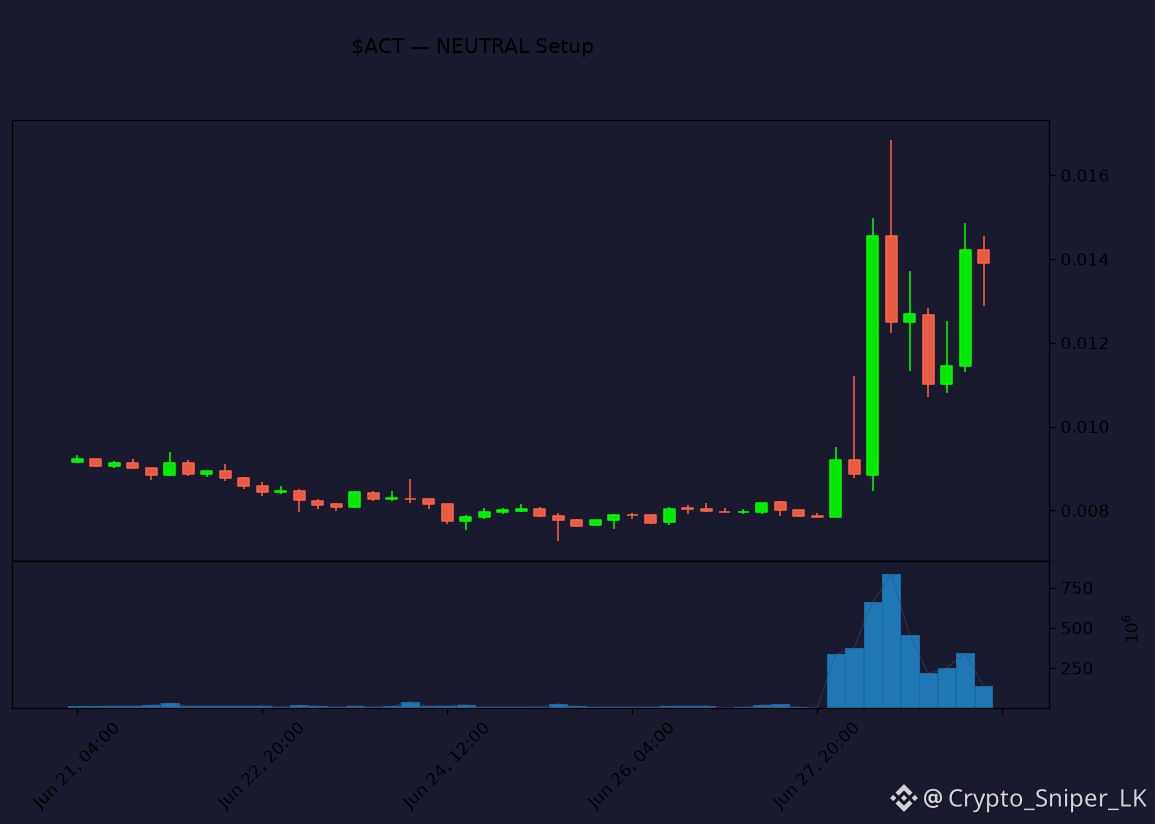
The crypto market is currently experiencing extreme volatility characterized by aggressive sell-side pressure across the altcoin spectrum, contrasted by isolated pockets of speculative strength. Total trading volume for the top movers remains elevated compared to historical averages, signaling a period of intense retail liquidation and high-stakes price discovery.
### TOP MOVERS DEEP DIVE
$ACT leads the market with a 60.51% gain, showing a strong 4H net change of +69.72% and maintaining a critical support level at $0.010, though it faces stiff resistance near $0.020. Conversely, $ATA and $A2Z are undergoing severe corrections, with $ATA dropping 53.85% and $A2Z falling 53.85% as both assets struggle to find a floor after breaking key support levels. The 4H candles for $ATA and $A2Z show heavy bearish dominance with high volume, suggesting a capitulation phase where selling pressure is significantly outpacing buying interest. Technical indicators on the 4H timeframe for $ACT suggest an overextended RSI, while the moving averages for $ATA and $A2Z remain in a bearish alignment, confirming a lack of immediate trend reversal potential.
### SECTOR & NARRATIVE ANALYSIS
The market is currently witnessing a violent rotation away from small-cap altcoins, with liquidity being sucked out of legacy projects into high-beta speculative plays. This trend highlights a broader narrative of "risk-off" sentiment, where traders are abandoning stagnant assets in favor of extreme volatility or exiting to stablecoin positions entirely.
### KEY LEVELS TO WATCH
Investors should monitor the $0.010 support level for $ACT, as a breach here would likely invalidate the current bullish momentum and trigger a deeper retrace. Conversely, a sustained move above the $0.020...
━━━━━━━━━━━━━━━━━
#ACT #MarketResearch #CryptoAnalysis
🔔 Follow for daily market research & signals!
📰 Market Research — $ACT
━━━━━━━━━━━━━━━━━
### MARKET OVERVIEW
The crypto market is currently experiencing extreme volatility characterized by aggressive sell-side pressure across the altcoin spectrum, contrasted by isolated pockets of speculative strength. Total trading volume for the top movers remains elevated compared to historical averages, signaling a period of intense retail liquidation and high-stakes price discovery.
### TOP MOVERS DEEP DIVE
$ACT leads the market with a 60.51% gain, showing a strong 4H net change of +69.72% and maintaining a critical support level at $0.010, though it faces stiff resistance near $0.020. Conversely, $ATA and $A2Z are undergoing severe corrections, with $ATA dropping 53.85% and $A2Z falling 53.85% as both assets struggle to find a floor after breaking key support levels. The 4H candles for $ATA and $A2Z show heavy bearish dominance with high volume, suggesting a capitulation phase where selling pressure is significantly outpacing buying interest. Technical indicators on the 4H timeframe for $ACT suggest an overextended RSI, while the moving averages for $ATA and $A2Z remain in a bearish alignment, confirming a lack of immediate trend reversal potential.
### SECTOR & NARRATIVE ANALYSIS
The market is currently witnessing a violent rotation away from small-cap altcoins, with liquidity being sucked out of legacy projects into high-beta speculative plays. This trend highlights a broader narrative of "risk-off" sentiment, where traders are abandoning stagnant assets in favor of extreme volatility or exiting to stablecoin positions entirely.
### KEY LEVELS TO WATCH
Investors should monitor the $0.010 support level for $ACT , as a breach here would likely invalidate the current bullish momentum and trigger a deeper retrace. Conversely, a sustained move above the $0.020...
━━━━━━━━━━━━━━━━━
#ACT #MarketResearch #CryptoAnalysis
🔔 Follow for daily market research & signals!
━━━━━━━━━━━━━━━━━
### MARKET OVERVIEW
The crypto market is currently experiencing extreme volatility characterized by aggressive sell-side pressure across the altcoin spectrum, contrasted by isolated pockets of speculative strength. Total trading volume for the top movers remains elevated compared to historical averages, signaling a period of intense retail liquidation and high-stakes price discovery.
### TOP MOVERS DEEP DIVE
$ACT leads the market with a 60.51% gain, showing a strong 4H net change of +69.72% and maintaining a critical support level at $0.010, though it faces stiff resistance near $0.020. Conversely, $ATA and $A2Z are undergoing severe corrections, with $ATA dropping 53.85% and $A2Z falling 53.85% as both assets struggle to find a floor after breaking key support levels. The 4H candles for $ATA and $A2Z show heavy bearish dominance with high volume, suggesting a capitulation phase where selling pressure is significantly outpacing buying interest. Technical indicators on the 4H timeframe for $ACT suggest an overextended RSI, while the moving averages for $ATA and $A2Z remain in a bearish alignment, confirming a lack of immediate trend reversal potential.
### SECTOR & NARRATIVE ANALYSIS
The market is currently witnessing a violent rotation away from small-cap altcoins, with liquidity being sucked out of legacy projects into high-beta speculative plays. This trend highlights a broader narrative of "risk-off" sentiment, where traders are abandoning stagnant assets in favor of extreme volatility or exiting to stablecoin positions entirely.
### KEY LEVELS TO WATCH
Investors should monitor the $0.010 support level for $ACT , as a breach here would likely invalidate the current bullish momentum and trigger a deeper retrace. Conversely, a sustained move above the $0.020...
━━━━━━━━━━━━━━━━━
#ACT #MarketResearch #CryptoAnalysis
🔔 Follow for daily market research & signals!
10
📰 Market Research — $SXP
━━━━━━━━━━━━━━━━━
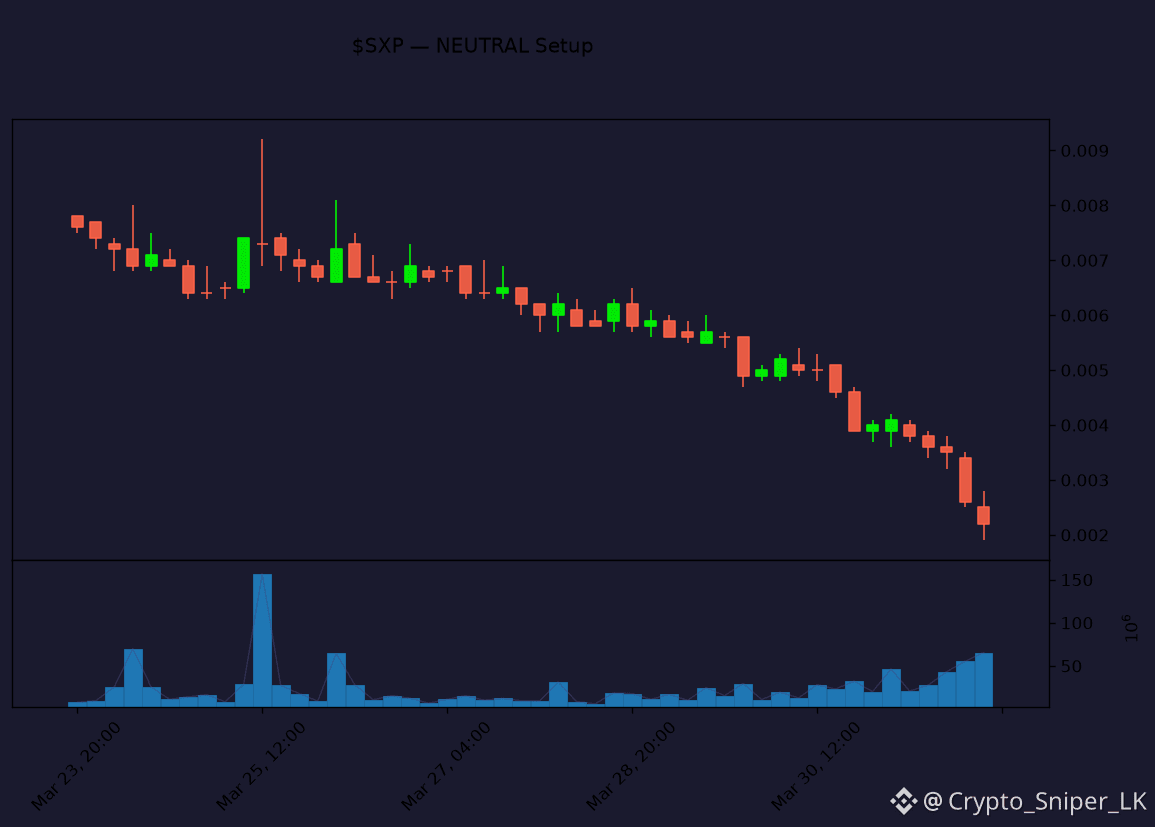
The crypto market is currently experiencing a severe liquidity contraction, characterized by aggressive sell-side pressure and a broad-based capitulation across low-cap assets. Total trading volume for the top movers remains significantly elevated compared to historical averages, signaling panic-driven exits rather than healthy profit-taking.
$SXP has collapsed 45% to $0.0022, with 4H charts showing a bearish breakdown below the $0.0042 resistance level and sustained selling volume. $COS follows a similar trajectory, down 41.08% to $0.000251, as the 4H structure reveals a consistent failure to hold support, with only 4 of the last 12 candles closing green. $HARD is down 40.25% to $0.0095, exhibiting extreme volatility with a 61.07% net decline over the last 48 hours, suggesting that buyers are currently absent. These assets are all trading well below their 20-period moving averages, with RSI levels deeply oversold yet failing to trigger a meaningful bounce. The lack of wick formation on the downside indicates that market participants are aggressively market-selling into thin order books.
The current rotation is heavily skewed toward capital flight from legacy altcoins, with no clear narrative strength emerging to offset the downward momentum. Investors are likely de-risking ahead of broader market volatility, abandoning small-cap DeFi and utility tokens in favor of cash or stablecoin positions.
Bitcoin dominance remains the primary metric to watch, as any further consolidation in BTC will likely exacerbate the bleed in these high-beta assets. A sustained reclaim of the $0.0042 level for $SXP would be required to invalidate the current bearish structure and suggest a potential bottoming process.
Traders should prioritize capital preservation by avoiding...
━━━━━━━━━━━━━━━━━
#SXP #MarketResearch #CryptoAnalysis
🔔 Follow for daily market research & signals!
📰 Market Research — $SXP
━━━━━━━━━━━━━━━━━
The crypto market is currently experiencing a severe liquidity contraction, characterized by aggressive sell-side pressure and a broad-based capitulation across low-cap assets. Total trading volume for the top movers remains significantly elevated compared to historical averages, signaling panic-driven exits rather than healthy profit-taking.
$SXP has collapsed 45% to $0.0022, with 4H charts showing a bearish breakdown below the $0.0042 resistance level and sustained selling volume. $COS follows a similar trajectory, down 41.08% to $0.000251, as the 4H structure reveals a consistent failure to hold support, with only 4 of the last 12 candles closing green. $HARD is down 40.25% to $0.0095, exhibiting extreme volatility with a 61.07% net decline over the last 48 hours, suggesting that buyers are currently absent. These assets are all trading well below their 20-period moving averages, with RSI levels deeply oversold yet failing to trigger a meaningful bounce. The lack of wick formation on the downside indicates that market participants are aggressively market-selling into thin order books.
The current rotation is heavily skewed toward capital flight from legacy altcoins, with no clear narrative strength emerging to offset the downward momentum. Investors are likely de-risking ahead of broader market volatility, abandoning small-cap DeFi and utility tokens in favor of cash or stablecoin positions.
Bitcoin dominance remains the primary metric to watch, as any further consolidation in BTC will likely exacerbate the bleed in these high-beta assets. A sustained reclaim of the $0.0042 level for $SXP would be required to invalidate the current bearish structure and suggest a potential bottoming process.
Traders should prioritize capital preservation by avoiding...
━━━━━━━━━━━━━━━━━
#SXP #MarketResearch #CryptoAnalysis
🔔 Follow for daily market research & signals!
━━━━━━━━━━━━━━━━━
The crypto market is currently experiencing a severe liquidity contraction, characterized by aggressive sell-side pressure and a broad-based capitulation across low-cap assets. Total trading volume for the top movers remains significantly elevated compared to historical averages, signaling panic-driven exits rather than healthy profit-taking.
$SXP has collapsed 45% to $0.0022, with 4H charts showing a bearish breakdown below the $0.0042 resistance level and sustained selling volume. $COS follows a similar trajectory, down 41.08% to $0.000251, as the 4H structure reveals a consistent failure to hold support, with only 4 of the last 12 candles closing green. $HARD is down 40.25% to $0.0095, exhibiting extreme volatility with a 61.07% net decline over the last 48 hours, suggesting that buyers are currently absent. These assets are all trading well below their 20-period moving averages, with RSI levels deeply oversold yet failing to trigger a meaningful bounce. The lack of wick formation on the downside indicates that market participants are aggressively market-selling into thin order books.
The current rotation is heavily skewed toward capital flight from legacy altcoins, with no clear narrative strength emerging to offset the downward momentum. Investors are likely de-risking ahead of broader market volatility, abandoning small-cap DeFi and utility tokens in favor of cash or stablecoin positions.
Bitcoin dominance remains the primary metric to watch, as any further consolidation in BTC will likely exacerbate the bleed in these high-beta assets. A sustained reclaim of the $0.0042 level for $SXP would be required to invalidate the current bearish structure and suggest a potential bottoming process.
Traders should prioritize capital preservation by avoiding...
━━━━━━━━━━━━━━━━━
#SXP #MarketResearch #CryptoAnalysis
🔔 Follow for daily market research & signals!
HARDETF+0.00%
5
📰 Market Research — $HARD
━━━━━━━━━━━━━━━━━
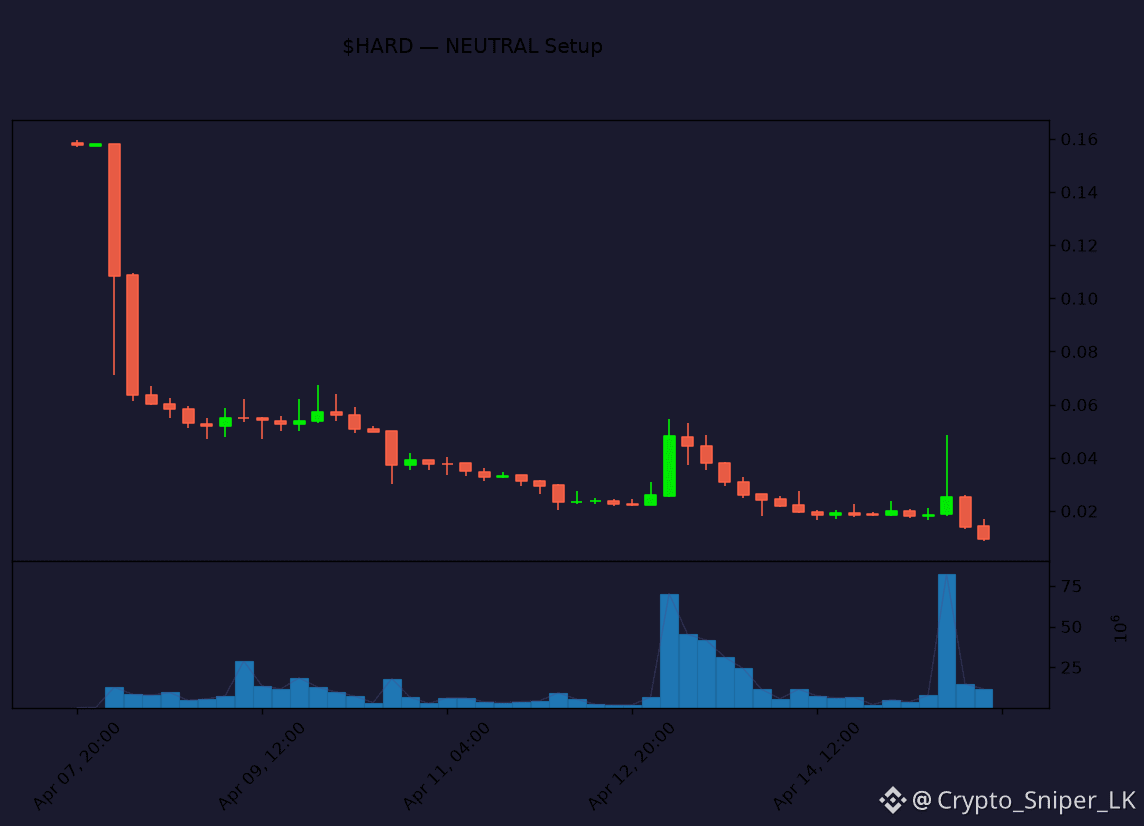
The cryptocurrency market is currently experiencing a severe liquidity contraction, characterized by broad-based capitulation across low-cap assets and a significant decline in total daily volume. Sentiment remains deeply bearish as retail-heavy tokens face aggressive sell-side pressure, signaling a flight to safety among market participants.
$HARD, $DENT, and $MBOX are leading the downside, each posting losses exceeding 34% as 4H charts reveal a series of lower lows with minimal buying interest. $HARD is testing critical support at $0.0088, while $DENT and $MBOX show persistent bearish engulfing patterns on the 4H timeframe, suggesting further exhaustion. Volume profiles for these assets are heavily skewed toward selling pressure, with RSI levels firmly entrenched in oversold territory without signs of bullish divergence. The MACD histograms remain deeply negative, confirming that momentum is currently favoring sellers across all three pairs.
The market is witnessing a violent rotation out of speculative altcoins and legacy GameFi/DeFi projects, with no clear sector rotation to safe havens yet. This exodus suggests a broader risk-off narrative where investors are liquidating positions regardless of underlying fundamental utility.
Traders should monitor Bitcoin dominance closely, as a breakout above current resistance could further exacerbate the liquidity drain from these altcoins. A reclaim of the $0.0159 level for $HARD would be required to invalidate the current bearish structure and suggest a potential stabilization.
Given the extreme volatility and lack of support, traders should prioritize capital preservation and avoid attempting to catch falling knives in these high-beta assets. Strict stop-loss management is non-negotiable, as the current lack of depth...
━━━━━━━━━━━━━━━━━
#HARD #MarketResearch #CryptoAnalysis
🔔 Follow for daily market research & signals!
📰 Market Research — $HARD
━━━━━━━━━━━━━━━━━
The cryptocurrency market is currently experiencing a severe liquidity contraction, characterized by broad-based capitulation across low-cap assets and a significant decline in total daily volume. Sentiment remains deeply bearish as retail-heavy tokens face aggressive sell-side pressure, signaling a flight to safety among market participants.
$HARD, $DENT, and $MBOX are leading the downside, each posting losses exceeding 34% as 4H charts reveal a series of lower lows with minimal buying interest. $HARD is testing critical support at $0.0088, while $DENT and $MBOX show persistent bearish engulfing patterns on the 4H timeframe, suggesting further exhaustion. Volume profiles for these assets are heavily skewed toward selling pressure, with RSI levels firmly entrenched in oversold territory without signs of bullish divergence. The MACD histograms remain deeply negative, confirming that momentum is currently favoring sellers across all three pairs.
The market is witnessing a violent rotation out of speculative altcoins and legacy GameFi/DeFi projects, with no clear sector rotation to safe havens yet. This exodus suggests a broader risk-off narrative where investors are liquidating positions regardless of underlying fundamental utility.
Traders should monitor Bitcoin dominance closely, as a breakout above current resistance could further exacerbate the liquidity drain from these altcoins. A reclaim of the $0.0159 level for $HARD would be required to invalidate the current bearish structure and suggest a potential stabilization.
Given the extreme volatility and lack of support, traders should prioritize capital preservation and avoid attempting to catch falling knives in these high-beta assets. Strict stop-loss management is non-negotiable, as the current lack of depth...
━━━━━━━━━━━━━━━━━
#HARD #MarketResearch #CryptoAnalysis
🔔 Follow for daily market research & signals!
━━━━━━━━━━━━━━━━━
The cryptocurrency market is currently experiencing a severe liquidity contraction, characterized by broad-based capitulation across low-cap assets and a significant decline in total daily volume. Sentiment remains deeply bearish as retail-heavy tokens face aggressive sell-side pressure, signaling a flight to safety among market participants.
$HARD, $DENT, and $MBOX are leading the downside, each posting losses exceeding 34% as 4H charts reveal a series of lower lows with minimal buying interest. $HARD is testing critical support at $0.0088, while $DENT and $MBOX show persistent bearish engulfing patterns on the 4H timeframe, suggesting further exhaustion. Volume profiles for these assets are heavily skewed toward selling pressure, with RSI levels firmly entrenched in oversold territory without signs of bullish divergence. The MACD histograms remain deeply negative, confirming that momentum is currently favoring sellers across all three pairs.
The market is witnessing a violent rotation out of speculative altcoins and legacy GameFi/DeFi projects, with no clear sector rotation to safe havens yet. This exodus suggests a broader risk-off narrative where investors are liquidating positions regardless of underlying fundamental utility.
Traders should monitor Bitcoin dominance closely, as a breakout above current resistance could further exacerbate the liquidity drain from these altcoins. A reclaim of the $0.0159 level for $HARD would be required to invalidate the current bearish structure and suggest a potential stabilization.
Given the extreme volatility and lack of support, traders should prioritize capital preservation and avoid attempting to catch falling knives in these high-beta assets. Strict stop-loss management is non-negotiable, as the current lack of depth...
━━━━━━━━━━━━━━━━━
#HARD #MarketResearch #CryptoAnalysis
🔔 Follow for daily market research & signals!
HARDETF+0.00%
1
20

A balanced view of $SHELL requires more than watching its latest price candle.
Recent observations point to several different developments: MyShell’s public communication has continued to highlight AI Art, the token has experienced a sharp rally followed by a pullback, derivatives activity remains substantial, and broader market sentiment has been weak.
These factors describe different parts of the ecosystem. None should be treated as a complete explanation on its own.
For longer-term research, the most useful questions remain whether MyShell can expand real product usage, sustain creator participation, and develop meaningful utility while managing token supply and market risks.
Research is more valuable when it separates confirmed information from interpretation.
#MyShell #MarketResearch #CryptoEducation
A balanced view of $SHELL requires more than watching its latest price candle.
Recent observations point to several different developments: MyShell’s public communication has continued to highlight AI Art, the token has experienced a sharp rally followed by a pullback, derivatives activity remains substantial, and broader market sentiment has been weak.
These factors describe different parts of the ecosystem. None should be treated as a complete explanation on its own.
For longer-term research, the most useful questions remain whether MyShell can expand real product usage, sustain creator participation, and develop meaningful utility while managing token supply and market risks.
Research is more valuable when it separates confirmed information from interpretation.
#MyShell #MarketResearch #CryptoEducation
Recent observations point to several different developments: MyShell’s public communication has continued to highlight AI Art, the token has experienced a sharp rally followed by a pullback, derivatives activity remains substantial, and broader market sentiment has been weak.
These factors describe different parts of the ecosystem. None should be treated as a complete explanation on its own.
For longer-term research, the most useful questions remain whether MyShell can expand real product usage, sustain creator participation, and develop meaningful utility while managing token supply and market risks.
Research is more valuable when it separates confirmed information from interpretation.
#MyShell #MarketResearch #CryptoEducation

227

The strongest tape combines performance, participation, and follow-through.
Stocks — Top Performance & Trend:
$META | $CVX | $WMT | LLY | UBER | JPM | XOM | BAC | DIS | AAPL
WPO Read:
Meta Platforms leads the liquid universe at +2.90% in the latest monitored session and +0.58% across the five-session sample. 5 of the top 5 names are positive, so breadth is broad. Leadership is shared across the top group; volume is 1.3x its recent pace.
Momentum can reverse quickly, so confirmation matters more than excitement.
#wpo_report #USStocks #MarketResearch
The strongest tape combines performance, participation, and follow-through.
Stocks — Top Performance & Trend:
$META | $CVX | $WMT | LLY | UBER | JPM | XOM | BAC | DIS | AAPL
WPO Read:
Meta Platforms leads the liquid universe at +2.90% in the latest monitored session and +0.58% across the five-session sample. 5 of the top 5 names are positive, so breadth is broad. Leadership is shared across the top group; volume is 1.3x its recent pace.
Momentum can reverse quickly, so confirmation matters more than excitement.
#wpo_report #USStocks #MarketResearch
Stocks — Top Performance & Trend:
$META | $CVX | $WMT | LLY | UBER | JPM | XOM | BAC | DIS | AAPL
WPO Read:
Meta Platforms leads the liquid universe at +2.90% in the latest monitored session and +0.58% across the five-session sample. 5 of the top 5 names are positive, so breadth is broad. Leadership is shared across the top group; volume is 1.3x its recent pace.
Momentum can reverse quickly, so confirmation matters more than excitement.
#wpo_report #USStocks #MarketResearch
213
Momentum deserves attention when multiple timeframes point together.
Stocks — Top Performance & Trend:
$ARM | $MU | $AMD | SMCI | INTC | ORCL | RDDT | AVGO | HOOD | TSLA
WPO Read:
Arm leads the liquid universe at +12.1% in the latest monitored session and +20.7% across the five-session sample. 5 of the top 5 names are positive, so breadth is broad. Leadership is shared across the top group; volume is 0.9x its recent pace.
Compare the move with company news and the wider market before acting.
#wpo_report #USStocks #MarketResearch
Momentum deserves attention when multiple timeframes point together.
Stocks — Top Performance & Trend:
$ARM | $MU | $AMD | SMCI | INTC | ORCL | RDDT | AVGO | HOOD | TSLA
WPO Read:
Arm leads the liquid universe at +12.1% in the latest monitored session and +20.7% across the five-session sample. 5 of the top 5 names are positive, so breadth is broad. Leadership is shared across the top group; volume is 0.9x its recent pace.
Compare the move with company news and the wider market before acting.
#wpo_report #USStocks #MarketResearch
Stocks — Top Performance & Trend:
$ARM | $MU | $AMD | SMCI | INTC | ORCL | RDDT | AVGO | HOOD | TSLA
WPO Read:
Arm leads the liquid universe at +12.1% in the latest monitored session and +20.7% across the five-session sample. 5 of the top 5 names are positive, so breadth is broad. Leadership is shared across the top group; volume is 0.9x its recent pace.
Compare the move with company news and the wider market before acting.
#wpo_report #USStocks #MarketResearch
2
397
The strongest tape combines performance, participation, and follow-through.
Stocks — Top Performance & Trend:
$AMD | $INTC | $SMCI | SHOP | HOOD | NVDA | TSLA | ARM | RDDT | GOOGL
WPO Read:
AMD leads the liquid universe at +11.0% in the latest monitored session and -11.5% across the five-session sample. 5 of the top 5 names are positive, so breadth is broad. Leadership is shared across the top group; volume is 1.1x its recent pace.
Momentum can reverse quickly, so confirmation matters more than excitement.
#wpo_report #USStocks #MarketResearch
The strongest tape combines performance, participation, and follow-through.
Stocks — Top Performance & Trend:
$AMD | $INTC | $SMCI | SHOP | HOOD | NVDA | TSLA | ARM | RDDT | GOOGL
WPO Read:
AMD leads the liquid universe at +11.0% in the latest monitored session and -11.5% across the five-session sample. 5 of the top 5 names are positive, so breadth is broad. Leadership is shared across the top group; volume is 1.1x its recent pace.
Momentum can reverse quickly, so confirmation matters more than excitement.
#wpo_report #USStocks #MarketResearch
Stocks — Top Performance & Trend:
$AMD | $INTC | $SMCI | SHOP | HOOD | NVDA | TSLA | ARM | RDDT | GOOGL
WPO Read:
AMD leads the liquid universe at +11.0% in the latest monitored session and -11.5% across the five-session sample. 5 of the top 5 names are positive, so breadth is broad. Leadership is shared across the top group; volume is 1.1x its recent pace.
Momentum can reverse quickly, so confirmation matters more than excitement.
#wpo_report #USStocks #MarketResearch
1
272

·
--
Why Do Many Cryptocurrencies Rise and Fall Together? 🔗
A coin can have its own technology, community, and use case — yet its price may still move in the same direction as the wider crypto market.
One reason is market correlation.
Several factors can influence this relationship:
📌 Bitcoin's market movements can affect overall sentiment.
📌 Investor risk appetite can influence demand across multiple assets.
📌 Shared market news can affect many projects simultaneously.
📌 Liquidity conditions can influence buying and selling across the sector.
But correlation does not mean two assets will always move together, and it does not prove that one causes the other's price movement.
Learning to distinguish individual project performance from broader market trends can improve market analysis.
💬 Question: When analyzing an altcoin, do you check its own fundamentals first or the overall market direction?
#CryptoAnalysis #Bitcoin #Altcoins #MarketResearch
Why Do Many Cryptocurrencies Rise and Fall Together? 🔗
A coin can have its own technology, community, and use case — yet its price may still move in the same direction as the wider crypto market.
One reason is market correlation.
Several factors can influence this relationship:
📌 Bitcoin's market movements can affect overall sentiment.
📌 Investor risk appetite can influence demand across multiple assets.
📌 Shared market news can affect many projects simultaneously.
📌 Liquidity conditions can influence buying and selling across the sector.
But correlation does not mean two assets will always move together, and it does not prove that one causes the other's price movement.
Learning to distinguish individual project performance from broader market trends can improve market analysis.
💬 Question: When analyzing an altcoin, do you check its own fundamentals first or the overall market direction?
#CryptoAnalysis #Bitcoin #Altcoins #MarketResearch
A coin can have its own technology, community, and use case — yet its price may still move in the same direction as the wider crypto market.
One reason is market correlation.
Several factors can influence this relationship:
📌 Bitcoin's market movements can affect overall sentiment.
📌 Investor risk appetite can influence demand across multiple assets.
📌 Shared market news can affect many projects simultaneously.
📌 Liquidity conditions can influence buying and selling across the sector.
But correlation does not mean two assets will always move together, and it does not prove that one causes the other's price movement.
Learning to distinguish individual project performance from broader market trends can improve market analysis.
💬 Question: When analyzing an altcoin, do you check its own fundamentals first or the overall market direction?
#CryptoAnalysis #Bitcoin #Altcoins #MarketResearch
60

·
--
Bullish
#earningsseason 📊 Earnings Season: The Ultimate Macro Stress Test for Crypto
Most retail traders view earnings season purely through a TradFi lens. But as crypto participants, we must treat it as a macro liquidity stress test. Mega-cap tech and financial reports dictate the broader risk appetite that directly fuels digital asset markets.
Here is what my research desk is tracking right now:
1️⃣ The Risk-On Pivot:
Tech earnings act as a proxy for enterprise health. Strong results signal a "risk-on" environment, pushing institutional capital down the risk curve into BTC and ETH. Missed guidance triggers a flight to safety. If tech rallies post-earnings, expect crypto beta to amplify.
2️⃣ Crypto-Native Equities:
Publicly traded crypto proxies are experiencing massive implied volatility. The options market is pricing in significant moves. Watch for the post-earnings "volatility crush" and identify where smart money is hedging their exposure.
3️⃣ Forward Guidance > Past Numbers:
Markets trade the future. A company might beat EPS, but weak forward guidance causes a dump. We are looking for macro commentary on interest rates and consumer spending to gauge Q4 capital flows.
The takeaway? Don't trade crypto in a vacuum. Earnings season provides the fundamental backdrop for liquidity. Are you trading the volatility, or stepping aside to let the dust settle?
How is earnings season impacting your positioning right now? Let me know below! 👇
This post is for educational and research purposes only. Not financial advice. Always DYOR and manage your risk.*
#EarningsSeason #CryptoTrading #Macro #Bitcoin #MarketResearch
$PHA $PROM $DGB
{spot}(DGBUSDT)
{future}(PROMUSDT)
{future}(PHAUSDT)
#earningsseason 📊 Earnings Season: The Ultimate Macro Stress Test for Crypto
Most retail traders view earnings season purely through a TradFi lens. But as crypto participants, we must treat it as a macro liquidity stress test. Mega-cap tech and financial reports dictate the broader risk appetite that directly fuels digital asset markets.
Here is what my research desk is tracking right now:
1️⃣ The Risk-On Pivot:
Tech earnings act as a proxy for enterprise health. Strong results signal a "risk-on" environment, pushing institutional capital down the risk curve into BTC and ETH. Missed guidance triggers a flight to safety. If tech rallies post-earnings, expect crypto beta to amplify.
2️⃣ Crypto-Native Equities:
Publicly traded crypto proxies are experiencing massive implied volatility. The options market is pricing in significant moves. Watch for the post-earnings "volatility crush" and identify where smart money is hedging their exposure.
3️⃣ Forward Guidance > Past Numbers:
Markets trade the future. A company might beat EPS, but weak forward guidance causes a dump. We are looking for macro commentary on interest rates and consumer spending to gauge Q4 capital flows.
The takeaway? Don't trade crypto in a vacuum. Earnings season provides the fundamental backdrop for liquidity. Are you trading the volatility, or stepping aside to let the dust settle?
How is earnings season impacting your positioning right now? Let me know below! 👇
This post is for educational and research purposes only. Not financial advice. Always DYOR and manage your risk.*
#EarningsSeason #CryptoTrading #Macro #Bitcoin #MarketResearch
$PHA $PROM $DGB
Most retail traders view earnings season purely through a TradFi lens. But as crypto participants, we must treat it as a macro liquidity stress test. Mega-cap tech and financial reports dictate the broader risk appetite that directly fuels digital asset markets.
Here is what my research desk is tracking right now:
1️⃣ The Risk-On Pivot:
Tech earnings act as a proxy for enterprise health. Strong results signal a "risk-on" environment, pushing institutional capital down the risk curve into BTC and ETH. Missed guidance triggers a flight to safety. If tech rallies post-earnings, expect crypto beta to amplify.
2️⃣ Crypto-Native Equities:
Publicly traded crypto proxies are experiencing massive implied volatility. The options market is pricing in significant moves. Watch for the post-earnings "volatility crush" and identify where smart money is hedging their exposure.
3️⃣ Forward Guidance > Past Numbers:
Markets trade the future. A company might beat EPS, but weak forward guidance causes a dump. We are looking for macro commentary on interest rates and consumer spending to gauge Q4 capital flows.
The takeaway? Don't trade crypto in a vacuum. Earnings season provides the fundamental backdrop for liquidity. Are you trading the volatility, or stepping aside to let the dust settle?
How is earnings season impacting your positioning right now? Let me know below! 👇
This post is for educational and research purposes only. Not financial advice. Always DYOR and manage your risk.*
#EarningsSeason #CryptoTrading #Macro #Bitcoin #MarketResearch
$PHA $PROM $DGB

7.1k
·
--
Bullish
#earningsseason We’re deep into earnings season, and if you’re only looking at crypto charts, you’re missing half the picture. As a market researcher, I’m seeing a tight correlation between TradFi mega-cap earnings and crypto liquidity. Here’s what the smart money is actually watching. 📊
First, Tech & AI bellwethers. Crypto is still heavily tethered to the Nasdaq’s risk appetite. When major semiconductor giants report, they dictate global "risk-on" sentiment. A beat means excess capital flows down the risk curve into digital assets. A miss? Expect immediate altcoin volatility.
Second, the financials. Bank earnings give a real-time read on credit conditions. Crypto thrives on cheap liquidity. If financials show tightening credit, it signals a restrictive macro environment, acting as a headwind for broad market rallies.
Finally, watch crypto-native proxies. Companies with heavy BTC treasuries or exchange revenues act as leveraged bets on the ecosystem. Their forward guidance often reveals institutional adoption trends much faster than spot ETF flows. 💡
My takeaway? Don't trade in a vacuum. Use earnings week to gauge institutional risk appetite. If TradFi flashes green, crypto usually follows. If it flashes red, tighten your stops and respect the macro headwinds.
This is market research and personal observation, not financial advice. Always DYOR and manage your risk properly.
#EarningsSeason #CryptoMarket #Bitcoin #BTC #Altcoins #MacroEconomics #CryptoTrading #RiskManagement #BinanceSquare #MarketResearch
$IOST $BMT $PARTI
{future}(PARTIUSDT)
{future}(BMTUSDT)
{future}(IOSTUSDT)
#earningsseason We’re deep into earnings season, and if you’re only looking at crypto charts, you’re missing half the picture. As a market researcher, I’m seeing a tight correlation between TradFi mega-cap earnings and crypto liquidity. Here’s what the smart money is actually watching. 📊
First, Tech & AI bellwethers. Crypto is still heavily tethered to the Nasdaq’s risk appetite. When major semiconductor giants report, they dictate global "risk-on" sentiment. A beat means excess capital flows down the risk curve into digital assets. A miss? Expect immediate altcoin volatility.
Second, the financials. Bank earnings give a real-time read on credit conditions. Crypto thrives on cheap liquidity. If financials show tightening credit, it signals a restrictive macro environment, acting as a headwind for broad market rallies.
Finally, watch crypto-native proxies. Companies with heavy BTC treasuries or exchange revenues act as leveraged bets on the ecosystem. Their forward guidance often reveals institutional adoption trends much faster than spot ETF flows. 💡
My takeaway? Don't trade in a vacuum. Use earnings week to gauge institutional risk appetite. If TradFi flashes green, crypto usually follows. If it flashes red, tighten your stops and respect the macro headwinds.
This is market research and personal observation, not financial advice. Always DYOR and manage your risk properly.
#EarningsSeason #CryptoMarket #Bitcoin #BTC #Altcoins #MacroEconomics #CryptoTrading #RiskManagement #BinanceSquare #MarketResearch
$IOST $BMT $PARTI
First, Tech & AI bellwethers. Crypto is still heavily tethered to the Nasdaq’s risk appetite. When major semiconductor giants report, they dictate global "risk-on" sentiment. A beat means excess capital flows down the risk curve into digital assets. A miss? Expect immediate altcoin volatility.
Second, the financials. Bank earnings give a real-time read on credit conditions. Crypto thrives on cheap liquidity. If financials show tightening credit, it signals a restrictive macro environment, acting as a headwind for broad market rallies.
Finally, watch crypto-native proxies. Companies with heavy BTC treasuries or exchange revenues act as leveraged bets on the ecosystem. Their forward guidance often reveals institutional adoption trends much faster than spot ETF flows. 💡
My takeaway? Don't trade in a vacuum. Use earnings week to gauge institutional risk appetite. If TradFi flashes green, crypto usually follows. If it flashes red, tighten your stops and respect the macro headwinds.
This is market research and personal observation, not financial advice. Always DYOR and manage your risk properly.
#EarningsSeason #CryptoMarket #Bitcoin #BTC #Altcoins #MacroEconomics #CryptoTrading #RiskManagement #BinanceSquare #MarketResearch
$IOST $BMT $PARTI

330
·
--
Bullish
#InjectiveSignsMoUToMakeKRW1ExclusiveWonSettlementAsset JPMorgan just dropped a note calling Bitcoin the best-performing asset class over the coming years. As a market research trader, my first reaction isn't to FOMO, but to deeply analyze the macro mechanics driving this massive institutional shift.
When a TradFi giant like JPM makes this call, it’s never about retail hype. It’s about the underlying math. We’re looking at a structural shift where BTC is increasingly viewed as a premier digital store of value and a robust hedge against fiat debasement. The fixed supply schedule combined with growing institutional allocation creates an asymmetric risk-reward profile that traditional equities or bonds simply can't match in the current macro environment.
However, as active traders, we need to separate the long-term thesis from short-term price action. "Best performing" doesn't mean "smoothest ride." Volatility remains the price of admission for this asymmetric upside. The real alpha lies in understanding institutional flow cycles and positioning accordingly, rather than just chasing green candles.
What’s your take? Are we entering a new phase of institutional dominance for BTC, or is this just another cyclical narrative? Let me know your macro outlook below. 👇
*Disclaimer: Market research and personal observation only, not financial advice. Always DYOR.*
#Bitcoin #JPMorgan #CryptoTrading #Macro #MarketResearch
$ALT $FOGO $PEPE
{alpha}(CT_195TMacq4TDUw5q8NFBwmbY4RLXvzvG5JTkvi)
{future}(FOGOUSDT)
{future}(ALTUSDT)
#InjectiveSignsMoUToMakeKRW1ExclusiveWonSettlementAsset JPMorgan just dropped a note calling Bitcoin the best-performing asset class over the coming years. As a market research trader, my first reaction isn't to FOMO, but to deeply analyze the macro mechanics driving this massive institutional shift.
When a TradFi giant like JPM makes this call, it’s never about retail hype. It’s about the underlying math. We’re looking at a structural shift where BTC is increasingly viewed as a premier digital store of value and a robust hedge against fiat debasement. The fixed supply schedule combined with growing institutional allocation creates an asymmetric risk-reward profile that traditional equities or bonds simply can't match in the current macro environment.
However, as active traders, we need to separate the long-term thesis from short-term price action. "Best performing" doesn't mean "smoothest ride." Volatility remains the price of admission for this asymmetric upside. The real alpha lies in understanding institutional flow cycles and positioning accordingly, rather than just chasing green candles.
What’s your take? Are we entering a new phase of institutional dominance for BTC, or is this just another cyclical narrative? Let me know your macro outlook below. 👇
*Disclaimer: Market research and personal observation only, not financial advice. Always DYOR.*
#Bitcoin #JPMorgan #CryptoTrading #Macro #MarketResearch
$ALT $FOGO $PEPE
When a TradFi giant like JPM makes this call, it’s never about retail hype. It’s about the underlying math. We’re looking at a structural shift where BTC is increasingly viewed as a premier digital store of value and a robust hedge against fiat debasement. The fixed supply schedule combined with growing institutional allocation creates an asymmetric risk-reward profile that traditional equities or bonds simply can't match in the current macro environment.
However, as active traders, we need to separate the long-term thesis from short-term price action. "Best performing" doesn't mean "smoothest ride." Volatility remains the price of admission for this asymmetric upside. The real alpha lies in understanding institutional flow cycles and positioning accordingly, rather than just chasing green candles.
What’s your take? Are we entering a new phase of institutional dominance for BTC, or is this just another cyclical narrative? Let me know your macro outlook below. 👇
*Disclaimer: Market research and personal observation only, not financial advice. Always DYOR.*
#Bitcoin #JPMorgan #CryptoTrading #Macro #MarketResearch
$ALT $FOGO $PEPE

1
699
·
--
Bullish
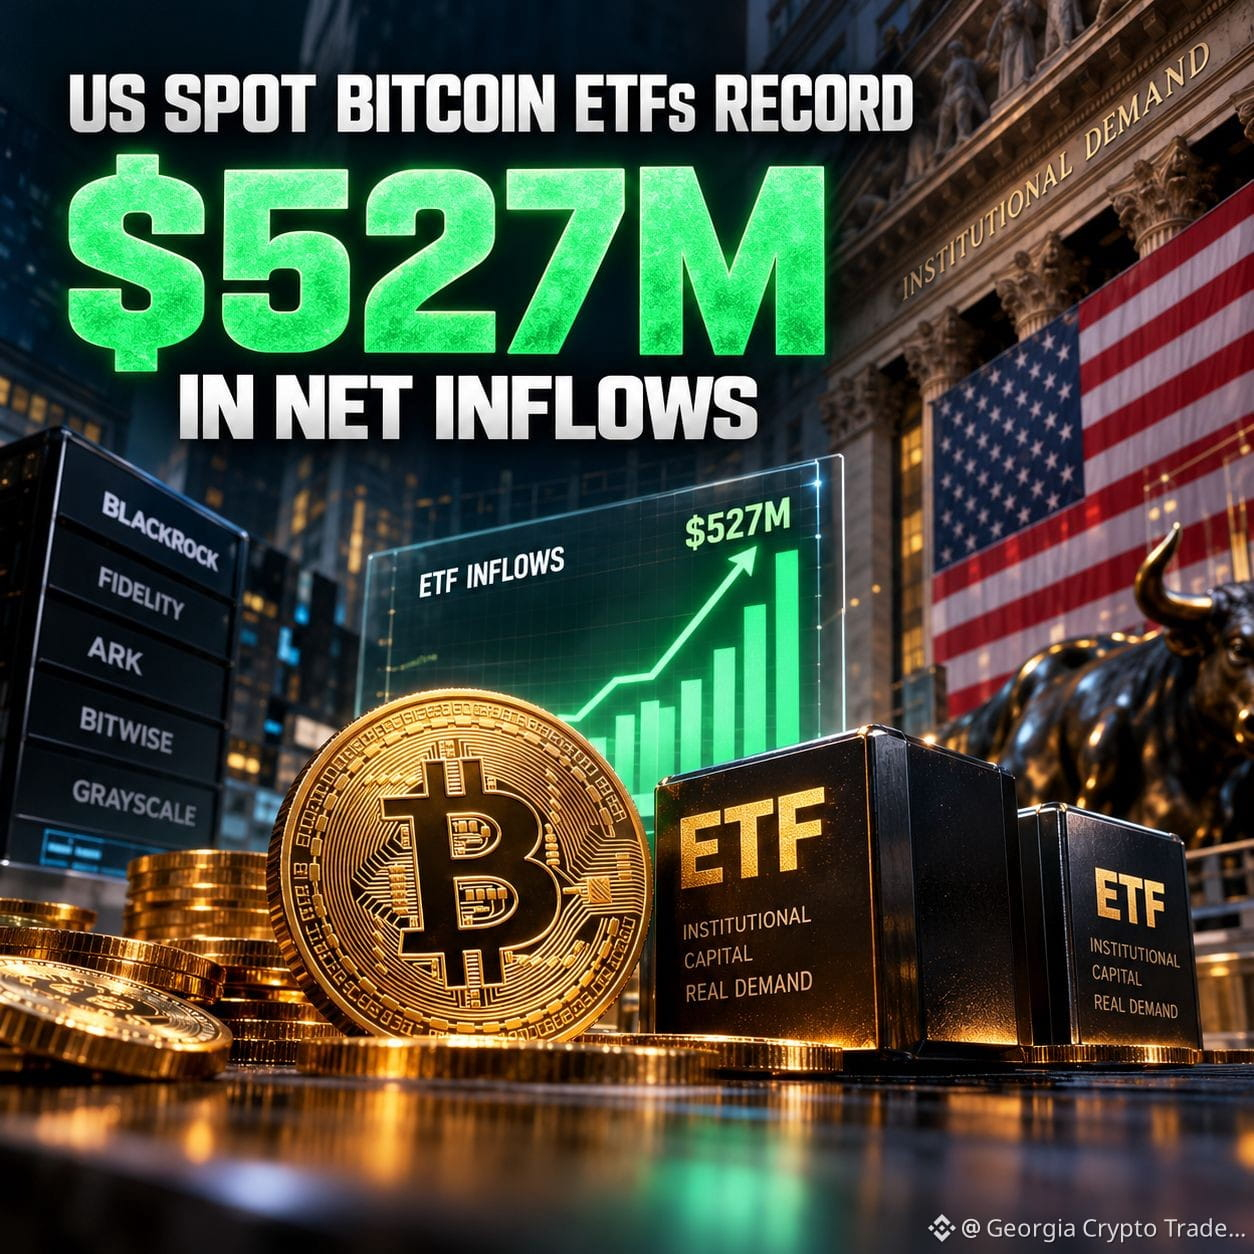
#USBitcoinETFsRecord$527MInflows 📊 Let’s look past the headlines and analyze the actual market structure. US Spot Bitcoin ETFs just recorded $527M in net inflows. While retail often chases daily price action, this data point reveals what TradFi is actually doing with liquidity.
This level of institutional absorption is quietly building a supply shock. The $527M represents a structural shift in accumulation. ETF issuers are acting as a massive bid, absorbing sell pressure that would otherwise hit the spot order books. We aren't seeing a parabolic retail frenzy; we are watching a methodical, price-insensitive accumulation phase.
However, as traders, we must maintain objective risk management. ETF inflows are a strong confirming indicator, but they don't override macro headwinds. If the DXY strengthens or global liquidity tightens, even heavy ETF buying can be temporarily absorbed by broader market selling. The key is tracking the trend of these flows over weeks, not just a single daily print.
From a research perspective, this signals that smart money views current levels as high-probability value zones, actively positioning for the next structural leg up in the cycle.
How are you interpreting this institutional bid in your current setups? Are you front-running the accumulation or waiting for macro confirmation? Let’s discuss below.
#Bitcoin #ETF #CryptoTrading #MarketResearch
$GNS $BMT $COMP
{future}(COMPUSDT)
{future}(BMTUSDT)
{spot}(GNSUSDT)
#USBitcoinETFsRecord$527MInflows 📊 Let’s look past the headlines and analyze the actual market structure. US Spot Bitcoin ETFs just recorded $527M in net inflows. While retail often chases daily price action, this data point reveals what TradFi is actually doing with liquidity.
This level of institutional absorption is quietly building a supply shock. The $527M represents a structural shift in accumulation. ETF issuers are acting as a massive bid, absorbing sell pressure that would otherwise hit the spot order books. We aren't seeing a parabolic retail frenzy; we are watching a methodical, price-insensitive accumulation phase.
However, as traders, we must maintain objective risk management. ETF inflows are a strong confirming indicator, but they don't override macro headwinds. If the DXY strengthens or global liquidity tightens, even heavy ETF buying can be temporarily absorbed by broader market selling. The key is tracking the trend of these flows over weeks, not just a single daily print.
From a research perspective, this signals that smart money views current levels as high-probability value zones, actively positioning for the next structural leg up in the cycle.
How are you interpreting this institutional bid in your current setups? Are you front-running the accumulation or waiting for macro confirmation? Let’s discuss below.
#Bitcoin #ETF #CryptoTrading #MarketResearch
$GNS $BMT $COMP
This level of institutional absorption is quietly building a supply shock. The $527M represents a structural shift in accumulation. ETF issuers are acting as a massive bid, absorbing sell pressure that would otherwise hit the spot order books. We aren't seeing a parabolic retail frenzy; we are watching a methodical, price-insensitive accumulation phase.
However, as traders, we must maintain objective risk management. ETF inflows are a strong confirming indicator, but they don't override macro headwinds. If the DXY strengthens or global liquidity tightens, even heavy ETF buying can be temporarily absorbed by broader market selling. The key is tracking the trend of these flows over weeks, not just a single daily print.
From a research perspective, this signals that smart money views current levels as high-probability value zones, actively positioning for the next structural leg up in the cycle.
How are you interpreting this institutional bid in your current setups? Are you front-running the accumulation or waiting for macro confirmation? Let’s discuss below.
#Bitcoin #ETF #CryptoTrading #MarketResearch
$GNS $BMT $COMP
1
460
·
--
Bullish
#earningsseason Q3 Earnings Season is in full swing. As crypto traders, we can’t just stare at charts. The correlation between TradFi earnings and crypto risk appetite is tighter than ever. Here’s my research breakdown on navigating this volatility. 🧵👇
1️⃣ The Tech Spillover
Big Tech earnings set the baseline for global risk appetite. When mega-caps beat and raise guidance, liquidity expands. This "risk-on" environment acts as a tailwind for high-beta assets like BTC. Watch forward guidance—narratives drive flows.
2️⃣ Crypto-Native Equities
Watch earnings from crypto-adjacent stocks (e.g., COIN, MSTR). Their revenue and user metrics are direct proxies for on-chain activity and institutional sentiment. A beat often precedes altcoin breakouts; a miss signals underlying weakness.
3️⃣ Macro & Liquidity
Earnings dictate future capex and hiring. Strong results can keep inflation sticky, altering the Fed's rate path. If Treasury yields spike post-earnings, expect crypto to face short-term liquidity headwinds.
💡 Trader’s Playbook:
Don't front-run the prints. Options IV is priced for perfection. Wait for the dust to settle, watch the initial algo reaction, and trade the secondary trend.
Which earnings report will move crypto the most this week? Let me know! 👇
⚠️ Disclaimer: Educational purposes only. Not financial advice. DYOR.
#earningsseason #CryptoTrading #MarketResearch
$REZ $ALT $WLD
{future}(WLDUSDT)
{future}(ALTUSDT)
{future}(REZUSDT)
#earningsseason Q3 Earnings Season is in full swing. As crypto traders, we can’t just stare at charts. The correlation between TradFi earnings and crypto risk appetite is tighter than ever. Here’s my research breakdown on navigating this volatility. 🧵👇
1️⃣ The Tech Spillover
Big Tech earnings set the baseline for global risk appetite. When mega-caps beat and raise guidance, liquidity expands. This "risk-on" environment acts as a tailwind for high-beta assets like BTC. Watch forward guidance—narratives drive flows.
2️⃣ Crypto-Native Equities
Watch earnings from crypto-adjacent stocks (e.g., COIN, MSTR). Their revenue and user metrics are direct proxies for on-chain activity and institutional sentiment. A beat often precedes altcoin breakouts; a miss signals underlying weakness.
3️⃣ Macro & Liquidity
Earnings dictate future capex and hiring. Strong results can keep inflation sticky, altering the Fed's rate path. If Treasury yields spike post-earnings, expect crypto to face short-term liquidity headwinds.
💡 Trader’s Playbook:
Don't front-run the prints. Options IV is priced for perfection. Wait for the dust to settle, watch the initial algo reaction, and trade the secondary trend.
Which earnings report will move crypto the most this week? Let me know! 👇
⚠️ Disclaimer: Educational purposes only. Not financial advice. DYOR.
#earningsseason #CryptoTrading #MarketResearch
$REZ $ALT $WLD
1️⃣ The Tech Spillover
Big Tech earnings set the baseline for global risk appetite. When mega-caps beat and raise guidance, liquidity expands. This "risk-on" environment acts as a tailwind for high-beta assets like BTC. Watch forward guidance—narratives drive flows.
2️⃣ Crypto-Native Equities
Watch earnings from crypto-adjacent stocks (e.g., COIN, MSTR). Their revenue and user metrics are direct proxies for on-chain activity and institutional sentiment. A beat often precedes altcoin breakouts; a miss signals underlying weakness.
3️⃣ Macro & Liquidity
Earnings dictate future capex and hiring. Strong results can keep inflation sticky, altering the Fed's rate path. If Treasury yields spike post-earnings, expect crypto to face short-term liquidity headwinds.
💡 Trader’s Playbook:
Don't front-run the prints. Options IV is priced for perfection. Wait for the dust to settle, watch the initial algo reaction, and trade the secondary trend.
Which earnings report will move crypto the most this week? Let me know! 👇
⚠️ Disclaimer: Educational purposes only. Not financial advice. DYOR.
#earningsseason #CryptoTrading #MarketResearch
$REZ $ALT $WLD

2
1
4
4.9k

·
--
Four projects. Four different milestones to watch.
$BAT — Growth in its digital advertising ecosystem
$CHZ — Sports and fan engagement adoption
$YFI— DeFi usage and token economics
$ZRX — Growth in decentralized trading infrastructure
Rather than guess exact future prices without checking current valuations, I would track three things for each project:
Is real usage increasing?
Is token demand improving?
Is the market valuation reasonable?
The strongest project is not necessarily the one with the biggest social media following.
Which one would you put at number one?
#CryptoCommunity #MarketResearch
Four projects. Four different milestones to watch.
$BAT — Growth in its digital advertising ecosystem
$CHZ — Sports and fan engagement adoption
$YFI— DeFi usage and token economics
$ZRX — Growth in decentralized trading infrastructure
Rather than guess exact future prices without checking current valuations, I would track three things for each project:
Is real usage increasing?
Is token demand improving?
Is the market valuation reasonable?
The strongest project is not necessarily the one with the biggest social media following.
Which one would you put at number one?
#CryptoCommunity #MarketResearch
$BAT — Growth in its digital advertising ecosystem
$CHZ — Sports and fan engagement adoption
$YFI— DeFi usage and token economics
$ZRX — Growth in decentralized trading infrastructure
Rather than guess exact future prices without checking current valuations, I would track three things for each project:
Is real usage increasing?
Is token demand improving?
Is the market valuation reasonable?
The strongest project is not necessarily the one with the biggest social media following.
Which one would you put at number one?
#CryptoCommunity #MarketResearch

484
📰 Market Research — $ACA
━━━━━━━━━━━━━━━━━
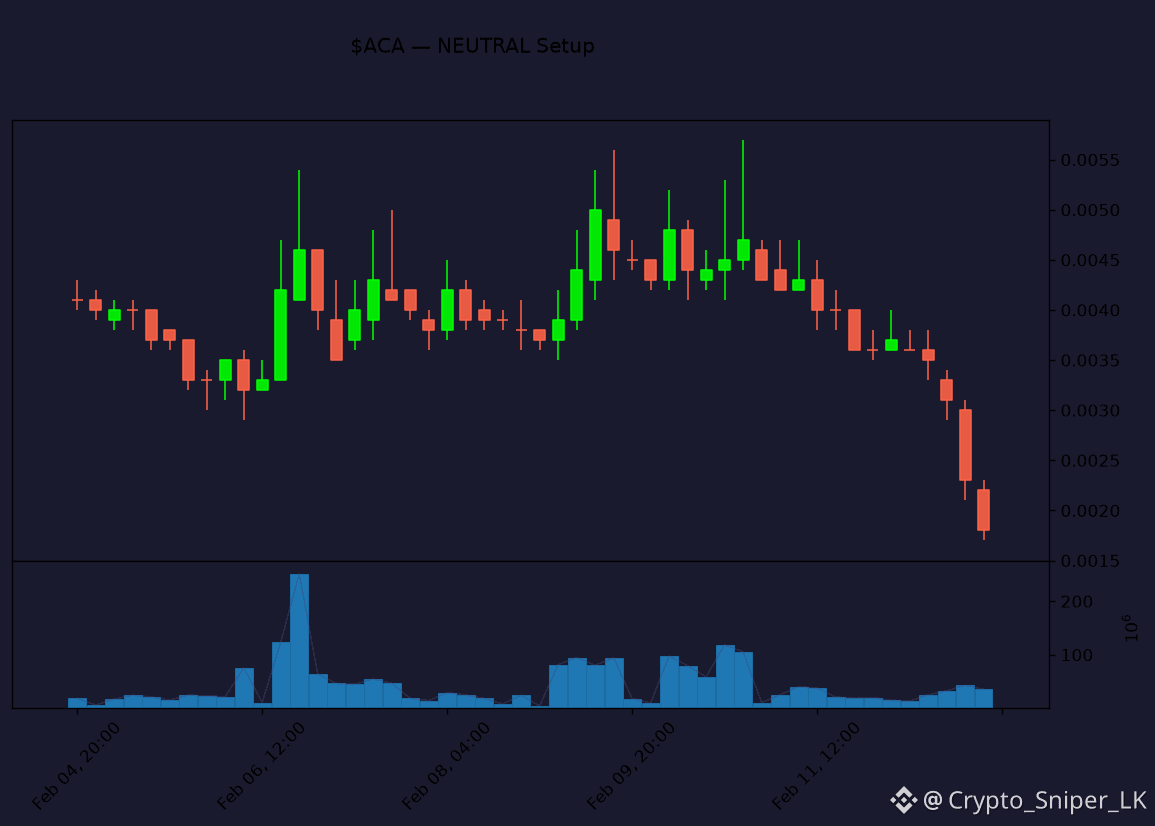
The crypto market is currently experiencing a severe liquidity contraction, characterized by aggressive sell-offs across low-cap assets and a significant deviation from average volume trends. Sentiment remains deeply bearish as speculative capital exits high-beta positions, leading to widespread capitulation.
$ACA is facing extreme downward pressure, with 4H data showing only 2 green candles out of 12 and a net decline of 59.09%, establishing a critical resistance at $0.0038. $DEGO is mirroring this weakness, trading near its 4H low of $0.024 with a bearish structure that suggests further downside if the $0.028 support fails to hold. Conversely, $PNT shows relative strength with 5 green candles in the last 48 hours, though it remains under pressure with a net 25.37% decline and a key resistance level at $0.07. Technical indicators across these assets reveal deeply oversold RSI levels, yet the lack of buying volume confirms that the current price action is driven by forced liquidation rather than accumulation. The consistent failure to reclaim moving averages on the 4H timeframe signals that these assets remain in a strong downtrend.
The current market rotation is heavily skewed toward capital preservation, as investors abandon legacy altcoins in favor of liquidating positions to mitigate further losses. No clear sector narrative is emerging, as the broad-based decline suggests a systemic liquidity drain rather than sector-specific rotation.
Traders should monitor Bitcoin dominance closely, as a breakout above current levels would likely exacerbate the bleeding in the altcoin market. A sustained close above $0.07 for $PNT or a reclaim of $0.0038 for $ACA would be required to invalidate the current bearish momentum.
Given the extreme volatility and low liquidity,...
━━━━━━━━━━━━━━━━━
#ACA #MarketResearch #CryptoAnalysis
🔔 Follow for daily market research & signals!
📰 Market Research — $ACA
━━━━━━━━━━━━━━━━━
The crypto market is currently experiencing a severe liquidity contraction, characterized by aggressive sell-offs across low-cap assets and a significant deviation from average volume trends. Sentiment remains deeply bearish as speculative capital exits high-beta positions, leading to widespread capitulation.
$ACA is facing extreme downward pressure, with 4H data showing only 2 green candles out of 12 and a net decline of 59.09%, establishing a critical resistance at $0.0038. $DEGO is mirroring this weakness, trading near its 4H low of $0.024 with a bearish structure that suggests further downside if the $0.028 support fails to hold. Conversely, $PNT shows relative strength with 5 green candles in the last 48 hours, though it remains under pressure with a net 25.37% decline and a key resistance level at $0.07. Technical indicators across these assets reveal deeply oversold RSI levels, yet the lack of buying volume confirms that the current price action is driven by forced liquidation rather than accumulation. The consistent failure to reclaim moving averages on the 4H timeframe signals that these assets remain in a strong downtrend.
The current market rotation is heavily skewed toward capital preservation, as investors abandon legacy altcoins in favor of liquidating positions to mitigate further losses. No clear sector narrative is emerging, as the broad-based decline suggests a systemic liquidity drain rather than sector-specific rotation.
Traders should monitor Bitcoin dominance closely, as a breakout above current levels would likely exacerbate the bleeding in the altcoin market. A sustained close above $0.07 for $PNT or a reclaim of $0.0038 for $ACA would be required to invalidate the current bearish momentum.
Given the extreme volatility and low liquidity,...
━━━━━━━━━━━━━━━━━
#ACA #MarketResearch #CryptoAnalysis
🔔 Follow for daily market research & signals!
━━━━━━━━━━━━━━━━━
The crypto market is currently experiencing a severe liquidity contraction, characterized by aggressive sell-offs across low-cap assets and a significant deviation from average volume trends. Sentiment remains deeply bearish as speculative capital exits high-beta positions, leading to widespread capitulation.
$ACA is facing extreme downward pressure, with 4H data showing only 2 green candles out of 12 and a net decline of 59.09%, establishing a critical resistance at $0.0038. $DEGO is mirroring this weakness, trading near its 4H low of $0.024 with a bearish structure that suggests further downside if the $0.028 support fails to hold. Conversely, $PNT shows relative strength with 5 green candles in the last 48 hours, though it remains under pressure with a net 25.37% decline and a key resistance level at $0.07. Technical indicators across these assets reveal deeply oversold RSI levels, yet the lack of buying volume confirms that the current price action is driven by forced liquidation rather than accumulation. The consistent failure to reclaim moving averages on the 4H timeframe signals that these assets remain in a strong downtrend.
The current market rotation is heavily skewed toward capital preservation, as investors abandon legacy altcoins in favor of liquidating positions to mitigate further losses. No clear sector narrative is emerging, as the broad-based decline suggests a systemic liquidity drain rather than sector-specific rotation.
Traders should monitor Bitcoin dominance closely, as a breakout above current levels would likely exacerbate the bleeding in the altcoin market. A sustained close above $0.07 for $PNT or a reclaim of $0.0038 for $ACA would be required to invalidate the current bearish momentum.
Given the extreme volatility and low liquidity,...
━━━━━━━━━━━━━━━━━
#ACA #MarketResearch #CryptoAnalysis
🔔 Follow for daily market research & signals!
ACAUS0.00%
1
📰 Market Research — $WTC
━━━━━━━━━━━━━━━━━
The crypto market is currently experiencing extreme volatility characterized by a massive sell-off in legacy altcoins, while total volume remains highly concentrated in speculative outliers. Sentiment is heavily skewed toward risk-off behavior, as evidenced by the sharp double-digit drawdowns across the majority of the top 10 movers.
$ACT leads the market with a 56.49% gain, showing strong 4H momentum with a net change of +66.06% and significant volume support at the $0.01 level. Conversely, $WTC and $ATA are undergoing severe liquidity drainage, with $WTC plummeting 56.54% and failing to hold support at $0.01, while $ATA’s 4H structure shows a bearish breakdown below $0.0012. Both $WTC and $ATA exhibit weak candle bodies and RSI divergence, suggesting that sellers remain in firm control. The 4H volume profiles for these laggards indicate exhaustion, yet the lack of buying interest at current lows signals further downside risk.
The market is witnessing a clear rotation away from older, low-liquidity projects toward high-beta speculative assets that can sustain localized volume. This shift highlights a lack of broad-market conviction, with capital flowing into isolated narratives rather than sector-wide growth.
Traders should monitor $ACT for a potential retest of the $0.0168 resistance, as a failure to hold this level would likely invalidate the current bullish trend. A sustained break below $0.01 for $WTC would confirm a continuation of the bearish trend, necessitating strict stop-loss placement.
Given the extreme volatility and liquidity gaps, participants should prioritize capital preservation and avoid catching falling knives in assets with deteriorating volume. Position sizing must be reduced to mitigate the risk of sudden, high-magnitude price swings in...
━━━━━━━━━━━━━━━━━
#WTC #MarketResearch #CryptoAnalysis
🔔 Follow for daily market research & signals!
📰 Market Research — $WTC
━━━━━━━━━━━━━━━━━
The crypto market is currently experiencing extreme volatility characterized by a massive sell-off in legacy altcoins, while total volume remains highly concentrated in speculative outliers. Sentiment is heavily skewed toward risk-off behavior, as evidenced by the sharp double-digit drawdowns across the majority of the top 10 movers.
$ACT leads the market with a 56.49% gain, showing strong 4H momentum with a net change of +66.06% and significant volume support at the $0.01 level. Conversely, $WTC and $ATA are undergoing severe liquidity drainage, with $WTC plummeting 56.54% and failing to hold support at $0.01, while $ATA’s 4H structure shows a bearish breakdown below $0.0012. Both $WTC and $ATA exhibit weak candle bodies and RSI divergence, suggesting that sellers remain in firm control. The 4H volume profiles for these laggards indicate exhaustion, yet the lack of buying interest at current lows signals further downside risk.
The market is witnessing a clear rotation away from older, low-liquidity projects toward high-beta speculative assets that can sustain localized volume. This shift highlights a lack of broad-market conviction, with capital flowing into isolated narratives rather than sector-wide growth.
Traders should monitor $ACT for a potential retest of the $0.0168 resistance, as a failure to hold this level would likely invalidate the current bullish trend. A sustained break below $0.01 for $WTC would confirm a continuation of the bearish trend, necessitating strict stop-loss placement.
Given the extreme volatility and liquidity gaps, participants should prioritize capital preservation and avoid catching falling knives in assets with deteriorating volume. Position sizing must be reduced to mitigate the risk of sudden, high-magnitude price swings in...
━━━━━━━━━━━━━━━━━
#WTC #MarketResearch #CryptoAnalysis
🔔 Follow for daily market research & signals!
━━━━━━━━━━━━━━━━━
The crypto market is currently experiencing extreme volatility characterized by a massive sell-off in legacy altcoins, while total volume remains highly concentrated in speculative outliers. Sentiment is heavily skewed toward risk-off behavior, as evidenced by the sharp double-digit drawdowns across the majority of the top 10 movers.
$ACT leads the market with a 56.49% gain, showing strong 4H momentum with a net change of +66.06% and significant volume support at the $0.01 level. Conversely, $WTC and $ATA are undergoing severe liquidity drainage, with $WTC plummeting 56.54% and failing to hold support at $0.01, while $ATA’s 4H structure shows a bearish breakdown below $0.0012. Both $WTC and $ATA exhibit weak candle bodies and RSI divergence, suggesting that sellers remain in firm control. The 4H volume profiles for these laggards indicate exhaustion, yet the lack of buying interest at current lows signals further downside risk.
The market is witnessing a clear rotation away from older, low-liquidity projects toward high-beta speculative assets that can sustain localized volume. This shift highlights a lack of broad-market conviction, with capital flowing into isolated narratives rather than sector-wide growth.
Traders should monitor $ACT for a potential retest of the $0.0168 resistance, as a failure to hold this level would likely invalidate the current bullish trend. A sustained break below $0.01 for $WTC would confirm a continuation of the bearish trend, necessitating strict stop-loss placement.
Given the extreme volatility and liquidity gaps, participants should prioritize capital preservation and avoid catching falling knives in assets with deteriorating volume. Position sizing must be reduced to mitigate the risk of sudden, high-magnitude price swings in...
━━━━━━━━━━━━━━━━━
#WTC #MarketResearch #CryptoAnalysis
🔔 Follow for daily market research & signals!
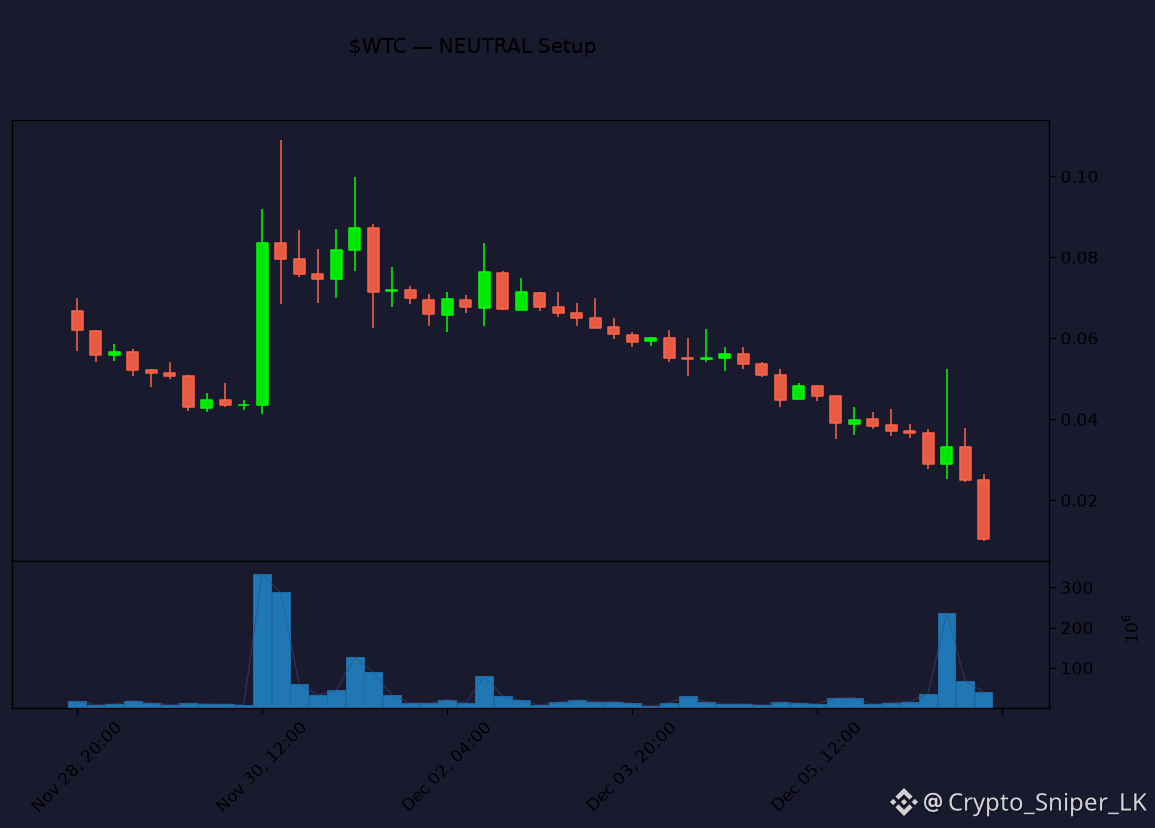
18

·
--
Bullish
🐕 **Dogecoin (DOGE) Market Update**
DOGE is currently trading around **$0.08**, with a market cap of roughly **$13–14B**.
📊 **Quick Research:**
• Price: ~$0.08
• Market Cap: ~$13–14B
• 24H Volume: ~$0.8–1B
• Strong community support
• High liquidity and market activity
• Highly volatile and speculative
🔎 **Key factors to watch:** Bitcoin’s trend, trading volume, market sentiment, and overall crypto momentum.
#Dogecoin #DOGE #Crypto #CryptoMarket #MarketResearch
🐕 **Dogecoin (DOGE) Market Update**
DOGE is currently trading around **$0.08**, with a market cap of roughly **$13–14B**.
📊 **Quick Research:**
• Price: ~$0.08
• Market Cap: ~$13–14B
• 24H Volume: ~$0.8–1B
• Strong community support
• High liquidity and market activity
• Highly volatile and speculative
🔎 **Key factors to watch:** Bitcoin’s trend, trading volume, market sentiment, and overall crypto momentum.
#Dogecoin #DOGE #Crypto #CryptoMarket #MarketResearch
DOGE is currently trading around **$0.08**, with a market cap of roughly **$13–14B**.
📊 **Quick Research:**
• Price: ~$0.08
• Market Cap: ~$13–14B
• 24H Volume: ~$0.8–1B
• Strong community support
• High liquidity and market activity
• Highly volatile and speculative
🔎 **Key factors to watch:** Bitcoin’s trend, trading volume, market sentiment, and overall crypto momentum.
#Dogecoin #DOGE #Crypto #CryptoMarket #MarketResearch
86
Log in to explore more content
Join global crypto users on Binance Square
⚡️ Get latest and useful information about crypto.
💬 Trusted by the world’s largest crypto exchange.
👍 Discover real insights from verified creators.
Email / Phone number
Trending Topics
1
#NvidiaBeatsEstimatesWith$130BQ4Outlook
9,717 views
144 Discussing
2
#AnthropicIPOPriceCouldExceed$80
15,742 views
130 Discussing
3
#CanNvidia’sDataCenterGrowthContinue?
47,350 views
650 Discussing
4
#CanadaAndUSLaunchOperationNiagaraAgainstApprovalPhishing
1,337 views
22 Discussing
5
#BankOfEnglandUnveilsClearingHousePathwayCoveringDLTFirms
1,657 views
40 Discussing
6
#DBSAndCirclePartnerToExpandAsianInstitutionsUSDCAccess
3,130 views
52 Discussing
7
#LedgerHardwareImplantReportsExtendToDubai
15,804 views
245 Discussing
8
#NvidiaBoardNotConsideringHuang’sReturnasCEO
210,398 views
1,508 Discussing
9
#KOSPIFalls2.59%ToLowestCloseSinceFebruary
61,387 views
709 Discussing
10
#AnthropicClearedToListOnNasdaqAsANT
54,672 views
573 Discussing