
#lptusdt
lptusdt
278,100 views
534 Discussing
Hot
Latest

MARKET WATCH: LIVEPEER’S 2.0 VISION PUTS COMPUTE IN FOCUS
$LPT
{spot}(LPTUSDT)
Livepeer’s 2.0 direction is an important development to follow as the project looks beyond traditional video infrastructure toward a broader decentralized compute marketplace. Its October litepaper gives the community and traders more detail to assess, but proposed changes should not be treated as completed results. Watch for follow-through in network activity, adoption and token demand. On the chart, a breakout supported by rising volume would be more convincing than a sudden price spike without participation.
#LPT #Livepeer #LPTUSDT #DecentralizedAI #CryptoMarket
MARKET WATCH: LIVEPEER’S 2.0 VISION PUTS COMPUTE IN FOCUS
$LPT
Livepeer’s 2.0 direction is an important development to follow as the project looks beyond traditional video infrastructure toward a broader decentralized compute marketplace. Its October litepaper gives the community and traders more detail to assess, but proposed changes should not be treated as completed results. Watch for follow-through in network activity, adoption and token demand. On the chart, a breakout supported by rising volume would be more convincing than a sudden price spike without participation.
#LPT #Livepeer #LPTUSDT #DecentralizedAI #CryptoMarket
$LPT
Livepeer’s 2.0 direction is an important development to follow as the project looks beyond traditional video infrastructure toward a broader decentralized compute marketplace. Its October litepaper gives the community and traders more detail to assess, but proposed changes should not be treated as completed results. Watch for follow-through in network activity, adoption and token demand. On the chart, a breakout supported by rising volume would be more convincing than a sudden price spike without participation.
#LPT #Livepeer #LPTUSDT #DecentralizedAI #CryptoMarket
12


·
--
Bullish
$LPT
{future}(LPTUSDT)
$KSM
{future}(KSMUSDT)
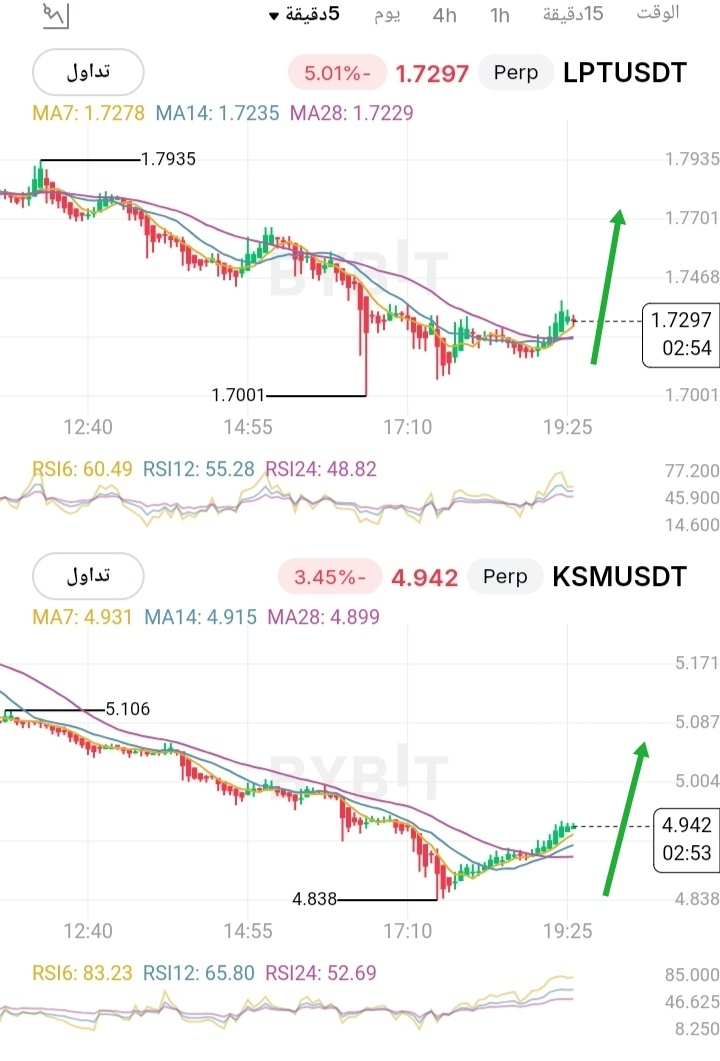
🚨 Crypto Analysis — Potential Bullish Reversal Signal 🚨
1️⃣ LPTUSDT 💜
📉 -5.01% at $1.7297
Fell from 1.7935 to 1.7001, then bounced
MA7: 1.7278, above the moving averages ✅
RSI6: 60.49 - bullish momentum 🚀
👉 Bullish outlook
2️⃣ KSMUSDT 🔥
📉 -3.45% at $4.942
Fell from 5.106 to 4.838, then bounced strongly
MA7: 4.931, above them all ✅
RSI6: 83.23 - strong overbought conditions ⚡️
👉 Strong bullish momentum
💡 Summary: Both have the same pattern — a bottom + rebound; KSM is stronger
⚠️ This is technical analysis for educational purposes — not financial advice
#LPTUSDT
#KSMUSDT
#تحليل_فني
$LPT
$KSM
🚨 Crypto Analysis — Potential Bullish Reversal Signal 🚨
1️⃣ LPTUSDT 💜
📉 -5.01% at $1.7297
Fell from 1.7935 to 1.7001, then bounced
MA7: 1.7278, above the moving averages ✅
RSI6: 60.49 - bullish momentum 🚀
👉 Bullish outlook
2️⃣ KSMUSDT 🔥
📉 -3.45% at $4.942
Fell from 5.106 to 4.838, then bounced strongly
MA7: 4.931, above them all ✅
RSI6: 83.23 - strong overbought conditions ⚡️
👉 Strong bullish momentum
💡 Summary: Both have the same pattern — a bottom + rebound; KSM is stronger
⚠️ This is technical analysis for educational purposes — not financial advice
#LPTUSDT
#KSMUSDT
#تحليل_فني
$KSM
🚨 Crypto Analysis — Potential Bullish Reversal Signal 🚨
1️⃣ LPTUSDT 💜
📉 -5.01% at $1.7297
Fell from 1.7935 to 1.7001, then bounced
MA7: 1.7278, above the moving averages ✅
RSI6: 60.49 - bullish momentum 🚀
👉 Bullish outlook
2️⃣ KSMUSDT 🔥
📉 -3.45% at $4.942
Fell from 5.106 to 4.838, then bounced strongly
MA7: 4.931, above them all ✅
RSI6: 83.23 - strong overbought conditions ⚡️
👉 Strong bullish momentum
💡 Summary: Both have the same pattern — a bottom + rebound; KSM is stronger
⚠️ This is technical analysis for educational purposes — not financial advice
#LPTUSDT
#KSMUSDT
#تحليل_فني
2
393

🚀 $LPT 🔴 Sell Entry Zone: 1.785 – 1.75 | High-Probability Trading Setup!
📊 Technical Analysis (15M):
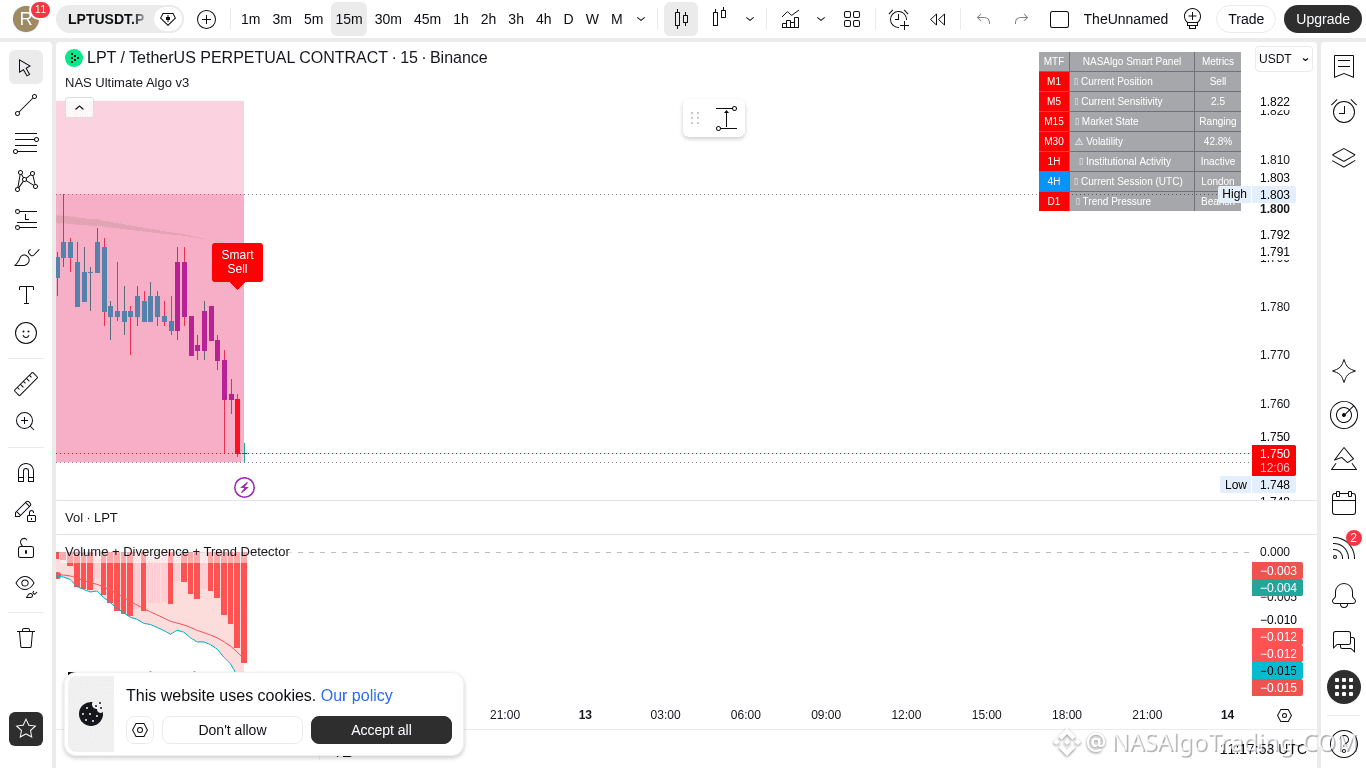
LPTUSDT is showing clear weakness on the 15-minute chart and I want to alert everyone before this thing rolls over. 🧐 Price has been rejecting hard from the 1.80 zone and the structure is starting to break down. I am seeing lower highs forming and momentum is fading fast. This looks like a classic sell setup to me. 👀
The key level to watch is the immediate resistance at 1.8025. As long as price stays below that, the bears are in control. If we somehow push above it, the deeper resistance at 1.8207 would be the next wall, but I do not see that happening with this momentum. 📉
I am looking to enter a short position in the 1.785 to 1.75 zone. The targets are stacked nicely below us. Our first support at 1.7586625 is the initial magnet, and if we break that, the second support at 1.749825 should get tested quickly. From there, the third support at 1.7409875 and final support at 1.73215 come into play.
🎯 Take Profit Levels:
TP1: 1.7586625
TP2: 1.749825
TP3: 1.7409875
TP4: 1.73215
🔴 Stop Loss: 1.8025
This stop is tight and sits right at the immediate resistance. If price reclaims that level, the setup is invalidated and we walk away. No questions asked. ⚡
🚀 Leverage: 5x–10x
Do not get greedy with leverage here. The volatility on LPT can be brutal and we want to survive to trade another day. 💭
⚠️ Note: This is a sell setup, not a buy. Do not try to catch a falling knife. Wait for the entry zone, manage your risk, and let the levels do the work. If price breaks above 1.8025, stand aside. The market does not care about your bias. 🔍
I will be watching this closely. The breakdown below 1.7586625 and 1.749825 would confirm the next leg down toward 1.73215. Stay sharp and stay disciplined. 📢
📢 Chart helps you identify trend so if you see frequent signals on chart, plesae switch to lower or higher timeframe for a good entry or the pair may not be suitable for trading. Follow NASAlgoTrading for more crypto trading setups!
#LPT #LPTUSDT
📌 Crypto Alert
🚀 $LPT 🔴 Sell Entry Zone: 1.785 – 1.75 | High-Probability Trading Setup!
📊 Technical Analysis (15M):
LPTUSDT is showing clear weakness on the 15-minute chart and I want to alert everyone before this thing rolls over. 🧐 Price has been rejecting hard from the 1.80 zone and the structure is starting to break down. I am seeing lower highs forming and momentum is fading fast. This looks like a classic sell setup to me. 👀
The key level to watch is the immediate resistance at 1.8025. As long as price stays below that, the bears are in control. If we somehow push above it, the deeper resistance at 1.8207 would be the next wall, but I do not see that happening with this momentum. 📉
I am looking to enter a short position in the 1.785 to 1.75 zone. The targets are stacked nicely below us. Our first support at 1.7586625 is the initial magnet, and if we break that, the second support at 1.749825 should get tested quickly. From there, the third support at 1.7409875 and final support at 1.73215 come into play.
🎯 Take Profit Levels:
TP1: 1.7586625
TP2: 1.749825
TP3: 1.7409875
TP4: 1.73215
🔴 Stop Loss: 1.8025
This stop is tight and sits right at the immediate resistance. If price reclaims that level, the setup is invalidated and we walk away. No questions asked. ⚡
🚀 Leverage: 5x–10x
Do not get greedy with leverage here. The volatility on LPT can be brutal and we want to survive to trade another day. 💭
⚠️ Note: This is a sell setup, not a buy. Do not try to catch a falling knife. Wait for the entry zone, manage your risk, and let the levels do the work. If price breaks above 1.8025, stand aside. The market does not care about your bias. 🔍
I will be watching this closely. The breakdown below 1.7586625 and 1.749825 would confirm the next leg down toward 1.73215. Stay sharp and stay disciplined. 📢
📢 Chart helps you identify trend so if you see frequent signals on chart, plesae switch to lower or higher timeframe for a good entry or the pair may not be suitable for trading. Follow NASAlgoTrading for more crypto trading setups!
#LPT #LPTUSDT
📌 Crypto Alert
📊 Technical Analysis (15M):
LPTUSDT is showing clear weakness on the 15-minute chart and I want to alert everyone before this thing rolls over. 🧐 Price has been rejecting hard from the 1.80 zone and the structure is starting to break down. I am seeing lower highs forming and momentum is fading fast. This looks like a classic sell setup to me. 👀
The key level to watch is the immediate resistance at 1.8025. As long as price stays below that, the bears are in control. If we somehow push above it, the deeper resistance at 1.8207 would be the next wall, but I do not see that happening with this momentum. 📉
I am looking to enter a short position in the 1.785 to 1.75 zone. The targets are stacked nicely below us. Our first support at 1.7586625 is the initial magnet, and if we break that, the second support at 1.749825 should get tested quickly. From there, the third support at 1.7409875 and final support at 1.73215 come into play.
🎯 Take Profit Levels:
TP1: 1.7586625
TP2: 1.749825
TP3: 1.7409875
TP4: 1.73215
🔴 Stop Loss: 1.8025
This stop is tight and sits right at the immediate resistance. If price reclaims that level, the setup is invalidated and we walk away. No questions asked. ⚡
🚀 Leverage: 5x–10x
Do not get greedy with leverage here. The volatility on LPT can be brutal and we want to survive to trade another day. 💭
⚠️ Note: This is a sell setup, not a buy. Do not try to catch a falling knife. Wait for the entry zone, manage your risk, and let the levels do the work. If price breaks above 1.8025, stand aside. The market does not care about your bias. 🔍
I will be watching this closely. The breakdown below 1.7586625 and 1.749825 would confirm the next leg down toward 1.73215. Stay sharp and stay disciplined. 📢
📢 Chart helps you identify trend so if you see frequent signals on chart, plesae switch to lower or higher timeframe for a good entry or the pair may not be suitable for trading. Follow NASAlgoTrading for more crypto trading setups!
#LPT #LPTUSDT
📌 Crypto Alert
91

LPT is bouncing off a solid order block, looks ready to pop higher. Momentum’s lining up for a clean push.
🟢 $LPT LONG 📈
Entry $1.7143-$1.7177 | SL $1.6645 (-3.0%) | TP1 $1.7417 (+1.5%) | TP2 $1.8018 (+5.0%) | R/R 1:1.7 | Conf 64%
We got a CHoCH on the 15‑min chart, CVD turning bullish, and a fresh FVG right under the breakout. The price is sitting in the OB that overlaps the FVG, and a liquidity sweep just ate the last sell wall, giving a neat POI confluence.
A 3 % stop is a bit tight, so stick to 2‑3× leverage.
Take half profit around the first resistance zone before the next swing.
As always: manage your risk, this is not financial advice 🙏
$LPT #LPTUSDT #比特币突破8万美元大关 #TradingSignals #Write2Earn
LPT is bouncing off a solid order block, looks ready to pop higher. Momentum’s lining up for a clean push.
🟢 $LPT LONG 📈
Entry $1.7143-$1.7177 | SL $1.6645 (-3.0%) | TP1 $1.7417 (+1.5%) | TP2 $1.8018 (+5.0%) | R/R 1:1.7 | Conf 64%
We got a CHoCH on the 15‑min chart, CVD turning bullish, and a fresh FVG right under the breakout. The price is sitting in the OB that overlaps the FVG, and a liquidity sweep just ate the last sell wall, giving a neat POI confluence.
A 3 % stop is a bit tight, so stick to 2‑3× leverage.
Take half profit around the first resistance zone before the next swing.
As always: manage your risk, this is not financial advice 🙏
$LPT #LPTUSDT #比特币突破8万美元大关 #TradingSignals #Write2Earn
🟢 $LPT LONG 📈
Entry $1.7143-$1.7177 | SL $1.6645 (-3.0%) | TP1 $1.7417 (+1.5%) | TP2 $1.8018 (+5.0%) | R/R 1:1.7 | Conf 64%
We got a CHoCH on the 15‑min chart, CVD turning bullish, and a fresh FVG right under the breakout. The price is sitting in the OB that overlaps the FVG, and a liquidity sweep just ate the last sell wall, giving a neat POI confluence.
A 3 % stop is a bit tight, so stick to 2‑3× leverage.
Take half profit around the first resistance zone before the next swing.
As always: manage your risk, this is not financial advice 🙏
$LPT #LPTUSDT #比特币突破8万美元大关 #TradingSignals #Write2Earn
120

·
--
$LPT
{future}(LPTUSDT)
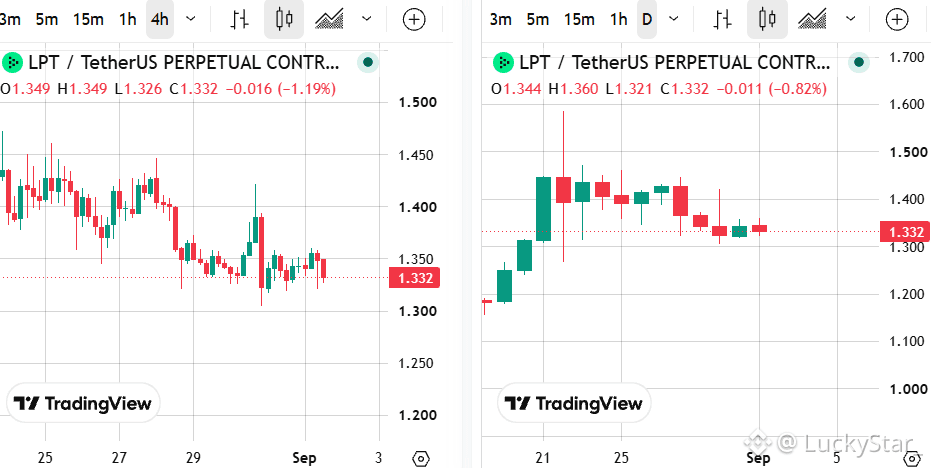
🔴 SHORT SCENARIO
🎯 Entry: $1,345–1,355
🛡️ Stop Loss: above $1,370
📉 Take 1: $1,310
📉 Take 2: $1,280
📉 Take 3: $1,250
#lpt #lptusdt #TechnicalAnalysis #SHORT📉
$LPT
🔴 SHORT SCENARIO
🎯 Entry: $1,345–1,355
🛡️ Stop Loss: above $1,370
📉 Take 1: $1,310
📉 Take 2: $1,280
📉 Take 3: $1,250
#lpt #lptusdt #TechnicalAnalysis #SHORT📉
🔴 SHORT SCENARIO
🎯 Entry: $1,345–1,355
🛡️ Stop Loss: above $1,370
📉 Take 1: $1,310
📉 Take 2: $1,280
📉 Take 3: $1,250
#lpt #lptusdt #TechnicalAnalysis #SHORT📉
17

·
--
LPTUSDT
$LPT
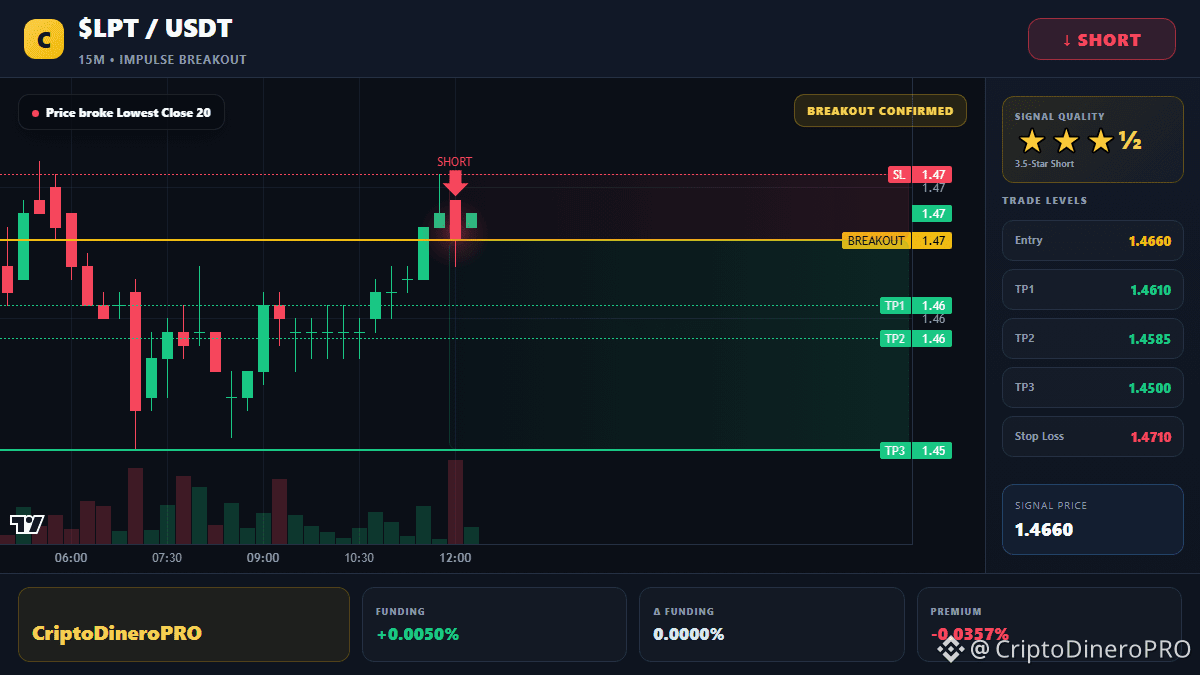
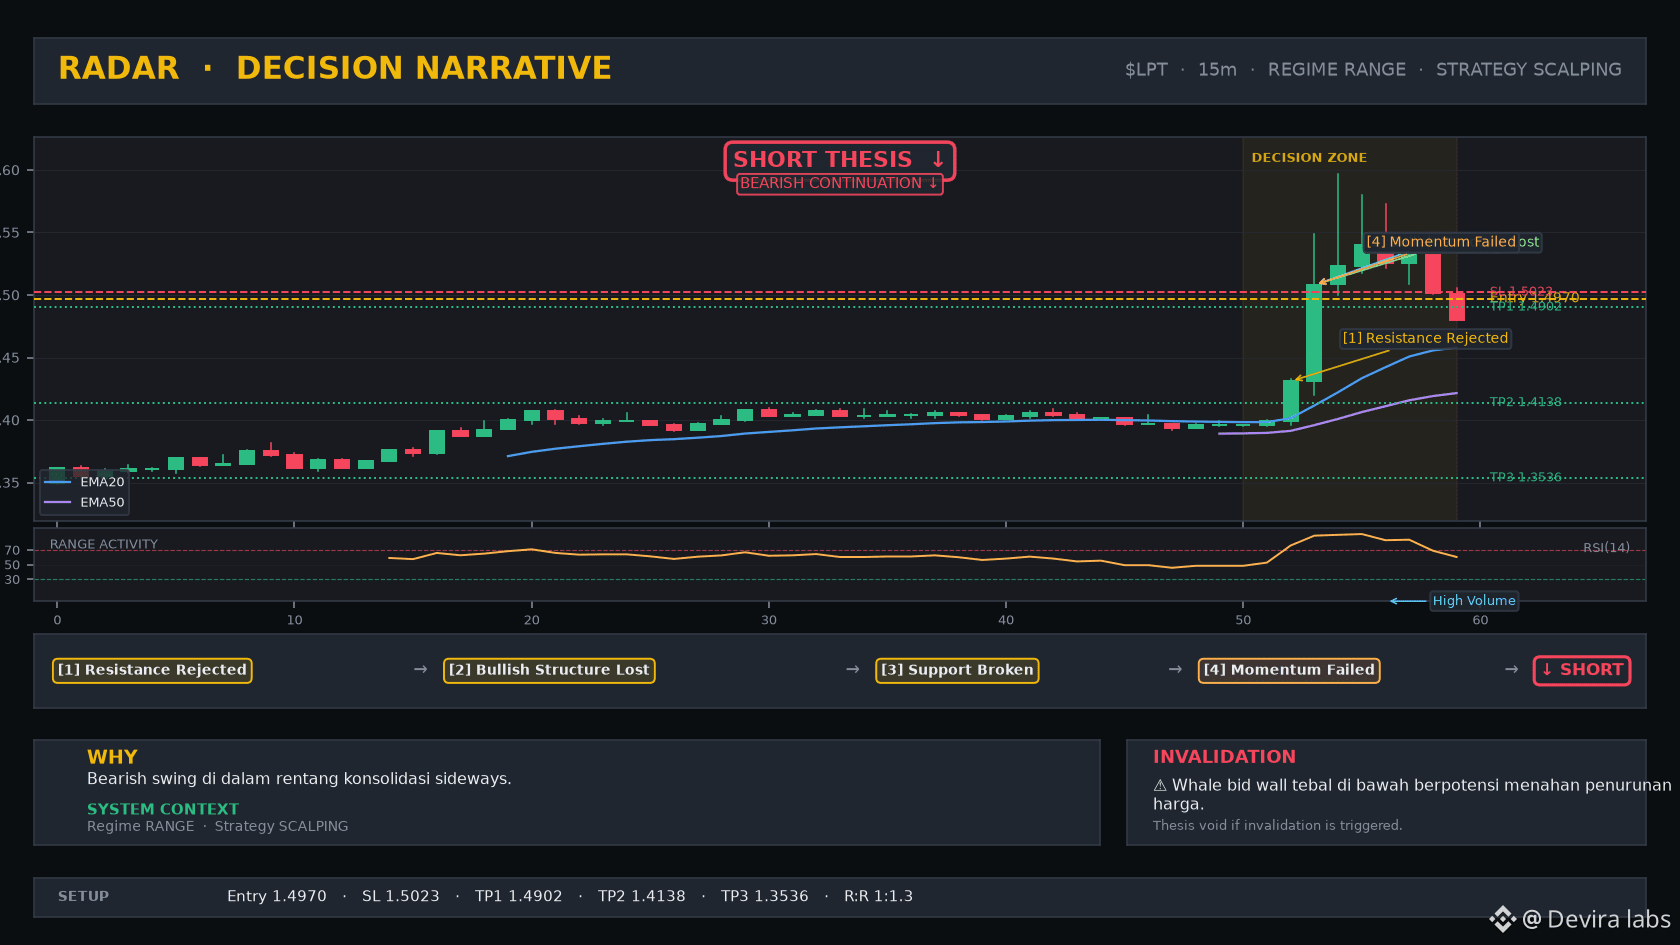
Price structure is still trapped in the range area and the ignition signal has started to trigger near the local resistance. A short-term short opportunity is open to take advantage of a bounce back toward the support area.
Bias:
Bearish swing within the sideways consolidation range.
Trade Plan
Entry: 1.497
SL: 1.502264
TP: 1.490232
Market Evidence:
• Ignition signal has started to become active in the current price range area.
• The sideways market structure provides room to sell at resistance.
• A reentry setup is detected when price tests the upper boundary.
Risk:
• A thick whale bid wall below may potentially hold the price down.
Watch:
Monitor whether the lower support can be broken or instead triggers a bounce back.
#RADAR #Crypto #LPTUSDT
LPTUSDT
$LPT
Price structure is still trapped in the range area and the ignition signal has started to trigger near the local resistance. A short-term short opportunity is open to take advantage of a bounce back toward the support area.
Bias:
Bearish swing within the sideways consolidation range.
Trade Plan
Entry: 1.497
SL: 1.502264
TP: 1.490232
Market Evidence:
• Ignition signal has started to become active in the current price range area.
• The sideways market structure provides room to sell at resistance.
• A reentry setup is detected when price tests the upper boundary.
Risk:
• A thick whale bid wall below may potentially hold the price down.
Watch:
Monitor whether the lower support can be broken or instead triggers a bounce back.
#RADAR #Crypto #LPTUSDT
$LPT
Price structure is still trapped in the range area and the ignition signal has started to trigger near the local resistance. A short-term short opportunity is open to take advantage of a bounce back toward the support area.
Bias:
Bearish swing within the sideways consolidation range.
Trade Plan
Entry: 1.497
SL: 1.502264
TP: 1.490232
Market Evidence:
• Ignition signal has started to become active in the current price range area.
• The sideways market structure provides room to sell at resistance.
• A reentry setup is detected when price tests the upper boundary.
Risk:
• A thick whale bid wall below may potentially hold the price down.
Watch:
Monitor whether the lower support can be broken or instead triggers a bounce back.
#RADAR #Crypto #LPTUSDT
97

·
--
Bullish
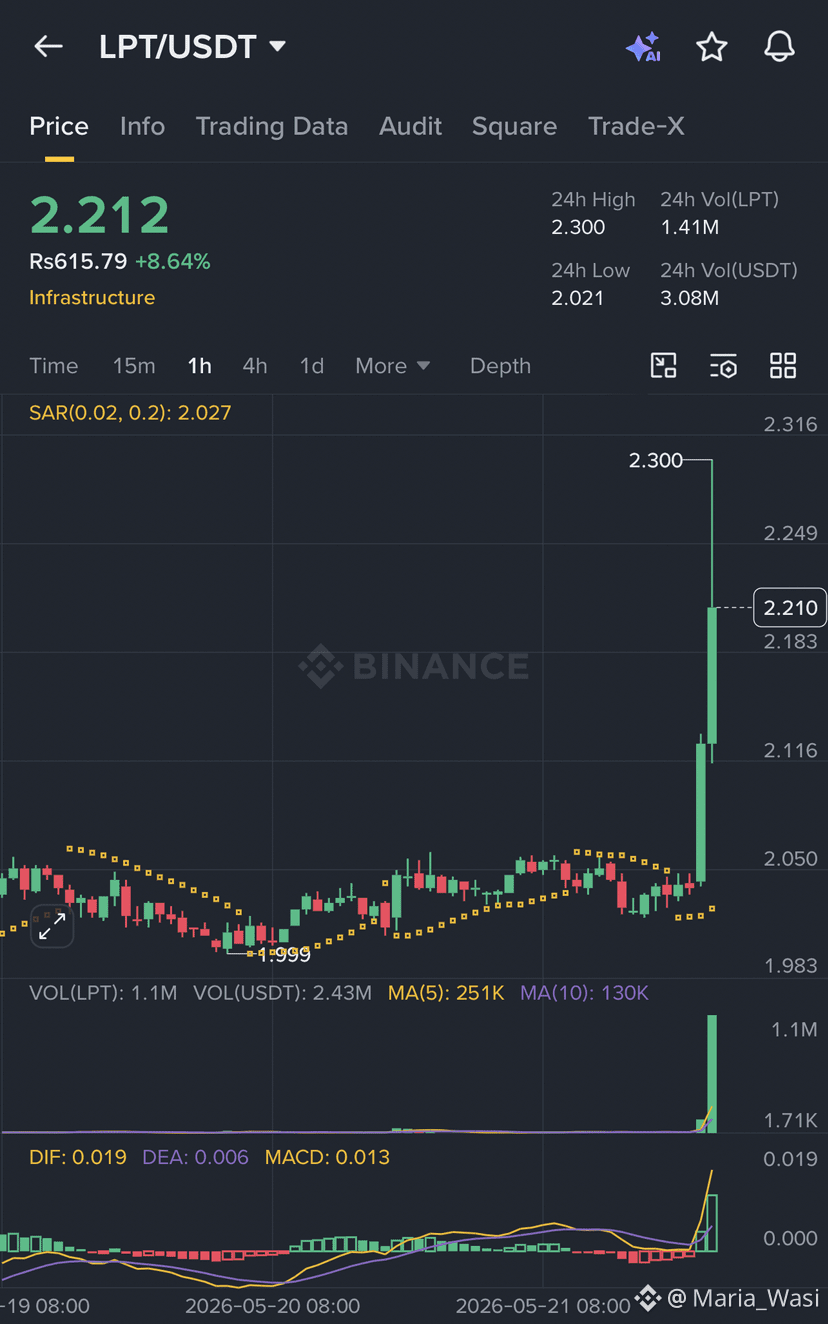
$LPT MASSIVE BREAKOUT ⚡
Entry Zone: 2.100 – 2.150 🟢
Targets: 2.300 | 2.450 | 2.600 🎯
Stop Loss: 1.980
$LPT just printed a massive god candle on the 1H chart, breaking consolidation on heavy volume. MACD is expanding bullishly, confirming strong buyer interest.
The Plan: Do not chase the top of a vertical spike. We are waiting for a local pullback to retest the broken resistance zone before entering to target the recent highs.
Let the price come to the zone. Manage your risk.
Not financial advice.
#BinanceSquare #cryptotrading #altcoins #LPTUSDT
{future}(LPTUSDT)
$LPT MASSIVE BREAKOUT ⚡
Entry Zone: 2.100 – 2.150 🟢
Targets: 2.300 | 2.450 | 2.600 🎯
Stop Loss: 1.980
$LPT just printed a massive god candle on the 1H chart, breaking consolidation on heavy volume. MACD is expanding bullishly, confirming strong buyer interest.
The Plan: Do not chase the top of a vertical spike. We are waiting for a local pullback to retest the broken resistance zone before entering to target the recent highs.
Let the price come to the zone. Manage your risk.
Not financial advice.
#BinanceSquare #cryptotrading #altcoins #LPTUSDT
Entry Zone: 2.100 – 2.150 🟢
Targets: 2.300 | 2.450 | 2.600 🎯
Stop Loss: 1.980
$LPT just printed a massive god candle on the 1H chart, breaking consolidation on heavy volume. MACD is expanding bullishly, confirming strong buyer interest.
The Plan: Do not chase the top of a vertical spike. We are waiting for a local pullback to retest the broken resistance zone before entering to target the recent highs.
Let the price come to the zone. Manage your risk.
Not financial advice.
#BinanceSquare #cryptotrading #altcoins #LPTUSDT
284


·
--
$LPT This round’s advanced key points to watch
Spot market 24h is up 6.5%, current price is 1.5
1h is up 2.9%
First, observe—if it doesn’t reach the trigger level, don’t rush in
Observation list logging—not investment advice.
#LPTUSDT
$LPT This round’s advanced key points to watch
Spot market 24h is up 6.5%, current price is 1.5
1h is up 2.9%
First, observe—if it doesn’t reach the trigger level, don’t rush in
Observation list logging—not investment advice.
#LPTUSDT
Spot market 24h is up 6.5%, current price is 1.5
1h is up 2.9%
First, observe—if it doesn’t reach the trigger level, don’t rush in
Observation list logging—not investment advice.
#LPTUSDT
343
🔴 Sell Entry: $LPT at 1.282
🎯 TP1: 1.27559
🎯 TP2: 1.26918
🎯 TP3: 1.26277
🎯 TP4: 1.25636
🔴 StopLoss: 1.30123
🚀 Leverage: 5x to 10x
Like, Share, Follow and Adjust StopLoss. DYOR and trade at your own risk.
#LPT #LPTUSDT
🔴 Sell Entry: $LPT at 1.282
🎯 TP1: 1.27559
🎯 TP2: 1.26918
🎯 TP3: 1.26277
🎯 TP4: 1.25636
🔴 StopLoss: 1.30123
🚀 Leverage: 5x to 10x
Like, Share, Follow and Adjust StopLoss. DYOR and trade at your own risk.
#LPT #LPTUSDT
🎯 TP1: 1.27559
🎯 TP2: 1.26918
🎯 TP3: 1.26277
🎯 TP4: 1.25636
🔴 StopLoss: 1.30123
🚀 Leverage: 5x to 10x
Like, Share, Follow and Adjust StopLoss. DYOR and trade at your own risk.
#LPT #LPTUSDT
13

·
--
Article
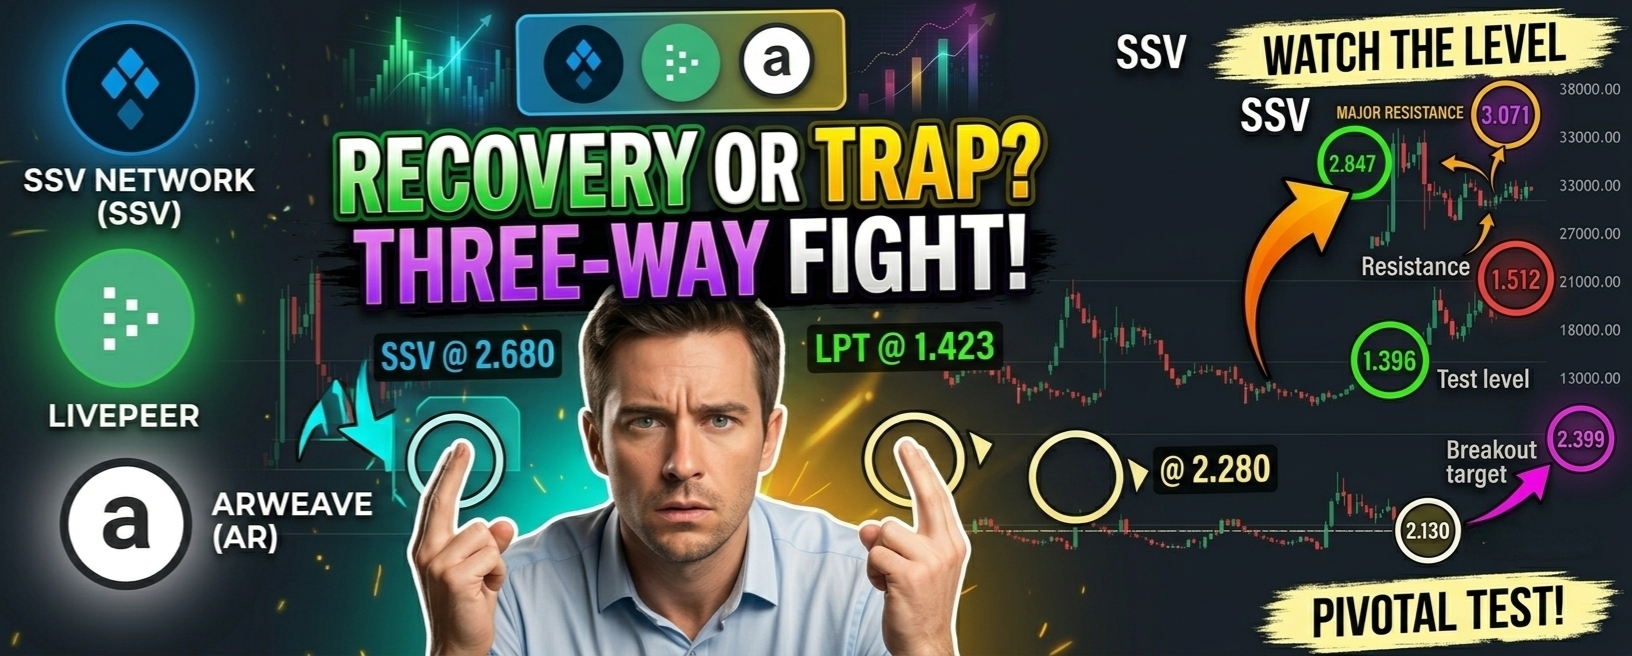
Altcoin Recovery Meets Key Supply Zones ❔A group of mid-cap altcoins is showing signs of recovery from recent lows, but each faces distinct resistance levels that will determine whether the bounce continues or fades.
SSV Consolidates Above Recent Floor
$SSV has rebounded from the 1.951 low, climbing through 2.175 before reaching a peak near 3.071. The current price of 2.680 sits below the 2.847 level, which has acted as resistance during the recent pullback. The structure shows price holding above 2.602, a level that has provided support during the current consolidation phase.
This zone between 2.602 and 2.680 matters because it represents the midpoint of the recent trading range. A hold here could pave the way for a move toward 2.847, while a breakdown would expose the 2.175 area. The rejection from 3.071 confirms the presence of supply at higher levels, making reclaim confirmation essential for any recovery attempt.
Support: 2.602
Major support: 2.175
Resistance: 2.847
Major resistance: 3.071
Trading Framework
Watch Zone: The 2.602 to 2.680 area could act as a reaction point if buyers defend support. A 4-hour close above 2.847 would signal strength.
Next Target: If price clears 2.847 and holds, the 3.071 barrier becomes the next focus.
Invalidation: A sustained 4-hour close below 2.602 would weaken the current structure.
Trade here 👇🏻
{spot}(SSVUSDT)
LPT Tests Critical Demand Zone
$LPT has declined from the 1.607 peak, breaking through 1.585 and 1.512 before settling near 1.423. The current price is testing the 1.396 support level, which has previously attracted buyers. The structure suggests sellers are present near 1.512, making that the key resistance to watch.
This area between 1.396 and 1.423 represents the line between a healthy pullback and a deeper correction. A hold here could allow for a recovery toward 1.512, while a breakdown would expose the 1.323 region. The rejection from 1.607 confirms supply near that level, making reclaim confirmation essential.
Support: 1.396
Major support: 1.323
Resistance: 1.512
Major resistance: 1.607
Trading Framework
Watch Zone: The 1.396 to 1.423 area could act as a reaction point if buyers defend support. A 4-hour close above 1.512 would signal strength.
Next Target: If price clears 1.512 and holds, the 1.607 barrier becomes the next focus.
Invalidation: A sustained 4-hour close below 1.396 would weaken the current structure.
Trade here 👇🏻
{spot}(LPTUSDT)
AR Holds Above Key Support
$AR has recovered from the 1.674 low, climbing through 1.826 and 1.978 before reaching a peak near 2.434. The current price of 2.280 is holding above the 2.130 level, which has provided support during the recent pullback. The structure shows price consolidating between 2.130 and 2.399, with the upper level acting as resistance.
This zone between 2.130 and 2.280 matters because it represents the midpoint of the recent trading range. A hold here could pave the way for a move toward 2.399, while a breakdown would expose the 1.978 area. The rejection from 2.434 confirms the presence of supply at higher levels.
Support: 2.130
Major support: 1.978
Resistance: 2.399
Major resistance: 2.434
Trading Framework
Watch Zone: The 2.130 to 2.280 area could act as a reaction point if buyers defend support. A 4-hour close above 2.399 would signal strength.
Next Target: If price clears 2.399 and holds, the 2.434 barrier becomes the next focus.
Invalidation: A sustained 4-hour close below 2.130 would weaken the current structure.
Trade here 👇🏻
{spot}(ARUSDT)
Comparison Summary
· SSV: Testing 2.602 support. Rejection at 3.071. Bias: Cautious recovery.
· LPT: Testing 1.396 support. Rejection at 1.607. Bias: Weak recovery.
· AR: Testing 2.130 support. Rejection at 2.434. Bias: Moderate recovery.
What This Tells Us:
All three assets are attempting to recover from recent lows but face resistance at different levels. SSV shows the strongest recovery structure with the highest relative position. LPT is showing the weakest recovery, trading closest to its recent support. AR sits in the middle, holding above support but facing resistance at 2.399.
The key lesson here is understanding relative strength within the same market environment. When multiple assets are recovering from similar lows, the one holding above the highest support levels often indicates stronger underlying demand. SSV is showing the most resilience, while LPT is displaying the most weakness.
Watch for clean 4-hour closes above resistance levels to confirm any recovery attempt across all three assets. The support zones remain the primary battleground for each coin.
Of these three recovery setups, which one do you find most compelling based on its current structure?
Educational only. Not financial advice. Manage risk.
#ssvusdt #LPTUSDT #arusdt #CryptoAnalysis
Altcoin Recovery Meets Key Supply Zones ❔
A group of mid-cap altcoins is showing signs of recovery from recent lows, but each faces distinct resistance levels that will determine whether the bounce continues or fades.
SSV Consolidates Above Recent Floor
$SSV has rebounded from the 1.951 low, climbing through 2.175 before reaching a peak near 3.071. The current price of 2.680 sits below the 2.847 level, which has acted as resistance during the recent pullback. The structure shows price holding above 2.602, a level that has provided support during the current consolidation phase.
This zone between 2.602 and 2.680 matters because it represents the midpoint of the recent trading range. A hold here could pave the way for a move toward 2.847, while a breakdown would expose the 2.175 area. The rejection from 3.071 confirms the presence of supply at higher levels, making reclaim confirmation essential for any recovery attempt.
Support: 2.602
Major support: 2.175
Resistance: 2.847
Major resistance: 3.071
Trading Framework
Watch Zone: The 2.602 to 2.680 area could act as a reaction point if buyers defend support. A 4-hour close above 2.847 would signal strength.
Next Target: If price clears 2.847 and holds, the 3.071 barrier becomes the next focus.
Invalidation: A sustained 4-hour close below 2.602 would weaken the current structure.
Trade here 👇🏻
LPT Tests Critical Demand Zone
$LPT has declined from the 1.607 peak, breaking through 1.585 and 1.512 before settling near 1.423. The current price is testing the 1.396 support level, which has previously attracted buyers. The structure suggests sellers are present near 1.512, making that the key resistance to watch.
This area between 1.396 and 1.423 represents the line between a healthy pullback and a deeper correction. A hold here could allow for a recovery toward 1.512, while a breakdown would expose the 1.323 region. The rejection from 1.607 confirms supply near that level, making reclaim confirmation essential.
Support: 1.396
Major support: 1.323
Resistance: 1.512
Major resistance: 1.607
Trading Framework
Watch Zone: The 1.396 to 1.423 area could act as a reaction point if buyers defend support. A 4-hour close above 1.512 would signal strength.
Next Target: If price clears 1.512 and holds, the 1.607 barrier becomes the next focus.
Invalidation: A sustained 4-hour close below 1.396 would weaken the current structure.
Trade here 👇🏻
AR Holds Above Key Support
$AR has recovered from the 1.674 low, climbing through 1.826 and 1.978 before reaching a peak near 2.434. The current price of 2.280 is holding above the 2.130 level, which has provided support during the recent pullback. The structure shows price consolidating between 2.130 and 2.399, with the upper level acting as resistance.
This zone between 2.130 and 2.280 matters because it represents the midpoint of the recent trading range. A hold here could pave the way for a move toward 2.399, while a breakdown would expose the 1.978 area. The rejection from 2.434 confirms the presence of supply at higher levels.
Support: 2.130
Major support: 1.978
Resistance: 2.399
Major resistance: 2.434
Trading Framework
Watch Zone: The 2.130 to 2.280 area could act as a reaction point if buyers defend support. A 4-hour close above 2.399 would signal strength.
Next Target: If price clears 2.399 and holds, the 2.434 barrier becomes the next focus.
Invalidation: A sustained 4-hour close below 2.130 would weaken the current structure.
Trade here 👇🏻
Comparison Summary
· SSV: Testing 2.602 support. Rejection at 3.071. Bias: Cautious recovery.
· LPT: Testing 1.396 support. Rejection at 1.607. Bias: Weak recovery.
· AR: Testing 2.130 support. Rejection at 2.434. Bias: Moderate recovery.
What This Tells Us:
All three assets are attempting to recover from recent lows but face resistance at different levels. SSV shows the strongest recovery structure with the highest relative position. LPT is showing the weakest recovery, trading closest to its recent support. AR sits in the middle, holding above support but facing resistance at 2.399.
The key lesson here is understanding relative strength within the same market environment. When multiple assets are recovering from similar lows, the one holding above the highest support levels often indicates stronger underlying demand. SSV is showing the most resilience, while LPT is displaying the most weakness.
Watch for clean 4-hour closes above resistance levels to confirm any recovery attempt across all three assets. The support zones remain the primary battleground for each coin.
Of these three recovery setups, which one do you find most compelling based on its current structure?
Educational only. Not financial advice. Manage risk.
#ssvusdt #LPTUSDT #arusdt #CryptoAnalysis
SSV Consolidates Above Recent Floor
$SSV has rebounded from the 1.951 low, climbing through 2.175 before reaching a peak near 3.071. The current price of 2.680 sits below the 2.847 level, which has acted as resistance during the recent pullback. The structure shows price holding above 2.602, a level that has provided support during the current consolidation phase.
This zone between 2.602 and 2.680 matters because it represents the midpoint of the recent trading range. A hold here could pave the way for a move toward 2.847, while a breakdown would expose the 2.175 area. The rejection from 3.071 confirms the presence of supply at higher levels, making reclaim confirmation essential for any recovery attempt.
Support: 2.602
Major support: 2.175
Resistance: 2.847
Major resistance: 3.071
Trading Framework
Watch Zone: The 2.602 to 2.680 area could act as a reaction point if buyers defend support. A 4-hour close above 2.847 would signal strength.
Next Target: If price clears 2.847 and holds, the 3.071 barrier becomes the next focus.
Invalidation: A sustained 4-hour close below 2.602 would weaken the current structure.
Trade here 👇🏻
LPT Tests Critical Demand Zone
$LPT has declined from the 1.607 peak, breaking through 1.585 and 1.512 before settling near 1.423. The current price is testing the 1.396 support level, which has previously attracted buyers. The structure suggests sellers are present near 1.512, making that the key resistance to watch.
This area between 1.396 and 1.423 represents the line between a healthy pullback and a deeper correction. A hold here could allow for a recovery toward 1.512, while a breakdown would expose the 1.323 region. The rejection from 1.607 confirms supply near that level, making reclaim confirmation essential.
Support: 1.396
Major support: 1.323
Resistance: 1.512
Major resistance: 1.607
Trading Framework
Watch Zone: The 1.396 to 1.423 area could act as a reaction point if buyers defend support. A 4-hour close above 1.512 would signal strength.
Next Target: If price clears 1.512 and holds, the 1.607 barrier becomes the next focus.
Invalidation: A sustained 4-hour close below 1.396 would weaken the current structure.
Trade here 👇🏻
AR Holds Above Key Support
$AR has recovered from the 1.674 low, climbing through 1.826 and 1.978 before reaching a peak near 2.434. The current price of 2.280 is holding above the 2.130 level, which has provided support during the recent pullback. The structure shows price consolidating between 2.130 and 2.399, with the upper level acting as resistance.
This zone between 2.130 and 2.280 matters because it represents the midpoint of the recent trading range. A hold here could pave the way for a move toward 2.399, while a breakdown would expose the 1.978 area. The rejection from 2.434 confirms the presence of supply at higher levels.
Support: 2.130
Major support: 1.978
Resistance: 2.399
Major resistance: 2.434
Trading Framework
Watch Zone: The 2.130 to 2.280 area could act as a reaction point if buyers defend support. A 4-hour close above 2.399 would signal strength.
Next Target: If price clears 2.399 and holds, the 2.434 barrier becomes the next focus.
Invalidation: A sustained 4-hour close below 2.130 would weaken the current structure.
Trade here 👇🏻
Comparison Summary
· SSV: Testing 2.602 support. Rejection at 3.071. Bias: Cautious recovery.
· LPT: Testing 1.396 support. Rejection at 1.607. Bias: Weak recovery.
· AR: Testing 2.130 support. Rejection at 2.434. Bias: Moderate recovery.
What This Tells Us:
All three assets are attempting to recover from recent lows but face resistance at different levels. SSV shows the strongest recovery structure with the highest relative position. LPT is showing the weakest recovery, trading closest to its recent support. AR sits in the middle, holding above support but facing resistance at 2.399.
The key lesson here is understanding relative strength within the same market environment. When multiple assets are recovering from similar lows, the one holding above the highest support levels often indicates stronger underlying demand. SSV is showing the most resilience, while LPT is displaying the most weakness.
Watch for clean 4-hour closes above resistance levels to confirm any recovery attempt across all three assets. The support zones remain the primary battleground for each coin.
Of these three recovery setups, which one do you find most compelling based on its current structure?
Educational only. Not financial advice. Manage risk.
#ssvusdt #LPTUSDT #arusdt #CryptoAnalysis
2
519
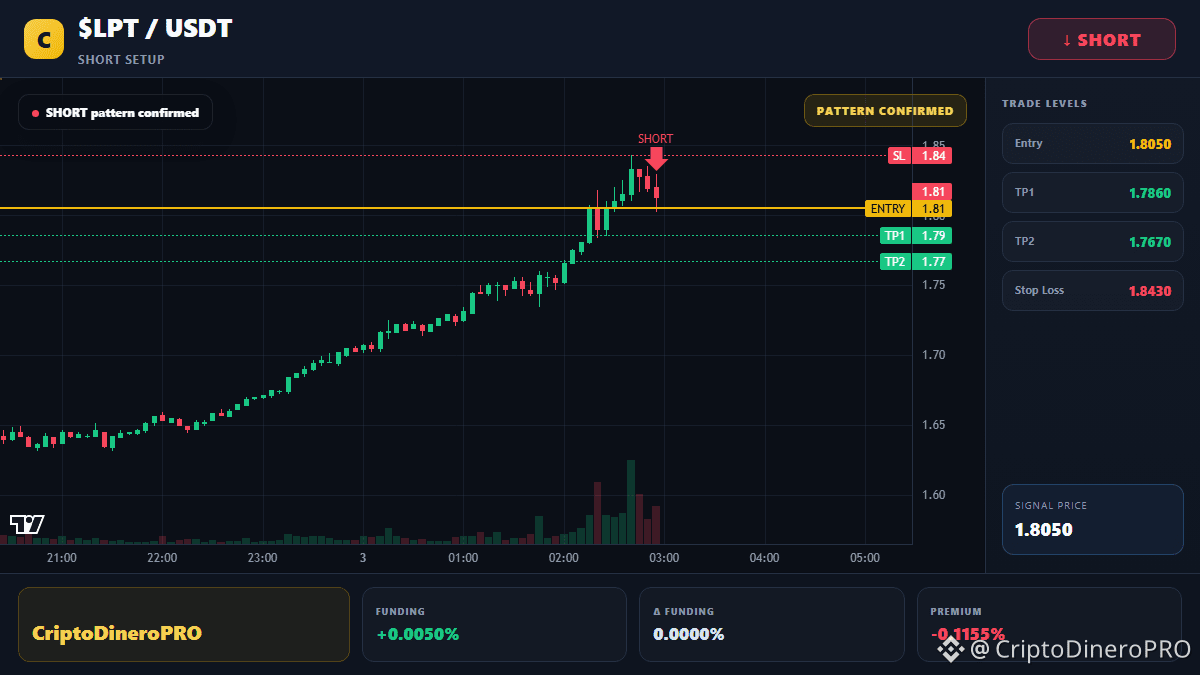
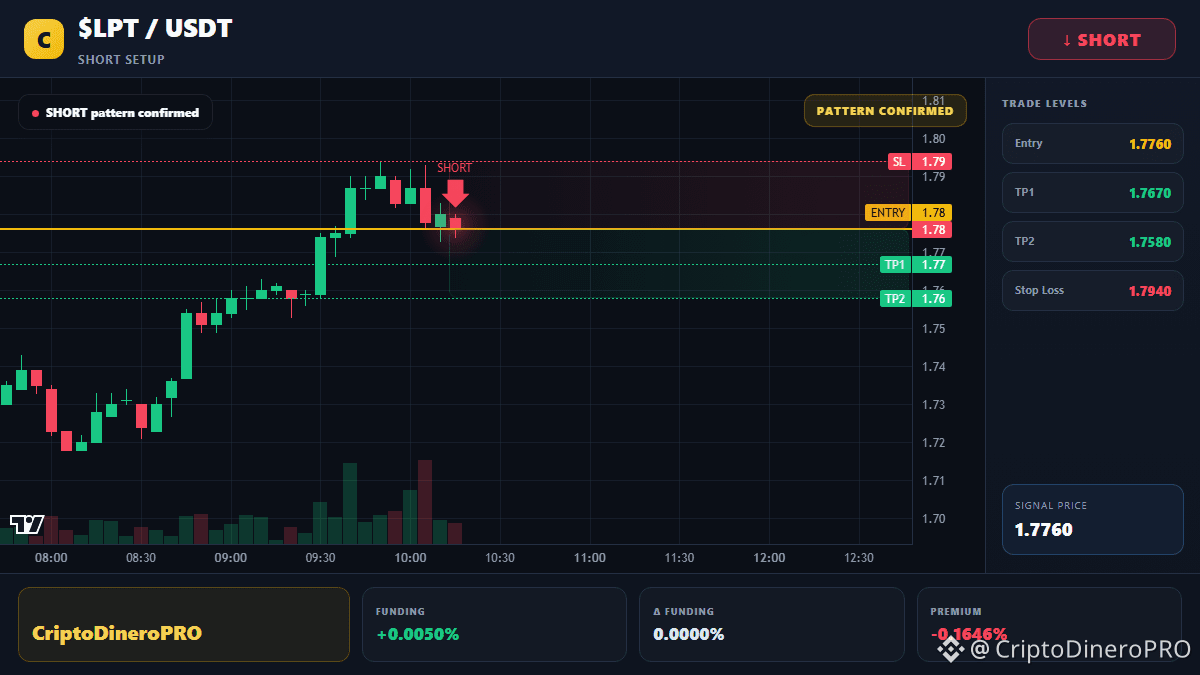
LPT is testing a tight 1.7% down move after yesterday’s rally, and the price is now hugging the 0.0255 resistance. Momentum is slipping, opening the door for a short swing.
🔴 $LPT SHORT 📉
Entry $1.7433-$1.7467 | SL $1.7974 (-3.0%) | TP1 $1.7188 (+1.5%) | TP2 $1.6578 (+5.0%) | R/R 1:1.7 | Conf 64%
A clear change of character broke the bullish swing, and the CVD turned negative confirming sell pressure. The fair value gap aligns with a bullish order block, creating a POI where the liquidity sweep ate the last buying cluster. With the confluence of OB and FVG, the structure now points to a short bias.
A 3.0% stop is relatively tight, so using no more than 3x leverage keeps risk manageable.
Take half profit at the first target around 1.7% gain, then let the rest run to the 1.7R.
Not financial advice — trade only what you can afford to lose 🙏
$LPT #LPTUSDT #greekpolicebustcryptoscamringarrest17 #TradingSignals #Write2Earn
LPT is testing a tight 1.7% down move after yesterday’s rally, and the price is now hugging the 0.0255 resistance. Momentum is slipping, opening the door for a short swing.
🔴 $LPT SHORT 📉
Entry $1.7433-$1.7467 | SL $1.7974 (-3.0%) | TP1 $1.7188 (+1.5%) | TP2 $1.6578 (+5.0%) | R/R 1:1.7 | Conf 64%
A clear change of character broke the bullish swing, and the CVD turned negative confirming sell pressure. The fair value gap aligns with a bullish order block, creating a POI where the liquidity sweep ate the last buying cluster. With the confluence of OB and FVG, the structure now points to a short bias.
A 3.0% stop is relatively tight, so using no more than 3x leverage keeps risk manageable.
Take half profit at the first target around 1.7% gain, then let the rest run to the 1.7R.
Not financial advice — trade only what you can afford to lose 🙏
$LPT #LPTUSDT #greekpolicebustcryptoscamringarrest17 #TradingSignals #Write2Earn
🔴 $LPT SHORT 📉
Entry $1.7433-$1.7467 | SL $1.7974 (-3.0%) | TP1 $1.7188 (+1.5%) | TP2 $1.6578 (+5.0%) | R/R 1:1.7 | Conf 64%
A clear change of character broke the bullish swing, and the CVD turned negative confirming sell pressure. The fair value gap aligns with a bullish order block, creating a POI where the liquidity sweep ate the last buying cluster. With the confluence of OB and FVG, the structure now points to a short bias.
A 3.0% stop is relatively tight, so using no more than 3x leverage keeps risk manageable.
Take half profit at the first target around 1.7% gain, then let the rest run to the 1.7R.
Not financial advice — trade only what you can afford to lose 🙏
$LPT #LPTUSDT #greekpolicebustcryptoscamringarrest17 #TradingSignals #Write2Earn
17
Log in to explore more content
Join global crypto users on Binance Square
⚡️ Get latest and useful information about crypto.
💬 Trusted by the world’s largest crypto exchange.
👍 Discover real insights from verified creators.
Email / Phone number
Trending Topics
1
#WhatWillDriveCryptoandStocks’NextRebound?
103 views
44 Discussing
2
#Anthropic’s6xIPODemandSignalsPotentialRecordRaise
22 views
12 Discussing
3
#HuangExitNvidiaStrategyInFocus
123,581 views
1,295 Discussing
4
#AnthropicRejectsIPODelayValuationinQuestion
734,380 views
5,483 Discussing
5
#HedgeFundsCMEBitcoinNetShortsFall89%
4,595 views
83 Discussing
6
#BitMineReports$6.3BNetLossForFiscal2026
16,060 views
155 Discussing
7
#TradFiForBeginners
543,800 views
3,781 Discussing
8
#SoFiExpandsSoFiUSDStablecoinToPolygon
4,214 views
80 Discussing
9
#TetherGoldXAUTCompletesKPMGAudit
5,326 views
87 Discussing
10
#ChipStocksExtendLossesAfterNvidiaCEOChange
46,969 views
515 Discussing