

#crypttrading
crypttrading
323 views
7 Discussing
Hot
Latest

·
--
#goldmarket #goldtradimg #crytpomarket #crypttrading Ethereum (ETH) $ETH as of May 13, 2026. Forecasts for the next 24 hours suggest a mixed to slightly bearish outlook, with most models projecting the price to fluctuate between $2,258 and $2,343.
Short-Term Price Targets
Average Prediction: Analysts expect ETH to average around $2,306 within the next day, though some models suggest a marginal rise of 0.48% toward $2,293.
High/Low Range: Daily volatility is expected to hold a low near $2,258 and a resistance high near $2,343.
Key Resistance/Support: Immediate support sits at $2,276 (50-day EMA), while resistance is clustered around $2,341 (100-day EMA).
Market Indicators & Sentiment
Sentiment: Technical indicators show a strong bearish sentiment (90%) in the very short term, despite a Neutral Fear & Greed Index score of 49.
Momentum: The MACD remains negative, indicating bearish short-term pressure, and price is currently trending below the 200-day moving average, which may act as resistance.
Volatility: Current 30-day volatility is relatively low at 1.86%, suggesting range-bound movement rather than a sharp breakout.
$ETH $BTC
92

·
--

Article
Why Bitcoin Price Dipped Today – Key Reasons Traders Should KnowThe recent dip in Bitcoin $BTC (BTC/USDT) around the $78K zone has caught traders’ attention, especially after a short bullish push toward $78,500. Looking at the 15-minute chart, the move isn’t random—it’s a mix of technical rejection and market behavior.
1. Strong Resistance Rejection
BTC attempted to break above $78,500, but failed to hold. This level acted as a key resistance zone, where sellers stepped in aggressively.
Such rejections often trigger quick downside moves as short-term traders exit positions.
2. Moving Average Breakdown
On your chart:
MA(7) and MA(25) were supporting pricePrice dropped below short-term MAs, signaling weakness
This breakdown usually flips short-term sentiment from bullish → bearish.
3. Profit-Taking After Pump
Before the drop, BTC $BTC showed a strong upward move.
Traders who bought lower likely took profits near resistance, causing selling pressure.
This is normal behavior in crypto markets—especially on lower timeframes like 15m.
4. Volume Spike on Red Candle
The large red candle with higher volume indicates:
Strong selling pressurePossible short-term trend reversal
Volume confirms that the drop wasn’t weak—it had conviction.
5. Market Uncertainty & Sentiment
Broader crypto sentiment also plays a role:
Traders remain cautious due to macro uncertaintyQuick scalps dominate instead of long holds
This creates choppy price action instead of clean trends.
What’s Next for BTC? $BTC Have a look
Bullish Scenario 📈
Reclaim $78,200–$78,300Hold above moving averagesNext target: $78,500 again
Bearish Scenario 📉
Lose support near $77,800Next possible zone: $77,300 – $77,500
Final Thoughts
This dip doesn’t necessarily mean a trend reversal—it’s more of a healthy pullback after rejection. Smart traders watch key levels instead of reacting emotionally.
In crypto, price moves fast—but structure always tells the story.
#BTC
#bitcoin
#crypttrading
Why Bitcoin Price Dipped Today – Key Reasons Traders Should Know
The recent dip in Bitcoin $BTC (BTC/USDT) around the $78K zone has caught traders’ attention, especially after a short bullish push toward $78,500. Looking at the 15-minute chart, the move isn’t random—it’s a mix of technical rejection and market behavior.
1. Strong Resistance Rejection
BTC attempted to break above $78,500, but failed to hold. This level acted as a key resistance zone, where sellers stepped in aggressively.
Such rejections often trigger quick downside moves as short-term traders exit positions.
2. Moving Average Breakdown
On your chart:
MA(7) and MA(25) were supporting pricePrice dropped below short-term MAs, signaling weakness
This breakdown usually flips short-term sentiment from bullish → bearish.
3. Profit-Taking After Pump
Before the drop, BTC $BTC showed a strong upward move.
Traders who bought lower likely took profits near resistance, causing selling pressure.
This is normal behavior in crypto markets—especially on lower timeframes like 15m.
4. Volume Spike on Red Candle
The large red candle with higher volume indicates:
Strong selling pressurePossible short-term trend reversal
Volume confirms that the drop wasn’t weak—it had conviction.
5. Market Uncertainty & Sentiment
Broader crypto sentiment also plays a role:
Traders remain cautious due to macro uncertaintyQuick scalps dominate instead of long holds
This creates choppy price action instead of clean trends.
What’s Next for BTC? $BTC Have a look
Bullish Scenario 📈
Reclaim $78,200–$78,300Hold above moving averagesNext target: $78,500 again
Bearish Scenario 📉
Lose support near $77,800Next possible zone: $77,300 – $77,500
Final Thoughts
This dip doesn’t necessarily mean a trend reversal—it’s more of a healthy pullback after rejection. Smart traders watch key levels instead of reacting emotionally.
In crypto, price moves fast—but structure always tells the story.
#BTC
#bitcoin
#crypttrading
187

·
--
Bearish
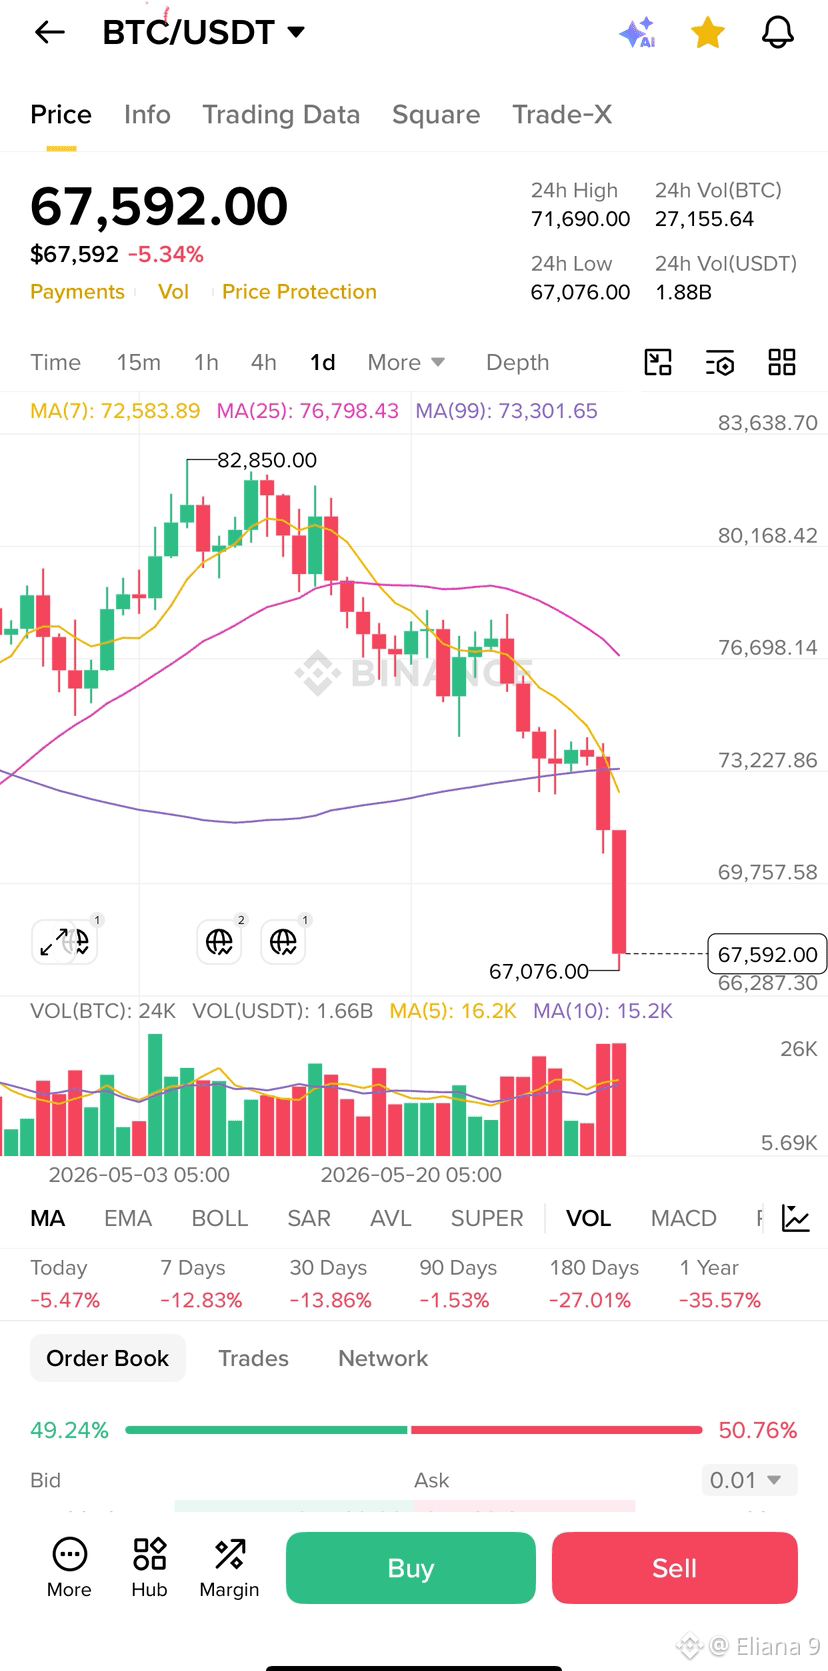
$BTC remains in a clear bearish trend, trading below key moving averages (MA7, MA25, MA99). Immediate support sits near 67,000, while resistance is around 69,750–73,200. Bias stays bearish unless price reclaims resistance zones. Wait for confirmation before considering any entry, as volatility remains elevated. $BTC #bitcoin #crypttrading
#BiananceFutures
$BTC
{spot}(BTCUSDT)
$BTC remains in a clear bearish trend, trading below key moving averages (MA7, MA25, MA99). Immediate support sits near 67,000, while resistance is around 69,750–73,200. Bias stays bearish unless price reclaims resistance zones. Wait for confirmation before considering any entry, as volatility remains elevated. $BTC #bitcoin #crypttrading
#BiananceFutures
$BTC
#BiananceFutures
$BTC
176
Log in to explore more content
Join global crypto users on Binance Square
⚡️ Get latest and useful information about crypto.
💬 Trusted by the world’s largest crypto exchange.
👍 Discover real insights from verified creators.
Email / Phone number
Trending Topics
1
#UniswapA16zSeekDeFiExemptionFromIllinoisCryptoTax
26,298 views
767 Discussing
2
#HKDollarStablecoinHKDAPToLaunchOnSolana
20,008 views
487 Discussing
3
#$1.5BInLeveragedCryptoBetsLiquidated
43,121 views
253 Discussing
4
#TrezorSaysCryptoBilisSoldWalletMayContainMaliciousComponents
3,359 views
72 Discussing
5
#KOSPIFalls3.53%BackBelow6000
63,639 views
1,097 Discussing
6
#AmazonSharesFallAbout7%InPremarketTrading
28,952 views
590 Discussing
7
#USMidtermElections
251,462 views
2,356 Discussing
8
#StrategySTRCReaches$99.95ForFirstTimeIn165Days
28,144 views
94 Discussing
9
#BinanceWillListPredictPREDICT
96,246 views
1,401 Discussing
10
#SwitzerlandFirstSpotBitcoinETFExpectedToTradeInNovember
3,203 views
111 Discussing