

#zecusdt
zecusdt
8.6M views
23,001 Discussing
Hot
Latest

·
--
$ZEC $ZEC — Analysis vs. Random Trading 📊
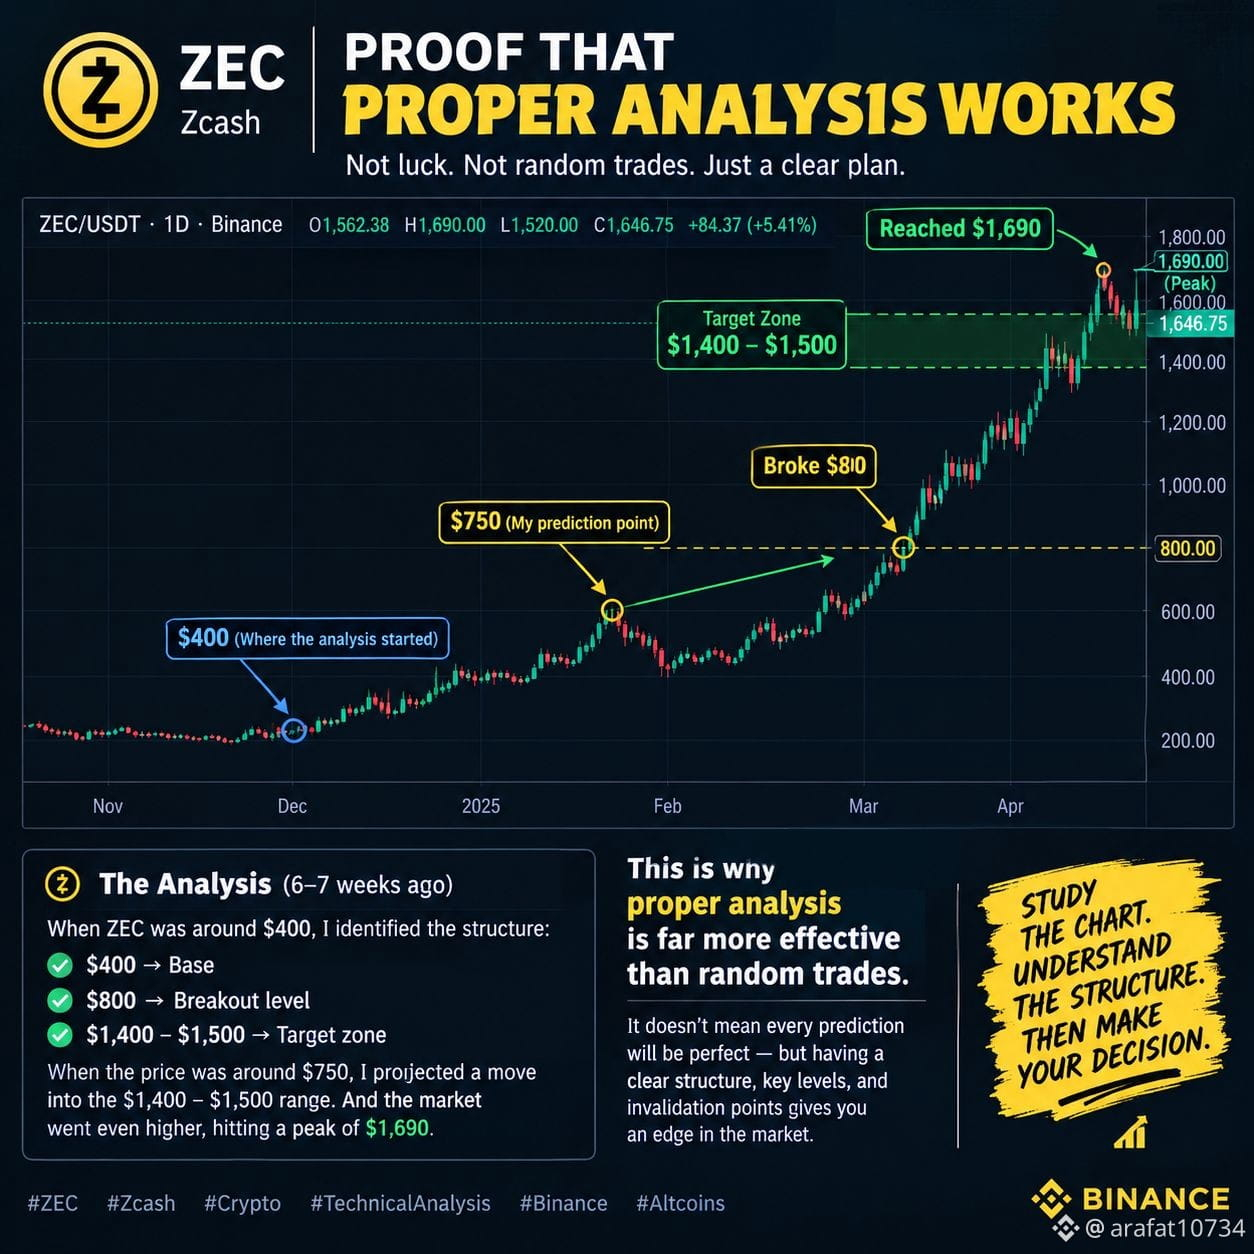
6–7 weeks ago, when ZEC was around $750, I projected a move toward $1,400–$1,500.
That analysis was built from the structure I identified when ZEC was around $400.
Then came the $800 breakout.
ZEC eventually reached a peak near $1,690 — well above the original target zone.
This is why I believe structured analysis matters.
Not every prediction will be perfect. But identifying key levels, breakouts, targets, and invalidation points is very different from entering random trades.
#ZEC #Zcash #Binance #Crypto #TechnicalAnalysis #altcoins #ZECUSDT #ZEC/USDT
$ZEC $ZEC — Analysis vs. Random Trading 📊
6–7 weeks ago, when ZEC was around $750, I projected a move toward $1,400–$1,500.
That analysis was built from the structure I identified when ZEC was around $400.
Then came the $800 breakout.
ZEC eventually reached a peak near $1,690 — well above the original target zone.
This is why I believe structured analysis matters.
Not every prediction will be perfect. But identifying key levels, breakouts, targets, and invalidation points is very different from entering random trades.
#ZEC #Zcash #Binance #Crypto #TechnicalAnalysis #altcoins #ZECUSDT #ZEC/USDT
6–7 weeks ago, when ZEC was around $750, I projected a move toward $1,400–$1,500.
That analysis was built from the structure I identified when ZEC was around $400.
Then came the $800 breakout.
ZEC eventually reached a peak near $1,690 — well above the original target zone.
This is why I believe structured analysis matters.
Not every prediction will be perfect. But identifying key levels, breakouts, targets, and invalidation points is very different from entering random trades.
#ZEC #Zcash #Binance #Crypto #TechnicalAnalysis #altcoins #ZECUSDT #ZEC/USDT
AngelOfCrypto_-:
nice
2
350

·
--
Bearish
$ZEC faced rejection at key overhead resistance and is forming lower highs on lower timeframes.
RSI cooling down from the overbought region with bearish momentum building up.
Looking for a clean rejection at resistance before scaling into the short position.
looking for opening short
DOOR
#ZECUSDT #BinanceSquare #CryptoSignals #FuturesTrading #Write2Earn #CryptoTrading $ZEC
$ZEC faced rejection at key overhead resistance and is forming lower highs on lower timeframes.
RSI cooling down from the overbought region with bearish momentum building up.
Looking for a clean rejection at resistance before scaling into the short position.
looking for opening short
DOOR
#ZECUSDT #BinanceSquare #CryptoSignals #FuturesTrading #Write2Earn #CryptoTrading $ZEC
RSI cooling down from the overbought region with bearish momentum building up.
Looking for a clean rejection at resistance before scaling into the short position.
looking for opening short
DOOR
#ZECUSDT #BinanceSquare #CryptoSignals #FuturesTrading #Write2Earn #CryptoTrading $ZEC
1
425

·
--
$ZEC Traders — Lost Money and Feel Like Giving Up?
One big loss can make you think:
“Maybe trading just isn’t for me.”
But before you quit—or jump into another trade to recover your loss—STOP.
$ZEC can make sharp moves, and volatility can work both ways.
The goal after a loss shouldn't be to win it back immediately.
Take a step back.
Review the trade.
Learn what went wrong.
Protect your remaining capital.
Sometimes the strongest move is simply not trading. 🧠
Your loss is a lesson.
Don’t let one bad trade become a bigger one.
👇 Have you ever wanted to quit trading after a major $ZEC loss?
#ZECUSDT #Binance
$ZEC Traders — Lost Money and Feel Like Giving Up?
One big loss can make you think:
“Maybe trading just isn’t for me.”
But before you quit—or jump into another trade to recover your loss—STOP.
$ZEC can make sharp moves, and volatility can work both ways.
The goal after a loss shouldn't be to win it back immediately.
Take a step back.
Review the trade.
Learn what went wrong.
Protect your remaining capital.
Sometimes the strongest move is simply not trading. 🧠
Your loss is a lesson.
Don’t let one bad trade become a bigger one.
👇 Have you ever wanted to quit trading after a major $ZEC loss?
#ZECUSDT #Binance
One big loss can make you think:
“Maybe trading just isn’t for me.”
But before you quit—or jump into another trade to recover your loss—STOP.
$ZEC can make sharp moves, and volatility can work both ways.
The goal after a loss shouldn't be to win it back immediately.
Take a step back.
Review the trade.
Learn what went wrong.
Protect your remaining capital.
Sometimes the strongest move is simply not trading. 🧠
Your loss is a lesson.
Don’t let one bad trade become a bigger one.
👇 Have you ever wanted to quit trading after a major $ZEC loss?
#ZECUSDT #Binance
1
155

$ZEC is showing bearish pressure 📉
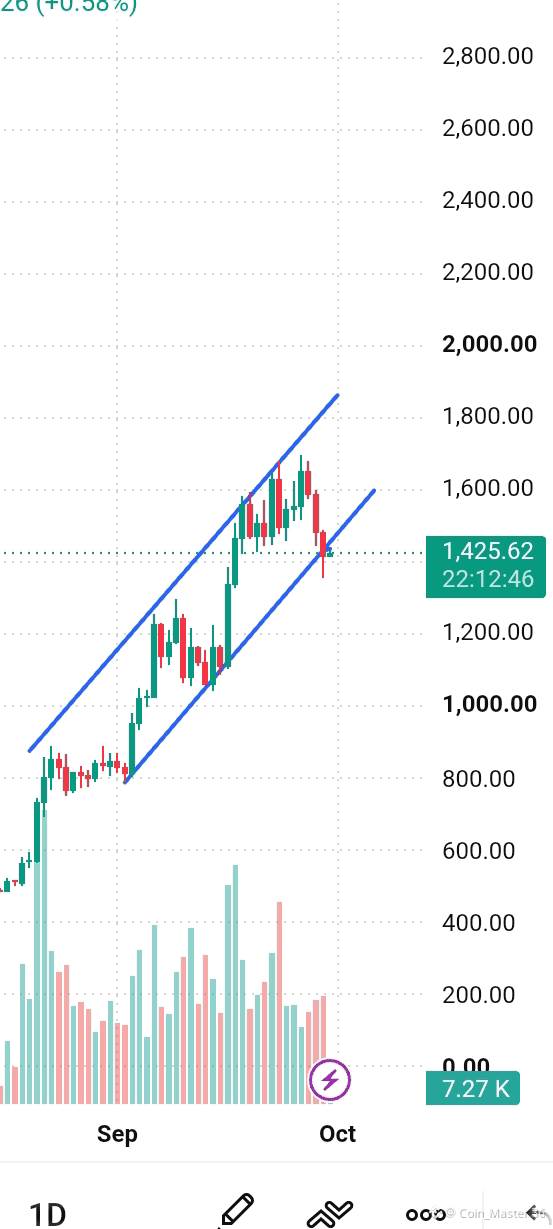
3 consecutive red candles after rejection from the upper channel. Price is now testing the lower channel support. A daily break below the channel could confirm further downside.
#zec #ZECUSDT #TechnicalAnalysiss #BinanceSquareCreatorA
$ZEC is showing bearish pressure 📉
3 consecutive red candles after rejection from the upper channel. Price is now testing the lower channel support. A daily break below the channel could confirm further downside.
#zec #ZECUSDT #TechnicalAnalysiss #BinanceSquareCreatorA
3 consecutive red candles after rejection from the upper channel. Price is now testing the lower channel support. A daily break below the channel could confirm further downside.
#zec #ZECUSDT #TechnicalAnalysiss #BinanceSquareCreatorA
222

·
--
🔥 $ZEC Takes a Sharp Breather! ⚡
📉 ZEC is around $1,390, down about 11% in 24 hours and 5% on the week. That follows a run near $1,565 on Sep 28, when the 24h high was about $1,674.
🚀 It's still a top Layer 1 performer this year, up roughly 2,138%, and technical ratings lean "buy" even with high volatility.
⚠️ Watch the $1,380–$1,400 zone: holding it keeps the bulls alive, while a break could bring deeper profit-taking. Not financial advice
#ZECUSDT #zec
Trade here for Coin $ZEC 👇
{future}(ZECUSDT)
🔥 $ZEC Takes a Sharp Breather! ⚡
📉 ZEC is around $1,390, down about 11% in 24 hours and 5% on the week. That follows a run near $1,565 on Sep 28, when the 24h high was about $1,674.
🚀 It's still a top Layer 1 performer this year, up roughly 2,138%, and technical ratings lean "buy" even with high volatility.
⚠️ Watch the $1,380–$1,400 zone: holding it keeps the bulls alive, while a break could bring deeper profit-taking. Not financial advice
#ZECUSDT #zec
Trade here for Coin $ZEC 👇
📉 ZEC is around $1,390, down about 11% in 24 hours and 5% on the week. That follows a run near $1,565 on Sep 28, when the 24h high was about $1,674.
🚀 It's still a top Layer 1 performer this year, up roughly 2,138%, and technical ratings lean "buy" even with high volatility.
⚠️ Watch the $1,380–$1,400 zone: holding it keeps the bulls alive, while a break could bring deeper profit-taking. Not financial advice
#ZECUSDT #zec
Trade here for Coin $ZEC 👇

344


·
--
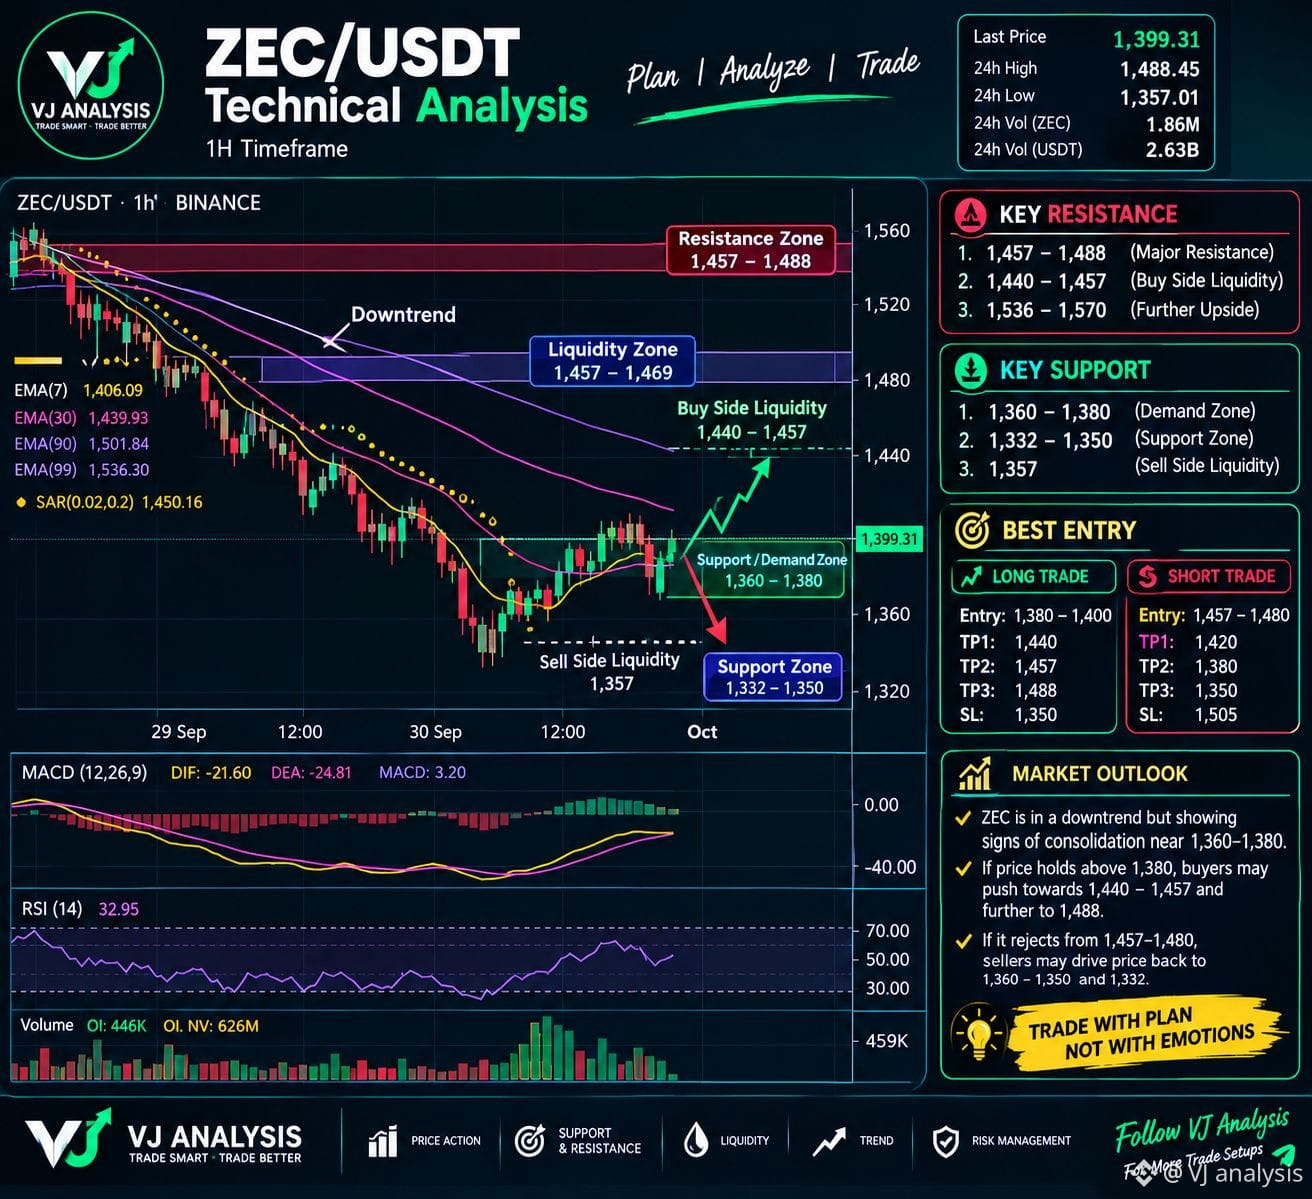
🚨 #ZECUSDT 1H TECHNICAL ANALYSIS 🚨
ZEC is currently trading around 1,399, with price consolidating near the 1,360–1,380 demand zone after a strong downtrend. Momentum is showing signs of stabilization, but confirmation is still important.
📌 KEY SUPPORT 🟢 1,360–1,380 — Demand zone
🔵 1,332–1,350 — Major support
⚠️ 1,357 — Sell-side liquidity
📌 KEY RESISTANCE 🔴 1,440–1,457 — First resistance / liquidity
🔥 1,457–1,488 — Major resistance
🎯 1,536–1,570 — Higher resistance zone
🟢 LONG SETUP Entry: 1,380–1,400
TP1: 1,440
TP2: 1,457
TP3: 1,488
SL: 1,350
🔴 SHORT SETUP Watch for rejection around 1,457–1,480
TP1: 1,420
TP2: 1,380
TP3: 1,350
SL: 1,505
📊 MARKET OUTLOOK ZEC remains in a broader downtrend, but consolidation around 1,360–1,380 could create a short-term recovery. Holding above 1,380 may open the path toward 1,440–1,457, while a breakout could target 1,488.
A rejection from 1,457–1,480 could bring sellers back toward 1,380 and potentially 1,332–1,350.
⚠️ Always wait for confirmation and manage risk carefully.
VJ ANALYSIS 📈
Trade Smart • Trade Better#zec
🚨 #ZECUSDT 1H TECHNICAL ANALYSIS 🚨
ZEC is currently trading around 1,399, with price consolidating near the 1,360–1,380 demand zone after a strong downtrend. Momentum is showing signs of stabilization, but confirmation is still important.
📌 KEY SUPPORT 🟢 1,360–1,380 — Demand zone
🔵 1,332–1,350 — Major support
⚠️ 1,357 — Sell-side liquidity
📌 KEY RESISTANCE 🔴 1,440–1,457 — First resistance / liquidity
🔥 1,457–1,488 — Major resistance
🎯 1,536–1,570 — Higher resistance zone
🟢 LONG SETUP Entry: 1,380–1,400
TP1: 1,440
TP2: 1,457
TP3: 1,488
SL: 1,350
🔴 SHORT SETUP Watch for rejection around 1,457–1,480
TP1: 1,420
TP2: 1,380
TP3: 1,350
SL: 1,505
📊 MARKET OUTLOOK ZEC remains in a broader downtrend, but consolidation around 1,360–1,380 could create a short-term recovery. Holding above 1,380 may open the path toward 1,440–1,457, while a breakout could target 1,488.
A rejection from 1,457–1,480 could bring sellers back toward 1,380 and potentially 1,332–1,350.
⚠️ Always wait for confirmation and manage risk carefully.
VJ ANALYSIS 📈
Trade Smart • Trade Better#zec
ZEC is currently trading around 1,399, with price consolidating near the 1,360–1,380 demand zone after a strong downtrend. Momentum is showing signs of stabilization, but confirmation is still important.
📌 KEY SUPPORT 🟢 1,360–1,380 — Demand zone
🔵 1,332–1,350 — Major support
⚠️ 1,357 — Sell-side liquidity
📌 KEY RESISTANCE 🔴 1,440–1,457 — First resistance / liquidity
🔥 1,457–1,488 — Major resistance
🎯 1,536–1,570 — Higher resistance zone
🟢 LONG SETUP Entry: 1,380–1,400
TP1: 1,440
TP2: 1,457
TP3: 1,488
SL: 1,350
🔴 SHORT SETUP Watch for rejection around 1,457–1,480
TP1: 1,420
TP2: 1,380
TP3: 1,350
SL: 1,505
📊 MARKET OUTLOOK ZEC remains in a broader downtrend, but consolidation around 1,360–1,380 could create a short-term recovery. Holding above 1,380 may open the path toward 1,440–1,457, while a breakout could target 1,488.
A rejection from 1,457–1,480 could bring sellers back toward 1,380 and potentially 1,332–1,350.
⚠️ Always wait for confirmation and manage risk carefully.
VJ ANALYSIS 📈
Trade Smart • Trade Better#zec
421
·
--
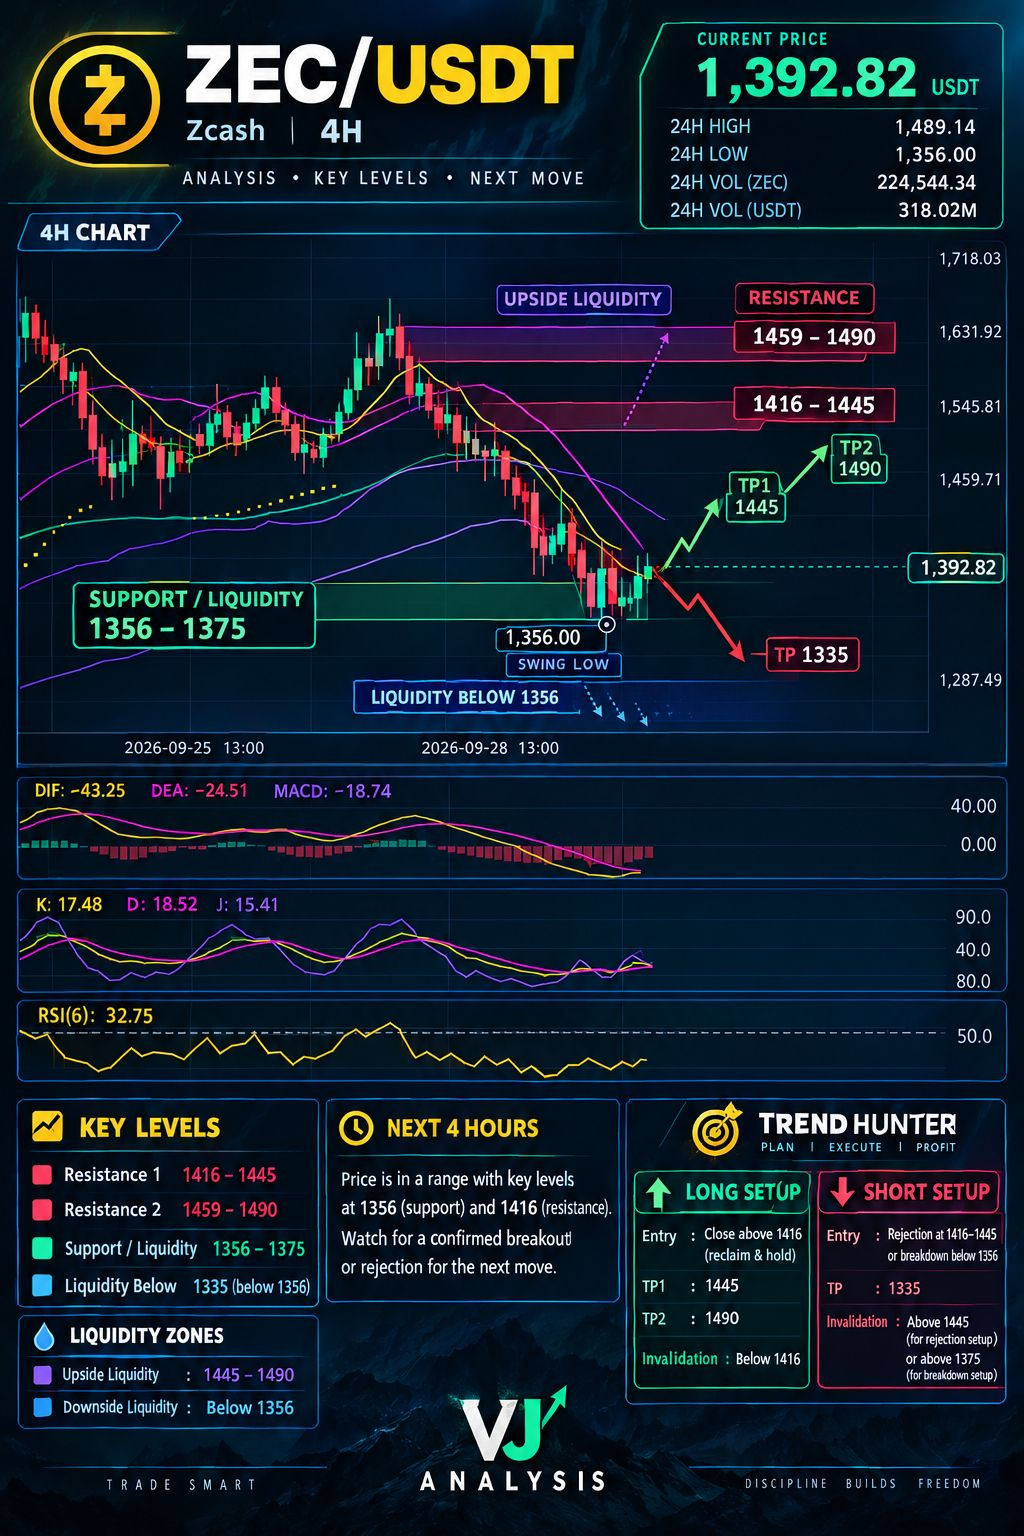
📊 #ZECUSDT — 4H TREND HUNTER UPDATE ⚡#zec
💰 Current Price: 1,392.82 USDT
📉 24H Change: -4.88%
🔻 24H Low: 1,356
🔺 24H High: 1,489
ZEC is currently trading near a major support & liquidity zone around 1,356–1,375. Price has shown a sharp sell-off from the 1,698 area, so the next 4 hours could be important for determining whether buyers can reclaim higher levels or sellers continue the breakdown.
🟢 LONG SETUP
Watch for a confirmed reclaim and hold above 1,416.
🎯 TP1: 1,445
🎯 TP2: 1,490
⚠️ Invalidation: below 1,416 after failed reclaim.
🔴 SHORT SETUP
A rejection around 1,416–1,445 may provide a bearish setup.
Alternatively, a confirmed breakdown below 1,356 could expose lower liquidity.
🎯 TP: 1,335
⚠️ Manage risk carefully around the support zone.
💧 Liquidity Map:
⬆️ Upside liquidity: 1,445–1,490
⬇️ Downside liquidity: Below 1,356
📌 Momentum: MACD remains bearish, while RSI is around 33, showing weak momentum and proximity to oversold conditions.
🔥 NEXT 4 HOURS:
Wait for confirmation. Don’t chase the middle of the range. Let price show whether 1,356 support holds or 1,416 resistance breaks.
⚔️ VJ ANALYSIS | TRADE SMART | MANAGE RISK #zec
📊 #ZECUSDT — 4H TREND HUNTER UPDATE ⚡#zec
💰 Current Price: 1,392.82 USDT
📉 24H Change: -4.88%
🔻 24H Low: 1,356
🔺 24H High: 1,489
ZEC is currently trading near a major support & liquidity zone around 1,356–1,375. Price has shown a sharp sell-off from the 1,698 area, so the next 4 hours could be important for determining whether buyers can reclaim higher levels or sellers continue the breakdown.
🟢 LONG SETUP
Watch for a confirmed reclaim and hold above 1,416.
🎯 TP1: 1,445
🎯 TP2: 1,490
⚠️ Invalidation: below 1,416 after failed reclaim.
🔴 SHORT SETUP
A rejection around 1,416–1,445 may provide a bearish setup.
Alternatively, a confirmed breakdown below 1,356 could expose lower liquidity.
🎯 TP: 1,335
⚠️ Manage risk carefully around the support zone.
💧 Liquidity Map:
⬆️ Upside liquidity: 1,445–1,490
⬇️ Downside liquidity: Below 1,356
📌 Momentum: MACD remains bearish, while RSI is around 33, showing weak momentum and proximity to oversold conditions.
🔥 NEXT 4 HOURS:
Wait for confirmation. Don’t chase the middle of the range. Let price show whether 1,356 support holds or 1,416 resistance breaks.
⚔️ VJ ANALYSIS | TRADE SMART | MANAGE RISK #zec
💰 Current Price: 1,392.82 USDT
📉 24H Change: -4.88%
🔻 24H Low: 1,356
🔺 24H High: 1,489
ZEC is currently trading near a major support & liquidity zone around 1,356–1,375. Price has shown a sharp sell-off from the 1,698 area, so the next 4 hours could be important for determining whether buyers can reclaim higher levels or sellers continue the breakdown.
🟢 LONG SETUP
Watch for a confirmed reclaim and hold above 1,416.
🎯 TP1: 1,445
🎯 TP2: 1,490
⚠️ Invalidation: below 1,416 after failed reclaim.
🔴 SHORT SETUP
A rejection around 1,416–1,445 may provide a bearish setup.
Alternatively, a confirmed breakdown below 1,356 could expose lower liquidity.
🎯 TP: 1,335
⚠️ Manage risk carefully around the support zone.
💧 Liquidity Map:
⬆️ Upside liquidity: 1,445–1,490
⬇️ Downside liquidity: Below 1,356
📌 Momentum: MACD remains bearish, while RSI is around 33, showing weak momentum and proximity to oversold conditions.
🔥 NEXT 4 HOURS:
Wait for confirmation. Don’t chase the middle of the range. Let price show whether 1,356 support holds or 1,416 resistance breaks.
⚔️ VJ ANALYSIS | TRADE SMART | MANAGE RISK #zec
1
403

·
--
$ZEC Zcash (ZEC) has entered a correction phase after its rally. Selling pressure stands out on the chart, and the price has pulled back from its previous high toward the support zone. Pullbacks like this can also be seen as a healthy breather after a strong uptrend.
The key point to watch is whether the price can hold its support level. If support holds, a recovery attempt may follow; if it breaks down, the correction could deepen.#ZECUSDT #BTC☀️
$ZEC Zcash (ZEC) has entered a correction phase after its rally. Selling pressure stands out on the chart, and the price has pulled back from its previous high toward the support zone. Pullbacks like this can also be seen as a healthy breather after a strong uptrend.
The key point to watch is whether the price can hold its support level. If support holds, a recovery attempt may follow; if it breaks down, the correction could deepen.#ZECUSDT #BTC☀️
The key point to watch is whether the price can hold its support level. If support holds, a recovery attempt may follow; if it breaks down, the correction could deepen.#ZECUSDT #BTC☀️
1
312

·
--
#zec
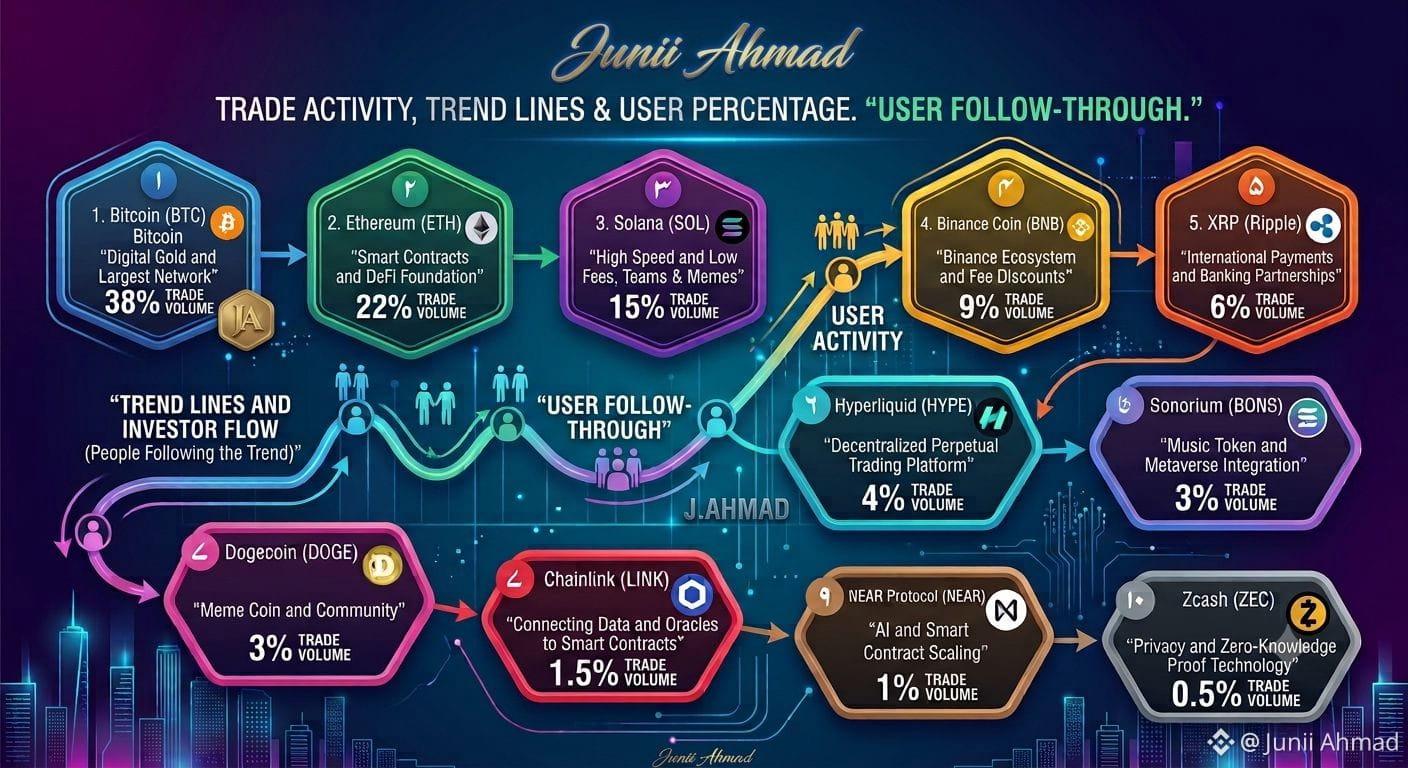
"Let's talk crypto! This graph highlights the market leaders from the past three months.
I'm curious: of all the coins listed here, which one generated the best return for you? Drop your profit story or opinion in the comments below.
My pick from this list has to be number 10: $ZEC . What do you think?"
#OpenAIDelaysGPT6.1OverSafetyIssues #JapanFSABacksFourthStablecoinTradeSettlementPilot #ZECUSDT
#zec
"Let's talk crypto! This graph highlights the market leaders from the past three months.
I'm curious: of all the coins listed here, which one generated the best return for you? Drop your profit story or opinion in the comments below.
My pick from this list has to be number 10: $ZEC . What do you think?"
#OpenAIDelaysGPT6.1OverSafetyIssues #JapanFSABacksFourthStablecoinTradeSettlementPilot #ZECUSDT
"Let's talk crypto! This graph highlights the market leaders from the past three months.
I'm curious: of all the coins listed here, which one generated the best return for you? Drop your profit story or opinion in the comments below.
My pick from this list has to be number 10: $ZEC . What do you think?"
#OpenAIDelaysGPT6.1OverSafetyIssues #JapanFSABacksFourthStablecoinTradeSettlementPilot #ZECUSDT
159

·
--
Bearish
🚨 Why did $ZEC fall so hard today when Bitcoin barely moved?
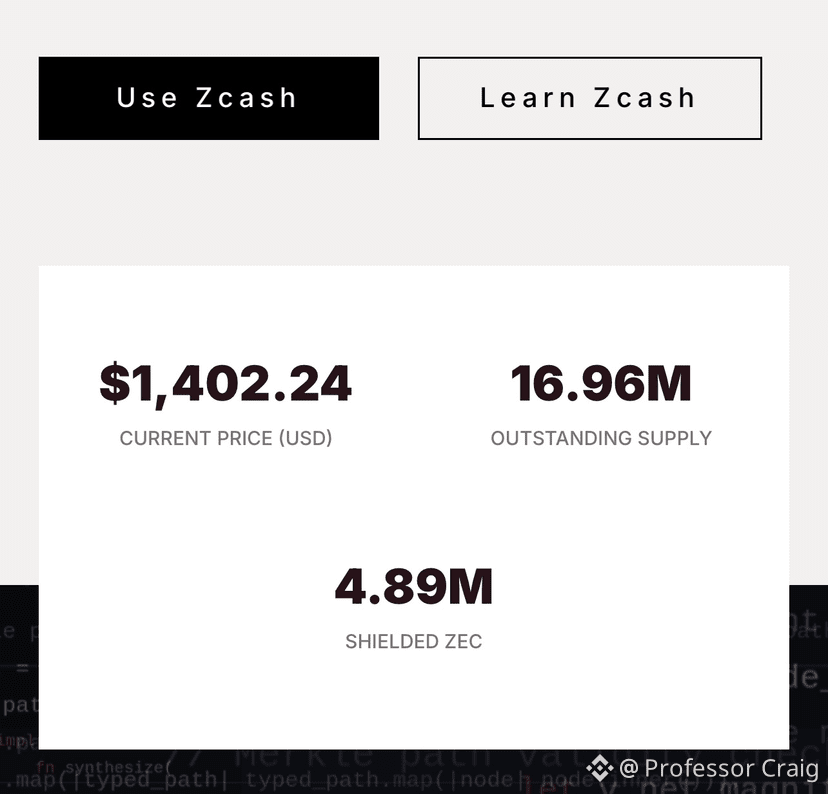
⏬ Zcash just experienced one of the sharpest pullbacks of its recent rally, dropping around 10% as the market suddenly shifted from aggressive buying to heavy profit-taking. The move wasn’t simply a normal altcoin correction leverage made the decline much more violent. During the sharpest part of the move, more than $10 million in ZEC long positions were liquidated across Binance, Bybit and OKX, with almost all of that liquidation coming from longs.
The technical breakdown added fuel. Once $ZEC lost the $1,400 area, traders who were positioned for another continuation move were forced to reassess their positions. Price eventually reached the $1,356–$1,380 region, where significant liquidation levels were clustered, creating the possibility of another wave of forced selling if support fails. (TokenPost)
The interesting part is that this doesn’t automatically mean the larger Zcash institutional story has disappeared. Grayscale’s ETF had accumulated more than $300M in net inflows since launch, showing how strong the broader demand had been before this correction.
Now the key question is whether $ZEC can stabilize around $1,360–$1,380. Holding that zone could allow the market to absorb the leverage flush and attempt a recovery. But if sellers push decisively below it, $1,300 becomes an important downside area to watch. The next ETF flow data and ZEC’s reaction around support could tell us whether this was simply a leverage driven reset or the beginning of a deeper correction.
#whyzecwentdown #ZECBreakdown #ZECUSDT
🚨 Why did $ZEC fall so hard today when Bitcoin barely moved?
⏬ Zcash just experienced one of the sharpest pullbacks of its recent rally, dropping around 10% as the market suddenly shifted from aggressive buying to heavy profit-taking. The move wasn’t simply a normal altcoin correction leverage made the decline much more violent. During the sharpest part of the move, more than $10 million in ZEC long positions were liquidated across Binance, Bybit and OKX, with almost all of that liquidation coming from longs.
The technical breakdown added fuel. Once $ZEC lost the $1,400 area, traders who were positioned for another continuation move were forced to reassess their positions. Price eventually reached the $1,356–$1,380 region, where significant liquidation levels were clustered, creating the possibility of another wave of forced selling if support fails. (TokenPost)
The interesting part is that this doesn’t automatically mean the larger Zcash institutional story has disappeared. Grayscale’s ETF had accumulated more than $300M in net inflows since launch, showing how strong the broader demand had been before this correction.
Now the key question is whether $ZEC can stabilize around $1,360–$1,380. Holding that zone could allow the market to absorb the leverage flush and attempt a recovery. But if sellers push decisively below it, $1,300 becomes an important downside area to watch. The next ETF flow data and ZEC’s reaction around support could tell us whether this was simply a leverage driven reset or the beginning of a deeper correction.
#whyzecwentdown #ZECBreakdown #ZECUSDT
⏬ Zcash just experienced one of the sharpest pullbacks of its recent rally, dropping around 10% as the market suddenly shifted from aggressive buying to heavy profit-taking. The move wasn’t simply a normal altcoin correction leverage made the decline much more violent. During the sharpest part of the move, more than $10 million in ZEC long positions were liquidated across Binance, Bybit and OKX, with almost all of that liquidation coming from longs.
The technical breakdown added fuel. Once $ZEC lost the $1,400 area, traders who were positioned for another continuation move were forced to reassess their positions. Price eventually reached the $1,356–$1,380 region, where significant liquidation levels were clustered, creating the possibility of another wave of forced selling if support fails. (TokenPost)
The interesting part is that this doesn’t automatically mean the larger Zcash institutional story has disappeared. Grayscale’s ETF had accumulated more than $300M in net inflows since launch, showing how strong the broader demand had been before this correction.
Now the key question is whether $ZEC can stabilize around $1,360–$1,380. Holding that zone could allow the market to absorb the leverage flush and attempt a recovery. But if sellers push decisively below it, $1,300 becomes an important downside area to watch. The next ETF flow data and ZEC’s reaction around support could tell us whether this was simply a leverage driven reset or the beginning of a deeper correction.
#whyzecwentdown #ZECBreakdown #ZECUSDT
CryptoBegger:
@BiBi Fact Check this content
3
2
83
·
--
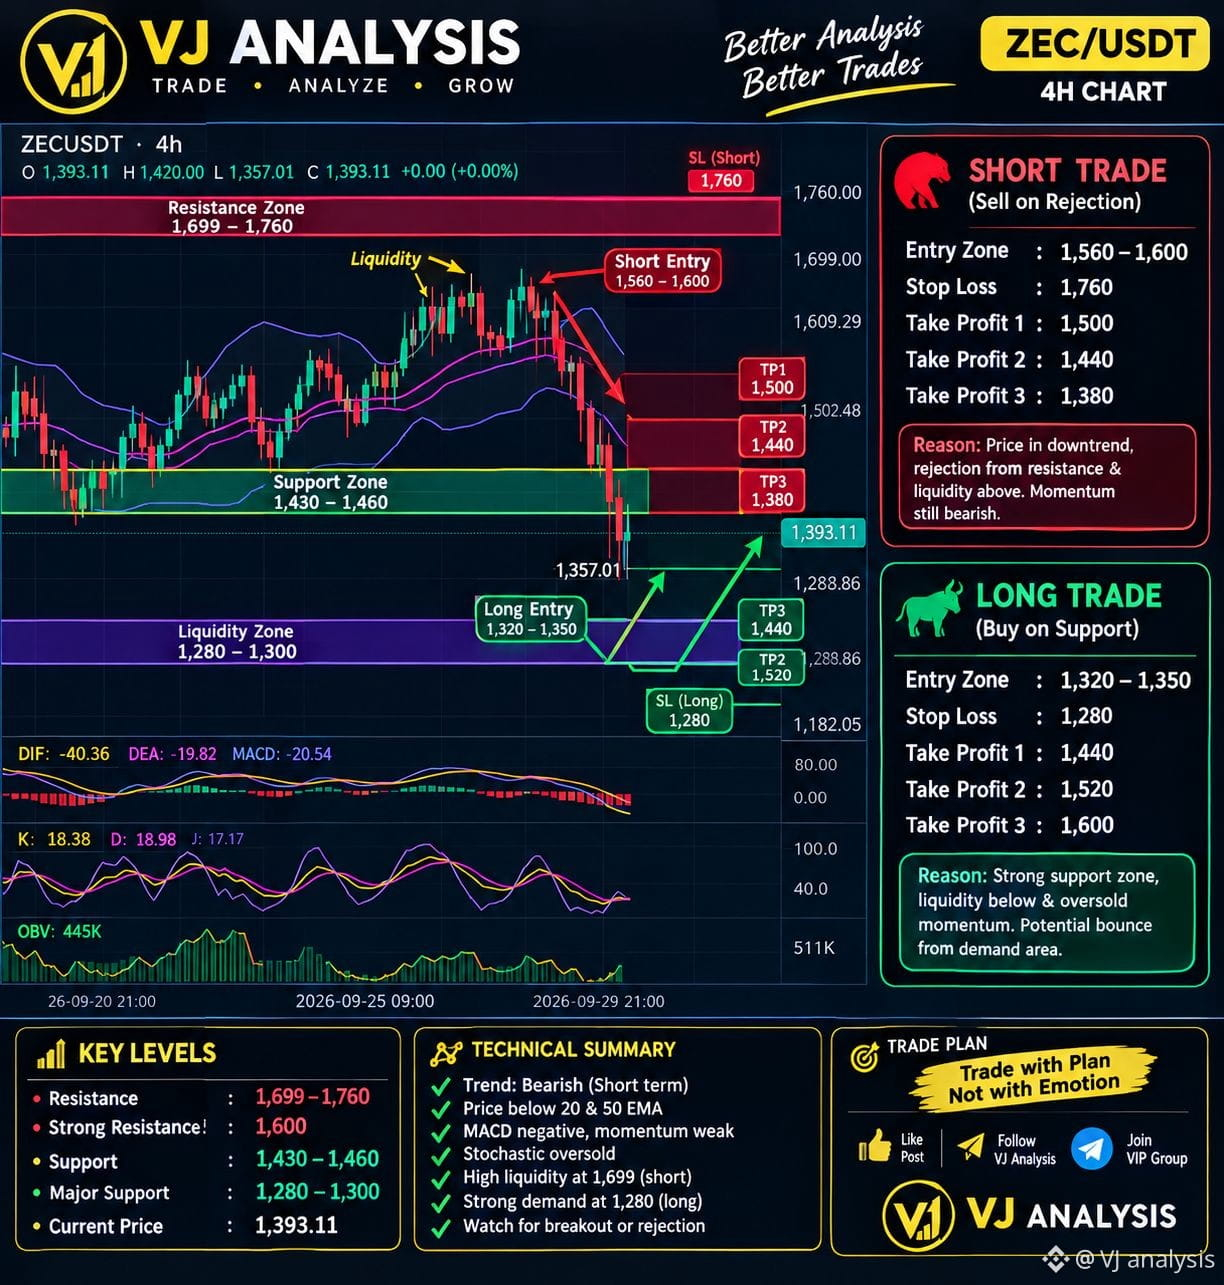
📊 #ZECUSDT 4H TECHNICAL ANALYSIS | VJ ANALYSIS
🔥 Current Price: 1,393.11 #zec
ZEC is showing strong bearish pressure on the 4H chart after a sharp rejection from the upper resistance/liquidity area. Price has fallen aggressively and is currently trading below several key moving averages, while MACD remains negative. This keeps the short-term structure bearish, although the market is approaching an important demand zone where a relief bounce can develop.
🔴 SHORT SETUP — SELL ON REJECTION
📍 Entry Zone: 1,560 – 1,600
🛑 Stop Loss: 1,760
🎯 TP1: 1,500
🎯 TP2: 1,440
🎯 TP3: 1,380
The short setup focuses on a possible retracement into resistance followed by rejection. The 1,600 area is important, while the larger liquidity/resistance zone sits around 1,699–1,760.
🟢 LONG SETUP — BUY FROM SUPPORT
📍 Entry Zone: 1,320 – 1,350
🛑 Stop Loss: 1,280
🎯 TP1: 1,440
🎯 TP2: 1,520
🎯 TP3: 1,600
The long idea is based on a potential reaction from the 1,280–1,350 demand/liquidity region. Stochastic is near oversold territory, so a bounce is possible if buyers defend this area and price confirms a reversal.
💧 KEY LIQUIDITY LEVELS
🔴 Resistance: 1,699 – 1,760
🟠 Major Resistance: 1,600
🟡 Support: 1,430 – 1,460
🟢 Major Support: 1,280 – 1,300
⚠️ MARKET STRUCTURE
MACD remains bearish, momentum is weak, and price is below key averages. However, chasing shorts directly into support carries additional risk. Wait for confirmation such as rejection, breakout/retest, or a strong reversal candle before entering.
📌 VJ ANALYSIS TRADE PLAN
Trade the levels, not emotions. Keep risk controlled, use proper position sizing, and protect capital with a defined stop loss.
🚨 Educational market analysis — not financial advice. Always confirm levels with live price action before trading.
VJ ANALYSIS | TRADE • ANALYZE • GROW #ZEC
📊 #ZECUSDT 4H TECHNICAL ANALYSIS | VJ ANALYSIS
🔥 Current Price: 1,393.11 #zec
ZEC is showing strong bearish pressure on the 4H chart after a sharp rejection from the upper resistance/liquidity area. Price has fallen aggressively and is currently trading below several key moving averages, while MACD remains negative. This keeps the short-term structure bearish, although the market is approaching an important demand zone where a relief bounce can develop.
🔴 SHORT SETUP — SELL ON REJECTION
📍 Entry Zone: 1,560 – 1,600
🛑 Stop Loss: 1,760
🎯 TP1: 1,500
🎯 TP2: 1,440
🎯 TP3: 1,380
The short setup focuses on a possible retracement into resistance followed by rejection. The 1,600 area is important, while the larger liquidity/resistance zone sits around 1,699–1,760.
🟢 LONG SETUP — BUY FROM SUPPORT
📍 Entry Zone: 1,320 – 1,350
🛑 Stop Loss: 1,280
🎯 TP1: 1,440
🎯 TP2: 1,520
🎯 TP3: 1,600
The long idea is based on a potential reaction from the 1,280–1,350 demand/liquidity region. Stochastic is near oversold territory, so a bounce is possible if buyers defend this area and price confirms a reversal.
💧 KEY LIQUIDITY LEVELS
🔴 Resistance: 1,699 – 1,760
🟠 Major Resistance: 1,600
🟡 Support: 1,430 – 1,460
🟢 Major Support: 1,280 – 1,300
⚠️ MARKET STRUCTURE
MACD remains bearish, momentum is weak, and price is below key averages. However, chasing shorts directly into support carries additional risk. Wait for confirmation such as rejection, breakout/retest, or a strong reversal candle before entering.
📌 VJ ANALYSIS TRADE PLAN
Trade the levels, not emotions. Keep risk controlled, use proper position sizing, and protect capital with a defined stop loss.
🚨 Educational market analysis — not financial advice. Always confirm levels with live price action before trading.
VJ ANALYSIS | TRADE • ANALYZE • GROW #ZEC
🔥 Current Price: 1,393.11 #zec
ZEC is showing strong bearish pressure on the 4H chart after a sharp rejection from the upper resistance/liquidity area. Price has fallen aggressively and is currently trading below several key moving averages, while MACD remains negative. This keeps the short-term structure bearish, although the market is approaching an important demand zone where a relief bounce can develop.
🔴 SHORT SETUP — SELL ON REJECTION
📍 Entry Zone: 1,560 – 1,600
🛑 Stop Loss: 1,760
🎯 TP1: 1,500
🎯 TP2: 1,440
🎯 TP3: 1,380
The short setup focuses on a possible retracement into resistance followed by rejection. The 1,600 area is important, while the larger liquidity/resistance zone sits around 1,699–1,760.
🟢 LONG SETUP — BUY FROM SUPPORT
📍 Entry Zone: 1,320 – 1,350
🛑 Stop Loss: 1,280
🎯 TP1: 1,440
🎯 TP2: 1,520
🎯 TP3: 1,600
The long idea is based on a potential reaction from the 1,280–1,350 demand/liquidity region. Stochastic is near oversold territory, so a bounce is possible if buyers defend this area and price confirms a reversal.
💧 KEY LIQUIDITY LEVELS
🔴 Resistance: 1,699 – 1,760
🟠 Major Resistance: 1,600
🟡 Support: 1,430 – 1,460
🟢 Major Support: 1,280 – 1,300
⚠️ MARKET STRUCTURE
MACD remains bearish, momentum is weak, and price is below key averages. However, chasing shorts directly into support carries additional risk. Wait for confirmation such as rejection, breakout/retest, or a strong reversal candle before entering.
📌 VJ ANALYSIS TRADE PLAN
Trade the levels, not emotions. Keep risk controlled, use proper position sizing, and protect capital with a defined stop loss.
🚨 Educational market analysis — not financial advice. Always confirm levels with live price action before trading.
VJ ANALYSIS | TRADE • ANALYZE • GROW #ZEC
324

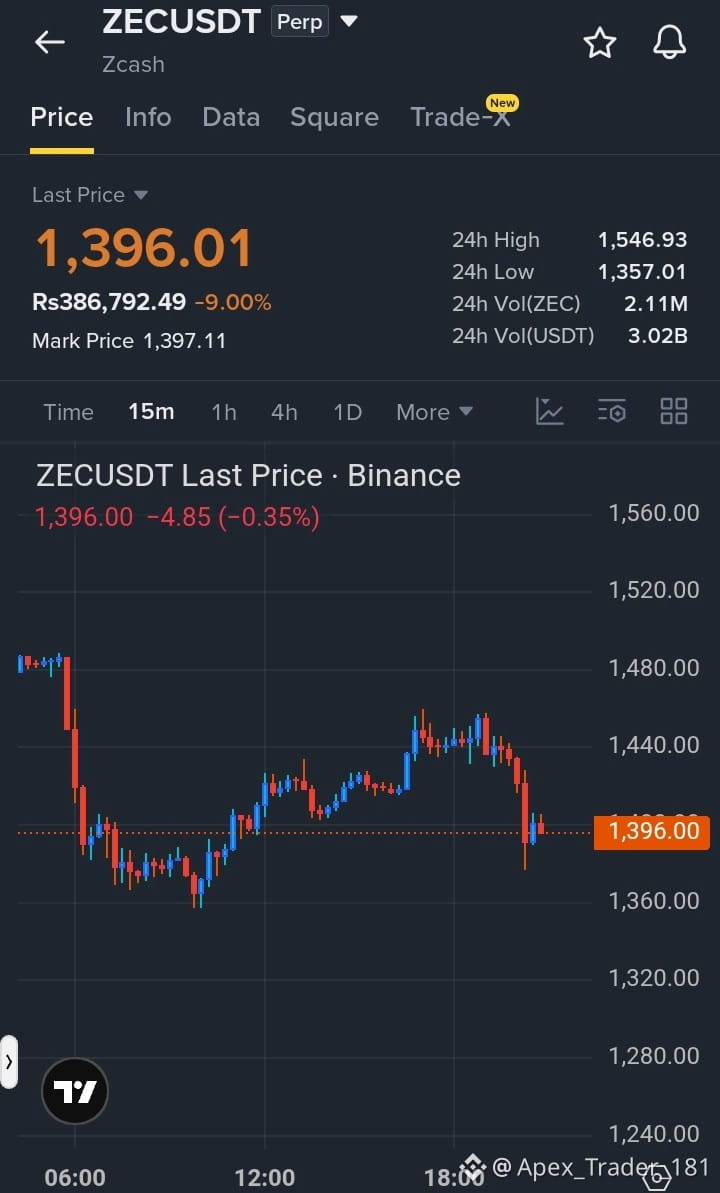

·
--
Bearish
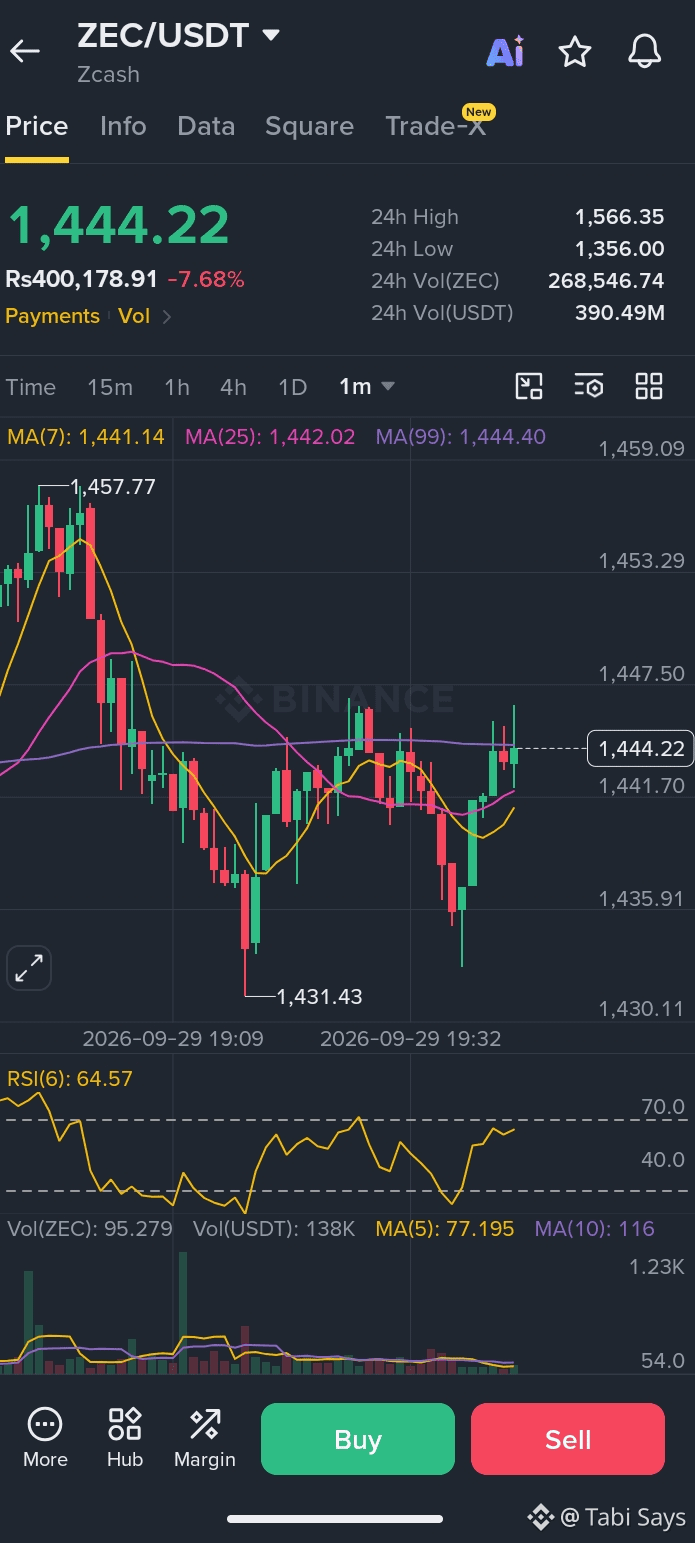
ZEC Live Price: $1,441 $ZEC
- Aaj ka High: $1,563
- Low: $1,356
- 24h me -7.8% down hai
*Agar already hold hai to*
Stop Loss: $1,320
Target 1: $1,520
Target 2: $1,600
Target 3: $1,697
*Short karna hai to*
Entry: $1,440 - $1,460
Target 1: $1,360
Target 2: $1,280
Stop Loss: $1,580
#ZECUSDT #EarningsSeason #ECBToTestAIAgentsInDigitalEuroPayments #Analsis
ZEC Live Price: $1,441 $ZEC
- Aaj ka High: $1,563
- Low: $1,356
- 24h me -7.8% down hai
*Agar already hold hai to*
Stop Loss: $1,320
Target 1: $1,520
Target 2: $1,600
Target 3: $1,697
*Short karna hai to*
Entry: $1,440 - $1,460
Target 1: $1,360
Target 2: $1,280
Stop Loss: $1,580
#ZECUSDT #EarningsSeason #ECBToTestAIAgentsInDigitalEuroPayments #Analsis
- Aaj ka High: $1,563
- Low: $1,356
- 24h me -7.8% down hai
*Agar already hold hai to*
Stop Loss: $1,320
Target 1: $1,520
Target 2: $1,600
Target 3: $1,697
*Short karna hai to*
Entry: $1,440 - $1,460
Target 1: $1,360
Target 2: $1,280
Stop Loss: $1,580
#ZECUSDT #EarningsSeason #ECBToTestAIAgentsInDigitalEuroPayments #Analsis
Moiz6690:
contect kese kiya jae ap se
4
226

·
--

Article
ZEC Hit $1,698 Before Pulling Back: Is the Privacy Bull Run Just Getting Started?Let’s be honest — nobody was paying attention to Zcash (ZEC) a couple of months ago. It was sitting in the "dinosaur privacy coin" bucket while memecoins and shiny new L1s took all the clout.
Then out of nowhere, ZEC pulled off a massive +72% rally over the past 30 days, briefly tagging a high near $1,698 before cooling down around the $1,447 mark.
Now the timeline is split: half of Crypto Twitter is calling for a full privacy sector revival, while the other half is convinced it's an overextended pump ready to dump.
So what’s really going on under the hood? Let's cut through the noise.
The Reality Check: Is Privacy Back in Trend?
Privacy narrative shifts happen fast in crypto. Whenever regulatory pressure or financial surveillance heats up, traders suddenly remember why zero-knowledge technology was built in the first place.
However, price action doesn't lie. After touching that $1,698 local peak, ZEC has started to show signs of short-term fatigue:
Short-Term Cool-Down: A brief daily dip and a short-term bearish MACD crossover indicate that buyers are catching their breath and taking profits.
Institutional / Large Order Flow: Net flow from larger orders has tilted slightly negative short-term as smart money locks in gains.
Macro Trend Still Alive: Despite the local pullback, ZEC is still holding firmly above its key moving averages (like MA25 and MA99). The broader bullish market structure hasn't broken yet — it’s being tested.
Is It Too Late to Jump In?
This is the question every retail trader asks after a massive move: Did I miss the boat?
Chasing green candles after a +70% monthly run is historically a quick way to get rekt. Right now, the market is conducting a stress test: it’s checking whether there is real, organic spot demand to absorb profit-taking, or if this momentum was purely leverage-driven.
If $ZEC manages to consolidate and defend its key support zones during this cool-off phase, it proves that market interest in privacy assets is structural, not just speculative noise. If support cracks, expect a deeper shakeout before any healthy continuation.
The Bottom Line
The story around Zcash right now isn't just about technical indicators; it’s about narrative conviction. Is privacy tech making a true comeback, or was this just a quick rotational pump?
⚡ Trader Takeaway: Don't let FOMO make decisions for you. Watch how price holds around key moving average supports.
#zec #crypto #ZECUSDT
{future}(ZECUSDT)
ZEC Hit $1,698 Before Pulling Back: Is the Privacy Bull Run Just Getting Started?
Let’s be honest — nobody was paying attention to Zcash (ZEC) a couple of months ago. It was sitting in the "dinosaur privacy coin" bucket while memecoins and shiny new L1s took all the clout.
Then out of nowhere, ZEC pulled off a massive +72% rally over the past 30 days, briefly tagging a high near $1,698 before cooling down around the $1,447 mark.
Now the timeline is split: half of Crypto Twitter is calling for a full privacy sector revival, while the other half is convinced it's an overextended pump ready to dump.
So what’s really going on under the hood? Let's cut through the noise.
The Reality Check: Is Privacy Back in Trend?
Privacy narrative shifts happen fast in crypto. Whenever regulatory pressure or financial surveillance heats up, traders suddenly remember why zero-knowledge technology was built in the first place.
However, price action doesn't lie. After touching that $1,698 local peak, ZEC has started to show signs of short-term fatigue:
Short-Term Cool-Down: A brief daily dip and a short-term bearish MACD crossover indicate that buyers are catching their breath and taking profits.
Institutional / Large Order Flow: Net flow from larger orders has tilted slightly negative short-term as smart money locks in gains.
Macro Trend Still Alive: Despite the local pullback, ZEC is still holding firmly above its key moving averages (like MA25 and MA99). The broader bullish market structure hasn't broken yet — it’s being tested.
Is It Too Late to Jump In?
This is the question every retail trader asks after a massive move: Did I miss the boat?
Chasing green candles after a +70% monthly run is historically a quick way to get rekt. Right now, the market is conducting a stress test: it’s checking whether there is real, organic spot demand to absorb profit-taking, or if this momentum was purely leverage-driven.
If $ZEC manages to consolidate and defend its key support zones during this cool-off phase, it proves that market interest in privacy assets is structural, not just speculative noise. If support cracks, expect a deeper shakeout before any healthy continuation.
The Bottom Line
The story around Zcash right now isn't just about technical indicators; it’s about narrative conviction. Is privacy tech making a true comeback, or was this just a quick rotational pump?
⚡ Trader Takeaway: Don't let FOMO make decisions for you. Watch how price holds around key moving average supports.
#zec #crypto #ZECUSDT
Then out of nowhere, ZEC pulled off a massive +72% rally over the past 30 days, briefly tagging a high near $1,698 before cooling down around the $1,447 mark.
Now the timeline is split: half of Crypto Twitter is calling for a full privacy sector revival, while the other half is convinced it's an overextended pump ready to dump.
So what’s really going on under the hood? Let's cut through the noise.
The Reality Check: Is Privacy Back in Trend?
Privacy narrative shifts happen fast in crypto. Whenever regulatory pressure or financial surveillance heats up, traders suddenly remember why zero-knowledge technology was built in the first place.
However, price action doesn't lie. After touching that $1,698 local peak, ZEC has started to show signs of short-term fatigue:
Short-Term Cool-Down: A brief daily dip and a short-term bearish MACD crossover indicate that buyers are catching their breath and taking profits.
Institutional / Large Order Flow: Net flow from larger orders has tilted slightly negative short-term as smart money locks in gains.
Macro Trend Still Alive: Despite the local pullback, ZEC is still holding firmly above its key moving averages (like MA25 and MA99). The broader bullish market structure hasn't broken yet — it’s being tested.
Is It Too Late to Jump In?
This is the question every retail trader asks after a massive move: Did I miss the boat?
Chasing green candles after a +70% monthly run is historically a quick way to get rekt. Right now, the market is conducting a stress test: it’s checking whether there is real, organic spot demand to absorb profit-taking, or if this momentum was purely leverage-driven.
If $ZEC manages to consolidate and defend its key support zones during this cool-off phase, it proves that market interest in privacy assets is structural, not just speculative noise. If support cracks, expect a deeper shakeout before any healthy continuation.
The Bottom Line
The story around Zcash right now isn't just about technical indicators; it’s about narrative conviction. Is privacy tech making a true comeback, or was this just a quick rotational pump?
⚡ Trader Takeaway: Don't let FOMO make decisions for you. Watch how price holds around key moving average supports.
#zec #crypto #ZECUSDT
249

ZEC just busted a higher low and is eyeing the 60‑minute swing high.
🟢 $ZEC LONG 📈 — Trade Plan
• Entry: $1,448.63 – $1,451.53
• Stop: $1,406.58 (-3.0%)
• Target 1: $1,471.83 (+1.5%)
• Target 2: $1,522.58 (+5.0%)
• R/R 1:1.7 | Confidence 64%
The CHoCH on the 15‑min chart gave us the entry cue, backed by a bullish CVD spike, a fresh FVG and a solid OB right under the price. The POI confluence of that OB overlapping the FVG seals the trade, showing the market re‑establishing upside momentum.
A 3 % stop is pretty tight, so keep leverage around 2‑3× to stay safe.
Take half off the table at the first 1.5 % target.
Not financial advice — trade only what you can afford to lose 🙏
$ZEC #ZECUSDT #ChinaMayLetAlibabaByteDanceBuyNvidiaChips #TradingSignals #Write2Earn
ZEC just busted a higher low and is eyeing the 60‑minute swing high.
🟢 $ZEC LONG 📈 — Trade Plan
• Entry: $1,448.63 – $1,451.53
• Stop: $1,406.58 (-3.0%)
• Target 1: $1,471.83 (+1.5%)
• Target 2: $1,522.58 (+5.0%)
• R/R 1:1.7 | Confidence 64%
The CHoCH on the 15‑min chart gave us the entry cue, backed by a bullish CVD spike, a fresh FVG and a solid OB right under the price. The POI confluence of that OB overlapping the FVG seals the trade, showing the market re‑establishing upside momentum.
A 3 % stop is pretty tight, so keep leverage around 2‑3× to stay safe.
Take half off the table at the first 1.5 % target.
Not financial advice — trade only what you can afford to lose 🙏
$ZEC #ZECUSDT #ChinaMayLetAlibabaByteDanceBuyNvidiaChips #TradingSignals #Write2Earn
🟢 $ZEC LONG 📈 — Trade Plan
• Entry: $1,448.63 – $1,451.53
• Stop: $1,406.58 (-3.0%)
• Target 1: $1,471.83 (+1.5%)
• Target 2: $1,522.58 (+5.0%)
• R/R 1:1.7 | Confidence 64%
The CHoCH on the 15‑min chart gave us the entry cue, backed by a bullish CVD spike, a fresh FVG and a solid OB right under the price. The POI confluence of that OB overlapping the FVG seals the trade, showing the market re‑establishing upside momentum.
A 3 % stop is pretty tight, so keep leverage around 2‑3× to stay safe.
Take half off the table at the first 1.5 % target.
Not financial advice — trade only what you can afford to lose 🙏
$ZEC #ZECUSDT #ChinaMayLetAlibabaByteDanceBuyNvidiaChips #TradingSignals #Write2Earn
5

·
--
Verified
#ZECUSDT
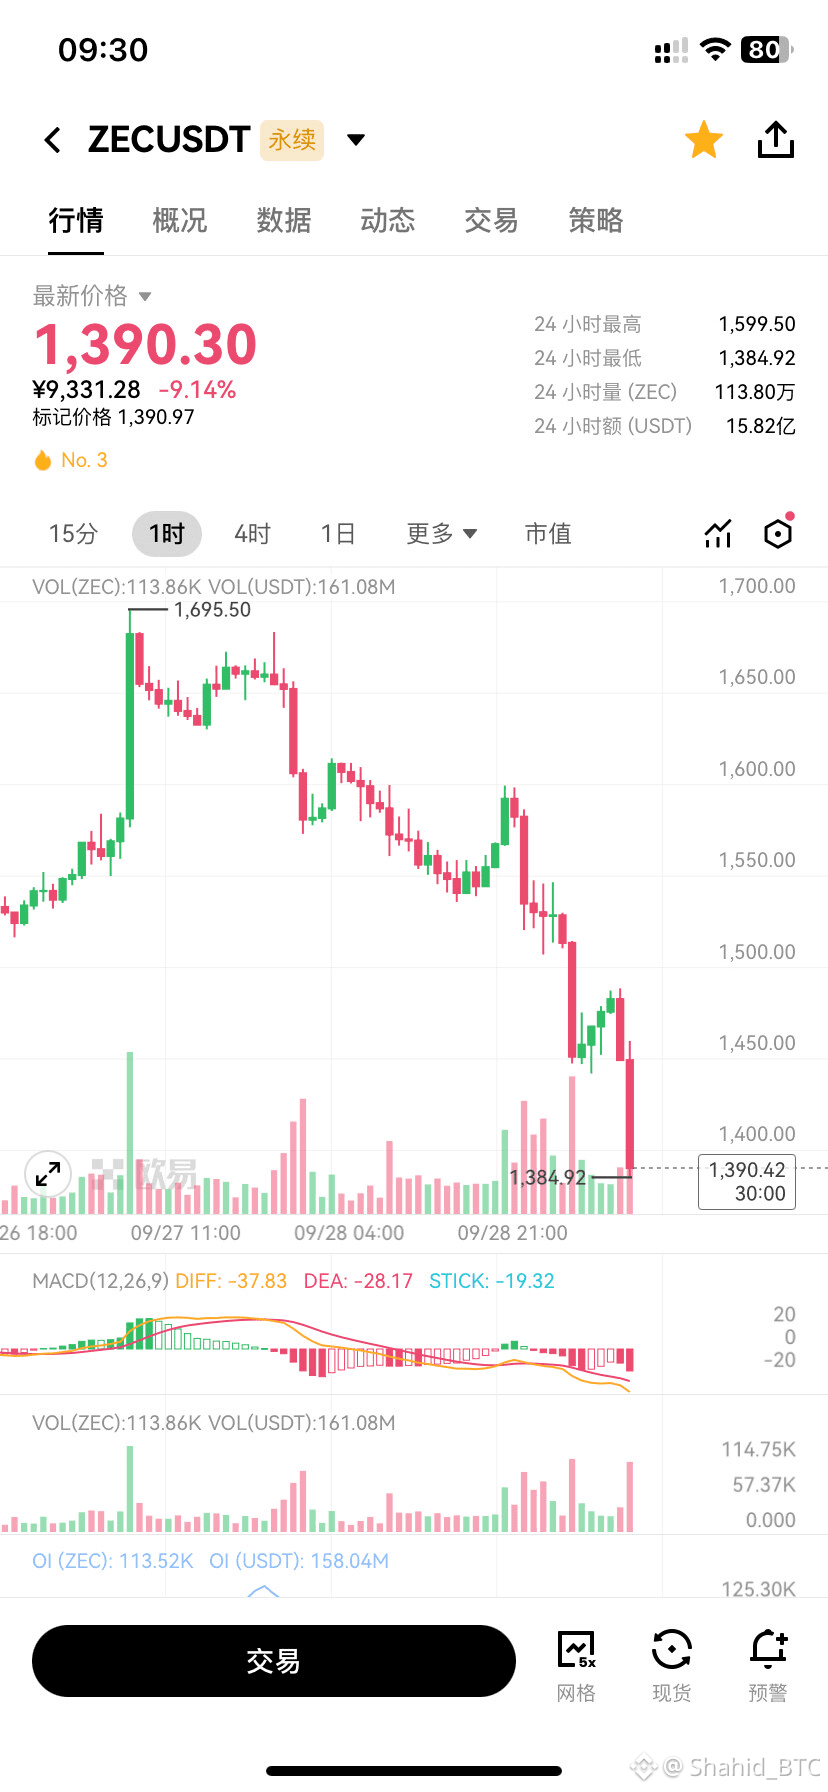
The $ZEC bears finally see daylight
Plunged straight down from 1695, a single-day drop of 9%.
Those whales and big holders with tens of millions on-chain, all got slaughtered by the dog traders, some exploded, some got cut.
I, a small retail investor with just a few hundred U, surprisingly survived till the end.
Do the dog traders find my few dozen bucks margin too little, not worth killing?
Dubai dealt another blow, banning licensed exchanges from using ZEC.
Russia and India followed by tightening scrutiny.
No matter how hot the privacy narrative is, the institutional gates are all welded shut.
I don't even know which way the institutional gates open, just foolishly dying short here.
#ZECUSDT
The $ZEC bears finally see daylight
Plunged straight down from 1695, a single-day drop of 9%.
Those whales and big holders with tens of millions on-chain, all got slaughtered by the dog traders, some exploded, some got cut.
I, a small retail investor with just a few hundred U, surprisingly survived till the end.
Do the dog traders find my few dozen bucks margin too little, not worth killing?
Dubai dealt another blow, banning licensed exchanges from using ZEC.
Russia and India followed by tightening scrutiny.
No matter how hot the privacy narrative is, the institutional gates are all welded shut.
I don't even know which way the institutional gates open, just foolishly dying short here.
The $ZEC bears finally see daylight
Plunged straight down from 1695, a single-day drop of 9%.
Those whales and big holders with tens of millions on-chain, all got slaughtered by the dog traders, some exploded, some got cut.
I, a small retail investor with just a few hundred U, surprisingly survived till the end.
Do the dog traders find my few dozen bucks margin too little, not worth killing?
Dubai dealt another blow, banning licensed exchanges from using ZEC.
Russia and India followed by tightening scrutiny.
No matter how hot the privacy narrative is, the institutional gates are all welded shut.
I don't even know which way the institutional gates open, just foolishly dying short here.
1
282

·
--
Bullish
$ZEC /USDT — LONG SETUP 📈 🚀 💯
Entry: 1,400.00 - 1,425.00
TP1: 1,460.00
TP2: 1,500.00
TP3: 1,550.00
Stop: 1,375.00
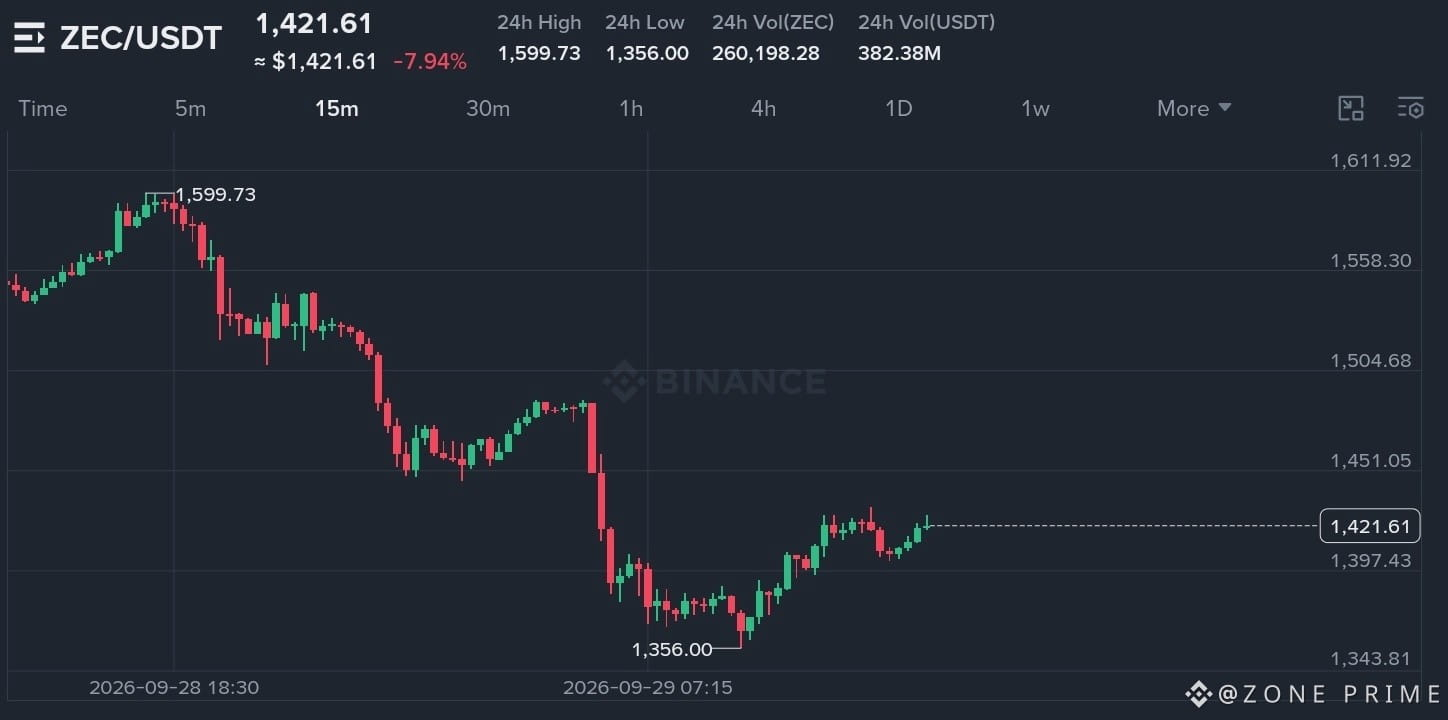
After hitting a bottom at 1,356.00, price has established a steady recovery pattern.
Accumulation above 1,400 signals that buyers are reclaiming control to push higher toward broken supply zones.
#zec #zecusdt #crypto #Write2Earn $ZEC
{spot}(ZECUSDT)
$ZEC /USDT — LONG SETUP 📈 🚀 💯
Entry: 1,400.00 - 1,425.00
TP1: 1,460.00
TP2: 1,500.00
TP3: 1,550.00
Stop: 1,375.00
After hitting a bottom at 1,356.00, price has established a steady recovery pattern.
Accumulation above 1,400 signals that buyers are reclaiming control to push higher toward broken supply zones.
#zec #zecusdt #crypto #Write2Earn $ZEC
Entry: 1,400.00 - 1,425.00
TP1: 1,460.00
TP2: 1,500.00
TP3: 1,550.00
Stop: 1,375.00
After hitting a bottom at 1,356.00, price has established a steady recovery pattern.
Accumulation above 1,400 signals that buyers are reclaiming control to push higher toward broken supply zones.
#zec #zecusdt #crypto #Write2Earn $ZEC
182

·
--
Bullish
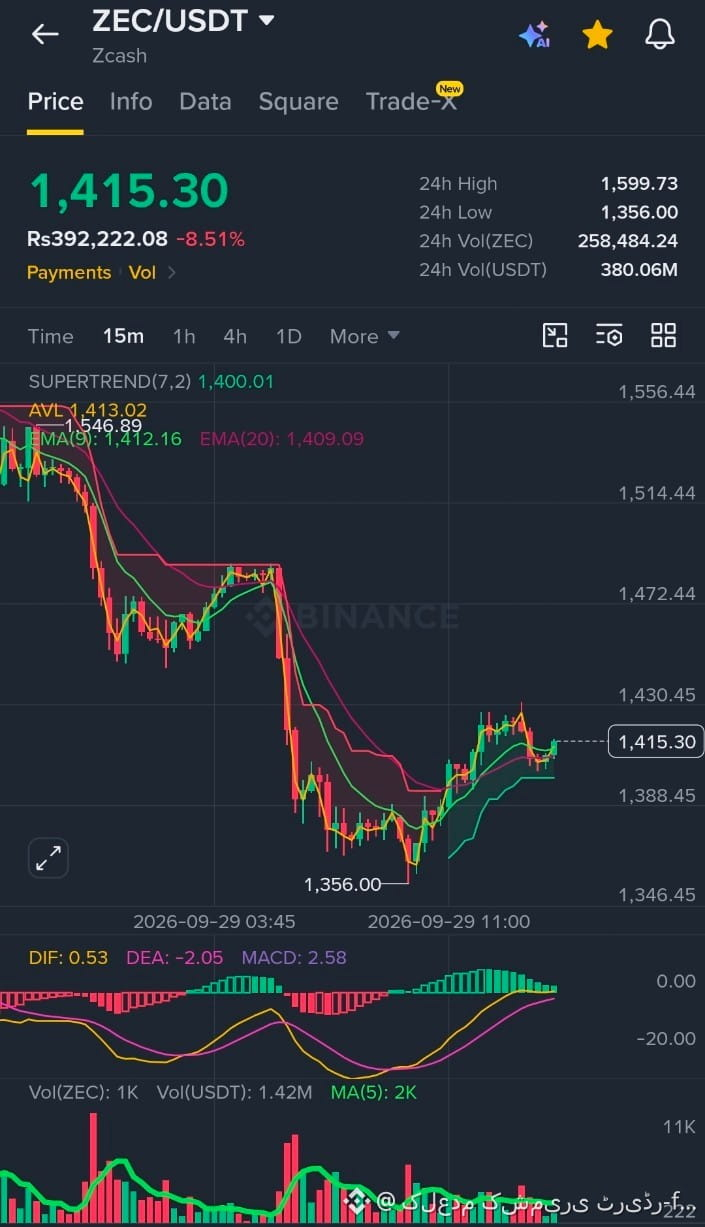
. $ZEC is looking ready for a massive breakout!
Privacy is becoming more important in crypto, and Zcash has a strong place in that conversation.
I believe $ZEC has huge upside potential. This could be just the beginning of a much bigger move!
#ZECUSDT
. $ZEC is looking ready for a massive breakout!
Privacy is becoming more important in crypto, and Zcash has a strong place in that conversation.
I believe $ZEC has huge upside potential. This could be just the beginning of a much bigger move!
#ZECUSDT
Privacy is becoming more important in crypto, and Zcash has a strong place in that conversation.
I believe $ZEC has huge upside potential. This could be just the beginning of a much bigger move!
#ZECUSDT
1
55
·
--
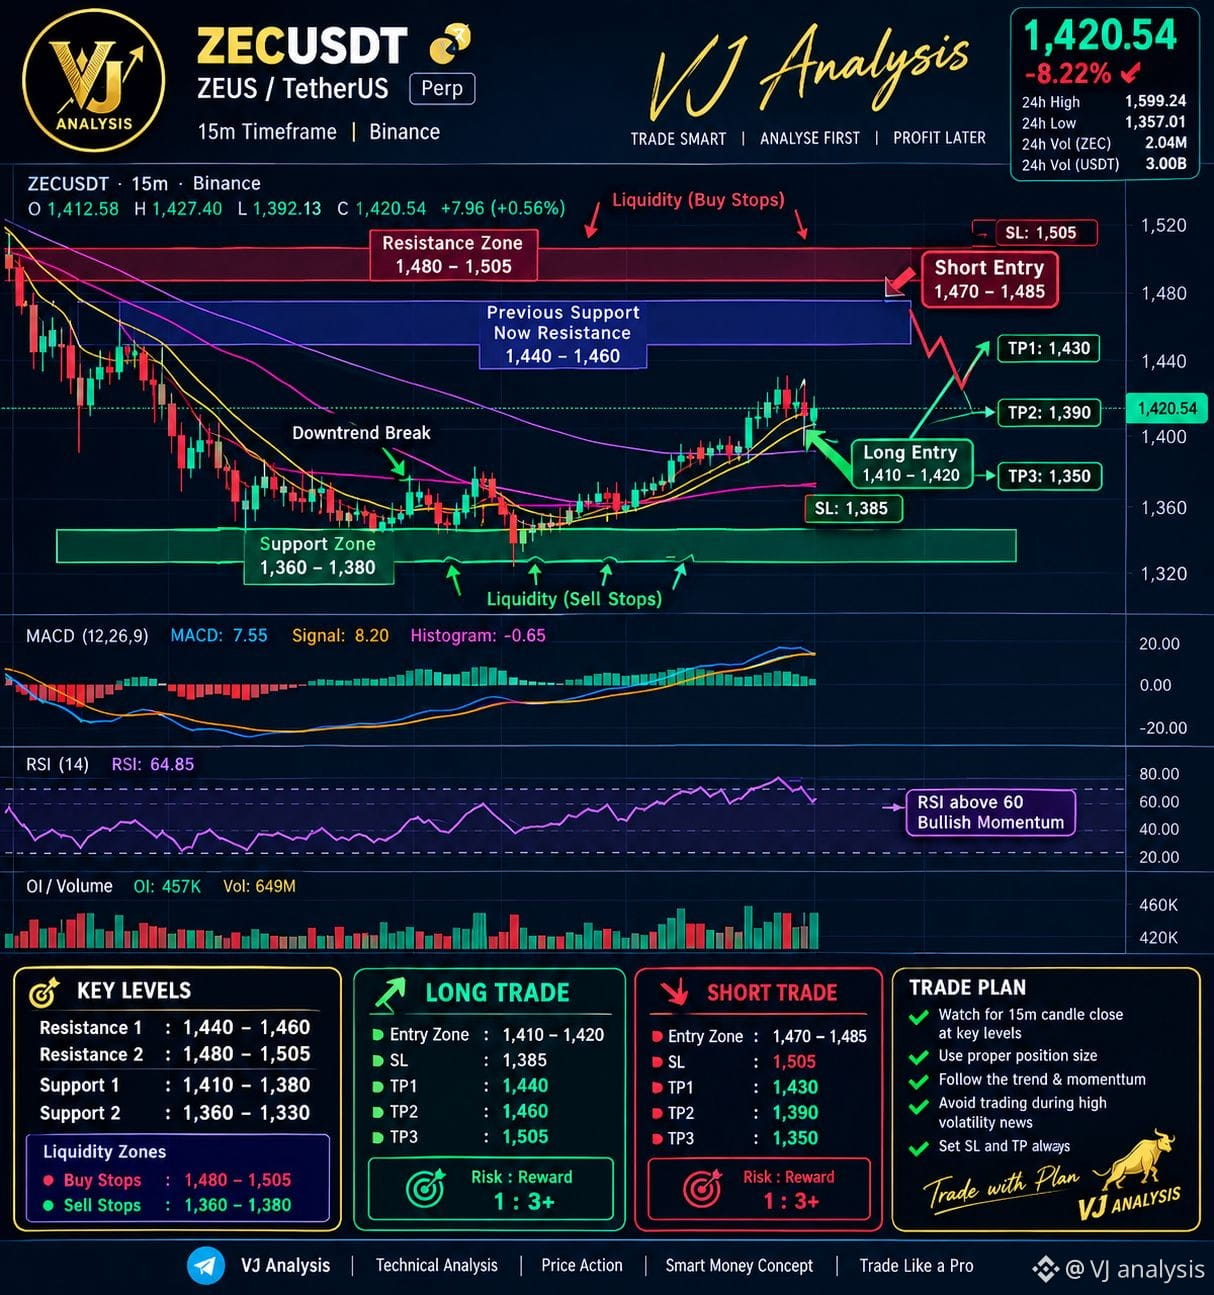
🚨 #ZECUSDT PERP — 15M TECHNICAL ANALYSIS 🚨
🔥 VJ ANALYSIS | TRADE SMART • ANALYSE FIRST • PROFIT LATER
📊 Current Price: 1,420.54
📈 24H High: 1,599.24
📉 24H Low: 1,357.01
ZEC is showing a strong recovery from the 1,357–1,380 support/liquidity zone, with price now trading around 1,420. The short-term structure has improved, but price is approaching an important resistance area, so confirmation is essential before entering.
🟢 LONG SETUP#zec
Entry Zone: 1,410–1,420
Stop Loss: 1,385
🎯 TP1: 1,440
🎯 TP2: 1,460
🎯 TP3: 1,505
The long setup is based on holding the 1,410 area and maintaining bullish momentum. A confirmed 15M close above resistance can open the way toward higher targets.
🔴 SHORT SETUP #ZECUSDT
Entry Zone: 1,470–1,485
Stop Loss: 1,505
🎯 TP1: 1,430
🎯 TP2: 1,390
🎯 TP3: 1,350
⚠️ The 1,440–1,460 zone is the first major resistance area, while 1,480–1,505 represents a stronger resistance/liquidity zone where sellers may become active.
💧 LIQUIDITY MAP
🟥 Buy-side liquidity: 1,480–1,505
🟩 Sell-side liquidity: 1,360–1,380
📈 MOMENTUM: MACD is recovering and RSI is around 65, showing positive short-term momentum. However, RSI is elevated, so chasing a breakout without confirmation carries additional risk.
🔥 TRADE PLAN:#zec
Wait for a 15M candle confirmation at the key levels. Avoid entering in the middle of the range. Use proper position sizing, always define your SL before entry, and consider taking partial profits at each target.
⚡ VJ ANALYSIS
Trade with a plan, not emotions.
DYOR • Manage Risk • Protect Capital
🚨 #ZECUSDT PERP — 15M TECHNICAL ANALYSIS 🚨
🔥 VJ ANALYSIS | TRADE SMART • ANALYSE FIRST • PROFIT LATER
📊 Current Price: 1,420.54
📈 24H High: 1,599.24
📉 24H Low: 1,357.01
ZEC is showing a strong recovery from the 1,357–1,380 support/liquidity zone, with price now trading around 1,420. The short-term structure has improved, but price is approaching an important resistance area, so confirmation is essential before entering.
🟢 LONG SETUP#zec
Entry Zone: 1,410–1,420
Stop Loss: 1,385
🎯 TP1: 1,440
🎯 TP2: 1,460
🎯 TP3: 1,505
The long setup is based on holding the 1,410 area and maintaining bullish momentum. A confirmed 15M close above resistance can open the way toward higher targets.
🔴 SHORT SETUP #ZECUSDT
Entry Zone: 1,470–1,485
Stop Loss: 1,505
🎯 TP1: 1,430
🎯 TP2: 1,390
🎯 TP3: 1,350
⚠️ The 1,440–1,460 zone is the first major resistance area, while 1,480–1,505 represents a stronger resistance/liquidity zone where sellers may become active.
💧 LIQUIDITY MAP
🟥 Buy-side liquidity: 1,480–1,505
🟩 Sell-side liquidity: 1,360–1,380
📈 MOMENTUM: MACD is recovering and RSI is around 65, showing positive short-term momentum. However, RSI is elevated, so chasing a breakout without confirmation carries additional risk.
🔥 TRADE PLAN:#zec
Wait for a 15M candle confirmation at the key levels. Avoid entering in the middle of the range. Use proper position sizing, always define your SL before entry, and consider taking partial profits at each target.
⚡ VJ ANALYSIS
Trade with a plan, not emotions.
DYOR • Manage Risk • Protect Capital
🔥 VJ ANALYSIS | TRADE SMART • ANALYSE FIRST • PROFIT LATER
📊 Current Price: 1,420.54
📈 24H High: 1,599.24
📉 24H Low: 1,357.01
ZEC is showing a strong recovery from the 1,357–1,380 support/liquidity zone, with price now trading around 1,420. The short-term structure has improved, but price is approaching an important resistance area, so confirmation is essential before entering.
🟢 LONG SETUP#zec
Entry Zone: 1,410–1,420
Stop Loss: 1,385
🎯 TP1: 1,440
🎯 TP2: 1,460
🎯 TP3: 1,505
The long setup is based on holding the 1,410 area and maintaining bullish momentum. A confirmed 15M close above resistance can open the way toward higher targets.
🔴 SHORT SETUP #ZECUSDT
Entry Zone: 1,470–1,485
Stop Loss: 1,505
🎯 TP1: 1,430
🎯 TP2: 1,390
🎯 TP3: 1,350
⚠️ The 1,440–1,460 zone is the first major resistance area, while 1,480–1,505 represents a stronger resistance/liquidity zone where sellers may become active.
💧 LIQUIDITY MAP
🟥 Buy-side liquidity: 1,480–1,505
🟩 Sell-side liquidity: 1,360–1,380
📈 MOMENTUM: MACD is recovering and RSI is around 65, showing positive short-term momentum. However, RSI is elevated, so chasing a breakout without confirmation carries additional risk.
🔥 TRADE PLAN:#zec
Wait for a 15M candle confirmation at the key levels. Avoid entering in the middle of the range. Use proper position sizing, always define your SL before entry, and consider taking partial profits at each target.
⚡ VJ ANALYSIS
Trade with a plan, not emotions.
DYOR • Manage Risk • Protect Capital
115
Log in to explore more content
Join global crypto users on Binance Square
⚡️ Get latest and useful information about crypto.
💬 Trusted by the world’s largest crypto exchange.
👍 Discover real insights from verified creators.
Email / Phone number
Trending Topics
1
#OpenAIUnveilsAlwaysOnAgentDots
518 views
45 Discussing
2
#ChainlinkLaunchesBankSWIFTLedgerFramework
1,615 views
58 Discussing
3
#EarningsSeason
424,848 views
3,210 Discussing
4
#SECChairWantsStockMarketsOnChain
4,684 views
158 Discussing
5
#MulticoinInvestsInGrass
2,666 views
116 Discussing
6
#CEARenamesToBNBStandardUnderBNC
3,887 views
120 Discussing
7
#BitwiseLaunchesFirstSpotNEARETF
56,350 views
749 Discussing
8
#USJobOpeningsFallToFiveMonthLow
59,884 views
583 Discussing
9
#ECBToTestAIAgentsInDigitalEuroPayments
37,709 views
617 Discussing
10
#JapanFSABacksFourthStablecoinTradeSettlementPilot
42,641 views
638 Discussing