
#zrxusdt
zrxusdt
21,217 views
190 Discussing
Hot
Latest

·
--
📊 ZRX ON THE DAILY CHART (1D): BULLISH BOUNCE OR CONTINUED DOWNTREND?
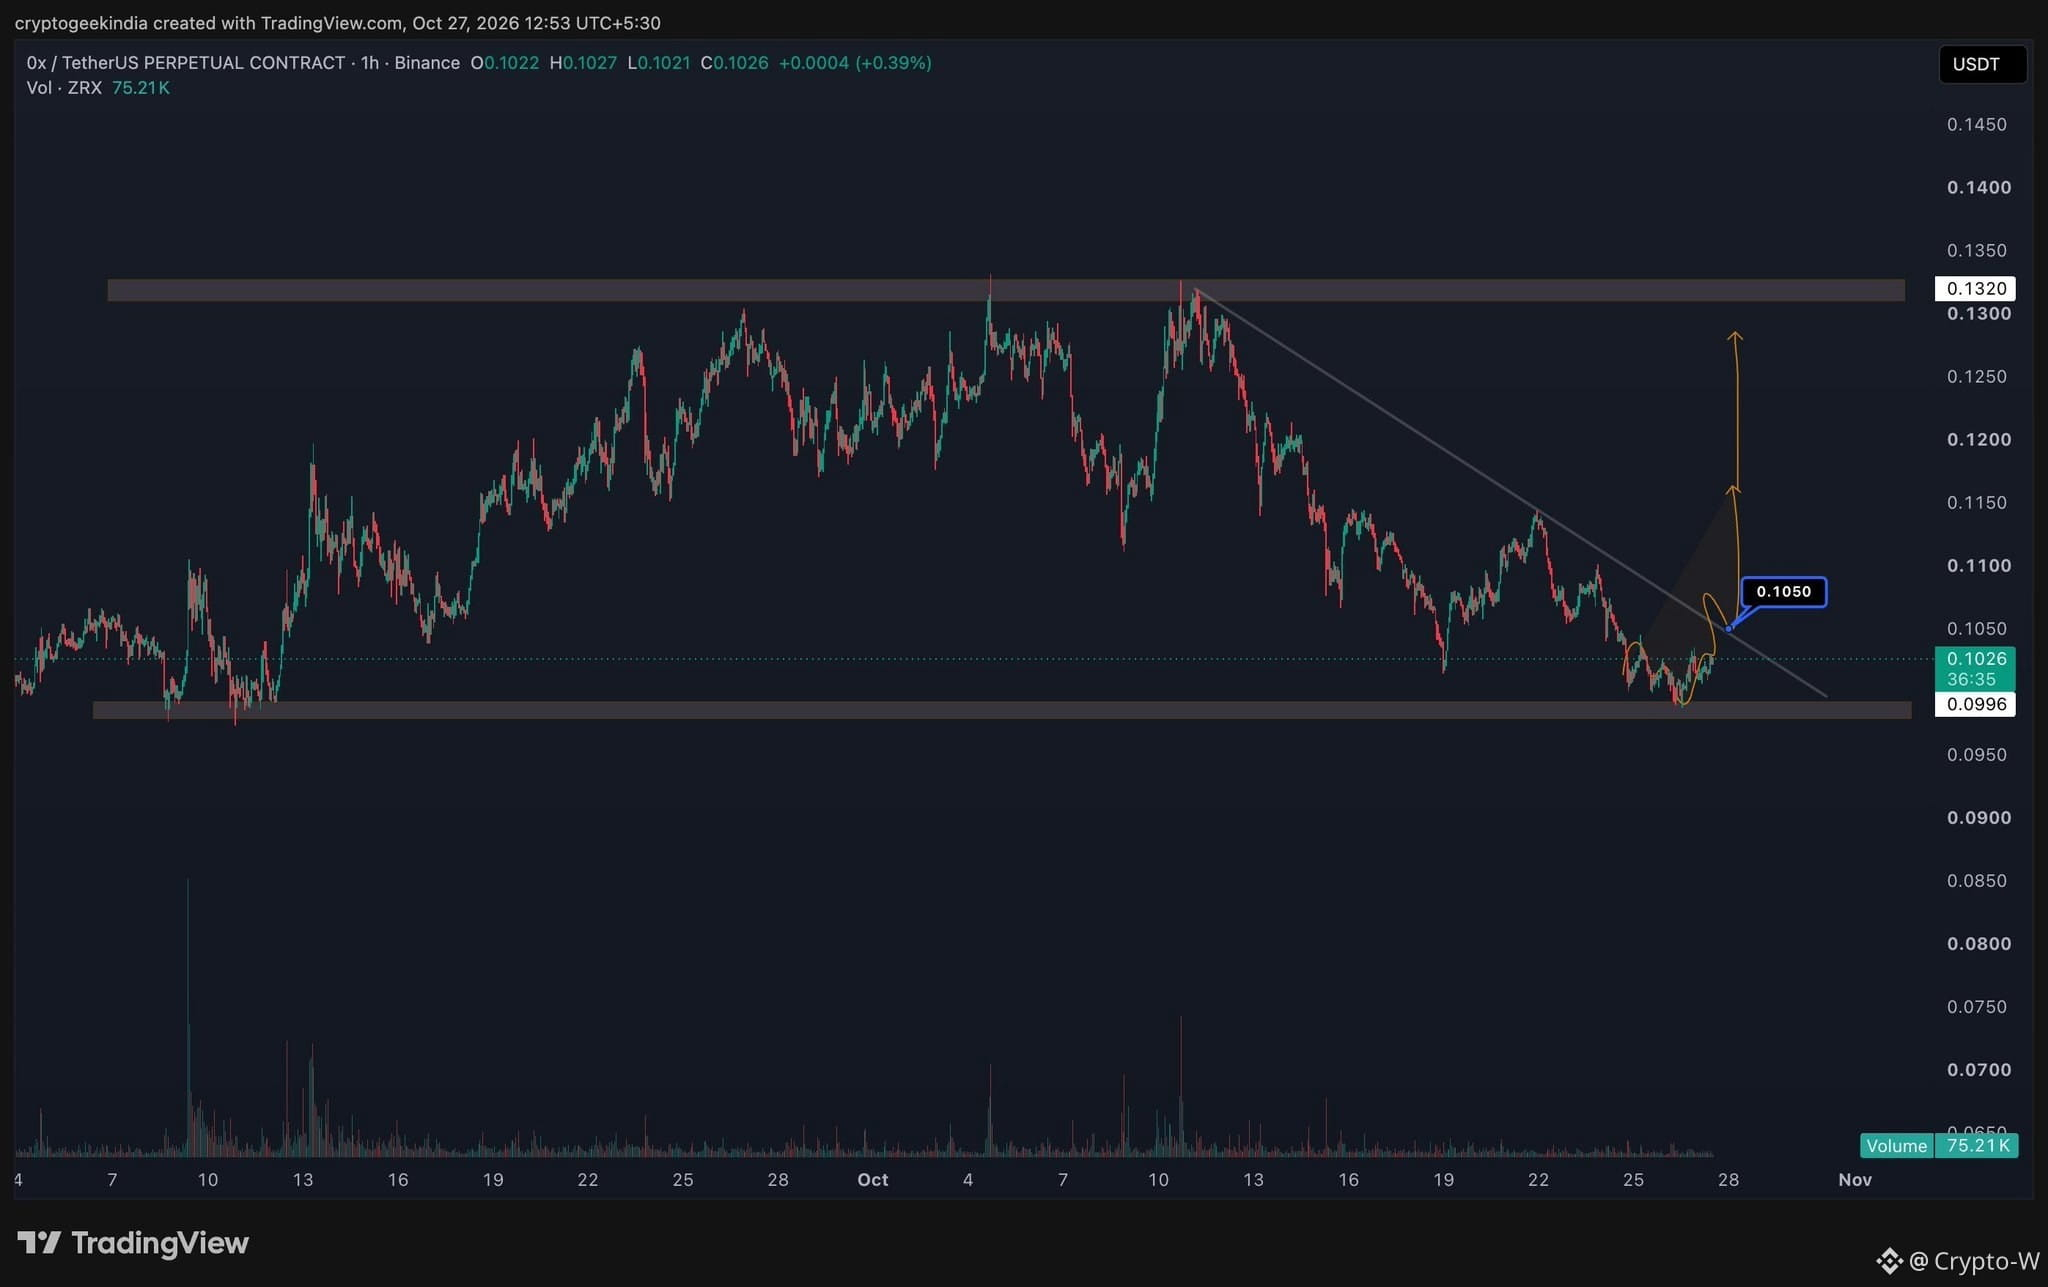
The cryptocurrency 0x Protocol ($ZRX) is showing mixed signals on the 1-day chart. As of October 27, its reference price is around 0.102 USDT, with a volatile market and a trend that still needs confirmation.
🔎 KEY ZRX/USDT LEVELS
🟢 Resistance: 0.1039 USDT
A breakout and daily close above this level, accompanied by volume, could open the way to 0.1067 and then 0.1101 USDT.
🟡 Support: 0.0998 USDT
This is the zone buyers need to defend. A daily close below it could increase selling pressure toward 0.0955 USDT.
📉 What do the indicators say?
• The RSI is near 38, reflecting weak momentum.
• The stochastic is in oversold territory, which could favor a bounce, but does not confirm a trend reversal on its own.
• Moving averages indicate short-term weakness.
🧠 My spot strategy: I wouldn’t anticipate the breakout. I’d wait for a confirmed daily close above 0.1039 USDT or a clear price reaction at support. If it loses 0.0998, I’d be cautious about making new purchases.
⚠️ These levels are technical reference points, not guarantees of price movement. Check the price and volume on Binance before trading.
🔥 Question for the community: Will ZRX recover to 0.1100 USDT, or will it fall toward 0.0955 first?
#ZRXUSDT #0XPROTOCOL #altcoins #BinanceSquareFamily
📊 ZRX ON THE DAILY CHART (1D): BULLISH BOUNCE OR CONTINUED DOWNTREND?
The cryptocurrency 0x Protocol ($ZRX) is showing mixed signals on the 1-day chart. As of October 27, its reference price is around 0.102 USDT, with a volatile market and a trend that still needs confirmation.
🔎 KEY ZRX/USDT LEVELS
🟢 Resistance: 0.1039 USDT
A breakout and daily close above this level, accompanied by volume, could open the way to 0.1067 and then 0.1101 USDT.
🟡 Support: 0.0998 USDT
This is the zone buyers need to defend. A daily close below it could increase selling pressure toward 0.0955 USDT.
📉 What do the indicators say?
• The RSI is near 38, reflecting weak momentum.
• The stochastic is in oversold territory, which could favor a bounce, but does not confirm a trend reversal on its own.
• Moving averages indicate short-term weakness.
🧠 My spot strategy: I wouldn’t anticipate the breakout. I’d wait for a confirmed daily close above 0.1039 USDT or a clear price reaction at support. If it loses 0.0998, I’d be cautious about making new purchases.
⚠️ These levels are technical reference points, not guarantees of price movement. Check the price and volume on Binance before trading.
🔥 Question for the community: Will ZRX recover to 0.1100 USDT, or will it fall toward 0.0955 first?
#ZRXUSDT #0XPROTOCOL #altcoins #BinanceSquareFamily
The cryptocurrency 0x Protocol ($ZRX) is showing mixed signals on the 1-day chart. As of October 27, its reference price is around 0.102 USDT, with a volatile market and a trend that still needs confirmation.
🔎 KEY ZRX/USDT LEVELS
🟢 Resistance: 0.1039 USDT
A breakout and daily close above this level, accompanied by volume, could open the way to 0.1067 and then 0.1101 USDT.
🟡 Support: 0.0998 USDT
This is the zone buyers need to defend. A daily close below it could increase selling pressure toward 0.0955 USDT.
📉 What do the indicators say?
• The RSI is near 38, reflecting weak momentum.
• The stochastic is in oversold territory, which could favor a bounce, but does not confirm a trend reversal on its own.
• Moving averages indicate short-term weakness.
🧠 My spot strategy: I wouldn’t anticipate the breakout. I’d wait for a confirmed daily close above 0.1039 USDT or a clear price reaction at support. If it loses 0.0998, I’d be cautious about making new purchases.
⚠️ These levels are technical reference points, not guarantees of price movement. Check the price and volume on Binance before trading.
🔥 Question for the community: Will ZRX recover to 0.1100 USDT, or will it fall toward 0.0955 first?
#ZRXUSDT #0XPROTOCOL #altcoins #BinanceSquareFamily
32

⛲ Seeing capital flow into the account like a waterfall, I only then realize that the days of patient endurance were truly worth it.
📈 LONG $ZRX
Entry: 0.109
TP: 0.114 | SL: 0.0981
📌 Transparency in project governance is the key to retaining capital inflows.
📊 The Keltner Channel indicator shows the price is hugging the upper band to move higher.
📚 Knowledge is the only asset the market can’t take from you.
🌞 I hope every morning in your life is filled with the sunlight of success and profit.
#ZRXUSDT $ZRXUSDT
⛲ Seeing capital flow into the account like a waterfall, I only then realize that the days of patient endurance were truly worth it.
📈 LONG $ZRX
Entry: 0.109
TP: 0.114 | SL: 0.0981
📌 Transparency in project governance is the key to retaining capital inflows.
📊 The Keltner Channel indicator shows the price is hugging the upper band to move higher.
📚 Knowledge is the only asset the market can’t take from you.
🌞 I hope every morning in your life is filled with the sunlight of success and profit.
#ZRXUSDT $ZRXUSDT
📈 LONG $ZRX
Entry: 0.109
TP: 0.114 | SL: 0.0981
📌 Transparency in project governance is the key to retaining capital inflows.
📊 The Keltner Channel indicator shows the price is hugging the upper band to move higher.
📚 Knowledge is the only asset the market can’t take from you.
🌞 I hope every morning in your life is filled with the sunlight of success and profit.
#ZRXUSDT $ZRXUSDT
92
📒 Success isn’t a matter of random luck; it’s the reward for daring to stand with the inevitable trend.
🟢 LONG $ZRX
Entry: 0.129
TP: 0.135 | SL: 0.116
👑 Users have the right to vote and decide the future of their project.
📈 A surge in volume at the breakout point is a golden confirmation for the trade.
🧘 Learn to accept that you cannot control the market.
💎 Wishing you great success from your tireless efforts.
#ZRXUSDT $ZRXUSDT
📒 Success isn’t a matter of random luck; it’s the reward for daring to stand with the inevitable trend.
🟢 LONG $ZRX
Entry: 0.129
TP: 0.135 | SL: 0.116
👑 Users have the right to vote and decide the future of their project.
📈 A surge in volume at the breakout point is a golden confirmation for the trade.
🧘 Learn to accept that you cannot control the market.
💎 Wishing you great success from your tireless efforts.
#ZRXUSDT $ZRXUSDT
🟢 LONG $ZRX
Entry: 0.129
TP: 0.135 | SL: 0.116
👑 Users have the right to vote and decide the future of their project.
📈 A surge in volume at the breakout point is a golden confirmation for the trade.
🧘 Learn to accept that you cannot control the market.
💎 Wishing you great success from your tireless efforts.
#ZRXUSDT $ZRXUSDT
31
🟢 Buy Entry: $ZRX at 0.0801
🎯 TP1: 0.0805005
🎯 TP2: 0.080901
🎯 TP3: 0.0813015
🎯 TP4: 0.081702
🔴 StopLoss: 0.0788985
🚀 Leverage: 5x to 10x
Buy Signal 15 Mins Alert for $ZRX. Adjust StopLoss and trade at your own risk.
#ZRX #ZRXUSDT
🟢 Buy Entry: $ZRX at 0.0801
🎯 TP1: 0.0805005
🎯 TP2: 0.080901
🎯 TP3: 0.0813015
🎯 TP4: 0.081702
🔴 StopLoss: 0.0788985
🚀 Leverage: 5x to 10x
Buy Signal 15 Mins Alert for $ZRX . Adjust StopLoss and trade at your own risk.
#ZRX #ZRXUSDT
🎯 TP1: 0.0805005
🎯 TP2: 0.080901
🎯 TP3: 0.0813015
🎯 TP4: 0.081702
🔴 StopLoss: 0.0788985
🚀 Leverage: 5x to 10x
Buy Signal 15 Mins Alert for $ZRX . Adjust StopLoss and trade at your own risk.
#ZRX #ZRXUSDT
13
🔴 Sell Entry: $ZRX at 0.0792
🎯 TP1: 0.078804
🎯 TP2: 0.078408
🎯 TP3: 0.078012
🎯 TP4: 0.077616
🔴 StopLoss: 0.080388
🚀 Leverage: 5x to 10x
Like, Share, Follow and Adjust StopLoss. DYOR and trade at your own risk.
#ZRX #ZRXUSDT
🔴 Sell Entry: $ZRX at 0.0792
🎯 TP1: 0.078804
🎯 TP2: 0.078408
🎯 TP3: 0.078012
🎯 TP4: 0.077616
🔴 StopLoss: 0.080388
🚀 Leverage: 5x to 10x
Like, Share, Follow and Adjust StopLoss. DYOR and trade at your own risk.
#ZRX #ZRXUSDT
🎯 TP1: 0.078804
🎯 TP2: 0.078408
🎯 TP3: 0.078012
🎯 TP4: 0.077616
🔴 StopLoss: 0.080388
🚀 Leverage: 5x to 10x
Like, Share, Follow and Adjust StopLoss. DYOR and trade at your own risk.
#ZRX #ZRXUSDT
5

·
--
Bullish
#ZRXUSDT
LONG
➡️ Entry: 0.0886
🎯 Target 1: 0.0893 ✅
🎯 Target 2: 0.0901 ✅
🎯 Target 3: 0.0922
🎯 Target 4: 0.0959
🛑 Stop loss 1: 0.0871
🛑 Stop loss 2: 0.0828
$ZRX
{spot}(ZRXUSDT)
#ZRXUSDT
LONG
➡️ Entry: 0.0886
🎯 Target 1: 0.0893 ✅
🎯 Target 2: 0.0901 ✅
🎯 Target 3: 0.0922
🎯 Target 4: 0.0959
🛑 Stop loss 1: 0.0871
🛑 Stop loss 2: 0.0828
$ZRX
LONG
➡️ Entry: 0.0886
🎯 Target 1: 0.0893 ✅
🎯 Target 2: 0.0901 ✅
🎯 Target 3: 0.0922
🎯 Target 4: 0.0959
🛑 Stop loss 1: 0.0871
🛑 Stop loss 2: 0.0828
$ZRX
20


ZRX is slumping beneath the 0.55‑0.57 range, eyes on the next bearish swing.
🔴 $ZRX SHORT 📉
Entry $0.111389-$0.111611 | SL $0.114845 (-3.0%) | TP1 $0.109827 (+1.5%) | TP2 $0.105925 (+5.0%) | R/R 1:1.7 | Conf 64%
A clear change of character popped as price broke the lower swing high, confirming a CHoCH. The CVD turned negative while a fresh liquidity sweep ate the 0.56 level, and the overlapping OB and FVG form a POI that pins the market. With the order block defending the 0.54 zone, the short bias looks solid.
A 3.0% stop is relatively tight, so a 5‑10x leverage would be prudent.
Take half profit around the 0.51 target as the price approaches the next resistance.
DYOR — this isn't financial advice, size your risk accordingly 🙏
$ZRX #ZRXUSDT #BigBangThesis #TradingSignals #Write2Earn
ZRX is slumping beneath the 0.55‑0.57 range, eyes on the next bearish swing.
🔴 $ZRX SHORT 📉
Entry $0.111389-$0.111611 | SL $0.114845 (-3.0%) | TP1 $0.109827 (+1.5%) | TP2 $0.105925 (+5.0%) | R/R 1:1.7 | Conf 64%
A clear change of character popped as price broke the lower swing high, confirming a CHoCH. The CVD turned negative while a fresh liquidity sweep ate the 0.56 level, and the overlapping OB and FVG form a POI that pins the market. With the order block defending the 0.54 zone, the short bias looks solid.
A 3.0% stop is relatively tight, so a 5‑10x leverage would be prudent.
Take half profit around the 0.51 target as the price approaches the next resistance.
DYOR — this isn't financial advice, size your risk accordingly 🙏
$ZRX #ZRXUSDT #BigBangThesis #TradingSignals #Write2Earn
🔴 $ZRX SHORT 📉
Entry $0.111389-$0.111611 | SL $0.114845 (-3.0%) | TP1 $0.109827 (+1.5%) | TP2 $0.105925 (+5.0%) | R/R 1:1.7 | Conf 64%
A clear change of character popped as price broke the lower swing high, confirming a CHoCH. The CVD turned negative while a fresh liquidity sweep ate the 0.56 level, and the overlapping OB and FVG form a POI that pins the market. With the order block defending the 0.54 zone, the short bias looks solid.
A 3.0% stop is relatively tight, so a 5‑10x leverage would be prudent.
Take half profit around the 0.51 target as the price approaches the next resistance.
DYOR — this isn't financial advice, size your risk accordingly 🙏
$ZRX #ZRXUSDT #BigBangThesis #TradingSignals #Write2Earn
36

·
--
BREAKING NEWS: 0X PROTOCOL REPORTS BILLIONS IN SETTLEMENT ACTIVITY!
$ZRX
{spot}(ZRXUSDT)
0x Protocol has continued expanding its decentralized trading infrastructure, with reported settlement activity exceeding $20 billion on Polygon and growing integrations through its Swap API. These figures highlight the importance of liquidity aggregation and efficient trade execution across blockchain networks. However, protocol adoption does not automatically translate into token demand. Traders should monitor actual usage, exchange liquidity and the chart's resistance levels. A sustained move with stronger volume could improve the outlook, but weak momentum would call for caution.
#ZRX #0xProtocol #ZRXUSDT #DeFi #CryptoTrading
BREAKING NEWS: 0X PROTOCOL REPORTS BILLIONS IN SETTLEMENT ACTIVITY!
$ZRX
0x Protocol has continued expanding its decentralized trading infrastructure, with reported settlement activity exceeding $20 billion on Polygon and growing integrations through its Swap API. These figures highlight the importance of liquidity aggregation and efficient trade execution across blockchain networks. However, protocol adoption does not automatically translate into token demand. Traders should monitor actual usage, exchange liquidity and the chart's resistance levels. A sustained move with stronger volume could improve the outlook, but weak momentum would call for caution.
#ZRX #0xProtocol #ZRXUSDT #DeFi #CryptoTrading
$ZRX
0x Protocol has continued expanding its decentralized trading infrastructure, with reported settlement activity exceeding $20 billion on Polygon and growing integrations through its Swap API. These figures highlight the importance of liquidity aggregation and efficient trade execution across blockchain networks. However, protocol adoption does not automatically translate into token demand. Traders should monitor actual usage, exchange liquidity and the chart's resistance levels. A sustained move with stronger volume could improve the outlook, but weak momentum would call for caution.
#ZRX #0xProtocol #ZRXUSDT #DeFi #CryptoTrading
5

·
--
Bullish
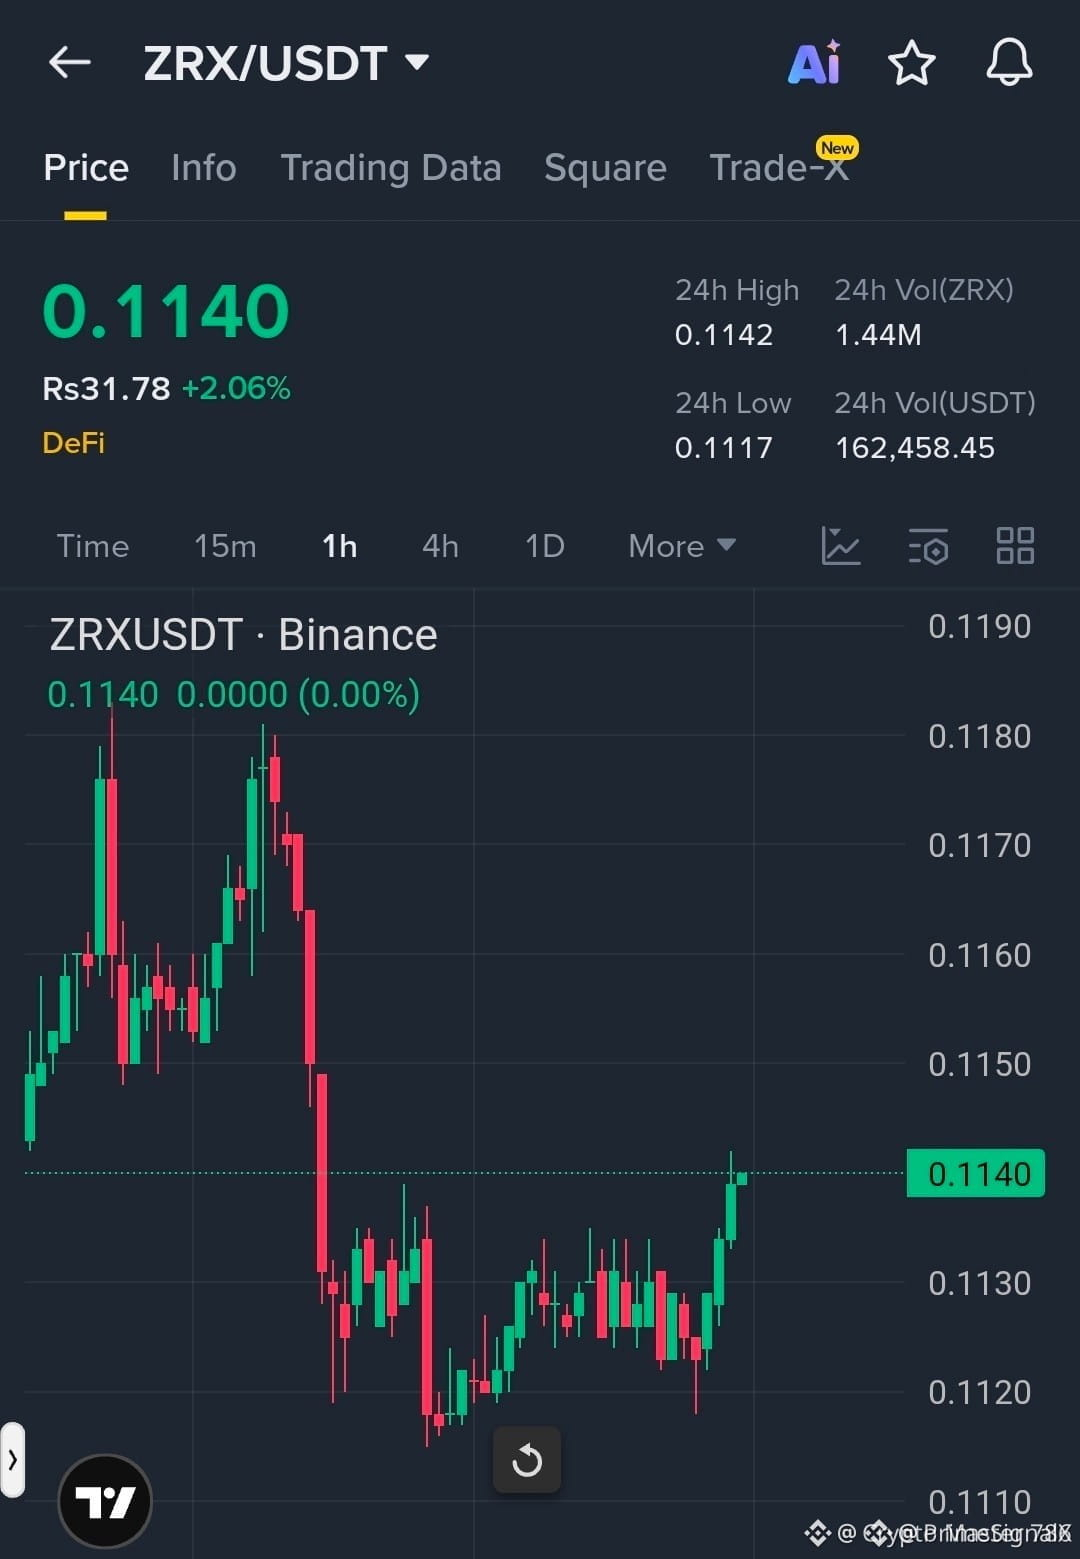
$ZRX Recovery Bounce: Buyers Reclaiming Structure
Trade Setup
Direction: LONG
Entry Zone: 0.1130 – 0.1145
Stop Loss: 0.1100
Target 1 : 0.1180
Target 2 : 0.1220
Target 3 : 0.1280
ZRX is currently demonstrating a high-conviction recovery following a sharp sell-off. The price action has successfully reclaimed short-term structural levels, signaling that buyers are re-entering the market to defend this local base.
Technical Insight
The recent price reclaim suggests a shift in momentum as the "sharp sell-off" phase transitions into a stabilization period. By entering within the 0.1130 – 0.1145 liquidity zone, we are positioning ourselves for a tactical bounce toward major resistance. A strict stop loss at 0.1100 ensures capital preservation if the broader market volatility persists.
Execution Strategy: We are looking for high-volume confirmation on the 1H timeframe to validate the push toward TP1. Watch for the reclaim of recent highs to accelerate the trend.
Is $ZRX gearing up for a full trend reversal, or is this just a tactical relief rally? Let’s monitor the volume closely.
{future}(ZRXUSDT)
#ZRXUSDT #ArthurHayes’LatestSpeech #BinanceLaunchesGoldvs.BTCTradingCompetition #StrategyBTCPurchase
$ZRX Recovery Bounce: Buyers Reclaiming Structure
Trade Setup
Direction: LONG
Entry Zone: 0.1130 – 0.1145
Stop Loss: 0.1100
Target 1 : 0.1180
Target 2 : 0.1220
Target 3 : 0.1280
ZRX is currently demonstrating a high-conviction recovery following a sharp sell-off. The price action has successfully reclaimed short-term structural levels, signaling that buyers are re-entering the market to defend this local base.
Technical Insight
The recent price reclaim suggests a shift in momentum as the "sharp sell-off" phase transitions into a stabilization period. By entering within the 0.1130 – 0.1145 liquidity zone, we are positioning ourselves for a tactical bounce toward major resistance. A strict stop loss at 0.1100 ensures capital preservation if the broader market volatility persists.
Execution Strategy: We are looking for high-volume confirmation on the 1H timeframe to validate the push toward TP1. Watch for the reclaim of recent highs to accelerate the trend.
Is $ZRX gearing up for a full trend reversal, or is this just a tactical relief rally? Let’s monitor the volume closely.
#ZRXUSDT #ArthurHayes’LatestSpeech #BinanceLaunchesGoldvs.BTCTradingCompetition #StrategyBTCPurchase
Trade Setup
Direction: LONG
Entry Zone: 0.1130 – 0.1145
Stop Loss: 0.1100
Target 1 : 0.1180
Target 2 : 0.1220
Target 3 : 0.1280
ZRX is currently demonstrating a high-conviction recovery following a sharp sell-off. The price action has successfully reclaimed short-term structural levels, signaling that buyers are re-entering the market to defend this local base.
Technical Insight
The recent price reclaim suggests a shift in momentum as the "sharp sell-off" phase transitions into a stabilization period. By entering within the 0.1130 – 0.1145 liquidity zone, we are positioning ourselves for a tactical bounce toward major resistance. A strict stop loss at 0.1100 ensures capital preservation if the broader market volatility persists.
Execution Strategy: We are looking for high-volume confirmation on the 1H timeframe to validate the push toward TP1. Watch for the reclaim of recent highs to accelerate the trend.
Is $ZRX gearing up for a full trend reversal, or is this just a tactical relief rally? Let’s monitor the volume closely.
#ZRXUSDT #ArthurHayes’LatestSpeech #BinanceLaunchesGoldvs.BTCTradingCompetition #StrategyBTCPurchase
1
76


·
--
Bullish
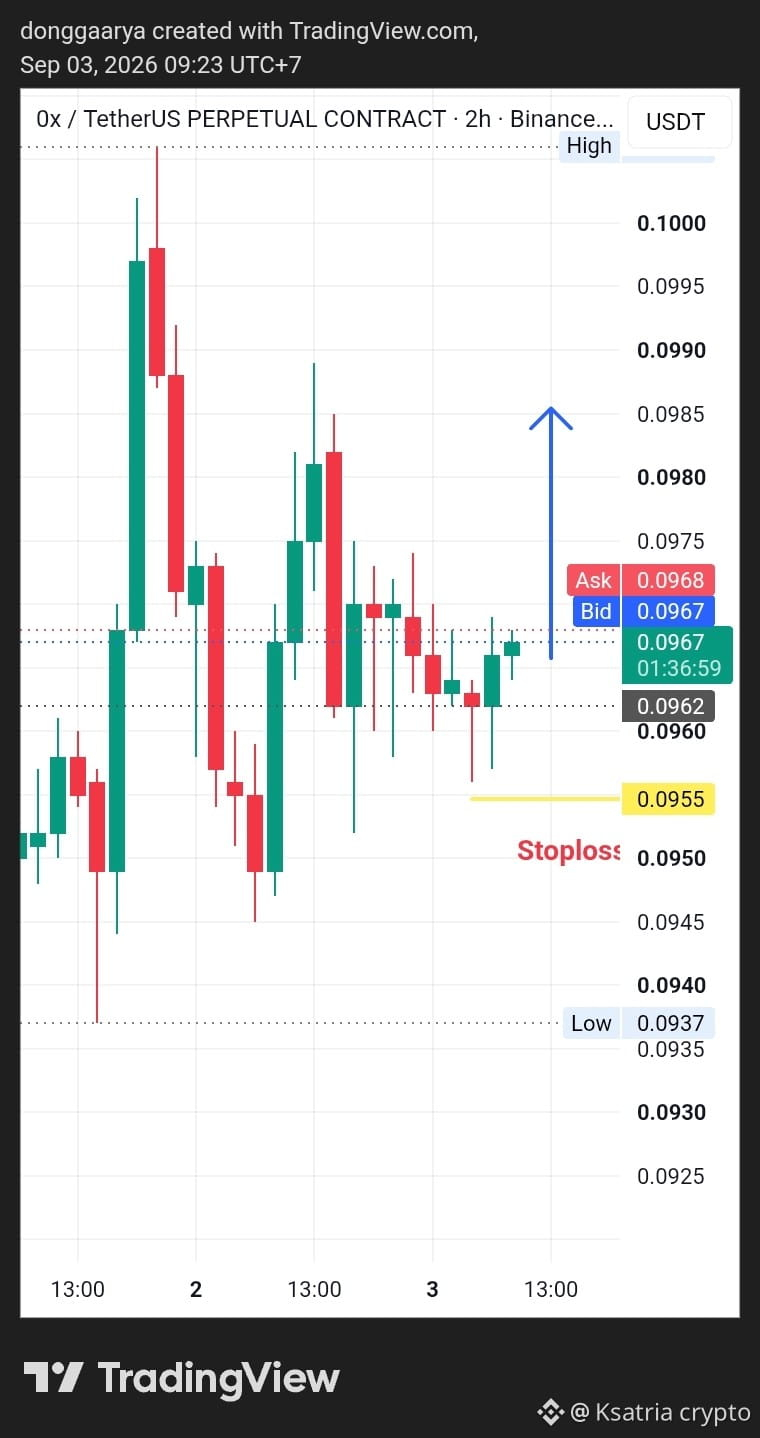
$ZRX TAKE LONG POSITION NOW
SL 0,0955 ( day trading )
$ZRX zrx take long position now after show reversal moments at support level 0,0937 and potential for breakout and move more higher to next resistance at range level 0,1100.
Based our macroeconomics fundamental analysist this coin show positif open interest ( OI) ITS means capital inflow more than capital outflow . $ZRX
#Write2Earn #ZRX #ZRXUSDT #signaladvisor #ZRX_USDT
{future}(ZRXUSDT)
$ZRX TAKE LONG POSITION NOW
SL 0,0955 ( day trading )
$ZRX zrx take long position now after show reversal moments at support level 0,0937 and potential for breakout and move more higher to next resistance at range level 0,1100.
Based our macroeconomics fundamental analysist this coin show positif open interest ( OI) ITS means capital inflow more than capital outflow . $ZRX
#Write2Earn #ZRX #ZRXUSDT #signaladvisor #ZRX_USDT
SL 0,0955 ( day trading )
$ZRX zrx take long position now after show reversal moments at support level 0,0937 and potential for breakout and move more higher to next resistance at range level 0,1100.
Based our macroeconomics fundamental analysist this coin show positif open interest ( OI) ITS means capital inflow more than capital outflow . $ZRX
#Write2Earn #ZRX #ZRXUSDT #signaladvisor #ZRX_USDT
1
495

·
--
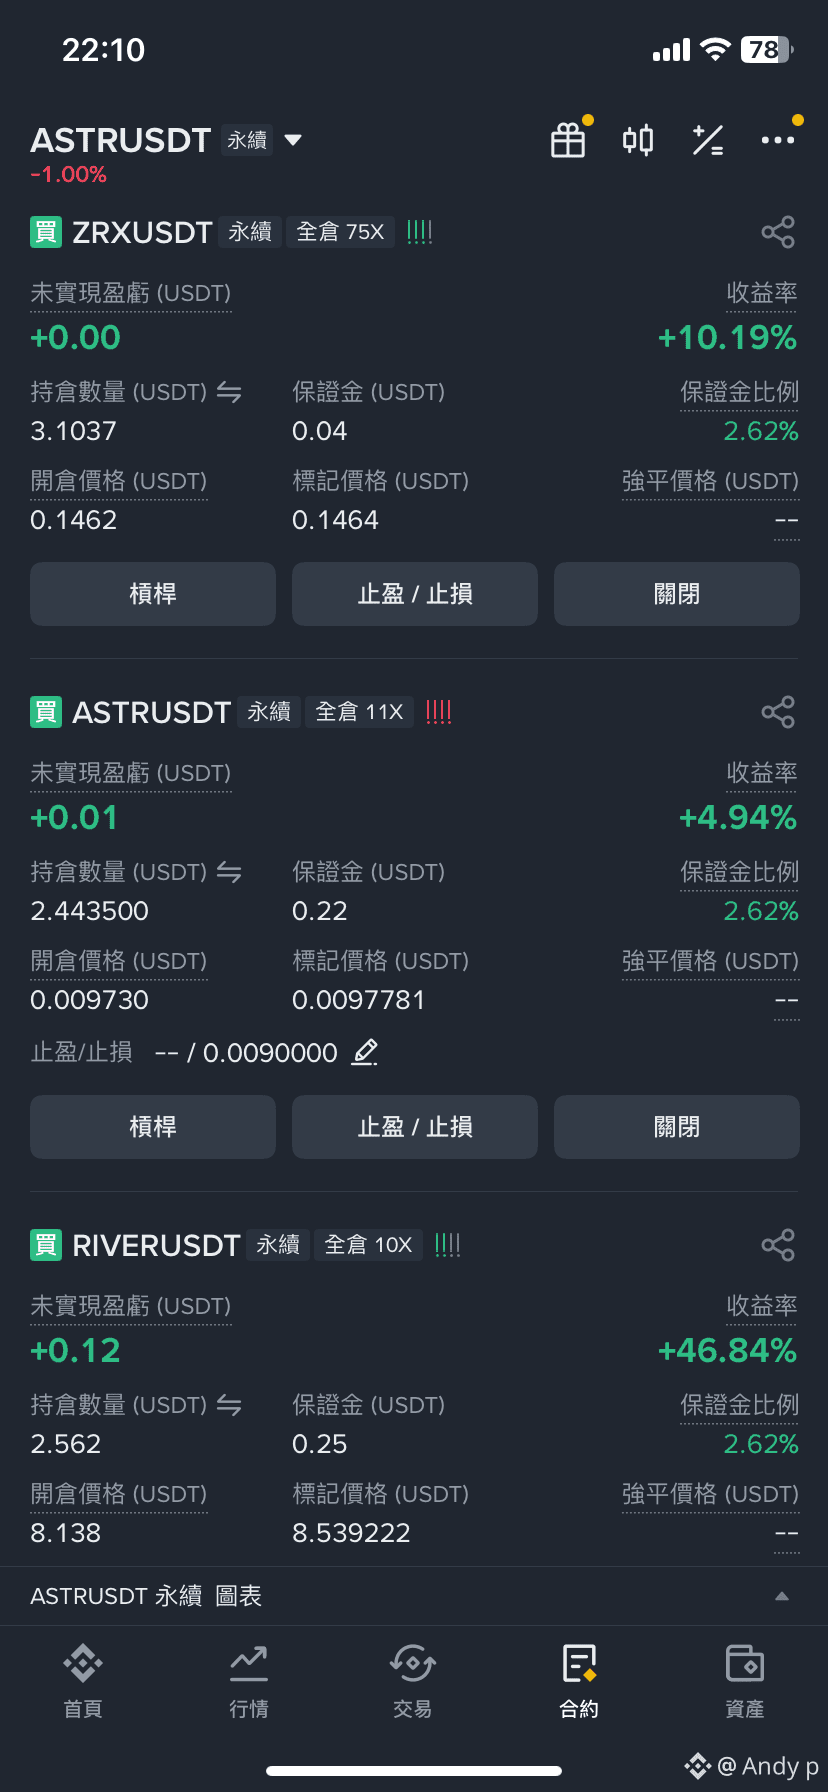
#ZRXUSDT The days have also gotten better, this time we still won't win
#ZRXUSDT The days have also gotten better, this time we still won't win
260

·
--
Bullish
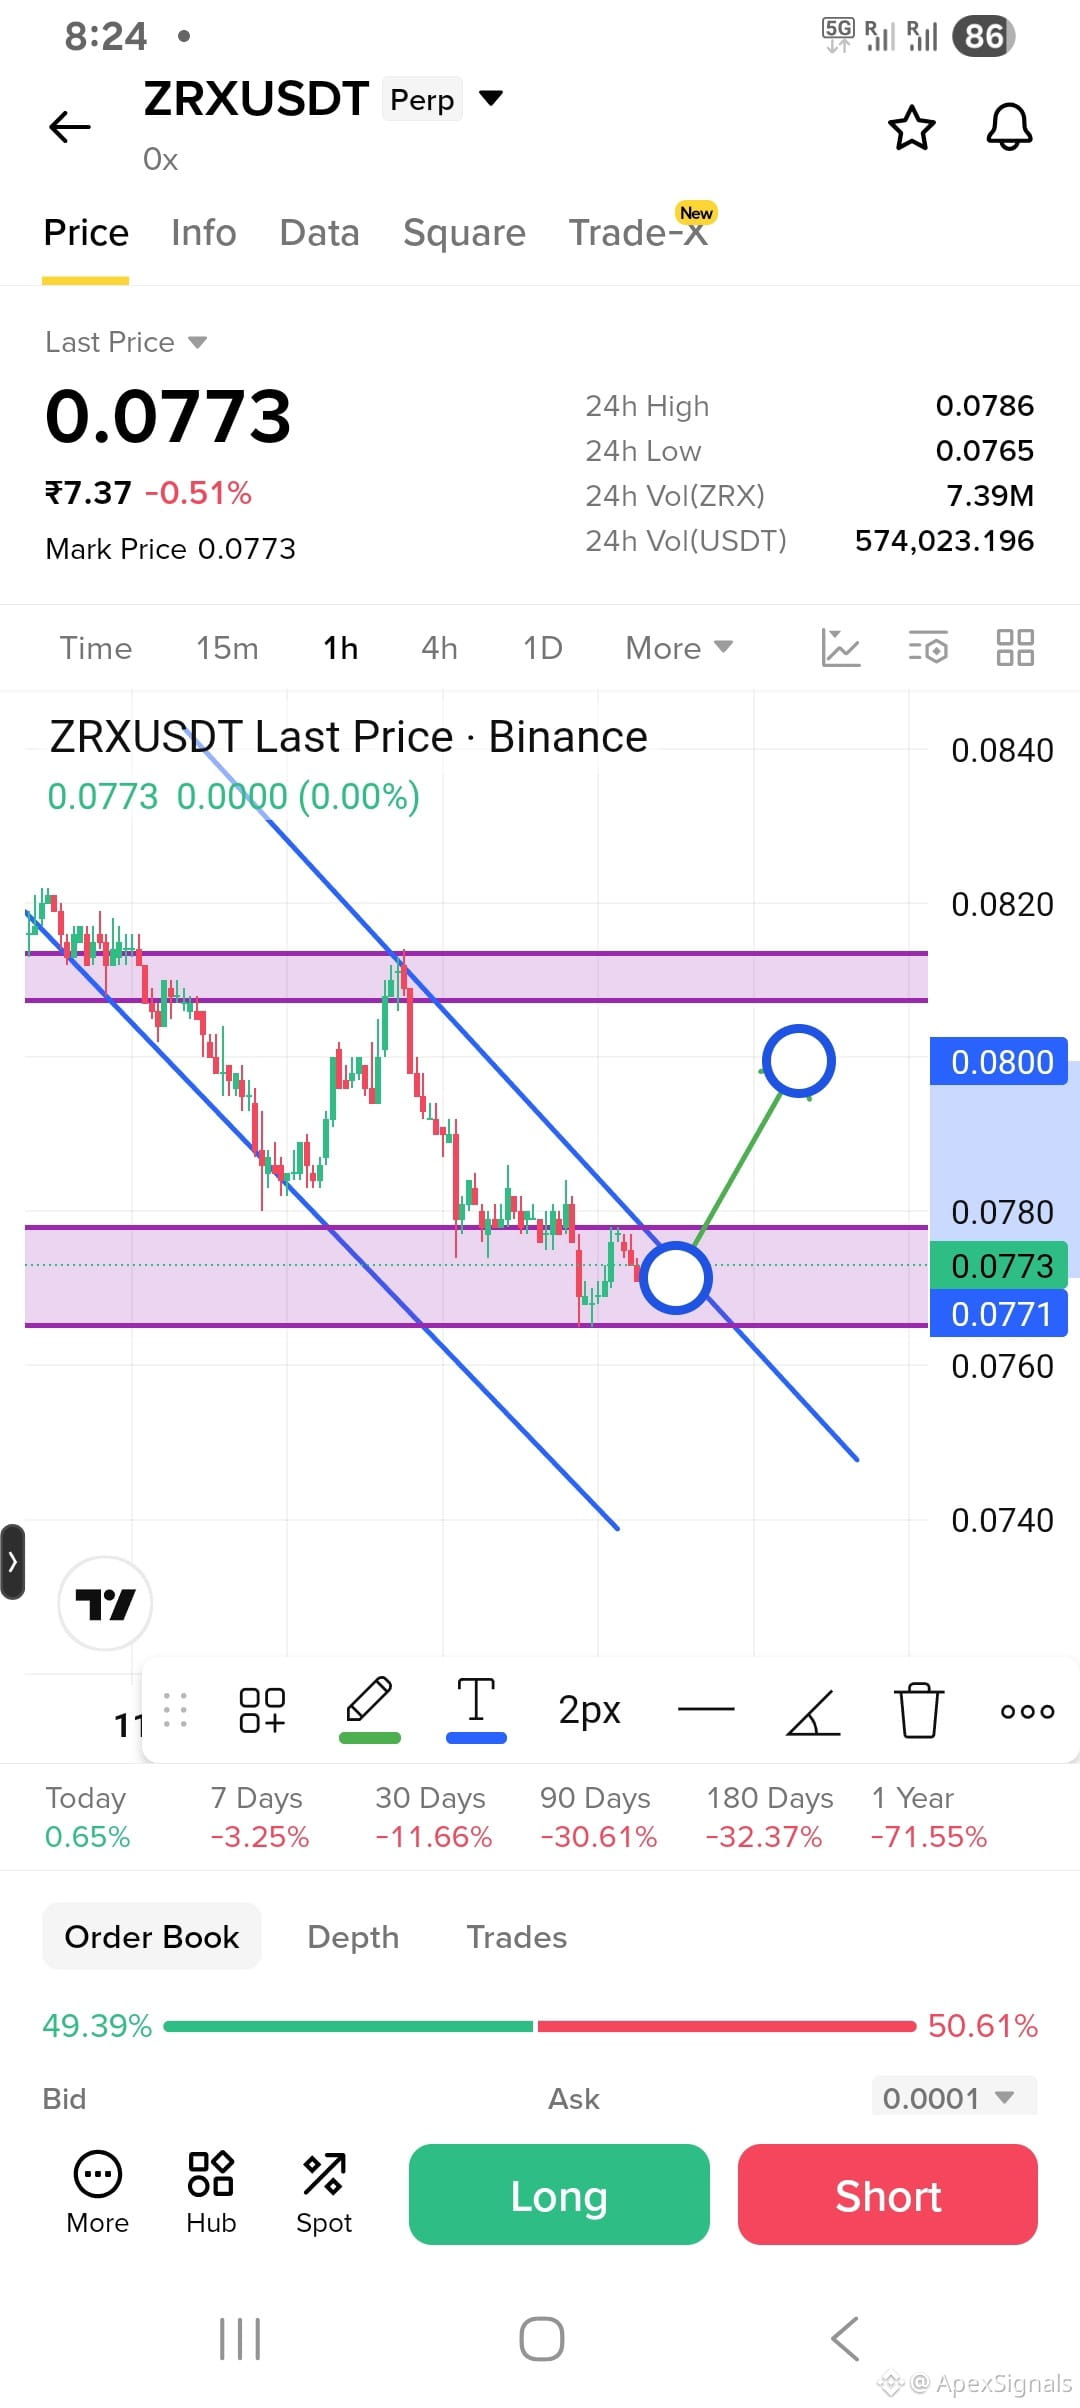
📊 $ZRX /USDT 1H Analysis — Bullish Rebound Possible 🚀
ZRX is trading around $0.0773, currently testing an important $0.0771–$0.0780 support zone inside the broader descending structure.
🟢 Bullish Scenario:
If this support holds and price breaks above the descending trendline, a recovery toward $0.0800 becomes possible.
🎯 Potential Target: $0.0800
🛡️ Key Support: $0.0771
🚧 Next Resistance: $0.0800–$0.0810
⚡ Bias: Bullish rebound possible, but breakout confirmation is important.
A clean break below $0.0771 would weaken the bullish setup and could continue the downtrend.
⚠️ Disclaimer: Market analysis only, not financial advice. Always use proper risk management and stop loss.
#ZRX #ZRXUSDT #Crypto #TradingAnalysis #Binance
{future}(ZRXUSDT)
📊 $ZRX /USDT 1H Analysis — Bullish Rebound Possible 🚀
ZRX is trading around $0.0773, currently testing an important $0.0771–$0.0780 support zone inside the broader descending structure.
🟢 Bullish Scenario:
If this support holds and price breaks above the descending trendline, a recovery toward $0.0800 becomes possible.
🎯 Potential Target: $0.0800
🛡️ Key Support: $0.0771
🚧 Next Resistance: $0.0800–$0.0810
⚡ Bias: Bullish rebound possible, but breakout confirmation is important.
A clean break below $0.0771 would weaken the bullish setup and could continue the downtrend.
⚠️ Disclaimer: Market analysis only, not financial advice. Always use proper risk management and stop loss.
#ZRX #ZRXUSDT #Crypto #TradingAnalysis #Binance
ZRX is trading around $0.0773, currently testing an important $0.0771–$0.0780 support zone inside the broader descending structure.
🟢 Bullish Scenario:
If this support holds and price breaks above the descending trendline, a recovery toward $0.0800 becomes possible.
🎯 Potential Target: $0.0800
🛡️ Key Support: $0.0771
🚧 Next Resistance: $0.0800–$0.0810
⚡ Bias: Bullish rebound possible, but breakout confirmation is important.
A clean break below $0.0771 would weaken the bullish setup and could continue the downtrend.
⚠️ Disclaimer: Market analysis only, not financial advice. Always use proper risk management and stop loss.
#ZRX #ZRXUSDT #Crypto #TradingAnalysis #Binance
3
68

·
--
Bullish
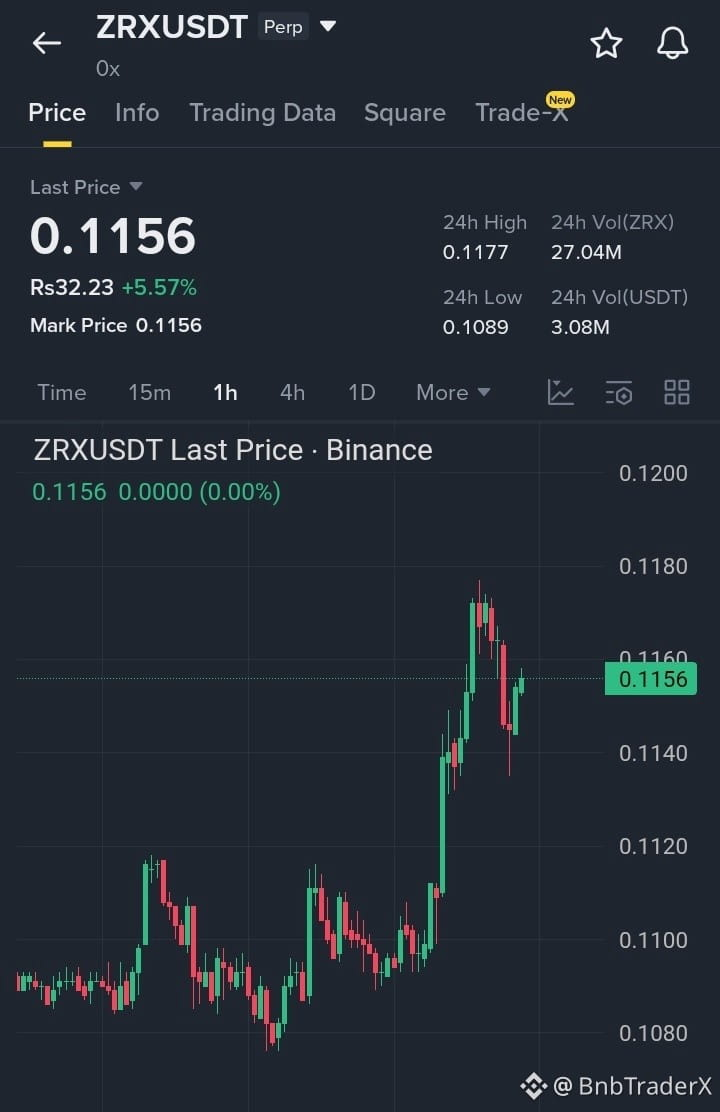
$ZRX shows a significant bullish breakout on the 1-hour chart, successfully clearing the previous accumulation zone. This upward surge is supported by strong volume, suggesting that buyers are in control and the momentum could continue if the price holds above the immediate support levels. While a small consolidation is natural after such a spike, the overall structure remains positive for a continued rally toward higher resistance zones.
Target 1: $0.1177
Target 2: $0.1215
Target 3: $0.1250
#ZRX #TradingSignals #BinanceSquare #Trending2026 #ZRXUSDT
{spot}(ZRXUSDT)
$ZRX shows a significant bullish breakout on the 1-hour chart, successfully clearing the previous accumulation zone. This upward surge is supported by strong volume, suggesting that buyers are in control and the momentum could continue if the price holds above the immediate support levels. While a small consolidation is natural after such a spike, the overall structure remains positive for a continued rally toward higher resistance zones.
Target 1: $0.1177
Target 2: $0.1215
Target 3: $0.1250
#ZRX #TradingSignals #BinanceSquare #Trending2026 #ZRXUSDT
Target 1: $0.1177
Target 2: $0.1215
Target 3: $0.1250
#ZRX #TradingSignals #BinanceSquare #Trending2026 #ZRXUSDT
1
147

·
--
Bullish
$ZRX
{future}(ZRXUSDT)
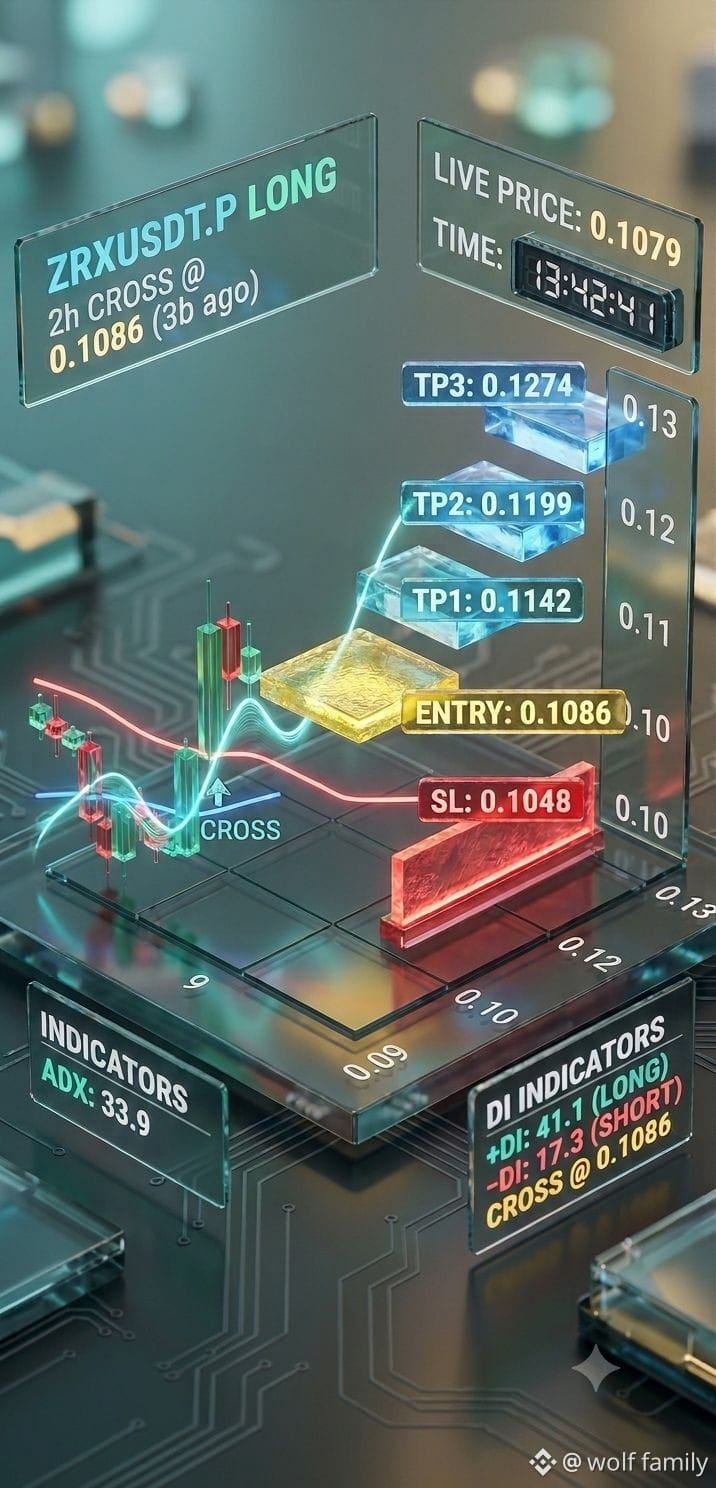
🚀 ZRX/USDT LONG SIGNAL SETUP 🚀
📊 Pair: ZRXUSDT.P (Long)
⏰ Timeframe: 2H Cross
📍 Live Price: 0.1079
🔹 Entry Level: 0.1086
🛑 Stop Loss (SL): 0.1048
🎯 Target 1 (TP1): 0.1142
🎯 Target 2 (TP2): 0.1199
🎯 Target 3 (TP3): 0.1274
📈 Technical Indicators:
• ADX: 33.9 (Strong Trend)
• +DI (Long): 41.1
• -DI (Short): 17.3
• DI Cross: Bullish @ 0.1086
⚠️ Always manage your risk according to your strategy!
#ZRX #ZRXUSDT
#CryptoTrading #Altcoins #wolffamily
$ZRX
🚀 ZRX/USDT LONG SIGNAL SETUP 🚀
📊 Pair: ZRXUSDT.P (Long)
⏰ Timeframe: 2H Cross
📍 Live Price: 0.1079
🔹 Entry Level: 0.1086
🛑 Stop Loss (SL): 0.1048
🎯 Target 1 (TP1): 0.1142
🎯 Target 2 (TP2): 0.1199
🎯 Target 3 (TP3): 0.1274
📈 Technical Indicators:
• ADX: 33.9 (Strong Trend)
• +DI (Long): 41.1
• -DI (Short): 17.3
• DI Cross: Bullish @ 0.1086
⚠️ Always manage your risk according to your strategy!
#ZRX #ZRXUSDT
#CryptoTrading #Altcoins #wolffamily
🚀 ZRX/USDT LONG SIGNAL SETUP 🚀
📊 Pair: ZRXUSDT.P (Long)
⏰ Timeframe: 2H Cross
📍 Live Price: 0.1079
🔹 Entry Level: 0.1086
🛑 Stop Loss (SL): 0.1048
🎯 Target 1 (TP1): 0.1142
🎯 Target 2 (TP2): 0.1199
🎯 Target 3 (TP3): 0.1274
📈 Technical Indicators:
• ADX: 33.9 (Strong Trend)
• +DI (Long): 41.1
• -DI (Short): 17.3
• DI Cross: Bullish @ 0.1086
⚠️ Always manage your risk according to your strategy!
#ZRX #ZRXUSDT
#CryptoTrading #Altcoins #wolffamily
112
Log in to explore more content
Join global crypto users on Binance Square
⚡️ Get latest and useful information about crypto.
💬 Trusted by the world’s largest crypto exchange.
👍 Discover real insights from verified creators.
Email / Phone number
Trending Topics
1
#CryptoSelloffTriggersMultipleWhaleLiquidations
148,400 views
1,611 Discussing
2
#USSpotXRPETFsSeeLargestWeeklyOutflowIn8Months
139,631 views
1,470 Discussing
3
#WillFOMCMinutesReinforceRateHikeExpectations?
38,695 views
675 Discussing
4
#BitcoinActiveSupplyInProfitDropsBelow45%
215,025 views
1,733 Discussing
5
#TONStrategyReports$23.97MQ3NetLoss
18,626 views
139 Discussing
6
#KavaSaysAbnormalActivityLimitedToKavaLend
141,272 views
976 Discussing
7
#WORPTLetsTouristsConvertCryptoToThaiBaht
47,505 views
388 Discussing
8
#WhoWillSucceedJensenHuangatNvidia?
334,505 views
2,130 Discussing
9
#WhatWillDriveCryptoandStocks’NextRebound?
854,316 views
3,944 Discussing
10
#TradFiForBeginners
837,402 views
4,951 Discussing