
#xml
xml
108,177 views
107 Discussing
Hot
Latest

#XML 🚀🔥 #XML $XML
After three attempts to breach the trend line...
We are now facing the fourth attempt, which this time comes alongside a clear price accumulation—an area worth following closely. 🧐📈
For every time breach attempts repeat...
As the price continues to consolidate without losing its key zones...
The likelihood of a successful breakout in one of the next attempts increases.
But...
We don’t rely on expectations alone.
Instead, we wait for the close and confirmation before considering the breakout successful, because markets often trick traders with fake breakouts.
Therefore...
Keep a close eye on this area...
It could be the start of a new move if the price manages to break the trend line and hold above it.
Patience for the signal... is better than chasing the move after it starts. 🚀📊
#XML 🚀🔥 #XML $XML
After three attempts to breach the trend line...
We are now facing the fourth attempt, which this time comes alongside a clear price accumulation—an area worth following closely. 🧐📈
For every time breach attempts repeat...
As the price continues to consolidate without losing its key zones...
The likelihood of a successful breakout in one of the next attempts increases.
But...
We don’t rely on expectations alone.
Instead, we wait for the close and confirmation before considering the breakout successful, because markets often trick traders with fake breakouts.
Therefore...
Keep a close eye on this area...
It could be the start of a new move if the price manages to break the trend line and hold above it.
Patience for the signal... is better than chasing the move after it starts. 🚀📊
After three attempts to breach the trend line...
We are now facing the fourth attempt, which this time comes alongside a clear price accumulation—an area worth following closely. 🧐📈
For every time breach attempts repeat...
As the price continues to consolidate without losing its key zones...
The likelihood of a successful breakout in one of the next attempts increases.
But...
We don’t rely on expectations alone.
Instead, we wait for the close and confirmation before considering the breakout successful, because markets often trick traders with fake breakouts.
Therefore...
Keep a close eye on this area...
It could be the start of a new move if the price manages to break the trend line and hold above it.
Patience for the signal... is better than chasing the move after it starts. 🚀📊
93

·
--
Bullish
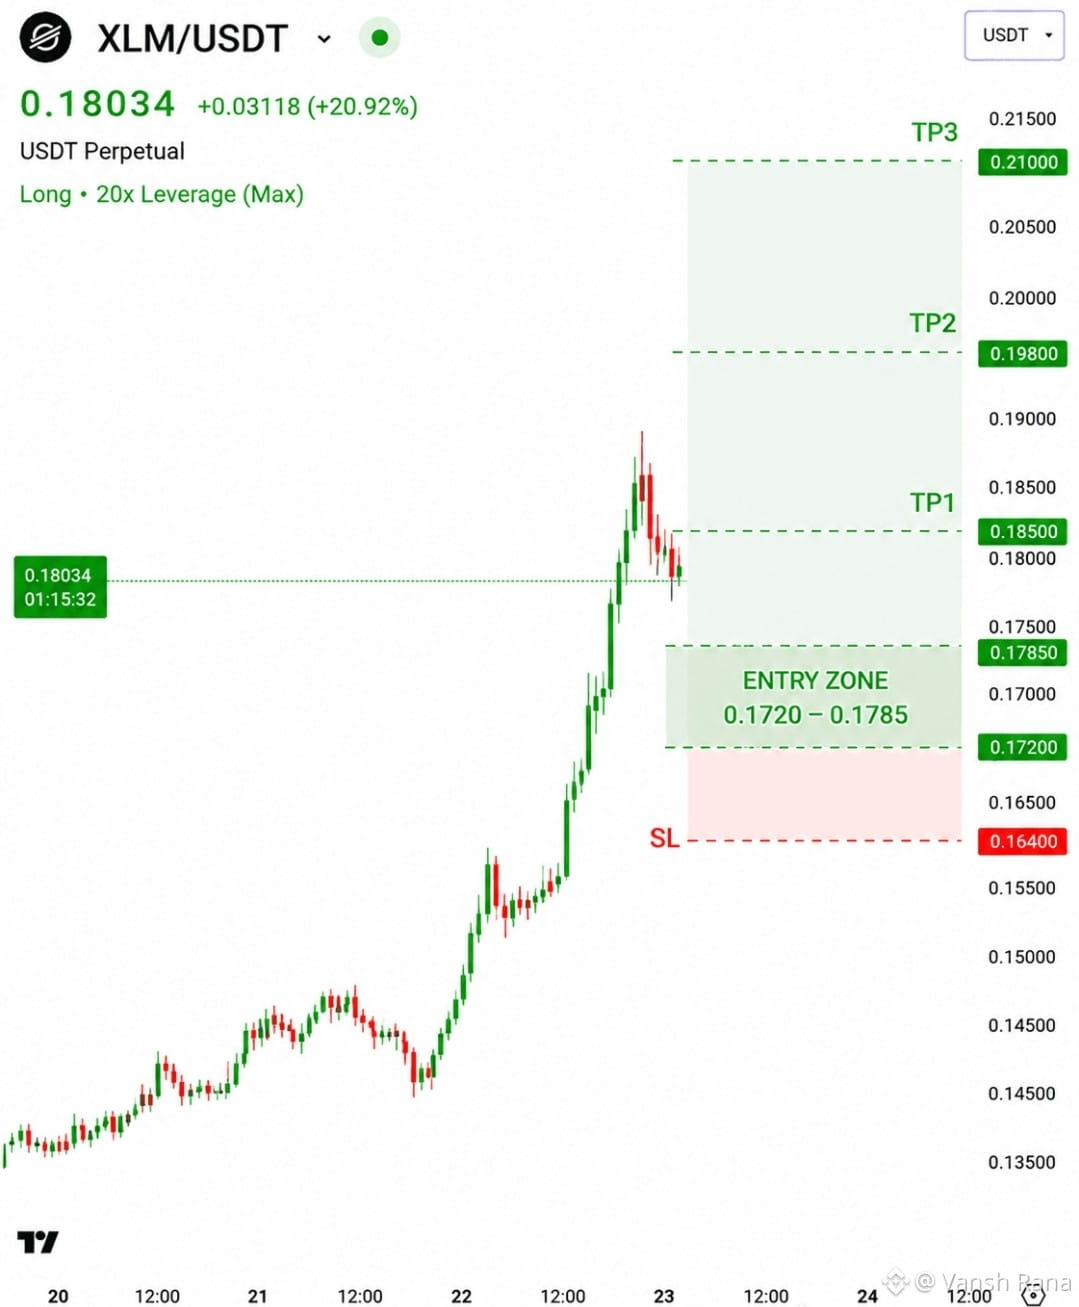
🚨$XLM LONG TRADE ALERT SIGNAL 🚨
I just analysed the graph and i saw Explosive Breakout — Bullish Momentum in Full Control.
So I just opened a #LONG✅ trade with the leaveage of 20X max 😉
Long #XML
Entry: 0.1720 – 0.1785
TP1: 0.1850
TP2: 0.1980
TP3: 0.2100
SL: 0.1640
I am 💯 percent sure about this move 😎
Let's earn together Guy 🤝
Don't miss now ‼️
$FIGHT $RIF
#TrumpCriticizesGenslerAntiCrypto #GrayscaleRenamesHYPEToStakingETF #ArgentinaBillIncludesVASPRegulation
{spot}(XLMUSDT)
{spot}(RIFUSDT)
{future}(FIGHTUSDT)
🚨$XLM LONG TRADE ALERT SIGNAL 🚨
I just analysed the graph and i saw Explosive Breakout — Bullish Momentum in Full Control.
So I just opened a #LONG✅ trade with the leaveage of 20X max 😉
Long #XML
Entry: 0.1720 – 0.1785
TP1: 0.1850
TP2: 0.1980
TP3: 0.2100
SL: 0.1640
I am 💯 percent sure about this move 😎
Let's earn together Guy 🤝
Don't miss now ‼️
$FIGHT $RIF
#TrumpCriticizesGenslerAntiCrypto #GrayscaleRenamesHYPEToStakingETF #ArgentinaBillIncludesVASPRegulation
I just analysed the graph and i saw Explosive Breakout — Bullish Momentum in Full Control.
So I just opened a #LONG✅ trade with the leaveage of 20X max 😉
Long #XML
Entry: 0.1720 – 0.1785
TP1: 0.1850
TP2: 0.1980
TP3: 0.2100
SL: 0.1640
I am 💯 percent sure about this move 😎
Let's earn together Guy 🤝
Don't miss now ‼️
$FIGHT $RIF
#TrumpCriticizesGenslerAntiCrypto #GrayscaleRenamesHYPEToStakingETF #ArgentinaBillIncludesVASPRegulation
1
2
162

Xml Coin ($XML) | Data and Decentralized Linking
The core idea: Often tied to data structures and their seamless formatting within Web3 networks.
Intelligence angle: Keep an eye on the trading volume and developer adoption. Projects that streamline data readability are the invisible backbone of DeFi.
#XML
Xml Coin ($XML) | Data and Decentralized Linking
The core idea: Often tied to data structures and their seamless formatting within Web3 networks.
Intelligence angle: Keep an eye on the trading volume and developer adoption. Projects that streamline data readability are the invisible backbone of DeFi.
#XML
The core idea: Often tied to data structures and their seamless formatting within Web3 networks.
Intelligence angle: Keep an eye on the trading volume and developer adoption. Projects that streamline data readability are the invisible backbone of DeFi.
#XML
1
86

🚀 XLM/USDT Long Signal
📥 Entry Zone:
0.1890 – 0.1920
🎯 Targets:
TP1: 0.2000
TP2: 0.2050
TP3: 0.2120
TP4: 0.2200
TP5: 0.2350
🛑 Stop Loss:
0.1700
⚠️ Follow money management. After reaching the first target, you can move the stop loss to the entry point to reduce the risk of the trade.
#XML #ALLO #ALGO_USDT
$XLM
{spot}(XLMUSDT)
$ALLO
{spot}(ALLOUSDT)
$ALGO
{spot}(ALGOUSDT)
🚀 XLM/USDT Long Signal
📥 Entry Zone:
0.1890 – 0.1920
🎯 Targets:
TP1: 0.2000
TP2: 0.2050
TP3: 0.2120
TP4: 0.2200
TP5: 0.2350
🛑 Stop Loss:
0.1700
⚠️ Follow money management. After reaching the first target, you can move the stop loss to the entry point to reduce the risk of the trade.
#XML #ALLO #ALGO_USDT
$XLM
$ALLO
$ALGO
📥 Entry Zone:
0.1890 – 0.1920
🎯 Targets:
TP1: 0.2000
TP2: 0.2050
TP3: 0.2120
TP4: 0.2200
TP5: 0.2350
🛑 Stop Loss:
0.1700
⚠️ Follow money management. After reaching the first target, you can move the stop loss to the entry point to reduce the risk of the trade.
#XML #ALLO #ALGO_USDT
$XLM
$ALLO
$ALGO
51



·
--
36

·
--
Bullish
1
1
567

·
--
In-depth analysis of Stellar (XLM)
Current price: $0.489 USD
3. Technical analysis:
• Support:
• Nearest support: $0.45 USD – This is the price range where XLM has bounced back in recent sessions.
• Strong support: $0.40 USD – A strong price zone, creating accumulation opportunities if the price drops.
• Resistance:
• Nearest resistance: $0.50 USD – The price level currently being tested and facing selling pressure.
• Strong resistance: $0.60 USD – A potential target when XLM maintains its upward trend.
• Technical indicators:
• RSI (Relative Strength Index): At 55-60, not in the overbought zone, indicating there is still room for price increase.
• MACD: Currently crossing up, indicating bullish momentum.
• Trading volume: Gradually increasing, signaling money is flowing in.
4. Investment recommendations:
When to buy XLM?
1. Short term:
• Buy when the price adjusts to the $0.45-$0.46 USD range.
• If the price exceeds $0.50 USD, it may be a good time to buy to take advantage of bullish momentum.
2. Medium term:
• Accumulate when the price is in the strong support range of $0.40-$0.45 USD, where the risk is lower.
3. Long term:
• Gradually buy at the current price levels to build a position if you believe in Stellar's long-term potential.
When to sell XLM?
1. Short term:
• Take profit at near resistance levels of $0.50-$0.55 USD.
2. Medium term:
• Take partial profits at $0.60 USD and hold a portion of the position to target higher.
3. Long term:
• If the market rises strongly, targets may be set at $0.70-$0.80 USD.
5. Investment strategy:
• Risk management:
• Cut losses if the price breaks below the strong support level of $0.40 USD.
• Capital allocation:
• Divide capital to buy at different support price levels.
#XML
In-depth analysis of Stellar (XLM)
Current price: $0.489 USD
3. Technical analysis:
• Support:
• Nearest support: $0.45 USD – This is the price range where XLM has bounced back in recent sessions.
• Strong support: $0.40 USD – A strong price zone, creating accumulation opportunities if the price drops.
• Resistance:
• Nearest resistance: $0.50 USD – The price level currently being tested and facing selling pressure.
• Strong resistance: $0.60 USD – A potential target when XLM maintains its upward trend.
• Technical indicators:
• RSI (Relative Strength Index): At 55-60, not in the overbought zone, indicating there is still room for price increase.
• MACD: Currently crossing up, indicating bullish momentum.
• Trading volume: Gradually increasing, signaling money is flowing in.
4. Investment recommendations:
When to buy XLM?
1. Short term:
• Buy when the price adjusts to the $0.45-$0.46 USD range.
• If the price exceeds $0.50 USD, it may be a good time to buy to take advantage of bullish momentum.
2. Medium term:
• Accumulate when the price is in the strong support range of $0.40-$0.45 USD, where the risk is lower.
3. Long term:
• Gradually buy at the current price levels to build a position if you believe in Stellar's long-term potential.
When to sell XLM?
1. Short term:
• Take profit at near resistance levels of $0.50-$0.55 USD.
2. Medium term:
• Take partial profits at $0.60 USD and hold a portion of the position to target higher.
3. Long term:
• If the market rises strongly, targets may be set at $0.70-$0.80 USD.
5. Investment strategy:
• Risk management:
• Cut losses if the price breaks below the strong support level of $0.40 USD.
• Capital allocation:
• Divide capital to buy at different support price levels.
#XML
Current price: $0.489 USD
3. Technical analysis:
• Support:
• Nearest support: $0.45 USD – This is the price range where XLM has bounced back in recent sessions.
• Strong support: $0.40 USD – A strong price zone, creating accumulation opportunities if the price drops.
• Resistance:
• Nearest resistance: $0.50 USD – The price level currently being tested and facing selling pressure.
• Strong resistance: $0.60 USD – A potential target when XLM maintains its upward trend.
• Technical indicators:
• RSI (Relative Strength Index): At 55-60, not in the overbought zone, indicating there is still room for price increase.
• MACD: Currently crossing up, indicating bullish momentum.
• Trading volume: Gradually increasing, signaling money is flowing in.
4. Investment recommendations:
When to buy XLM?
1. Short term:
• Buy when the price adjusts to the $0.45-$0.46 USD range.
• If the price exceeds $0.50 USD, it may be a good time to buy to take advantage of bullish momentum.
2. Medium term:
• Accumulate when the price is in the strong support range of $0.40-$0.45 USD, where the risk is lower.
3. Long term:
• Gradually buy at the current price levels to build a position if you believe in Stellar's long-term potential.
When to sell XLM?
1. Short term:
• Take profit at near resistance levels of $0.50-$0.55 USD.
2. Medium term:
• Take partial profits at $0.60 USD and hold a portion of the position to target higher.
3. Long term:
• If the market rises strongly, targets may be set at $0.70-$0.80 USD.
5. Investment strategy:
• Risk management:
• Cut losses if the price breaks below the strong support level of $0.40 USD.
• Capital allocation:
• Divide capital to buy at different support price levels.
#XML

10
1
18
13.9k

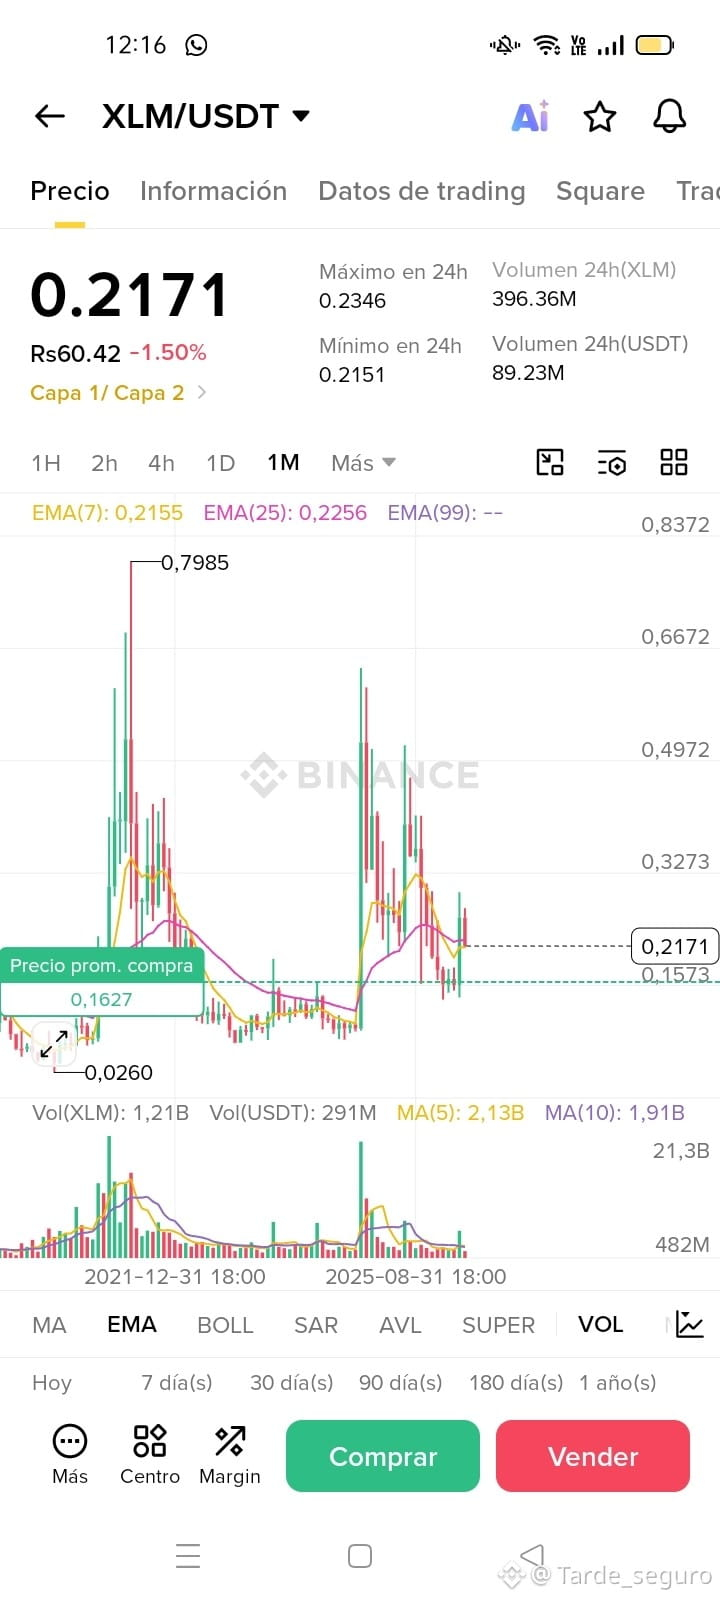
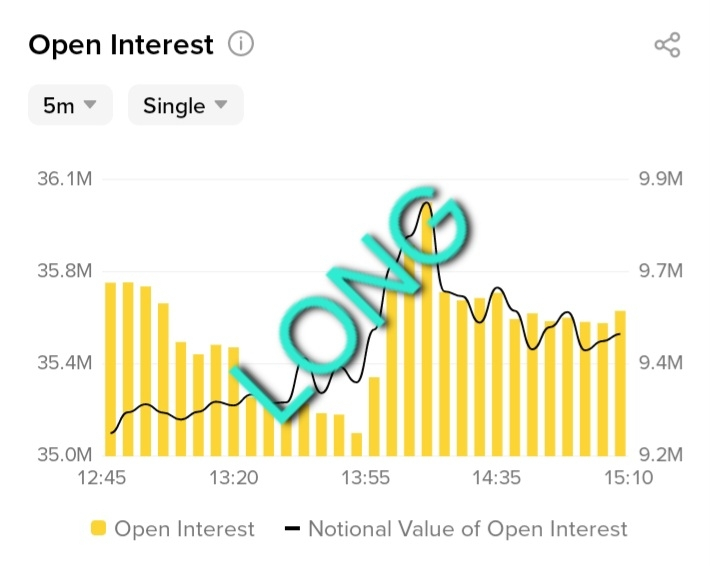
Didn't got in early, hence the low leverage, but #xml is looking promising. What values should i be looking for? #BinanceTurns8
Didn't got in early, hence the low leverage, but #xml is looking promising. What values should i be looking for? #BinanceTurns8
2
574


·
--
Derivatives & Funding RatesAs of April 22, 2026, the cryptocurrency derivatives market has shown signs of extreme, one-sided positioning in specific altcoins, with annualized funding rates exceeding 200% for certain tokens, signaling "overheated" or heavily crowded long trades. While some "M tokens" have hit these extreme levels, analysis indicates that the market for HYPE (Hyperliquid) and XML (XLM/Stellar) presents a different dynamic, characterized more by bearish short positioning in the derivatives space.
"Overheated" Long Positions (High Funding Rates)
Extreme Outlier (M Token): Annualized funding rates above 200% on specific tokens (such as "M token") suggest an extremely crowded bullish bet, where long traders pay exorbitant fees to maintain their positions. Such high rates indicate that speculators are aggressively leveraged long, making the market vulnerable to sharp reversals or "long squeezes" if price momentum stalls.Implications of 200%+ Funding: Such extreme rates indicate high demand to hold long perpetual futures relative to short positions, often resulting in futures prices significantly exceeding the spot price.
Analysis of HYPE and XML Derivatives Market
Contrarily to the "overheated" long sentiment seen in other tokens, the HYPE and XML markets show different characteristics as of late April 2026:
Bearish Short Bias: The HYPE and XML markets have demonstrated a bias toward bearish short positions, rather than overcrowded longs.HYPE (Hyperliquid): Despite high-profile bullish forecasts (e.g., $150 by Aug 2026), the derivatives market has exhibited moments of short-selling pressure. However, HYPE's fundamentals are supported by strong protocol buybacks and high on-chain volume, with a recent 25% surge driven by the HIP-3 Commodity Protocol.XML/XLM (Stellar): As of April 17, 2026, Stellar (XLM) experienced a 1.5% gain, participating in a broader altcoin rally but not being explicitly cited among the 200% funding rate outlier group.
Market Context (April 2026)
Short Squeeze Risks: Broadly, the crypto futures market suggests potential for further gains, but the high funding rates on some altcoins suggest a defensive posture is necessary as liquidity-driven breakouts are anticipated.Contrarian Signal: Extremely high positive funding rates are often treated by experienced traders as a contrarian indicator, a "market thermometer", signaling a potential local top where the "crowd" is overleveraged on the long side.
$HYPE #XML
Derivatives & Funding Rates
As of April 22, 2026, the cryptocurrency derivatives market has shown signs of extreme, one-sided positioning in specific altcoins, with annualized funding rates exceeding 200% for certain tokens, signaling "overheated" or heavily crowded long trades. While some "M tokens" have hit these extreme levels, analysis indicates that the market for HYPE (Hyperliquid) and XML (XLM/Stellar) presents a different dynamic, characterized more by bearish short positioning in the derivatives space.
"Overheated" Long Positions (High Funding Rates)
Extreme Outlier (M Token): Annualized funding rates above 200% on specific tokens (such as "M token") suggest an extremely crowded bullish bet, where long traders pay exorbitant fees to maintain their positions. Such high rates indicate that speculators are aggressively leveraged long, making the market vulnerable to sharp reversals or "long squeezes" if price momentum stalls.Implications of 200%+ Funding: Such extreme rates indicate high demand to hold long perpetual futures relative to short positions, often resulting in futures prices significantly exceeding the spot price.
Analysis of HYPE and XML Derivatives Market
Contrarily to the "overheated" long sentiment seen in other tokens, the HYPE and XML markets show different characteristics as of late April 2026:
Bearish Short Bias: The HYPE and XML markets have demonstrated a bias toward bearish short positions, rather than overcrowded longs.HYPE (Hyperliquid): Despite high-profile bullish forecasts (e.g., $150 by Aug 2026), the derivatives market has exhibited moments of short-selling pressure. However, HYPE's fundamentals are supported by strong protocol buybacks and high on-chain volume, with a recent 25% surge driven by the HIP-3 Commodity Protocol.XML/XLM (Stellar): As of April 17, 2026, Stellar (XLM) experienced a 1.5% gain, participating in a broader altcoin rally but not being explicitly cited among the 200% funding rate outlier group.
Market Context (April 2026)
Short Squeeze Risks: Broadly, the crypto futures market suggests potential for further gains, but the high funding rates on some altcoins suggest a defensive posture is necessary as liquidity-driven breakouts are anticipated.Contrarian Signal: Extremely high positive funding rates are often treated by experienced traders as a contrarian indicator, a "market thermometer", signaling a potential local top where the "crowd" is overleveraged on the long side.
$HYPE #XML
"Overheated" Long Positions (High Funding Rates)
Extreme Outlier (M Token): Annualized funding rates above 200% on specific tokens (such as "M token") suggest an extremely crowded bullish bet, where long traders pay exorbitant fees to maintain their positions. Such high rates indicate that speculators are aggressively leveraged long, making the market vulnerable to sharp reversals or "long squeezes" if price momentum stalls.Implications of 200%+ Funding: Such extreme rates indicate high demand to hold long perpetual futures relative to short positions, often resulting in futures prices significantly exceeding the spot price.
Analysis of HYPE and XML Derivatives Market
Contrarily to the "overheated" long sentiment seen in other tokens, the HYPE and XML markets show different characteristics as of late April 2026:
Bearish Short Bias: The HYPE and XML markets have demonstrated a bias toward bearish short positions, rather than overcrowded longs.HYPE (Hyperliquid): Despite high-profile bullish forecasts (e.g., $150 by Aug 2026), the derivatives market has exhibited moments of short-selling pressure. However, HYPE's fundamentals are supported by strong protocol buybacks and high on-chain volume, with a recent 25% surge driven by the HIP-3 Commodity Protocol.XML/XLM (Stellar): As of April 17, 2026, Stellar (XLM) experienced a 1.5% gain, participating in a broader altcoin rally but not being explicitly cited among the 200% funding rate outlier group.
Market Context (April 2026)
Short Squeeze Risks: Broadly, the crypto futures market suggests potential for further gains, but the high funding rates on some altcoins suggest a defensive posture is necessary as liquidity-driven breakouts are anticipated.Contrarian Signal: Extremely high positive funding rates are often treated by experienced traders as a contrarian indicator, a "market thermometer", signaling a potential local top where the "crowd" is overleveraged on the long side.
$HYPE #XML
1
236

·
--
Bullish
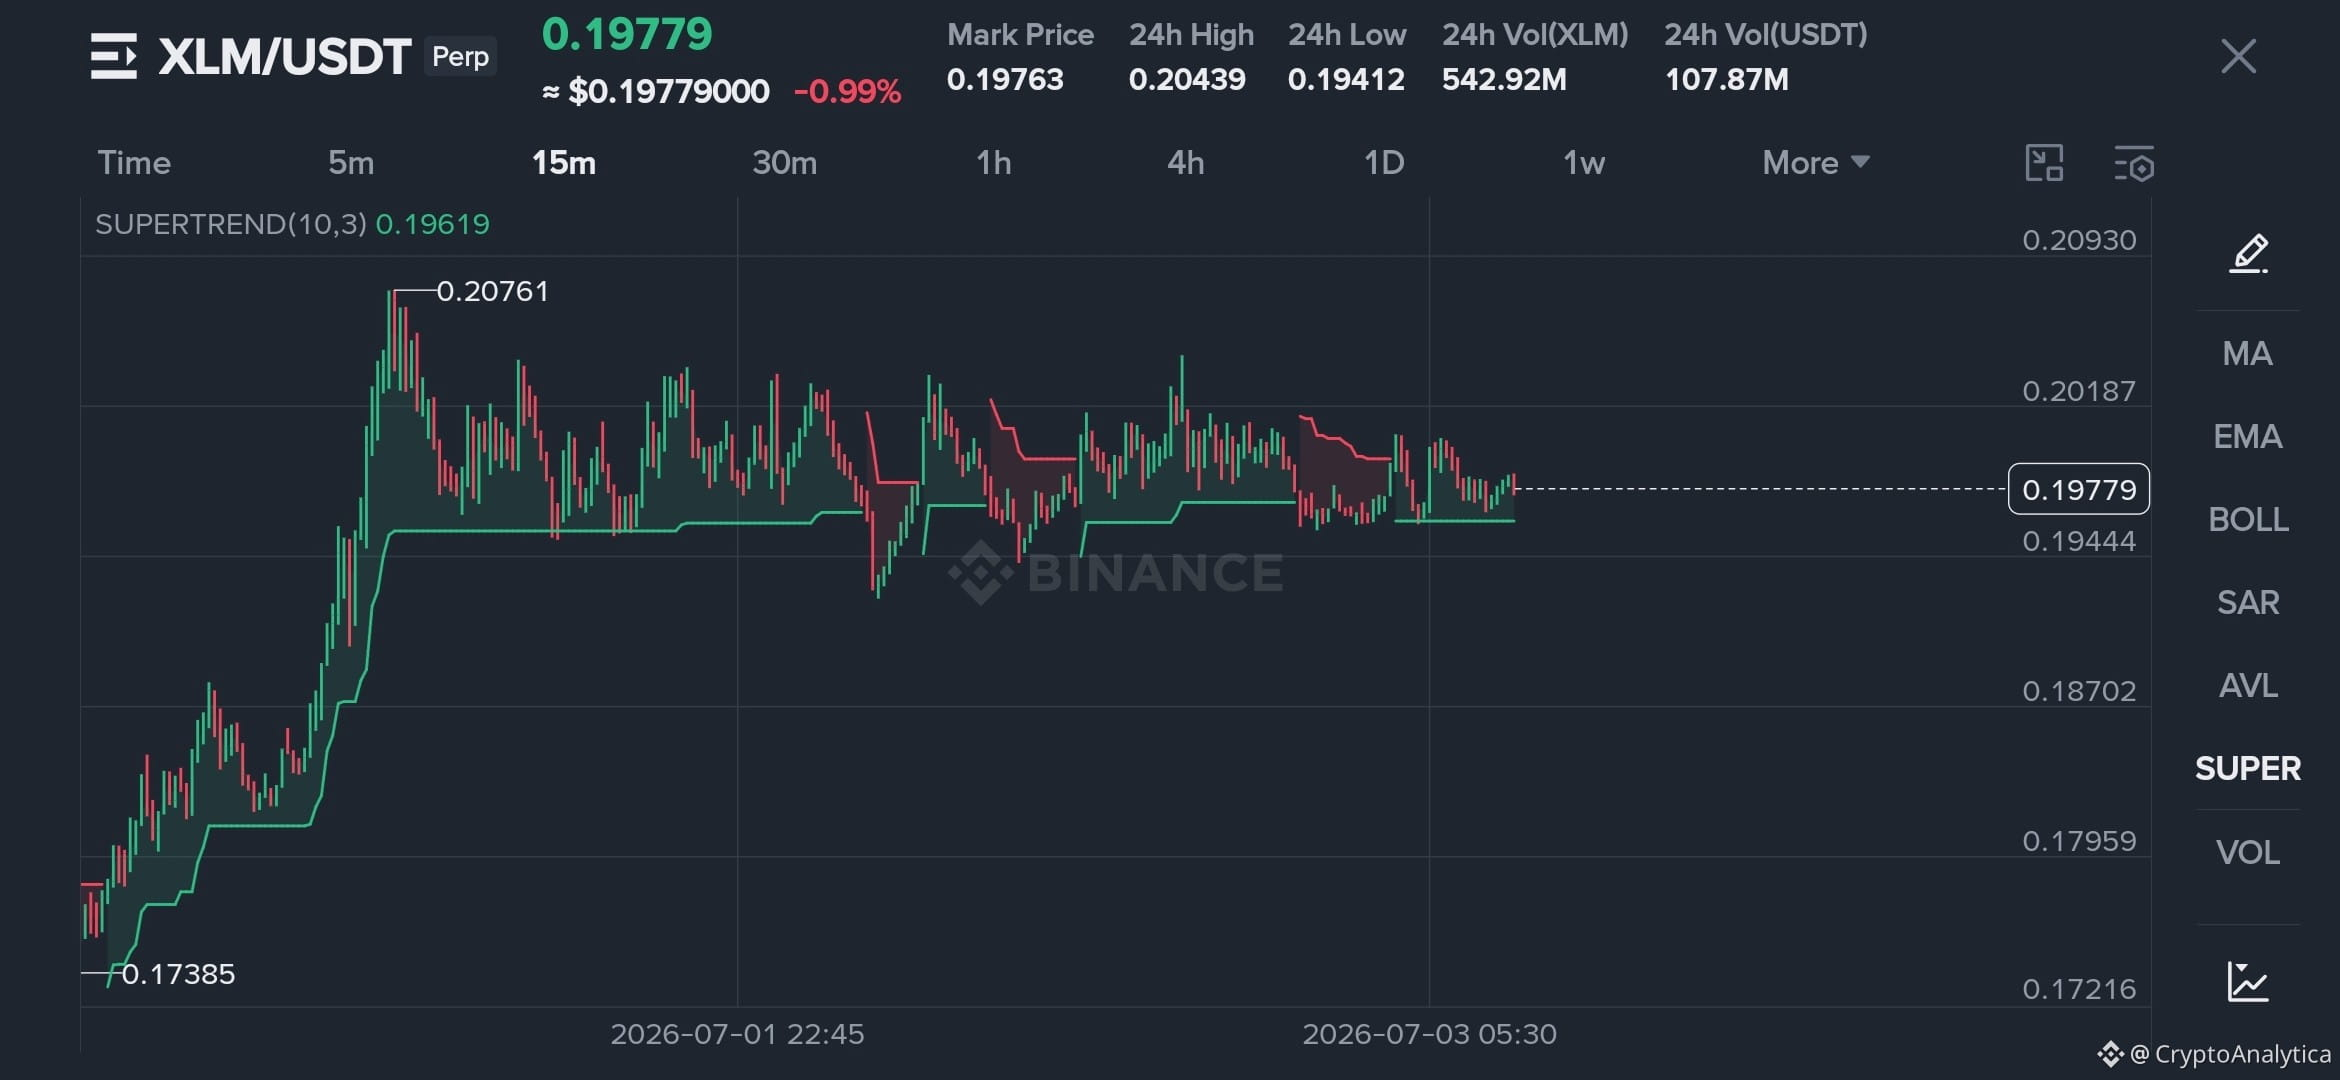
$XLM Technical Analysis 💡 Spot Trading Setup
💰 Current price: 0.2066
Support 0.2002 0.1958
Resistance 0.2077 0.2175
✅BUY Zone: near 0.2005
🎯 Target: 0.2077 0.2175
🛑 Stop Lose 0.1958
📊 Indicator RSI (14). Bullish momentum 📈
⚡MACD positive Momentum.
🚀 Volume Average
💡Tip XLM is Showing bullish recovery with improving momentum watch Resistance breakout for further upsite
$XLM #XML #Binance #SpotTrading
{spot}(XLMUSDT)
#Crypto
$XLM Technical Analysis 💡 Spot Trading Setup
💰 Current price: 0.2066
Support 0.2002 0.1958
Resistance 0.2077 0.2175
✅BUY Zone: near 0.2005
🎯 Target: 0.2077 0.2175
🛑 Stop Lose 0.1958
📊 Indicator RSI (14). Bullish momentum 📈
⚡MACD positive Momentum.
🚀 Volume Average
💡Tip XLM is Showing bullish recovery with improving momentum watch Resistance breakout for further upsite
$XLM #XML #Binance #SpotTrading
#Crypto
💰 Current price: 0.2066
Support 0.2002 0.1958
Resistance 0.2077 0.2175
✅BUY Zone: near 0.2005
🎯 Target: 0.2077 0.2175
🛑 Stop Lose 0.1958
📊 Indicator RSI (14). Bullish momentum 📈
⚡MACD positive Momentum.
🚀 Volume Average
💡Tip XLM is Showing bullish recovery with improving momentum watch Resistance breakout for further upsite
$XLM #XML #Binance #SpotTrading
#Crypto
92



·
--
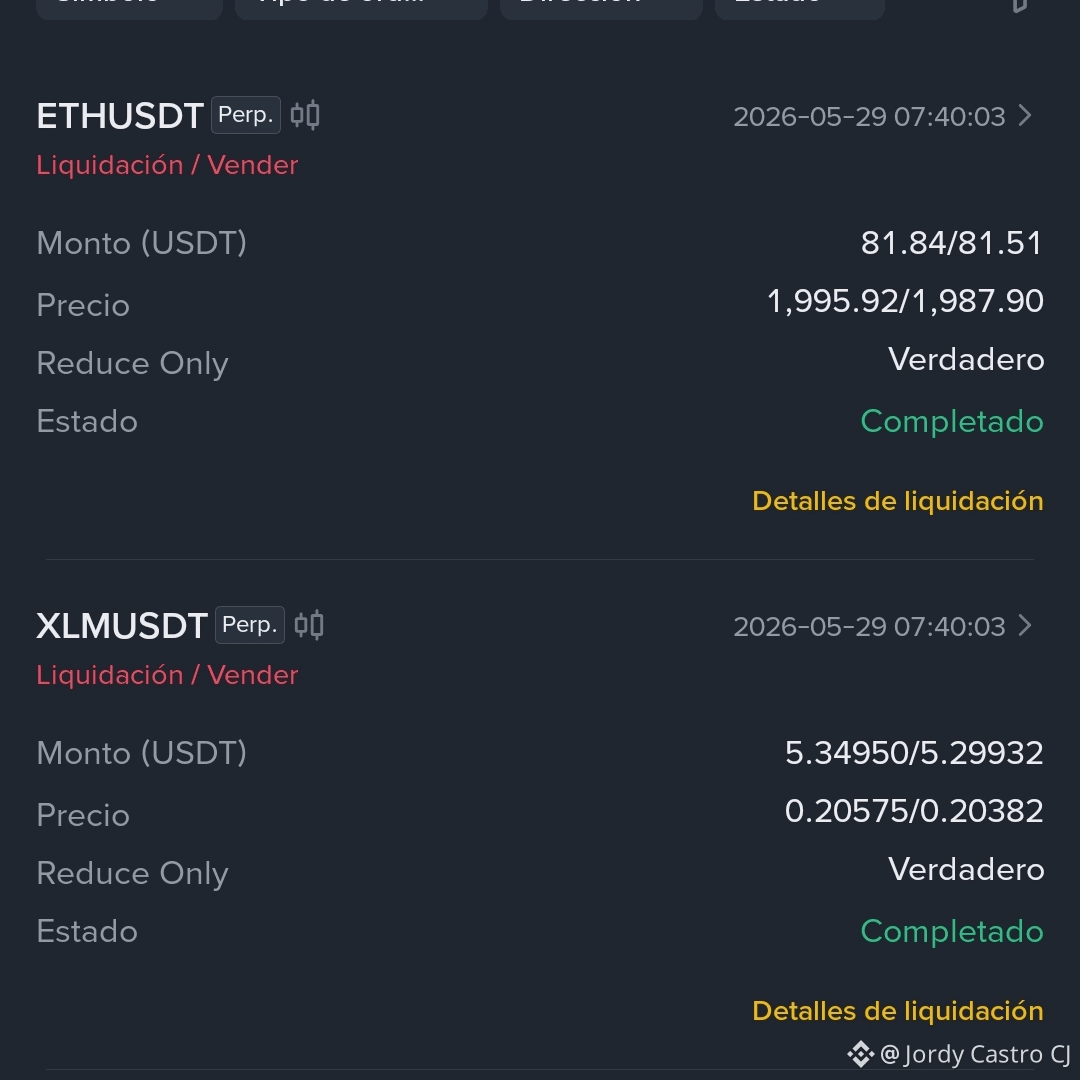
Thank God, I made a solid profit from #XML
Thanks to God and my patience.
I bought on May 10 and May 13 in two batches:
• at 0.1676
• at 0.1607 (I bought the dip well here)
• and I sold it today, May 29, at 0.2086 for a profit of (+181%)
Thank God, I made a solid profit from #XML
Thanks to God and my patience.
I bought on May 10 and May 13 in two batches:
• at 0.1676
• at 0.1607 (I bought the dip well here)
• and I sold it today, May 29, at 0.2086 for a profit of (+181%)
Thanks to God and my patience.
I bought on May 10 and May 13 in two batches:
• at 0.1676
• at 0.1607 (I bought the dip well here)
• and I sold it today, May 29, at 0.2086 for a profit of (+181%)
1
195


·
--
Something's brewing that I've been talking about for ages. BTTC is going to be completely dead, but only someone mentally challenged would be surprised. If you want good advice, buy #xml .
Something's brewing that I've been talking about for ages. BTTC is going to be completely dead, but only someone mentally challenged would be surprised. If you want good advice, buy #xml .


Binance Announcement
·
--
Binance Will Cease Support for Deposits and Withdrawals of Tokens on Selected Networks - 2026-06-24
This is a general announcement. Products and services referred to here may not be available in your region.
Fellow Binancians,
Binance will be ceasing support for deposits and withdrawals of the following tokens via the networks stipulated below from 2026-06-24 08:00 (UTC). After 2026-06-24 08:00 (UTC), any deposits sent via the following networks will not be credited and may lead to asset loss.
BitTorrent (BTTC) via BNB Smart ChainTRON (TRX) via BNB Smart Chain
Please note:
Users will still be able to deposit or withdraw the above tokens via other networks supported by Binance.There may be discrepancies between this original content in English and any translated versions. Please refer to the original English version for the most accurate information, in case any discrepancies arise.
Thank you for your support!
Binance Team
2026-06-17
Fellow Binancians,
Binance will be ceasing support for deposits and withdrawals of the following tokens via the networks stipulated below from 2026-06-24 08:00 (UTC). After 2026-06-24 08:00 (UTC), any deposits sent via the following networks will not be credited and may lead to asset loss.
BitTorrent (BTTC) via BNB Smart ChainTRON (TRX) via BNB Smart Chain
Please note:
Users will still be able to deposit or withdraw the above tokens via other networks supported by Binance.There may be discrepancies between this original content in English and any translated versions. Please refer to the original English version for the most accurate information, in case any discrepancies arise.
Thank you for your support!
Binance Team
2026-06-17
1
2k
Log in to explore more content
Join global crypto users on Binance Square
⚡️ Get latest and useful information about crypto.
💬 Trusted by the world’s largest crypto exchange.
👍 Discover real insights from verified creators.
Email / Phone number
Trending Topics
1
#HYPEJumpsOver11%
1,140 views
75 Discussing
2
#BitcoinSpotETFsNetInflow$159M
363 views
34 Discussing
3
#HKMAPlansWholesaleCBDCByYearEnd
9,036 views
324 Discussing
4
#NEARSurges26%Past$3.45
9,732 views
103 Discussing
5
#BOJHikesRatesTo31YearHigh
27,186 views
676 Discussing
6
#EvernorthRaises$30MToBuyXRP
472 views
21 Discussing
7
#ChainlinkPowersBottomlinePaymentPlatform
27,608 views
631 Discussing
8
#DtcpayCompletes$25MSeriesA
854 views
26 Discussing
9
#InjectiveLaunchesINJOnSolana
6,339 views
154 Discussing
10
#StellarActivatesProtocol28At211TPS
33,528 views
712 Discussing