
#usppisoftens
usppisoftens
10.7M views
4,036 Discussing
December's US PPI rose by 0.2% (vs. 0.3% expected), with a 3.3% YoY increase, hinting at moderating inflation. However, a robust job market might keep the Fed steady on its policy path. Will this influence crypto markets or spark new trends? Share your insights!
Hot
Latest

·
--
US PPI Quick Review
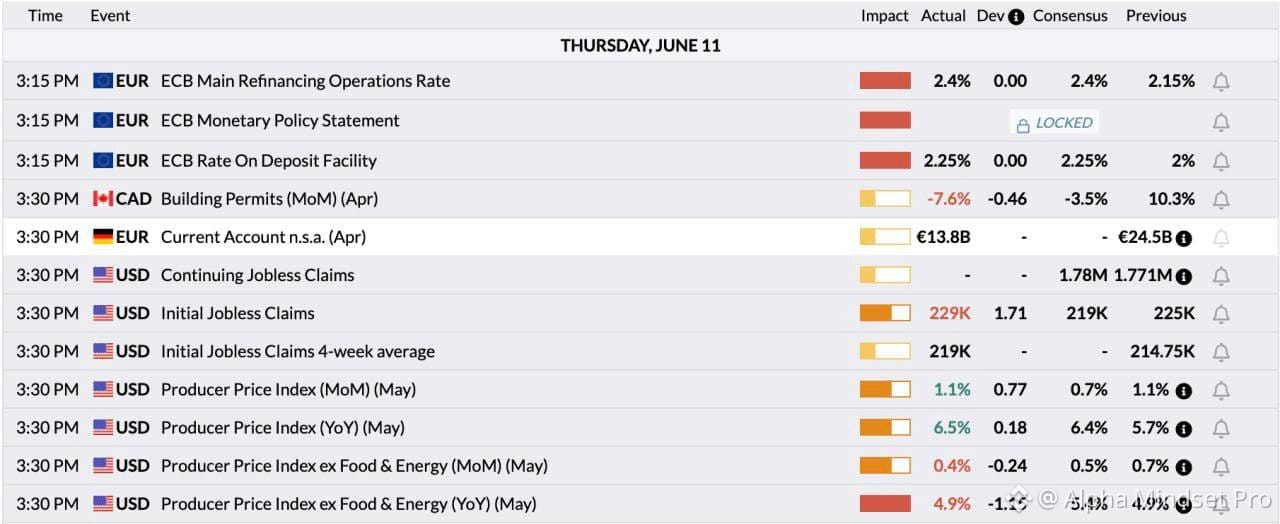
Headline Inflation: Hot (1.1% vs 0.7% expected), driven by energy spikes.
Core Inflation: Cooling (4.9% vs 5.4% expected), keeping it from being a total disaster.
Labor: Weakening (Jobless claims higher at 229K).
The Bottom Line: The Fed is trapped between hot energy costs and a slowing job market. Expect choppy volatility for crypto. 📊
#USPPITrends #USPPISoftens
US PPI Quick Review
Headline Inflation: Hot (1.1% vs 0.7% expected), driven by energy spikes.
Core Inflation: Cooling (4.9% vs 5.4% expected), keeping it from being a total disaster.
Labor: Weakening (Jobless claims higher at 229K).
The Bottom Line: The Fed is trapped between hot energy costs and a slowing job market. Expect choppy volatility for crypto. 📊
#USPPITrends #USPPISoftens
Headline Inflation: Hot (1.1% vs 0.7% expected), driven by energy spikes.
Core Inflation: Cooling (4.9% vs 5.4% expected), keeping it from being a total disaster.
Labor: Weakening (Jobless claims higher at 229K).
The Bottom Line: The Fed is trapped between hot energy costs and a slowing job market. Expect choppy volatility for crypto. 📊
#USPPITrends #USPPISoftens
125

Article
BITCOIN CRASH SOON 🔥🔥🔥 SHORT TRADE SETUP 👇---$BTC
{spot}(BTCUSDT)
🔻 BTC/USDT 4-Hour Chart – Short Trade Setup Alert 🚨
Hello traders! The Bitcoin market is presenting us with an intriguing short setup on the 4-hour timeframe. Let’s dissect the current scenario and explore how we can capitalize on this potential opportunity.
---
Market Snapshot:
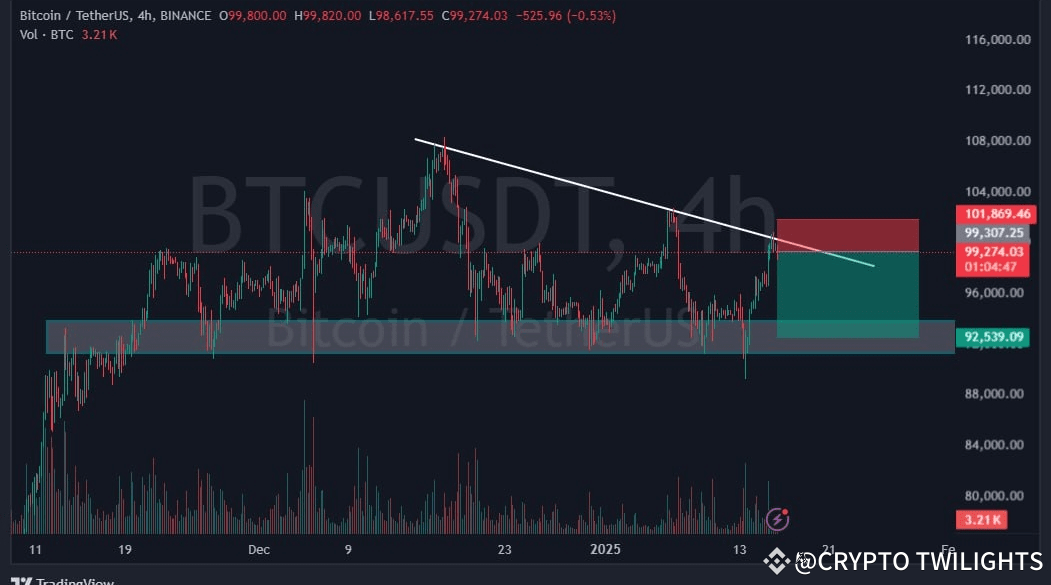
Current Price: $99,274.03
24h Change: -0.53%
Volume: 3.21K BTC
Bitcoin is approaching a critical juncture, testing the descending trendline resistance. The bears seem to be gaining momentum, suggesting a potential shorting opportunity.
---
Key Technical Levels:
Resistance Zone: $101,869 - $104,000
Support Zone: $92,539 - $96,000
Trade Setup Details:
Entry Zone: Around $99,300 (current price level)
Stop Loss: Above $101,869 (to protect against false breakouts)
Take Profit: Targeting $92,539 (previous support zone)
---
Analysis and Insights:
1. Descending Trendline: Bitcoin is facing strong resistance at the descending trendline. Multiple rejections at this level indicate that sellers are firmly in control.
2. Bearish Momentum: Recent price action has struggled to sustain higher levels, with lower highs forming consistently—a classic signal of weakening bullish strength.
3. Volume Observation: A noticeable decrease in buying volume further supports the bearish narrative, as bulls seem to be losing steam.
---
Risk Management:
This is a short-term trade setup. Be sure to manage your risk effectively by placing stop losses appropriately. The key to success in trading is not just identifying opportunities but also protecting your capital.
Risk/Reward Ratio: This trade offers an attractive risk/reward ratio, aiming for a sizable gain relative to the potential loss.
---
Conclusion:
With Bitcoin approaching significant resistance, this short trade setup offers an excellent opportunity for traders looking to capitalize on the potential downside. Keep an eye on price action around the key levels mentioned above and act accordingly.
As always, stay vigilant and trade with caution. Let’s see how this setup unfolds in the coming sessions!
---
💬 What’s your take on this setup? Are you leaning towards a short position, or do you see a bullish breakout on the horizon? Share your thoughts in the comments!
Happy trading! 📉🔍
---#BinanceAlphaAlert
#XRPHits3
#BTCBackto100K
#CPIPlunge2025
#USPPISoftens
BITCOIN CRASH SOON 🔥🔥🔥 SHORT TRADE SETUP 👇
---$BTC
🔻 BTC/USDT 4-Hour Chart – Short Trade Setup Alert 🚨
Hello traders! The Bitcoin market is presenting us with an intriguing short setup on the 4-hour timeframe. Let’s dissect the current scenario and explore how we can capitalize on this potential opportunity.
---
Market Snapshot:
Current Price: $99,274.03
24h Change: -0.53%
Volume: 3.21K BTC
Bitcoin is approaching a critical juncture, testing the descending trendline resistance. The bears seem to be gaining momentum, suggesting a potential shorting opportunity.
---
Key Technical Levels:
Resistance Zone: $101,869 - $104,000
Support Zone: $92,539 - $96,000
Trade Setup Details:
Entry Zone: Around $99,300 (current price level)
Stop Loss: Above $101,869 (to protect against false breakouts)
Take Profit: Targeting $92,539 (previous support zone)
---
Analysis and Insights:
1. Descending Trendline: Bitcoin is facing strong resistance at the descending trendline. Multiple rejections at this level indicate that sellers are firmly in control.
2. Bearish Momentum: Recent price action has struggled to sustain higher levels, with lower highs forming consistently—a classic signal of weakening bullish strength.
3. Volume Observation: A noticeable decrease in buying volume further supports the bearish narrative, as bulls seem to be losing steam.
---
Risk Management:
This is a short-term trade setup. Be sure to manage your risk effectively by placing stop losses appropriately. The key to success in trading is not just identifying opportunities but also protecting your capital.
Risk/Reward Ratio: This trade offers an attractive risk/reward ratio, aiming for a sizable gain relative to the potential loss.
---
Conclusion:
With Bitcoin approaching significant resistance, this short trade setup offers an excellent opportunity for traders looking to capitalize on the potential downside. Keep an eye on price action around the key levels mentioned above and act accordingly.
As always, stay vigilant and trade with caution. Let’s see how this setup unfolds in the coming sessions!
---
💬 What’s your take on this setup? Are you leaning towards a short position, or do you see a bullish breakout on the horizon? Share your thoughts in the comments!
Happy trading! 📉🔍
---#BinanceAlphaAlert
#XRPHits3
#BTCBackto100K
#CPIPlunge2025
#USPPISoftens
🔻 BTC/USDT 4-Hour Chart – Short Trade Setup Alert 🚨
Hello traders! The Bitcoin market is presenting us with an intriguing short setup on the 4-hour timeframe. Let’s dissect the current scenario and explore how we can capitalize on this potential opportunity.
---
Market Snapshot:
Current Price: $99,274.03
24h Change: -0.53%
Volume: 3.21K BTC
Bitcoin is approaching a critical juncture, testing the descending trendline resistance. The bears seem to be gaining momentum, suggesting a potential shorting opportunity.
---
Key Technical Levels:
Resistance Zone: $101,869 - $104,000
Support Zone: $92,539 - $96,000
Trade Setup Details:
Entry Zone: Around $99,300 (current price level)
Stop Loss: Above $101,869 (to protect against false breakouts)
Take Profit: Targeting $92,539 (previous support zone)
---
Analysis and Insights:
1. Descending Trendline: Bitcoin is facing strong resistance at the descending trendline. Multiple rejections at this level indicate that sellers are firmly in control.
2. Bearish Momentum: Recent price action has struggled to sustain higher levels, with lower highs forming consistently—a classic signal of weakening bullish strength.
3. Volume Observation: A noticeable decrease in buying volume further supports the bearish narrative, as bulls seem to be losing steam.
---
Risk Management:
This is a short-term trade setup. Be sure to manage your risk effectively by placing stop losses appropriately. The key to success in trading is not just identifying opportunities but also protecting your capital.
Risk/Reward Ratio: This trade offers an attractive risk/reward ratio, aiming for a sizable gain relative to the potential loss.
---
Conclusion:
With Bitcoin approaching significant resistance, this short trade setup offers an excellent opportunity for traders looking to capitalize on the potential downside. Keep an eye on price action around the key levels mentioned above and act accordingly.
As always, stay vigilant and trade with caution. Let’s see how this setup unfolds in the coming sessions!
---
💬 What’s your take on this setup? Are you leaning towards a short position, or do you see a bullish breakout on the horizon? Share your thoughts in the comments!
Happy trading! 📉🔍
---#BinanceAlphaAlert
#XRPHits3
#BTCBackto100K
#CPIPlunge2025
#USPPISoftens
15
13
76
80.6k

·
--
Bullish
S/USDT Technical Analysis
Current Situation
✅ [Claim Your Free binance Give Away here 🎁🎁🎁](https://app.binance.com/uni-qr/cpos/16680182976866?r=575169698&l=en&uco=zDchP4ZpXIlY8BGuZiZhrA&uc=app_square_share_link&us=copylink)
$S/USDT is currently trading at $0.7922, up 13.27%.
Notable Price Action
Sharp spike from $0.6994 to $0.8480, followed by consolidation around $0.79.
Technical Indicators
- _RSI(6):_ 39.93 (neutral-bearish momentum)
- _MA(7):_ $0.7915 (price hovering near short-term moving average)
- _Volume:_ 34.24M (significant trading activity)
Short-term Outlook
The pair experienced a major volatility event with a >20% range. After the sharp moves, price is showing signs of stabilization. The lower RSI suggests potential for continuation upward if support holds.
Discussion
What's your take on this setup? Do you see this as a potential entry point or would you wait for more confirmation?
Disclaimer
This is not financial advice. Always do your own research and manage your risk carefully!
#BinanceAlphaAlert #XRPHits3 #CPIPlunge2025 #USPPISoftens #USPPISoftens
S/USDT Technical Analysis
Current Situation
✅ Claim Your Free binance Give Away here 🎁🎁🎁
$S/USDT is currently trading at $0.7922, up 13.27%.
Notable Price Action
Sharp spike from $0.6994 to $0.8480, followed by consolidation around $0.79.
Technical Indicators
- _RSI(6):_ 39.93 (neutral-bearish momentum)
- _MA(7):_ $0.7915 (price hovering near short-term moving average)
- _Volume:_ 34.24M (significant trading activity)
Short-term Outlook
The pair experienced a major volatility event with a >20% range. After the sharp moves, price is showing signs of stabilization. The lower RSI suggests potential for continuation upward if support holds.
Discussion
What's your take on this setup? Do you see this as a potential entry point or would you wait for more confirmation?
Disclaimer
This is not financial advice. Always do your own research and manage your risk carefully!
#BinanceAlphaAlert #XRPHits3 #CPIPlunge2025 #USPPISoftens #USPPISoftens
Current Situation
✅ Claim Your Free binance Give Away here 🎁🎁🎁
$S/USDT is currently trading at $0.7922, up 13.27%.
Notable Price Action
Sharp spike from $0.6994 to $0.8480, followed by consolidation around $0.79.
Technical Indicators
- _RSI(6):_ 39.93 (neutral-bearish momentum)
- _MA(7):_ $0.7915 (price hovering near short-term moving average)
- _Volume:_ 34.24M (significant trading activity)
Short-term Outlook
The pair experienced a major volatility event with a >20% range. After the sharp moves, price is showing signs of stabilization. The lower RSI suggests potential for continuation upward if support holds.
Discussion
What's your take on this setup? Do you see this as a potential entry point or would you wait for more confirmation?
Disclaimer
This is not financial advice. Always do your own research and manage your risk carefully!
#BinanceAlphaAlert #XRPHits3 #CPIPlunge2025 #USPPISoftens #USPPISoftens
45
39
343
109k
Unexpected Core CPI Drop Sends Bitcoin Higher
Bitcoin has fallen 10% to 15% below its record highs as investors largely tempered expectations for further rate cuts.
Headline inflation rose faster than expected last month, but the core rate fell on a year-over-year basis, cheering investors.
Policymakers had previously been frustrated by the hold on the core rate.
Bitcoin jumped to $98,500 after the data.
While headline inflation came in faster than expected in December, investors are now buying after an unexpected drop in core inflation on a year-over-year basis.
The closely watched consumer price index rose 0.4% in December, slightly above analysts’ consensus and 0.3% the month before. On a year-over-year basis, CPI rose 2.9%, compared to analysts’ expectations of 2.9% and the previous month’s reading of 2.7%.
#CPIPlunge2025 #USPPISoftens #BinanceAlphaAlert #USPPITrends #ReboundOutlook
$BTC $ETH $XRP
Unexpected Core CPI Drop Sends Bitcoin Higher
Bitcoin has fallen 10% to 15% below its record highs as investors largely tempered expectations for further rate cuts.
Headline inflation rose faster than expected last month, but the core rate fell on a year-over-year basis, cheering investors.
Policymakers had previously been frustrated by the hold on the core rate.
Bitcoin jumped to $98,500 after the data.
While headline inflation came in faster than expected in December, investors are now buying after an unexpected drop in core inflation on a year-over-year basis.
The closely watched consumer price index rose 0.4% in December, slightly above analysts’ consensus and 0.3% the month before. On a year-over-year basis, CPI rose 2.9%, compared to analysts’ expectations of 2.9% and the previous month’s reading of 2.7%.
#CPIPlunge2025 #USPPISoftens #BinanceAlphaAlert #USPPITrends #ReboundOutlook
$BTC $ETH $XRP
Bitcoin has fallen 10% to 15% below its record highs as investors largely tempered expectations for further rate cuts.
Headline inflation rose faster than expected last month, but the core rate fell on a year-over-year basis, cheering investors.
Policymakers had previously been frustrated by the hold on the core rate.
Bitcoin jumped to $98,500 after the data.
While headline inflation came in faster than expected in December, investors are now buying after an unexpected drop in core inflation on a year-over-year basis.
The closely watched consumer price index rose 0.4% in December, slightly above analysts’ consensus and 0.3% the month before. On a year-over-year basis, CPI rose 2.9%, compared to analysts’ expectations of 2.9% and the previous month’s reading of 2.7%.
#CPIPlunge2025 #USPPISoftens #BinanceAlphaAlert #USPPITrends #ReboundOutlook
$BTC $ETH $XRP

2.7k
1.5k
371
2.7k

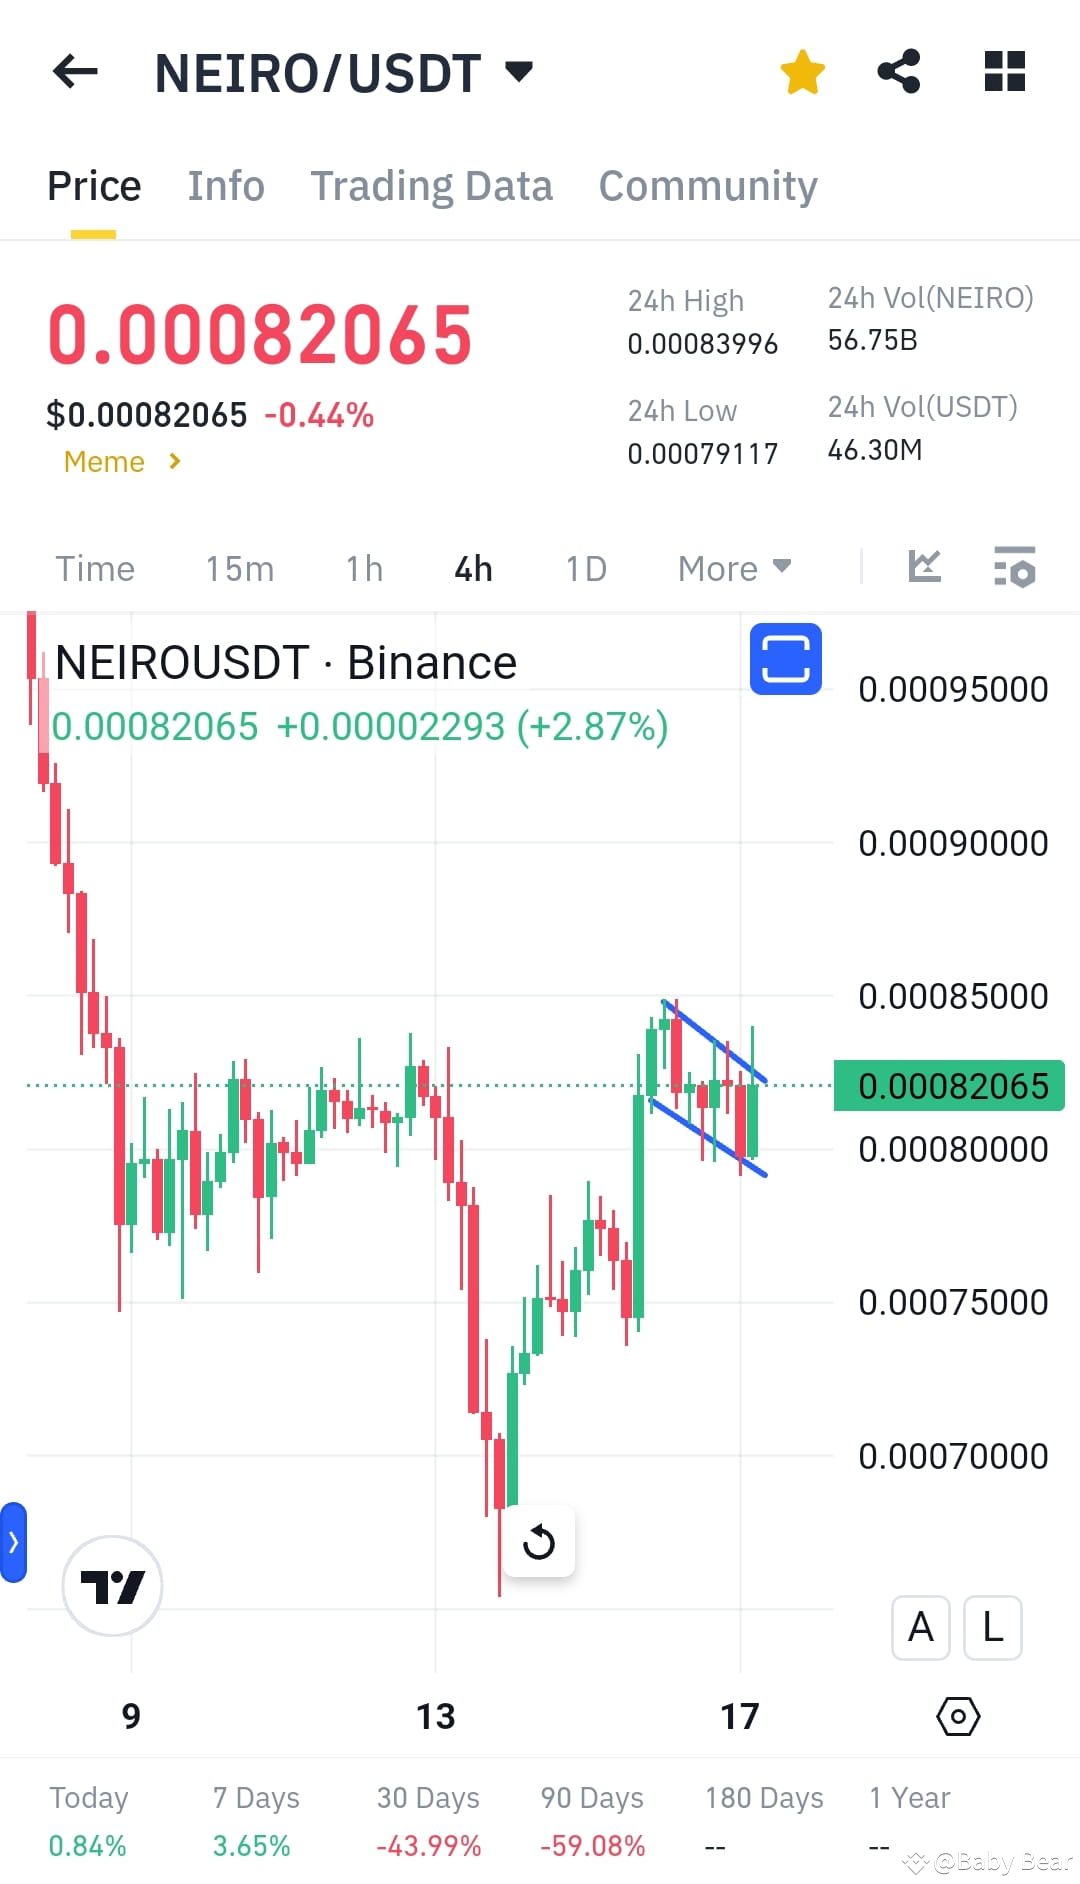
$NEIRO from previous day if you open a charts what did you see . what did see that every coin is on flag pattern . what is a flag pattern ? like in the pic flag pattern appears during bull market or during bearish market . consider them as a mid point . at this point coin go to consolidation phase by making two trend lines support and resistance . it appears for very short period of time it easily broke if it broke support line it goes down if it broke resistance it grow up..
things to keep in mind it mostly broke the line which is on side of trend. mean if it appears in bull market it will break resistance and go up. if it appears in bear market will break support . mostly it follows the trend. but the opposite can happ.#MicroStrategyAcquiresBTC #AIAgentFrenzy #ReboundOutlook #USPPISoftens #CPIPlunge2025
$NEIRO from previous day if you open a charts what did you see . what did see that every coin is on flag pattern . what is a flag pattern ? like in the pic flag pattern appears during bull market or during bearish market . consider them as a mid point . at this point coin go to consolidation phase by making two trend lines support and resistance . it appears for very short period of time it easily broke if it broke support line it goes down if it broke resistance it grow up..
things to keep in mind it mostly broke the line which is on side of trend. mean if it appears in bull market it will break resistance and go up. if it appears in bear market will break support . mostly it follows the trend. but the opposite can happ.#MicroStrategyAcquiresBTC #AIAgentFrenzy #ReboundOutlook #USPPISoftens #CPIPlunge2025
things to keep in mind it mostly broke the line which is on side of trend. mean if it appears in bull market it will break resistance and go up. if it appears in bear market will break support . mostly it follows the trend. but the opposite can happ.#MicroStrategyAcquiresBTC #AIAgentFrenzy #ReboundOutlook #USPPISoftens #CPIPlunge2025
17
6
17
39.3k

·
--
Bullish
$LTC /USDT Bull Run Alert!🔥💯
Bullish Zone Start ⚠️ Enter Now 🚀
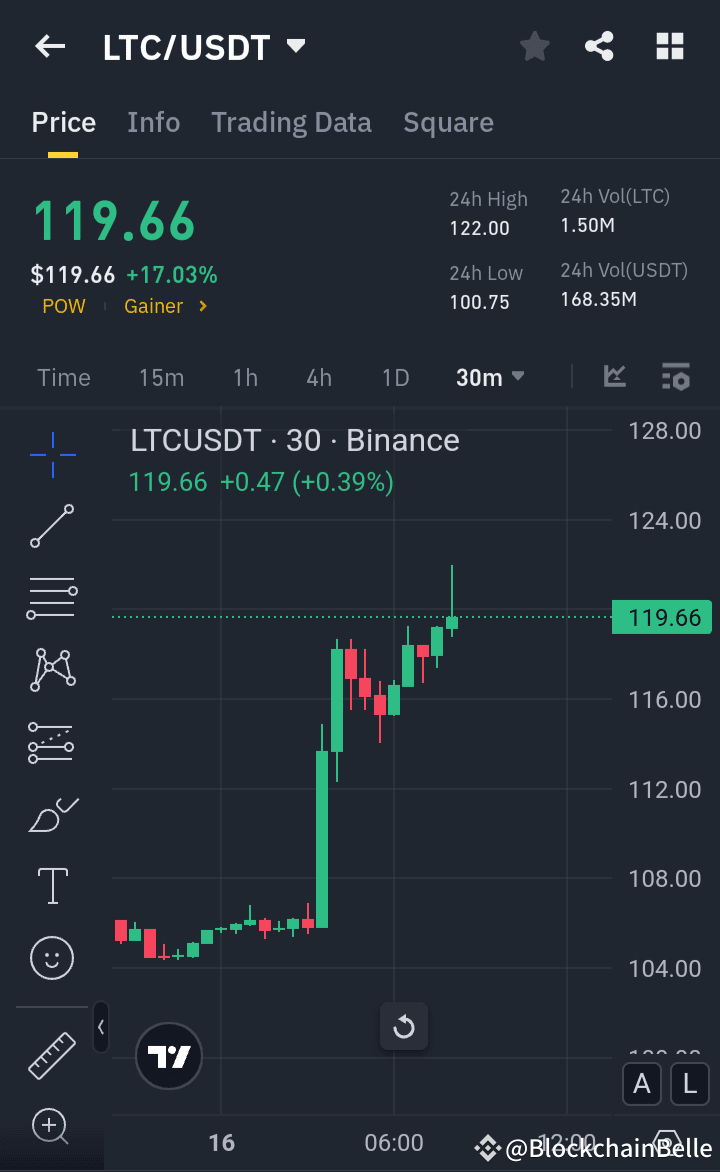
Current Price: $119.66
Trade Plan:
🔹 Entry Point: $118.50 - $120.00
🔹 Targets:
TP1: $125.00
TP2: $135.00
TP3: $150.00
🔹 Stop Loss: $115.00
🔹 Support Level: $118.00
🔹 Resistance Level: $122.00
Trade Setup Breakdown:
$LTC/USDT is gaining strong upward momentum, with buyers pushing the price near key resistance levels. A breakout above $122.00 could trigger a rapid move toward the first target of $125.00. The support at $118.00 provides a favorable risk-to-reward ratio.
💥 Ride the Litecoin wave! Like, comment, and follow for more updates! 💥
$LTC
{spot}(LTCUSDT)
#BTCBackto100K #CPIPlunge2025 #USPPISoftens #BinanceAlphaAlert #Write2Earn!
$LTC /USDT Bull Run Alert!🔥💯
Bullish Zone Start ⚠️ Enter Now 🚀
Current Price: $119.66
Trade Plan:
🔹 Entry Point: $118.50 - $120.00
🔹 Targets:
TP1: $125.00
TP2: $135.00
TP3: $150.00
🔹 Stop Loss: $115.00
🔹 Support Level: $118.00
🔹 Resistance Level: $122.00
Trade Setup Breakdown:
$LTC /USDT is gaining strong upward momentum, with buyers pushing the price near key resistance levels. A breakout above $122.00 could trigger a rapid move toward the first target of $125.00. The support at $118.00 provides a favorable risk-to-reward ratio.
💥 Ride the Litecoin wave! Like, comment, and follow for more updates! 💥
$LTC
#BTCBackto100K #CPIPlunge2025 #USPPISoftens #BinanceAlphaAlert #Write2Earn!
Bullish Zone Start ⚠️ Enter Now 🚀
Current Price: $119.66
Trade Plan:
🔹 Entry Point: $118.50 - $120.00
🔹 Targets:
TP1: $125.00
TP2: $135.00
TP3: $150.00
🔹 Stop Loss: $115.00
🔹 Support Level: $118.00
🔹 Resistance Level: $122.00
Trade Setup Breakdown:
$LTC /USDT is gaining strong upward momentum, with buyers pushing the price near key resistance levels. A breakout above $122.00 could trigger a rapid move toward the first target of $125.00. The support at $118.00 provides a favorable risk-to-reward ratio.
💥 Ride the Litecoin wave! Like, comment, and follow for more updates! 💥
$LTC
#BTCBackto100K #CPIPlunge2025 #USPPISoftens #BinanceAlphaAlert #Write2Earn!
2
1
2
403

·
--
Article
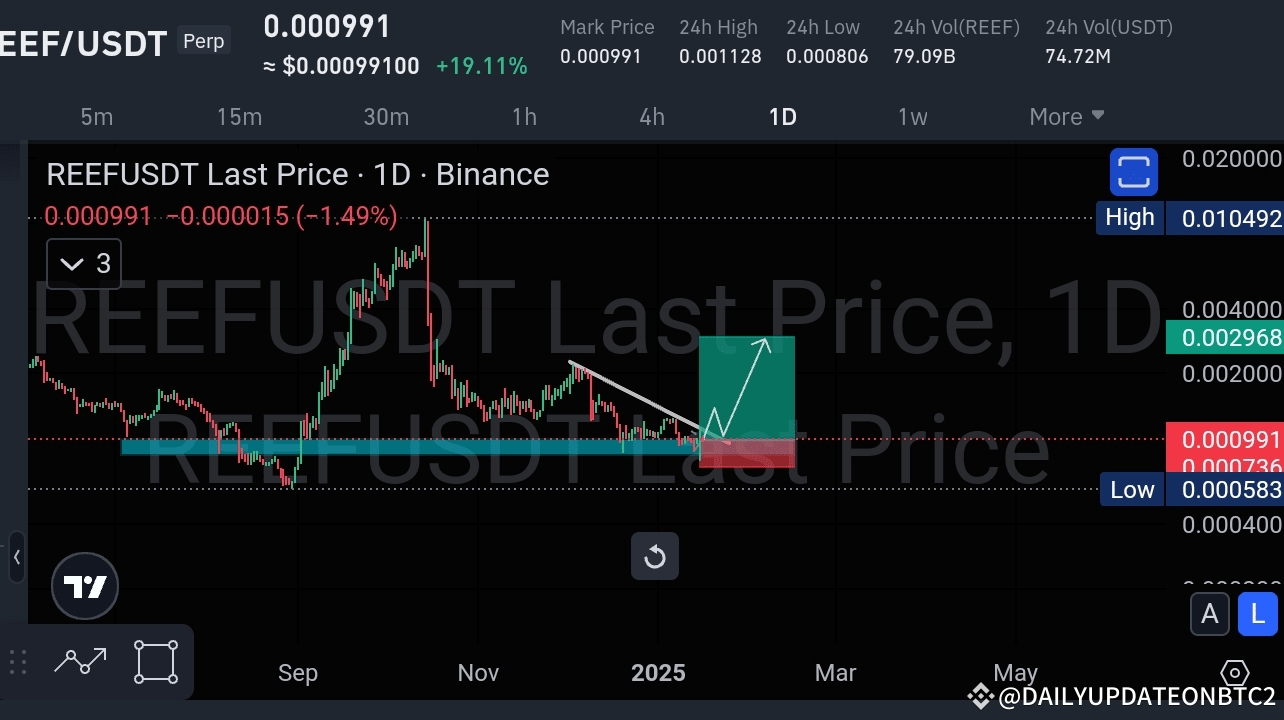
REEF COIN ANALYSIS 🔥🔥👇 LONG TRADE SETUP 👇#BTCBackto100K
---$REEF
🚀 REEF/USDT Daily Chart Analysis – A Potential Bullish Breakout in the Making?
Greetings, traders! Let's dive into the latest technical setup on REEF/USDT, where some interesting movements are brewing on the daily chart.
---
Current Market Overview:
Current Price: $0.000991
24h Change: -1.49%
Volume: 74.72M USDT
After a prolonged downtrend, REEF appears to be finding its footing near the $0.000991 level. This zone is emerging as a critical support area, potentially setting the stage for a significant move.
---
Key Technical Levels:
Immediate Resistance: $0.001492
Primary Resistance Target: $0.002968
Key Support: $0.000583
Chart Pattern Insight:
We’re witnessing the formation of a potential bullish reversal pattern. The price action is consolidating, creating a wedge that often signals an impending breakout.
The descending trendline is a key area to watch. A decisive break above this line could trigger a bullish rally towards the $0.002968 resistance zone.
---
Bullish Scenario:
If REEF manages to break out of the wedge and surpass the $0.001492 mark, we could see a swift move towards $0.002968. This would represent a substantial upside from the current levels, offering an exciting opportunity for bulls.
Bearish Scenario:
On the flip side, failure to hold the $0.000583 support could lead to further downside pressure. Traders should be cautious of a potential retest of lower levels if the market sentiment turns bearish.
---
Conclusion:
This is a pivotal moment for REEF. With clear support and resistance levels, traders should keep a close eye on the price action in the coming days. Breakouts from such patterns can often lead to swift and decisive moves.
Remember, risk management is key. As always, use stop-losses and position sizing to manage your exposure.
---
What are your thoughts on REEF's current setup? Are we on the verge of a breakout, or is there more consolidation ahead? Share your views in the comments below!
Stay sharp and trade wisely! 🔍📊
---
#CPIPlunge2025
#USPPISoftens
#BinanceAlphaAlert
#USPPITrends
REEF COIN ANALYSIS 🔥🔥👇 LONG TRADE SETUP 👇
#BTCBackto100K
---$REEF
🚀 REEF/USDT Daily Chart Analysis – A Potential Bullish Breakout in the Making?
Greetings, traders! Let's dive into the latest technical setup on REEF/USDT, where some interesting movements are brewing on the daily chart.
---
Current Market Overview:
Current Price: $0.000991
24h Change: -1.49%
Volume: 74.72M USDT
After a prolonged downtrend, REEF appears to be finding its footing near the $0.000991 level. This zone is emerging as a critical support area, potentially setting the stage for a significant move.
---
Key Technical Levels:
Immediate Resistance: $0.001492
Primary Resistance Target: $0.002968
Key Support: $0.000583
Chart Pattern Insight:
We’re witnessing the formation of a potential bullish reversal pattern. The price action is consolidating, creating a wedge that often signals an impending breakout.
The descending trendline is a key area to watch. A decisive break above this line could trigger a bullish rally towards the $0.002968 resistance zone.
---
Bullish Scenario:
If REEF manages to break out of the wedge and surpass the $0.001492 mark, we could see a swift move towards $0.002968. This would represent a substantial upside from the current levels, offering an exciting opportunity for bulls.
Bearish Scenario:
On the flip side, failure to hold the $0.000583 support could lead to further downside pressure. Traders should be cautious of a potential retest of lower levels if the market sentiment turns bearish.
---
Conclusion:
This is a pivotal moment for REEF. With clear support and resistance levels, traders should keep a close eye on the price action in the coming days. Breakouts from such patterns can often lead to swift and decisive moves.
Remember, risk management is key. As always, use stop-losses and position sizing to manage your exposure.
---
What are your thoughts on REEF's current setup? Are we on the verge of a breakout, or is there more consolidation ahead? Share your views in the comments below!
Stay sharp and trade wisely! 🔍📊
---
#CPIPlunge2025
#USPPISoftens
#BinanceAlphaAlert
#USPPITrends
---$REEF
🚀 REEF/USDT Daily Chart Analysis – A Potential Bullish Breakout in the Making?
Greetings, traders! Let's dive into the latest technical setup on REEF/USDT, where some interesting movements are brewing on the daily chart.
---
Current Market Overview:
Current Price: $0.000991
24h Change: -1.49%
Volume: 74.72M USDT
After a prolonged downtrend, REEF appears to be finding its footing near the $0.000991 level. This zone is emerging as a critical support area, potentially setting the stage for a significant move.
---
Key Technical Levels:
Immediate Resistance: $0.001492
Primary Resistance Target: $0.002968
Key Support: $0.000583
Chart Pattern Insight:
We’re witnessing the formation of a potential bullish reversal pattern. The price action is consolidating, creating a wedge that often signals an impending breakout.
The descending trendline is a key area to watch. A decisive break above this line could trigger a bullish rally towards the $0.002968 resistance zone.
---
Bullish Scenario:
If REEF manages to break out of the wedge and surpass the $0.001492 mark, we could see a swift move towards $0.002968. This would represent a substantial upside from the current levels, offering an exciting opportunity for bulls.
Bearish Scenario:
On the flip side, failure to hold the $0.000583 support could lead to further downside pressure. Traders should be cautious of a potential retest of lower levels if the market sentiment turns bearish.
---
Conclusion:
This is a pivotal moment for REEF. With clear support and resistance levels, traders should keep a close eye on the price action in the coming days. Breakouts from such patterns can often lead to swift and decisive moves.
Remember, risk management is key. As always, use stop-losses and position sizing to manage your exposure.
---
What are your thoughts on REEF's current setup? Are we on the verge of a breakout, or is there more consolidation ahead? Share your views in the comments below!
Stay sharp and trade wisely! 🔍📊
---
#CPIPlunge2025
#USPPISoftens
#BinanceAlphaAlert
#USPPITrends
1
1.1k


Article
🚀 Is PEPE the Next Meme King? Price Predictions & Insights! 🚀The meme coin evolution continues, and PEPE Coin has captured the spotlight! Could this be the next big thing in the crypto world? Let’s dive into its potential and price trajectory.
📊 Current Market Performance
As of today, PEPE is trading at $0.000000001792, reflecting a slight dip of -0.04984%. The price movement shows resilience with an intraday high of $0.000000001912 and a low of $0.00000000174.
🔮 Price Predictions: What’s in Store for PEPE?
1️⃣ 2024: Experts forecast a price range between $0.0000175 and $0.0000290 by year-end. A major breakout could be on the horizon!
2️⃣ 2025: The outlook becomes even brighter with potential prices climbing to $0.000158.
3️⃣ 2030: Long-term predictions suggest PEPE might hit $0.177 to $0.507, a potential moonshot for early investors!
🌟 Why PEPE Could Be the Next Big Thing
💡 Community Power: The PEPE fanbase is growing rapidly, a key factor in the success of meme coins. Strong community engagement can drive massive growth.
💡 Big Investor Interest: Whale activity signals confidence in PEPE’s potential, with significant purchases bolstering its momentum.
💡 Market Resilience: Amid market turbulence, PEPE has shown stability, earning its place among serious contenders in the meme coin category.
⚠️ A Word of Caution
While PEPE shows immense promise, it’s important to remember that meme coins are highly volatile. Always DYOR (Do Your Own Research) and invest wisely.
🔥 Don’t Miss Out – PEPE Could Be the Future! 🔥
Join the meme coin revolution and stay ahead of the curve. Track PEPE on Binance and explore its exciting potential today!
👉 Trade PEPE now on Binance! #TrumpCountDown #SOLVLaunchOnBinance #XRPHits3 #USPPISoftens #EOSBreaks1$
🚀 Is PEPE the Next Meme King? Price Predictions & Insights! 🚀
The meme coin evolution continues, and PEPE Coin has captured the spotlight! Could this be the next big thing in the crypto world? Let’s dive into its potential and price trajectory.
📊 Current Market Performance
As of today, PEPE is trading at $0.000000001792, reflecting a slight dip of -0.04984%. The price movement shows resilience with an intraday high of $0.000000001912 and a low of $0.00000000174.
🔮 Price Predictions: What’s in Store for PEPE?
1️⃣ 2024: Experts forecast a price range between $0.0000175 and $0.0000290 by year-end. A major breakout could be on the horizon!
2️⃣ 2025: The outlook becomes even brighter with potential prices climbing to $0.000158.
3️⃣ 2030: Long-term predictions suggest PEPE might hit $0.177 to $0.507, a potential moonshot for early investors!
🌟 Why PEPE Could Be the Next Big Thing
💡 Community Power: The PEPE fanbase is growing rapidly, a key factor in the success of meme coins. Strong community engagement can drive massive growth.
💡 Big Investor Interest: Whale activity signals confidence in PEPE’s potential, with significant purchases bolstering its momentum.
💡 Market Resilience: Amid market turbulence, PEPE has shown stability, earning its place among serious contenders in the meme coin category.
⚠️ A Word of Caution
While PEPE shows immense promise, it’s important to remember that meme coins are highly volatile. Always DYOR (Do Your Own Research) and invest wisely.
🔥 Don’t Miss Out – PEPE Could Be the Future! 🔥
Join the meme coin revolution and stay ahead of the curve. Track PEPE on Binance and explore its exciting potential today!
👉 Trade PEPE now on Binance! #TrumpCountDown #SOLVLaunchOnBinance #XRPHits3 #USPPISoftens #EOSBreaks1$
📊 Current Market Performance
As of today, PEPE is trading at $0.000000001792, reflecting a slight dip of -0.04984%. The price movement shows resilience with an intraday high of $0.000000001912 and a low of $0.00000000174.
🔮 Price Predictions: What’s in Store for PEPE?
1️⃣ 2024: Experts forecast a price range between $0.0000175 and $0.0000290 by year-end. A major breakout could be on the horizon!
2️⃣ 2025: The outlook becomes even brighter with potential prices climbing to $0.000158.
3️⃣ 2030: Long-term predictions suggest PEPE might hit $0.177 to $0.507, a potential moonshot for early investors!
🌟 Why PEPE Could Be the Next Big Thing
💡 Community Power: The PEPE fanbase is growing rapidly, a key factor in the success of meme coins. Strong community engagement can drive massive growth.
💡 Big Investor Interest: Whale activity signals confidence in PEPE’s potential, with significant purchases bolstering its momentum.
💡 Market Resilience: Amid market turbulence, PEPE has shown stability, earning its place among serious contenders in the meme coin category.
⚠️ A Word of Caution
While PEPE shows immense promise, it’s important to remember that meme coins are highly volatile. Always DYOR (Do Your Own Research) and invest wisely.
🔥 Don’t Miss Out – PEPE Could Be the Future! 🔥
Join the meme coin revolution and stay ahead of the curve. Track PEPE on Binance and explore its exciting potential today!
👉 Trade PEPE now on Binance! #TrumpCountDown #SOLVLaunchOnBinance #XRPHits3 #USPPISoftens #EOSBreaks1$
2
375

·
--
Bullish
🔥 confirm 2x A hero 🚀 of the bull run 💯
$SUI Coin price prediction at the end of the month
Surge 🚀
By the end of this month, SUI’s price will be around
10usd 🚀 SUI
🗣️Fundamental Analysis
- SUI’s website and social media channels appear to be active, indicating a dedicated community and development team.
- The project’s whitepaper outlines a vision for a decentralized, community-driven blockchain with a focus on scalability, security, and usability.
- SUI has established partnerships with several organizations in the blockchain and cryptocurrency industries, which could potentially drive adoption.
🗣️ Conclusion:
SUI (SUI) seems to be a relatively promising cryptocurrency with a dedicated community and development team. Although the market cap of the project is significant.
{spot}(SUIUSDT)
#BinanceAlphaAlert #CPIPlunge2025 #USPPISoftens #TRUMP
🔥 confirm 2x A hero 🚀 of the bull run 💯
$SUI Coin price prediction at the end of the month
Surge 🚀
By the end of this month, SUI’s price will be around
10usd 🚀 SUI
🗣️Fundamental Analysis
- SUI’s website and social media channels appear to be active, indicating a dedicated community and development team.
- The project’s whitepaper outlines a vision for a decentralized, community-driven blockchain with a focus on scalability, security, and usability.
- SUI has established partnerships with several organizations in the blockchain and cryptocurrency industries, which could potentially drive adoption.
🗣️ Conclusion:
SUI (SUI) seems to be a relatively promising cryptocurrency with a dedicated community and development team. Although the market cap of the project is significant.
#BinanceAlphaAlert #CPIPlunge2025 #USPPISoftens #TRUMP
$SUI Coin price prediction at the end of the month
Surge 🚀
By the end of this month, SUI’s price will be around
10usd 🚀 SUI
🗣️Fundamental Analysis
- SUI’s website and social media channels appear to be active, indicating a dedicated community and development team.
- The project’s whitepaper outlines a vision for a decentralized, community-driven blockchain with a focus on scalability, security, and usability.
- SUI has established partnerships with several organizations in the blockchain and cryptocurrency industries, which could potentially drive adoption.
🗣️ Conclusion:
SUI (SUI) seems to be a relatively promising cryptocurrency with a dedicated community and development team. Although the market cap of the project is significant.
#BinanceAlphaAlert #CPIPlunge2025 #USPPISoftens #TRUMP

1.8k
941
289
1.8k



Article
"Surprising turn in monetary policy! The Fed eases its stance and sends signals of relief"#USPPISoftens The term #USPPISoftens suggests a possible easing of the monetary policy of the Federal Reserve Bank of the U.S. (Fed), specifically in relation to the Producer Price Index (PPI) and interest rates.
Some possible scenarios that could lead to an easing of monetary policy include:
1. Decrease in inflation: If inflation decreases, the Fed could relax its monetary policy to prevent an economic slowdown.
2. Slow economic growth: If economic growth is slow, the Fed could ease its monetary policy to stimulate the economy.
"Surprising turn in monetary policy! The Fed eases its stance and sends signals of relief"
#USPPISoftens The term #USPPISoftens suggests a possible easing of the monetary policy of the Federal Reserve Bank of the U.S. (Fed), specifically in relation to the Producer Price Index (PPI) and interest rates.
Some possible scenarios that could lead to an easing of monetary policy include:
1. Decrease in inflation: If inflation decreases, the Fed could relax its monetary policy to prevent an economic slowdown.
2. Slow economic growth: If economic growth is slow, the Fed could ease its monetary policy to stimulate the economy.
Some possible scenarios that could lead to an easing of monetary policy include:
1. Decrease in inflation: If inflation decreases, the Fed could relax its monetary policy to prevent an economic slowdown.
2. Slow economic growth: If economic growth is slow, the Fed could ease its monetary policy to stimulate the economy.
1.4k
849
197
1.4k
Log in to explore more content
Join global crypto users on Binance Square
⚡️ Get latest and useful information about crypto.
💬 Trusted by the world’s largest crypto exchange.
👍 Discover real insights from verified creators.
Email / Phone number
Trending Topics
1
#A Packed Week of Earnings and Data Tests Markets
42,360 views
302 Discussing
2
#AnthropicIPOTestsInvestorAppetiteForAI
56,940 views
970 Discussing
3
#BitcoinExtendsLosingStreakToSixWeeks
17,430 views
328 Discussing
4
#XRPFallsTo$0.89LowestSinceNovember2024
4,818 views
36 Discussing
5
#HuangReportedlyConsidersReturnToNvidia
79,135 views
986 Discussing
6
#SP500AndNasdaqFuturesHitQuarterlyLows
4,690 views
97 Discussing
7
#CaliforniaVotersBackProp42BarringNewCryptoTaxes
4,547 views
106 Discussing
8
#HKPlansDigitalAssetRegulatoryBillByYearEnd
4,147 views
88 Discussing
9
#MUFGSMFGMizuhoPlanYenBackedStablecoin
15,411 views
198 Discussing
10
#HKMAAndSwiftExploreTokenizedDepositInteroperability
742 views
14 Discussing