
#trbusdt
trbusdt
618,488 views
872 Discussing
Hot
Latest


·
--
Bullish
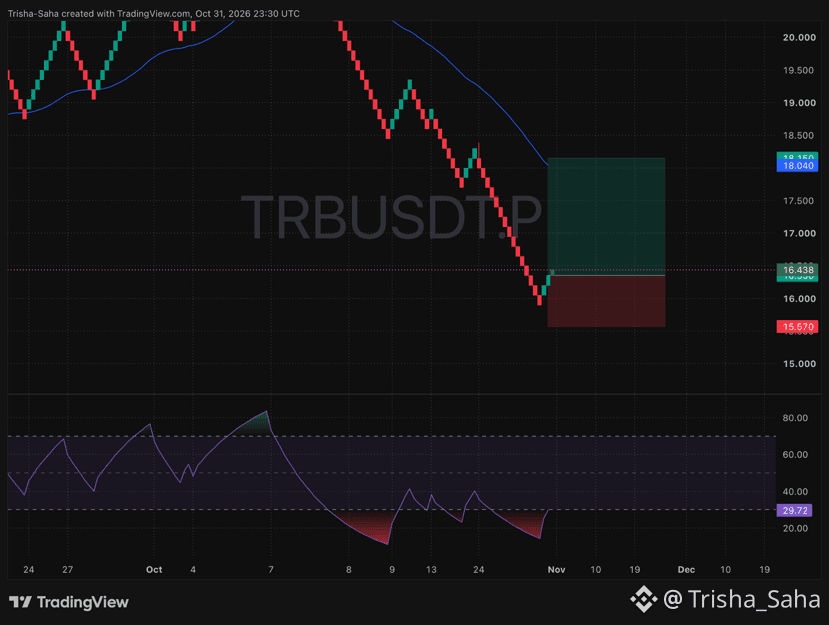
⚙️ $TRB just crushed the sell-off at $16.000 and is firing up for a massive snap-back rally! 🚂
📍 Trade Setup:
• Entry Zone: $16.20 – $16.43
• Stop Loss: $15.57
• Target: $18.15
📊 Chart Analysis:
• The heavy red slide stopped dead at the $16.000 floor and immediately printed three strong green candles.
• The bottom indicator is shooting straight out of the red danger zone at 29.72, proving buyers are stepping in aggressive.
• Wide open gap overhead to rip straight back toward the blue line sitting at $18.040.
🛡️ Lock in zero risk early: move your Stop Loss to Break-Even the very second this trade hits +3% to +4% profit.
I'm already in from the bottom turn. Are you riding this recovery wave with me? Drop a comment below! 👇
#TRB #TRBUSDT #CryptoSignals #BinanceSquare
{future}(TRBUSDT)
⚙️ $TRB just crushed the sell-off at $16.000 and is firing up for a massive snap-back rally! 🚂
📍 Trade Setup:
• Entry Zone: $16.20 – $16.43
• Stop Loss: $15.57
• Target: $18.15
📊 Chart Analysis:
• The heavy red slide stopped dead at the $16.000 floor and immediately printed three strong green candles.
• The bottom indicator is shooting straight out of the red danger zone at 29.72, proving buyers are stepping in aggressive.
• Wide open gap overhead to rip straight back toward the blue line sitting at $18.040.
🛡️ Lock in zero risk early: move your Stop Loss to Break-Even the very second this trade hits +3% to +4% profit.
I'm already in from the bottom turn. Are you riding this recovery wave with me? Drop a comment below! 👇
#TRB #TRBUSDT #CryptoSignals #BinanceSquare
📍 Trade Setup:
• Entry Zone: $16.20 – $16.43
• Stop Loss: $15.57
• Target: $18.15
📊 Chart Analysis:
• The heavy red slide stopped dead at the $16.000 floor and immediately printed three strong green candles.
• The bottom indicator is shooting straight out of the red danger zone at 29.72, proving buyers are stepping in aggressive.
• Wide open gap overhead to rip straight back toward the blue line sitting at $18.040.
🛡️ Lock in zero risk early: move your Stop Loss to Break-Even the very second this trade hits +3% to +4% profit.
I'm already in from the bottom turn. Are you riding this recovery wave with me? Drop a comment below! 👇
#TRB #TRBUSDT #CryptoSignals #BinanceSquare
1
442

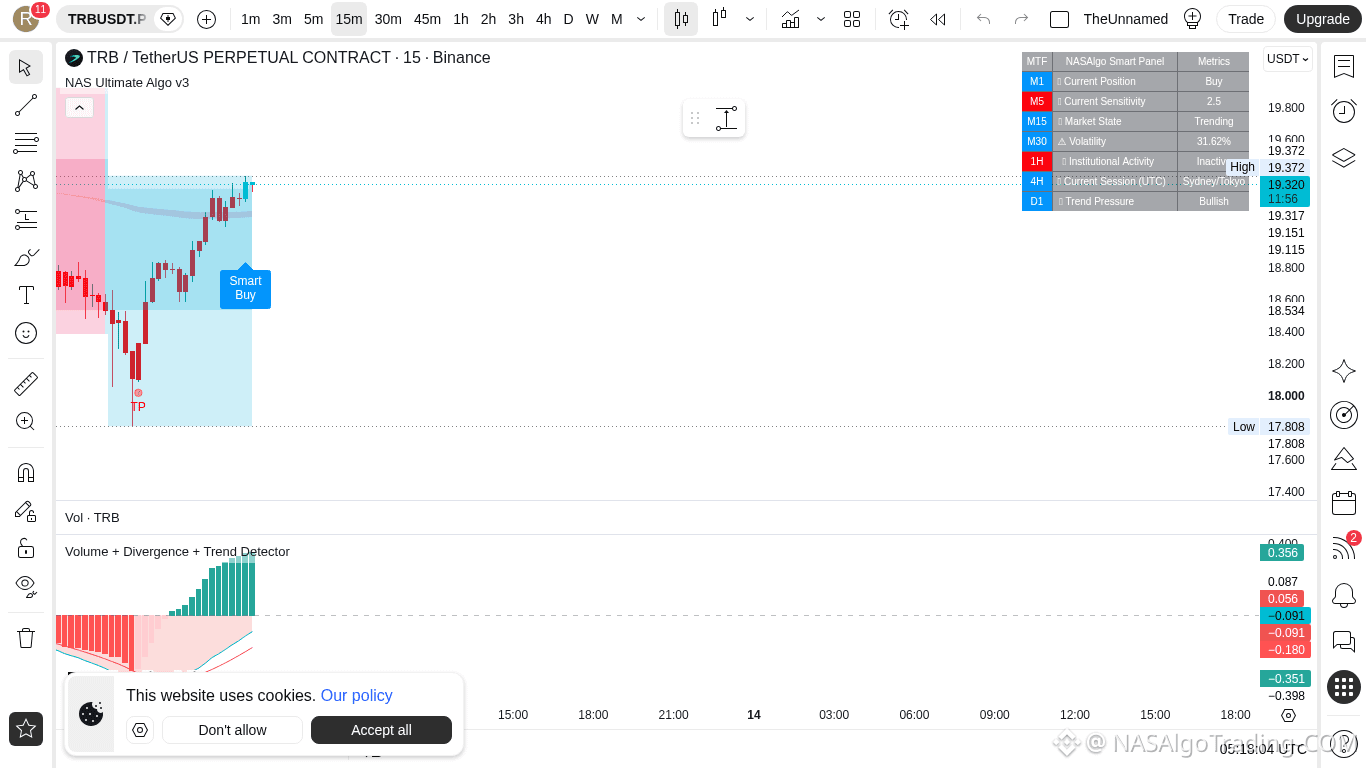
🚀 $TRB 🟢 Buy Entry Zone: 18.94438 – 19.331 | High-Probability Trading Setup!
📊 Technical Analysis (15M):
Yo team, just caught something clean on TRBUSDT and had to share fast 👀
We've got price sitting right in a fresh accumulation pocket and the structure is lining up beautifully for a push. The immediate support at 18.75107 is holding like a champ — every dip into that zone keeps getting bought up, which tells me the bulls are defending this area hard. Below that we've got deeper support at 18.5654924 just in case things get spicy, but honestly I don't think we'll need it 🧠
Here's the setup I'm looking at:
Entry Zone: 18.94438 to 19.331
This is the sweet spot. We're catching price right as it consolidates before the next leg up. Don't chase it crazy high, let it come to you 💪
Targets lined up like stairs:
🎯 TP1: 19.23337845
🎯 TP2: 19.3290669
🎯 TP3: 19.42475535
🎯 TP4: 19.5204438
Notice how TP1 at 19.23337845 is the first resistance we need to flip — that's our immediate hurdle. Once we break and close above it, the second resistance at 19.3290669 becomes the next wall, and that lines up perfectly with TP2. After that, it's a clear runway toward 19.42475535 and the final resistance at 19.5204438 🔥
🔴 Stop Loss: 18.75107
This sits right under immediate support, so if we lose that level the trade thesis is dead and we walk away. Clean risk defined, no guessing ⚠️
🚀 Leverage: 5x–10x
Keep it measured. 5x if you want to sleep easy, 10x if you're feeling aggressive but respect the stop.
The risk-to-reward here is solid — small stop, multiple targets stacked in our favor. This is the kind of setup I love because the invalidation point is crystal clear. Support at 18.75107 holds, we ride. Resistance at 19.23337845 and 19.3290669 flip, and we're off to the races 📈
⚠️ Note: Always manage your position size, never risk more than you're comfortable losing, and move your stop to breakeven after TP1 hits. Crypto moves fast, stay sharp ✨
📢 Follow NASAlgoTrading for more crypto trading setups!
#TRB #TRBUSDT
📌 Crypto Alert
🚀 $TRB 🟢 Buy Entry Zone: 18.94438 – 19.331 | High-Probability Trading Setup!
📊 Technical Analysis (15M):
Yo team, just caught something clean on TRBUSDT and had to share fast 👀
We've got price sitting right in a fresh accumulation pocket and the structure is lining up beautifully for a push. The immediate support at 18.75107 is holding like a champ — every dip into that zone keeps getting bought up, which tells me the bulls are defending this area hard. Below that we've got deeper support at 18.5654924 just in case things get spicy, but honestly I don't think we'll need it 🧠
Here's the setup I'm looking at:
Entry Zone: 18.94438 to 19.331
This is the sweet spot. We're catching price right as it consolidates before the next leg up. Don't chase it crazy high, let it come to you 💪
Targets lined up like stairs:
🎯 TP1: 19.23337845
🎯 TP2: 19.3290669
🎯 TP3: 19.42475535
🎯 TP4: 19.5204438
Notice how TP1 at 19.23337845 is the first resistance we need to flip — that's our immediate hurdle. Once we break and close above it, the second resistance at 19.3290669 becomes the next wall, and that lines up perfectly with TP2. After that, it's a clear runway toward 19.42475535 and the final resistance at 19.5204438 🔥
🔴 Stop Loss: 18.75107
This sits right under immediate support, so if we lose that level the trade thesis is dead and we walk away. Clean risk defined, no guessing ⚠️
🚀 Leverage: 5x–10x
Keep it measured. 5x if you want to sleep easy, 10x if you're feeling aggressive but respect the stop.
The risk-to-reward here is solid — small stop, multiple targets stacked in our favor. This is the kind of setup I love because the invalidation point is crystal clear. Support at 18.75107 holds, we ride. Resistance at 19.23337845 and 19.3290669 flip, and we're off to the races 📈
⚠️ Note: Always manage your position size, never risk more than you're comfortable losing, and move your stop to breakeven after TP1 hits. Crypto moves fast, stay sharp ✨
📢 Follow NASAlgoTrading for more crypto trading setups!
#TRB #TRBUSDT
📌 Crypto Alert
📊 Technical Analysis (15M):
Yo team, just caught something clean on TRBUSDT and had to share fast 👀
We've got price sitting right in a fresh accumulation pocket and the structure is lining up beautifully for a push. The immediate support at 18.75107 is holding like a champ — every dip into that zone keeps getting bought up, which tells me the bulls are defending this area hard. Below that we've got deeper support at 18.5654924 just in case things get spicy, but honestly I don't think we'll need it 🧠
Here's the setup I'm looking at:
Entry Zone: 18.94438 to 19.331
This is the sweet spot. We're catching price right as it consolidates before the next leg up. Don't chase it crazy high, let it come to you 💪
Targets lined up like stairs:
🎯 TP1: 19.23337845
🎯 TP2: 19.3290669
🎯 TP3: 19.42475535
🎯 TP4: 19.5204438
Notice how TP1 at 19.23337845 is the first resistance we need to flip — that's our immediate hurdle. Once we break and close above it, the second resistance at 19.3290669 becomes the next wall, and that lines up perfectly with TP2. After that, it's a clear runway toward 19.42475535 and the final resistance at 19.5204438 🔥
🔴 Stop Loss: 18.75107
This sits right under immediate support, so if we lose that level the trade thesis is dead and we walk away. Clean risk defined, no guessing ⚠️
🚀 Leverage: 5x–10x
Keep it measured. 5x if you want to sleep easy, 10x if you're feeling aggressive but respect the stop.
The risk-to-reward here is solid — small stop, multiple targets stacked in our favor. This is the kind of setup I love because the invalidation point is crystal clear. Support at 18.75107 holds, we ride. Resistance at 19.23337845 and 19.3290669 flip, and we're off to the races 📈
⚠️ Note: Always manage your position size, never risk more than you're comfortable losing, and move your stop to breakeven after TP1 hits. Crypto moves fast, stay sharp ✨
📢 Follow NASAlgoTrading for more crypto trading setups!
#TRB #TRBUSDT
📌 Crypto Alert
56

·
--
Bullish
👀 $TRB — QUIET NOW, BUT KEEP IT ON YOUR RADAR! 🚀
Sometimes the biggest moves start when a coin is moving sideways and everyone loses interest.
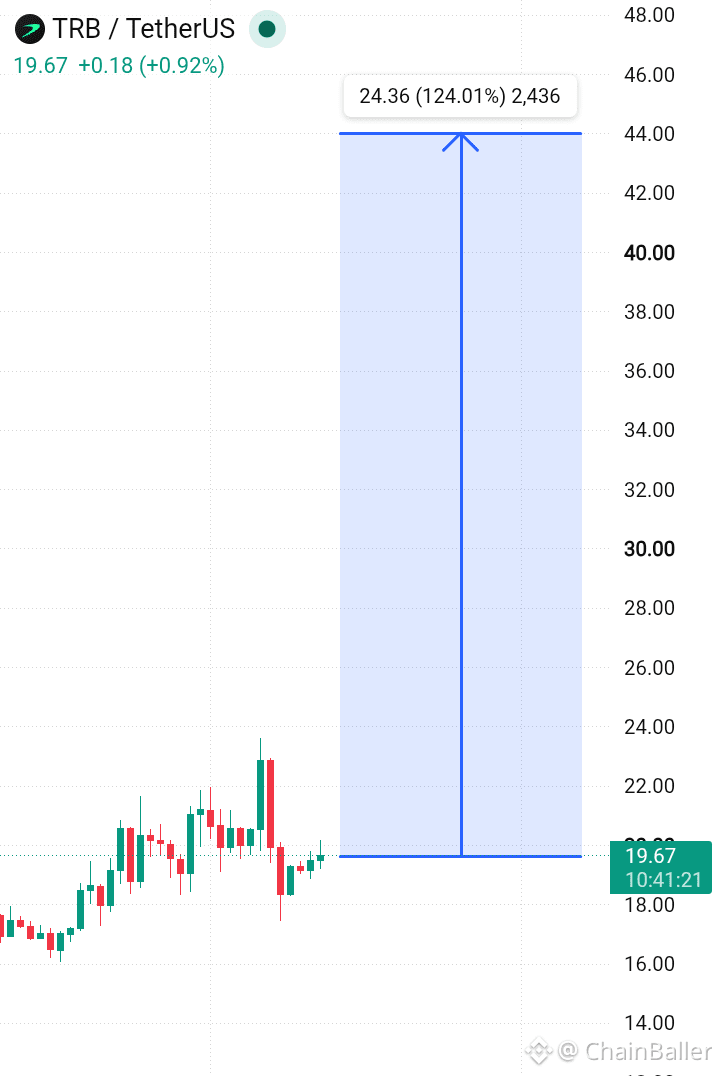
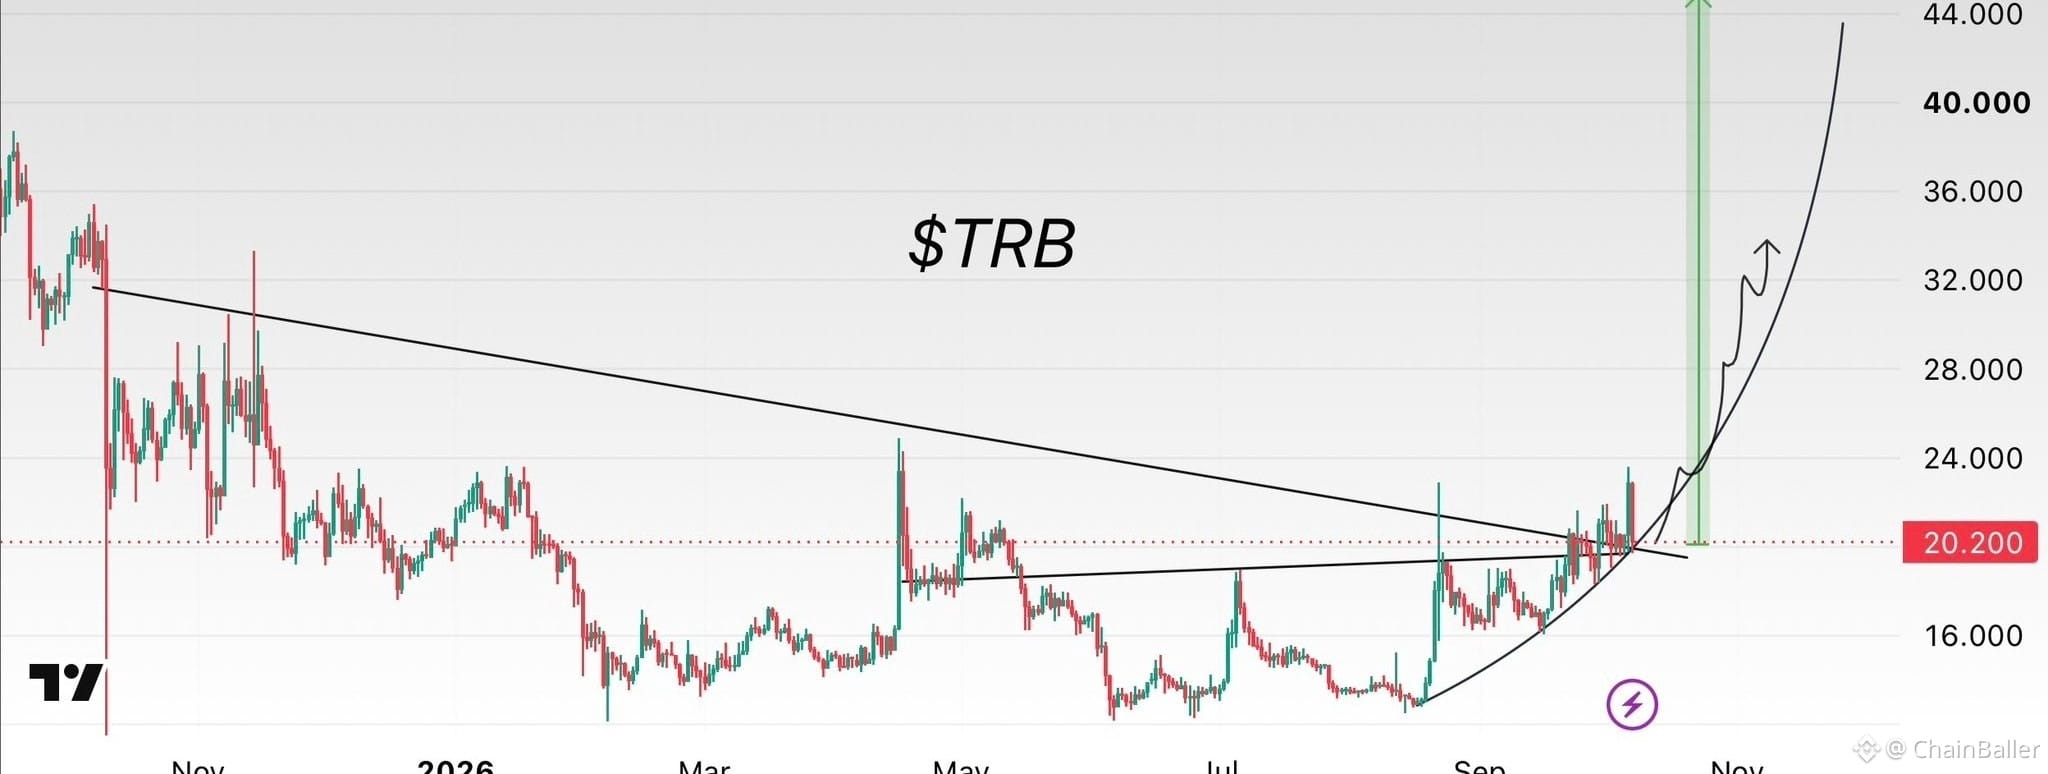
$TRB is trading around $19.67, holding near the recent consolidation zone after bouncing between roughly $18 and $23.
🤑 If buyers regain control and price breaks above resistance, a stronger move could follow. The chart marks $44 as a potential upside scenario — but that would require a major rally, not a guarantee.
📌 My take: Keep $TRB on your watchlist, be patient, and wait for confirmation. Don't blindly buy and hold just because a big target is drawn on the chart.
Who’s watching TRB for its next move? 👇🚀
#TRB #TRBUSDT #Altcoins #ChainBaller
👀 $TRB — QUIET NOW, BUT KEEP IT ON YOUR RADAR! 🚀
Sometimes the biggest moves start when a coin is moving sideways and everyone loses interest.
$TRB is trading around $19.67, holding near the recent consolidation zone after bouncing between roughly $18 and $23.
🤑 If buyers regain control and price breaks above resistance, a stronger move could follow. The chart marks $44 as a potential upside scenario — but that would require a major rally, not a guarantee.
📌 My take: Keep $TRB on your watchlist, be patient, and wait for confirmation. Don't blindly buy and hold just because a big target is drawn on the chart.
Who’s watching TRB for its next move? 👇🚀
#TRB #TRBUSDT #Altcoins #ChainBaller
Sometimes the biggest moves start when a coin is moving sideways and everyone loses interest.
$TRB is trading around $19.67, holding near the recent consolidation zone after bouncing between roughly $18 and $23.
🤑 If buyers regain control and price breaks above resistance, a stronger move could follow. The chart marks $44 as a potential upside scenario — but that would require a major rally, not a guarantee.
📌 My take: Keep $TRB on your watchlist, be patient, and wait for confirmation. Don't blindly buy and hold just because a big target is drawn on the chart.
Who’s watching TRB for its next move? 👇🚀
#TRB #TRBUSDT #Altcoins #ChainBaller
126
·
--
🍤 The price breaking through a strong support zone shows that selling pressure overhead remains extremely fierce.
🌋 SHORT $TRB
Entry: 19.712
TP: 18.726 | SL: 21.683
🧵 The bond between users and the project creates a strong ecosystem.
📊 The Elder Ray indicator shows buying pressure surging to a high level.
🛡️ Be the most loyal protector of your dreams and ambitions.
🍀 Wishing you an exciting journey and outstanding results over time.
#TRBUSDT $TRBUSDT
🍤 The price breaking through a strong support zone shows that selling pressure overhead remains extremely fierce.
🌋 SHORT $TRB
Entry: 19.712
TP: 18.726 | SL: 21.683
🧵 The bond between users and the project creates a strong ecosystem.
📊 The Elder Ray indicator shows buying pressure surging to a high level.
🛡️ Be the most loyal protector of your dreams and ambitions.
🍀 Wishing you an exciting journey and outstanding results over time.
#TRBUSDT $TRBUSDT
🌋 SHORT $TRB
Entry: 19.712
TP: 18.726 | SL: 21.683
🧵 The bond between users and the project creates a strong ecosystem.
📊 The Elder Ray indicator shows buying pressure surging to a high level.
🛡️ Be the most loyal protector of your dreams and ambitions.
🍀 Wishing you an exciting journey and outstanding results over time.
#TRBUSDT $TRBUSDT
43

·
--
Opened and saw that $TRB moved again—quickly, here’s an analysis for everyone
💰 Current Price: 18.3160 USDT (2H +13.44%)
📈 4H Indicators
RSI: 85.9 ⚠️ Overbought zone—watch for a pullback
MACD: Golden Cross 🟢
Trend: Bullish alignment ✅ The trend looks good
📊 Daily Indicators
RSI: 78.7
MA7/25: Above the moving averages ✅
MA99: Above the yearly line ✅
MACD: Golden Cross 🟢
⚡ Momentum
Trend direction: Slightly strong (bullish)
1H Momentum: +12.04 Bullish momentum ↑
4H Momentum: +6.44 Bullish momentum ↑
Divergence signals: 1H none | 4H none
Momentum strength: Extremely strong 🔥
Trading volume: 📊 Increased volume (5.11x)
🔗 On-chain tracking
OI change 1H: +1.67%
OI change 4H: +31.07%
1H fund flow: Bullish inflow 🟢 | Net flow: 1.68M
4H fund flow: Bullish inflow 🟢 | Net flow: 2.29M
Main player behavior: Long/short turnover
Funding rate: 0.0000%
🎯 Trading Suggestions
Direction: 🟢 Go long
Entry: 16.5230–18.3160
Hard stop loss: 16.2944
First take profit: 19.2318
Second take profit: 20.1476
Recommended leverage: 5x
#TRB #TRBUSDT #币安广场 #technical analysis
Opened and saw that $TRB moved again—quickly, here’s an analysis for everyone
💰 Current Price: 18.3160 USDT (2H +13.44%)
📈 4H Indicators
RSI: 85.9 ⚠️ Overbought zone—watch for a pullback
MACD: Golden Cross 🟢
Trend: Bullish alignment ✅ The trend looks good
📊 Daily Indicators
RSI: 78.7
MA7/25: Above the moving averages ✅
MA99: Above the yearly line ✅
MACD: Golden Cross 🟢
⚡ Momentum
Trend direction: Slightly strong (bullish)
1H Momentum: +12.04 Bullish momentum ↑
4H Momentum: +6.44 Bullish momentum ↑
Divergence signals: 1H none | 4H none
Momentum strength: Extremely strong 🔥
Trading volume: 📊 Increased volume (5.11x)
🔗 On-chain tracking
OI change 1H: +1.67%
OI change 4H: +31.07%
1H fund flow: Bullish inflow 🟢 | Net flow: 1.68M
4H fund flow: Bullish inflow 🟢 | Net flow: 2.29M
Main player behavior: Long/short turnover
Funding rate: 0.0000%
🎯 Trading Suggestions
Direction: 🟢 Go long
Entry: 16.5230–18.3160
Hard stop loss: 16.2944
First take profit: 19.2318
Second take profit: 20.1476
Recommended leverage: 5x
#TRB #TRBUSDT #币安广场 #technical analysis
💰 Current Price: 18.3160 USDT (2H +13.44%)
📈 4H Indicators
RSI: 85.9 ⚠️ Overbought zone—watch for a pullback
MACD: Golden Cross 🟢
Trend: Bullish alignment ✅ The trend looks good
📊 Daily Indicators
RSI: 78.7
MA7/25: Above the moving averages ✅
MA99: Above the yearly line ✅
MACD: Golden Cross 🟢
⚡ Momentum
Trend direction: Slightly strong (bullish)
1H Momentum: +12.04 Bullish momentum ↑
4H Momentum: +6.44 Bullish momentum ↑
Divergence signals: 1H none | 4H none
Momentum strength: Extremely strong 🔥
Trading volume: 📊 Increased volume (5.11x)
🔗 On-chain tracking
OI change 1H: +1.67%
OI change 4H: +31.07%
1H fund flow: Bullish inflow 🟢 | Net flow: 1.68M
4H fund flow: Bullish inflow 🟢 | Net flow: 2.29M
Main player behavior: Long/short turnover
Funding rate: 0.0000%
🎯 Trading Suggestions
Direction: 🟢 Go long
Entry: 16.5230–18.3160
Hard stop loss: 16.2944
First take profit: 19.2318
Second take profit: 20.1476
Recommended leverage: 5x
#TRB #TRBUSDT #币安广场 #technical analysis
58

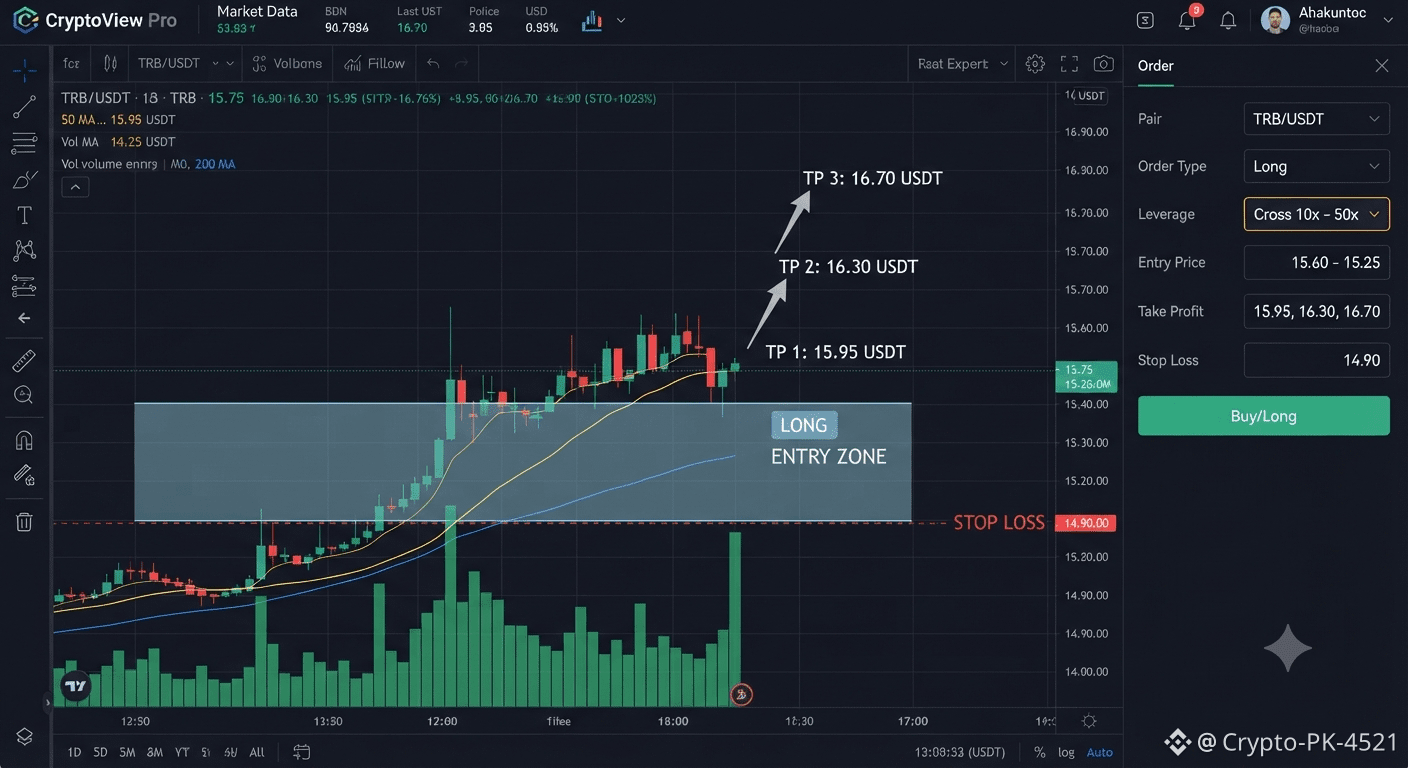
#TRBUSDT
Position: LONG
Leverage: Cross 10× To 50×
Entries: 15.60 - 15.25
Targets: 15.95, 16.30, 16.70
Stop Loss: 14.90
$TRB
{spot}(TRBUSDT)
#TRBUSDT
Position: LONG
Leverage: Cross 10× To 50×
Entries: 15.60 - 15.25
Targets: 15.95, 16.30, 16.70
Stop Loss: 14.90
$TRB
Position: LONG
Leverage: Cross 10× To 50×
Entries: 15.60 - 15.25
Targets: 15.95, 16.30, 16.70
Stop Loss: 14.90
$TRB
73

·
--
🥖 Persistence and long-term vision in my investment plan help me go further, and be more steady and confident every day in the market.
📈 LONG $TRB
Entry: 21.798
TP: 22.887 | SL: 19.618
🔭 Analysts predict that crypto market capitalization will soon surpass real gold.
🔍 Price reacts to Gann Fan levels in a highly artistic and accurate way.
🧠 Turn trading into a professional job, instead of gambling.
🌈 I hope you’ll always feel inspired to explore new horizons.
#TRBUSDT $TRBUSDT
🥖 Persistence and long-term vision in my investment plan help me go further, and be more steady and confident every day in the market.
📈 LONG $TRB
Entry: 21.798
TP: 22.887 | SL: 19.618
🔭 Analysts predict that crypto market capitalization will soon surpass real gold.
🔍 Price reacts to Gann Fan levels in a highly artistic and accurate way.
🧠 Turn trading into a professional job, instead of gambling.
🌈 I hope you’ll always feel inspired to explore new horizons.
#TRBUSDT $TRBUSDT
📈 LONG $TRB
Entry: 21.798
TP: 22.887 | SL: 19.618
🔭 Analysts predict that crypto market capitalization will soon surpass real gold.
🔍 Price reacts to Gann Fan levels in a highly artistic and accurate way.
🧠 Turn trading into a professional job, instead of gambling.
🌈 I hope you’ll always feel inspired to explore new horizons.
#TRBUSDT $TRBUSDT
192

·
--
$TRB
#TRBUSDT | Strong daily gains up to +14.3% and continued momentum to break new levels 🚀
• Trend: Long / continuation of bullish momentum 🟢
• Entry: 20.60 - 21.31
• Stop Loss: 19.90
🎯 Quick scalping targets:
1️⃣ 23.20
2️⃣ 25.00
3️⃣ 27.50
💡 Market pulse: Active liquidity flows record $29.7K in one minute, with an instant balance of 50% between buyers and sellers—supported by a notable day-to-day rise of +14.3% and a bullish immediate momentum of +0.7%, amid ongoing confirmed signals (4 signals ⭐️). A positive cue to keep following the momentum and quickly, decisively target the higher goals! ⚡️
{future}(TRBUSDT)
$TRB
#TRBUSDT | Strong daily gains up to +14.3% and continued momentum to break new levels 🚀
• Trend: Long / continuation of bullish momentum 🟢
• Entry: 20.60 - 21.31
• Stop Loss: 19.90
🎯 Quick scalping targets:
1️⃣ 23.20
2️⃣ 25.00
3️⃣ 27.50
💡 Market pulse: Active liquidity flows record $29.7K in one minute, with an instant balance of 50% between buyers and sellers—supported by a notable day-to-day rise of +14.3% and a bullish immediate momentum of +0.7%, amid ongoing confirmed signals (4 signals ⭐️). A positive cue to keep following the momentum and quickly, decisively target the higher goals! ⚡️
#TRBUSDT | Strong daily gains up to +14.3% and continued momentum to break new levels 🚀
• Trend: Long / continuation of bullish momentum 🟢
• Entry: 20.60 - 21.31
• Stop Loss: 19.90
🎯 Quick scalping targets:
1️⃣ 23.20
2️⃣ 25.00
3️⃣ 27.50
💡 Market pulse: Active liquidity flows record $29.7K in one minute, with an instant balance of 50% between buyers and sellers—supported by a notable day-to-day rise of +14.3% and a bullish immediate momentum of +0.7%, amid ongoing confirmed signals (4 signals ⭐️). A positive cue to keep following the momentum and quickly, decisively target the higher goals! ⚡️
14

·
--
$TRB
{spot}(TRBUSDT)
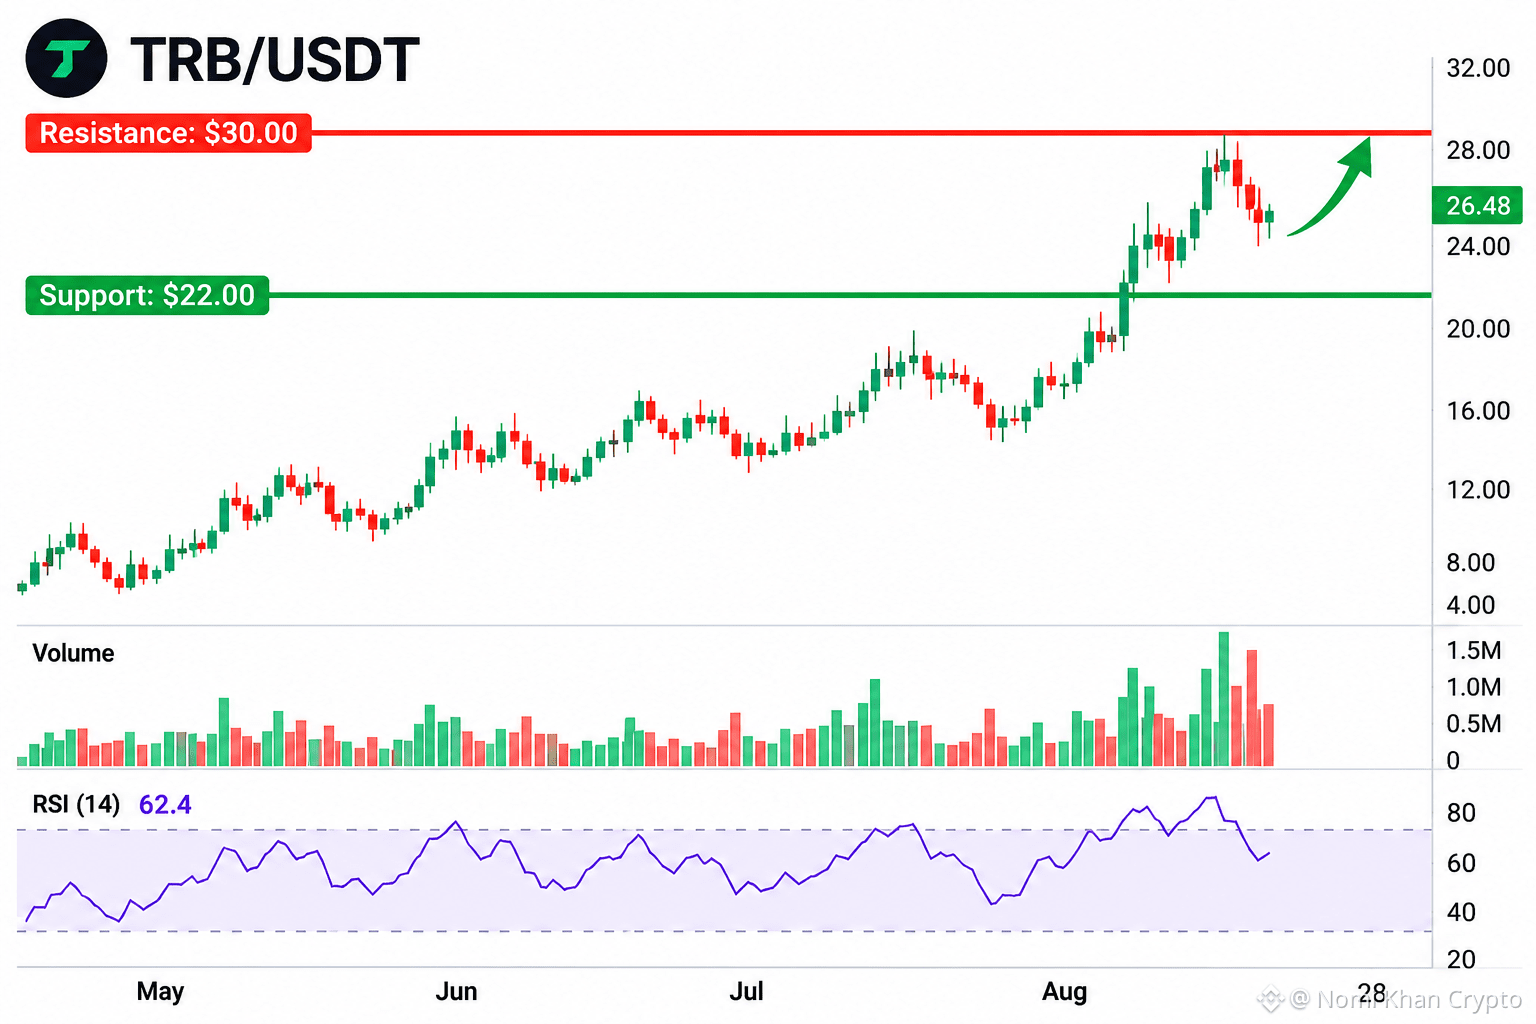
TRB is showing strong momentum, with price and volume picking up recently. The token is Tellor’s decentralized oracle asset, and the recent Bithumb KRW listing could bring additional liquidity and attention.
If buyers hold the current momentum, TRB could test higher resistance zones. But after a sharp move, volatility and profit-taking remain possible.
⚠️ DYOR — not financial advice.
#TRBUSDT #USCanadaTradeTalksCollapseCanadaVowsRetaliation #NvidiaAIServerPricesRiseOver15%
$TRB
TRB is showing strong momentum, with price and volume picking up recently. The token is Tellor’s decentralized oracle asset, and the recent Bithumb KRW listing could bring additional liquidity and attention.
If buyers hold the current momentum, TRB could test higher resistance zones. But after a sharp move, volatility and profit-taking remain possible.
⚠️ DYOR — not financial advice.
#TRBUSDT #USCanadaTradeTalksCollapseCanadaVowsRetaliation #NvidiaAIServerPricesRiseOver15%
TRB is showing strong momentum, with price and volume picking up recently. The token is Tellor’s decentralized oracle asset, and the recent Bithumb KRW listing could bring additional liquidity and attention.
If buyers hold the current momentum, TRB could test higher resistance zones. But after a sharp move, volatility and profit-taking remain possible.
⚠️ DYOR — not financial advice.
#TRBUSDT #USCanadaTradeTalksCollapseCanadaVowsRetaliation #NvidiaAIServerPricesRiseOver15%
2
1
241
·
--
🌈 Canceling the stop-loss order that day was the wrong move that pushed me to the brink of total wipeout.
🎯 SHORT $TRB
Entry: 19.894
TP: 18.899 | SL: 21.883
🧵 The connection of small capital into a powerful current in the market.
📈 The formation of the handle in the Cup and Handle pattern is very precise.
🎯 Every trade is an experience—turn them into precious assets for yourself.
🌸 Wishing that prosperity will always surround you and your loved ones.
#TRBUSDT $TRBUSDT
🌈 Canceling the stop-loss order that day was the wrong move that pushed me to the brink of total wipeout.
🎯 SHORT $TRB
Entry: 19.894
TP: 18.899 | SL: 21.883
🧵 The connection of small capital into a powerful current in the market.
📈 The formation of the handle in the Cup and Handle pattern is very precise.
🎯 Every trade is an experience—turn them into precious assets for yourself.
🌸 Wishing that prosperity will always surround you and your loved ones.
#TRBUSDT $TRBUSDT
🎯 SHORT $TRB
Entry: 19.894
TP: 18.899 | SL: 21.883
🧵 The connection of small capital into a powerful current in the market.
📈 The formation of the handle in the Cup and Handle pattern is very precise.
🎯 Every trade is an experience—turn them into precious assets for yourself.
🌸 Wishing that prosperity will always surround you and your loved ones.
#TRBUSDT $TRBUSDT
65
·
--
🍢 A series of consecutive positive events is building momentum for an impressive sustained uptrend.
🏆 LONG $TRB
Entry: 22.817
TP: 23.957 | SL: 20.535
🪜 Every technological advance is a step that takes the price to new heights.
📈 The steady appearance of green candles shows traders' enthusiasm.
🧘 Learn to accept that you cannot control the market.
🌞 May you always find great luck and good friends on the exchange.
#TRBUSDT $TRBUSDT
🍢 A series of consecutive positive events is building momentum for an impressive sustained uptrend.
🏆 LONG $TRB
Entry: 22.817
TP: 23.957 | SL: 20.535
🪜 Every technological advance is a step that takes the price to new heights.
📈 The steady appearance of green candles shows traders' enthusiasm.
🧘 Learn to accept that you cannot control the market.
🌞 May you always find great luck and good friends on the exchange.
#TRBUSDT $TRBUSDT
🏆 LONG $TRB
Entry: 22.817
TP: 23.957 | SL: 20.535
🪜 Every technological advance is a step that takes the price to new heights.
📈 The steady appearance of green candles shows traders' enthusiasm.
🧘 Learn to accept that you cannot control the market.
🌞 May you always find great luck and good friends on the exchange.
#TRBUSDT $TRBUSDT
53

·
--
Bearish
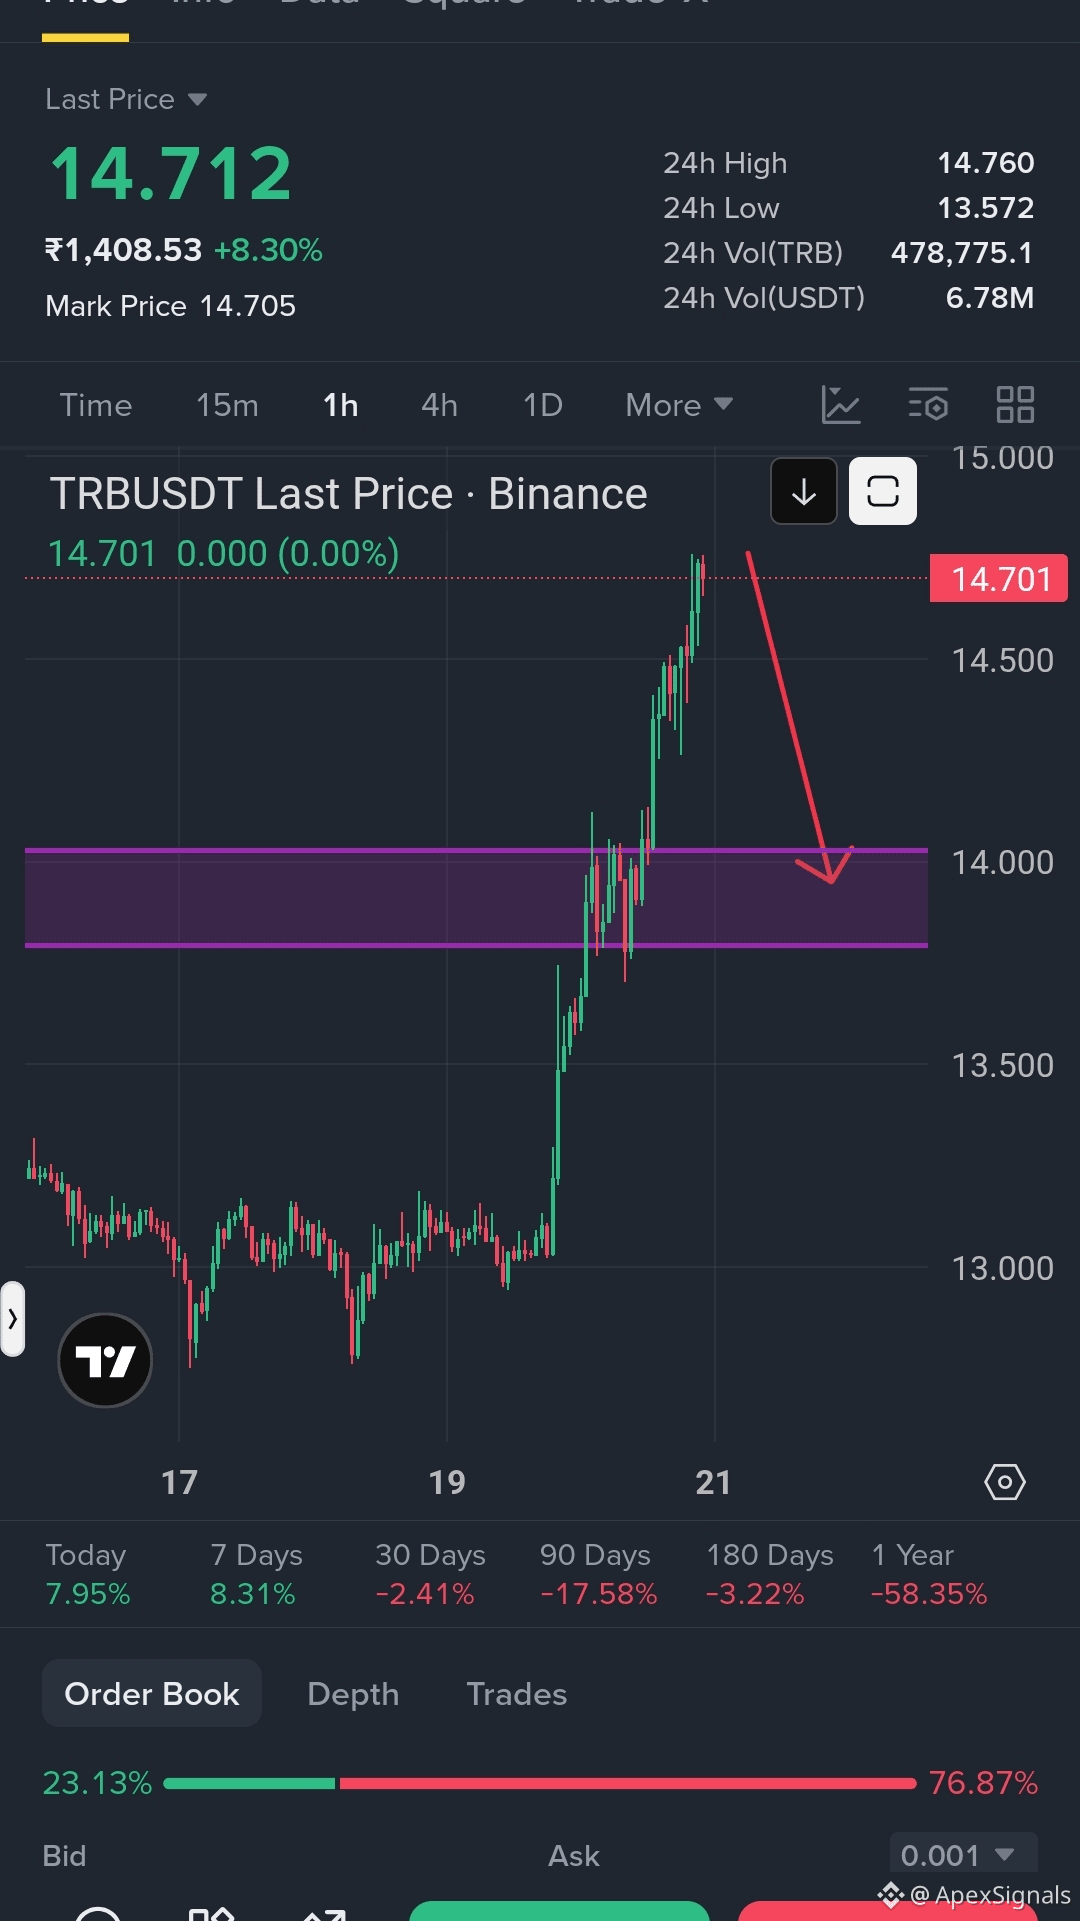
📊 $TRB /USDT – 1H Analysis
TRB is trading around $14.71 after a strong 8%+ move. Price broke above the previous $13.80–$14.00 resistance zone and quickly pushed toward the $14.75 area.
📉 Pullback Scenario: After this sharp pump, TRB could see some profit-taking. If price fails to hold near $14.50–$14.70, a correction toward the previous breakout zone around $14.00–$13.80 could follow.
🎯 Key Retest Zone: $13.80–$14.00
📈 Invalidation: A strong 1H breakout and hold above $14.75–$15.00 could extend the bullish momentum.
Avoid chasing after a sharp pump. Wait for confirmation and always use Stop Loss with proper risk management.
#TRB #TRBUSDT #Crypto #Trading #Binance
{future}(TRBUSDT)
📊 $TRB /USDT – 1H Analysis
TRB is trading around $14.71 after a strong 8%+ move. Price broke above the previous $13.80–$14.00 resistance zone and quickly pushed toward the $14.75 area.
📉 Pullback Scenario: After this sharp pump, TRB could see some profit-taking. If price fails to hold near $14.50–$14.70, a correction toward the previous breakout zone around $14.00–$13.80 could follow.
🎯 Key Retest Zone: $13.80–$14.00
📈 Invalidation: A strong 1H breakout and hold above $14.75–$15.00 could extend the bullish momentum.
Avoid chasing after a sharp pump. Wait for confirmation and always use Stop Loss with proper risk management.
#TRB #TRBUSDT #Crypto #Trading #Binance
TRB is trading around $14.71 after a strong 8%+ move. Price broke above the previous $13.80–$14.00 resistance zone and quickly pushed toward the $14.75 area.
📉 Pullback Scenario: After this sharp pump, TRB could see some profit-taking. If price fails to hold near $14.50–$14.70, a correction toward the previous breakout zone around $14.00–$13.80 could follow.
🎯 Key Retest Zone: $13.80–$14.00
📈 Invalidation: A strong 1H breakout and hold above $14.75–$15.00 could extend the bullish momentum.
Avoid chasing after a sharp pump. Wait for confirmation and always use Stop Loss with proper risk management.
#TRB #TRBUSDT #Crypto #Trading #Binance
1
260

·
--
### 📈 $TRB Rebounds: Testing Key 1-Hour Resistance
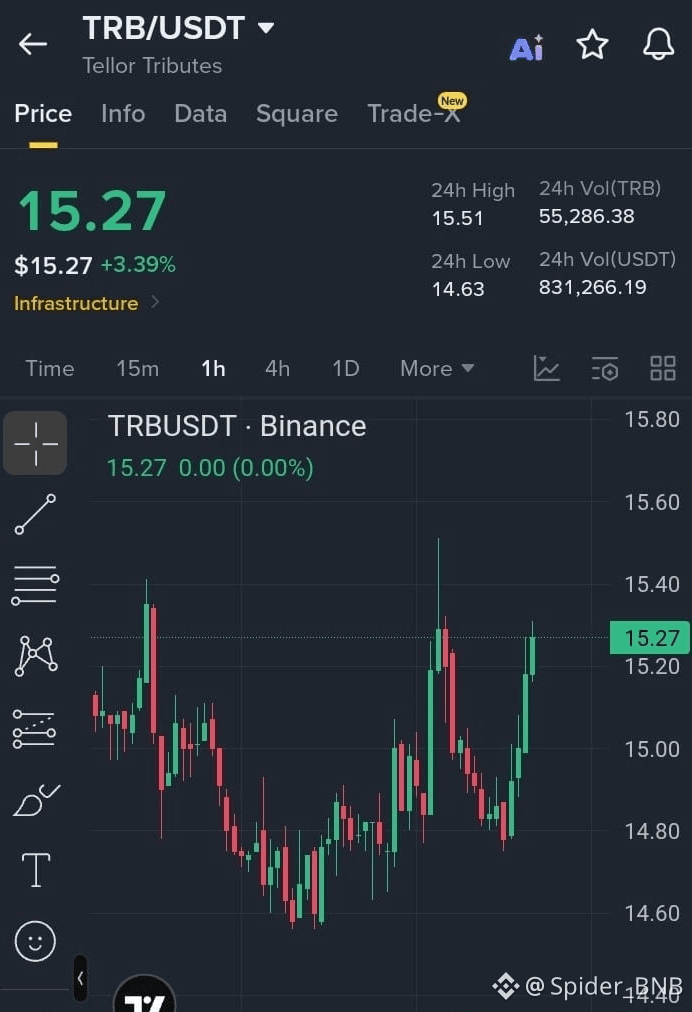
**Tellor Tributes ($TRB )** is showing signs of a short-term trend reversal on the 1-hour chart.
After grinding out a local bottom around the **14.60** zone, consecutive green candles have pushed the asset back toward its upper daily distribution range.
### 📊 Key Numbers
* **Current Price:** **15.27** (**+3.39%**)
* **24h High:** **15.51**
* **24h Low:** **14.63**
* **24h Volume:** **55,286.38 TRB** (~**$831,266.19 USDT**)
* **Sector:** **Infrastructure**
### 🔍 Technical Takeaways
* **The Double-Bottom Reversal:** The 1h chart highlights an aggressive V-shaped recovery off the **14.63** low, showing that buyers stepped in heavily to absorb the sell pressure.
* **Overhead Resistance:** Price is currently hitting minor friction right at the **15.30** line. A clean hourly close above this pivot unlocks a direct retest of the 24-hour high at **15.51**, where major wick liquidation previously occurred.
* **Baseline Support:** The previous higher-low cluster near **14.90** serves as the immediate fallback support zone.
{future}(TRBUSDT)
**Tags:** #TRB #Tellor #TRBUSDT #SPIDER_BNB
### 📈 $TRB Rebounds: Testing Key 1-Hour Resistance
**Tellor Tributes ($TRB )** is showing signs of a short-term trend reversal on the 1-hour chart.
After grinding out a local bottom around the **14.60** zone, consecutive green candles have pushed the asset back toward its upper daily distribution range.
### 📊 Key Numbers
* **Current Price:** **15.27** (**+3.39%**)
* **24h High:** **15.51**
* **24h Low:** **14.63**
* **24h Volume:** **55,286.38 TRB** (~**$831,266.19 USDT**)
* **Sector:** **Infrastructure**
### 🔍 Technical Takeaways
* **The Double-Bottom Reversal:** The 1h chart highlights an aggressive V-shaped recovery off the **14.63** low, showing that buyers stepped in heavily to absorb the sell pressure.
* **Overhead Resistance:** Price is currently hitting minor friction right at the **15.30** line. A clean hourly close above this pivot unlocks a direct retest of the 24-hour high at **15.51**, where major wick liquidation previously occurred.
* **Baseline Support:** The previous higher-low cluster near **14.90** serves as the immediate fallback support zone.
**Tags:** #TRB #Tellor #TRBUSDT #SPIDER_BNB
**Tellor Tributes ($TRB )** is showing signs of a short-term trend reversal on the 1-hour chart.
After grinding out a local bottom around the **14.60** zone, consecutive green candles have pushed the asset back toward its upper daily distribution range.
### 📊 Key Numbers
* **Current Price:** **15.27** (**+3.39%**)
* **24h High:** **15.51**
* **24h Low:** **14.63**
* **24h Volume:** **55,286.38 TRB** (~**$831,266.19 USDT**)
* **Sector:** **Infrastructure**
### 🔍 Technical Takeaways
* **The Double-Bottom Reversal:** The 1h chart highlights an aggressive V-shaped recovery off the **14.63** low, showing that buyers stepped in heavily to absorb the sell pressure.
* **Overhead Resistance:** Price is currently hitting minor friction right at the **15.30** line. A clean hourly close above this pivot unlocks a direct retest of the 24-hour high at **15.51**, where major wick liquidation previously occurred.
* **Baseline Support:** The previous higher-low cluster near **14.90** serves as the immediate fallback support zone.
**Tags:** #TRB #Tellor #TRBUSDT #SPIDER_BNB
1
145

·
--
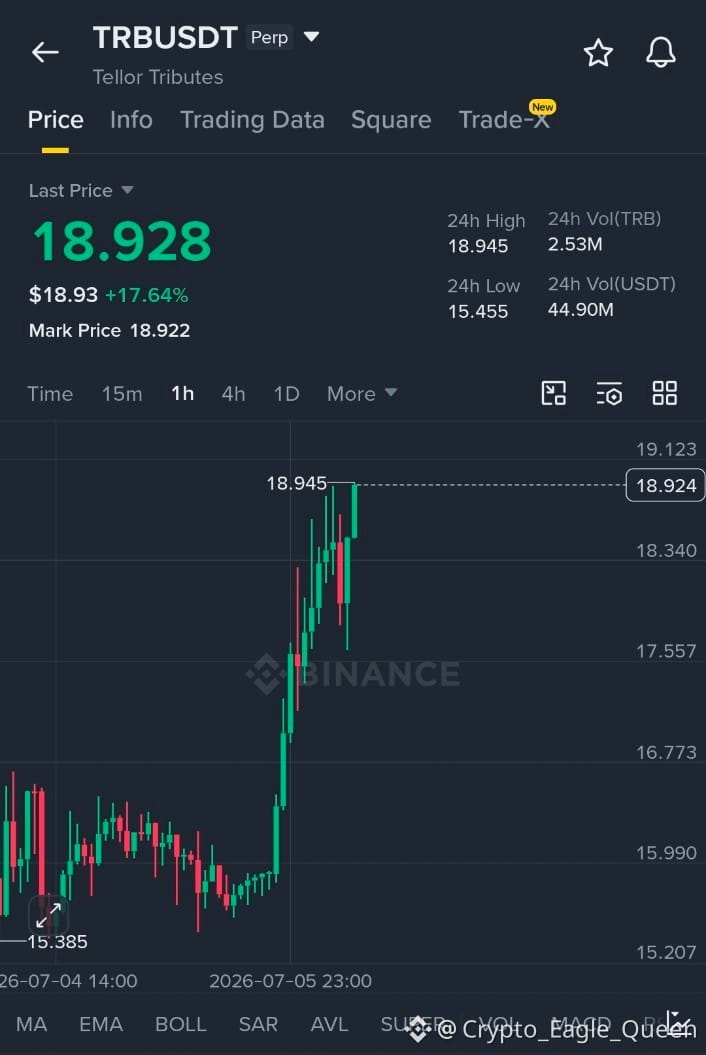
🦅 Market Story: What Is Happening Behind the Scenes of TRBUSDT?
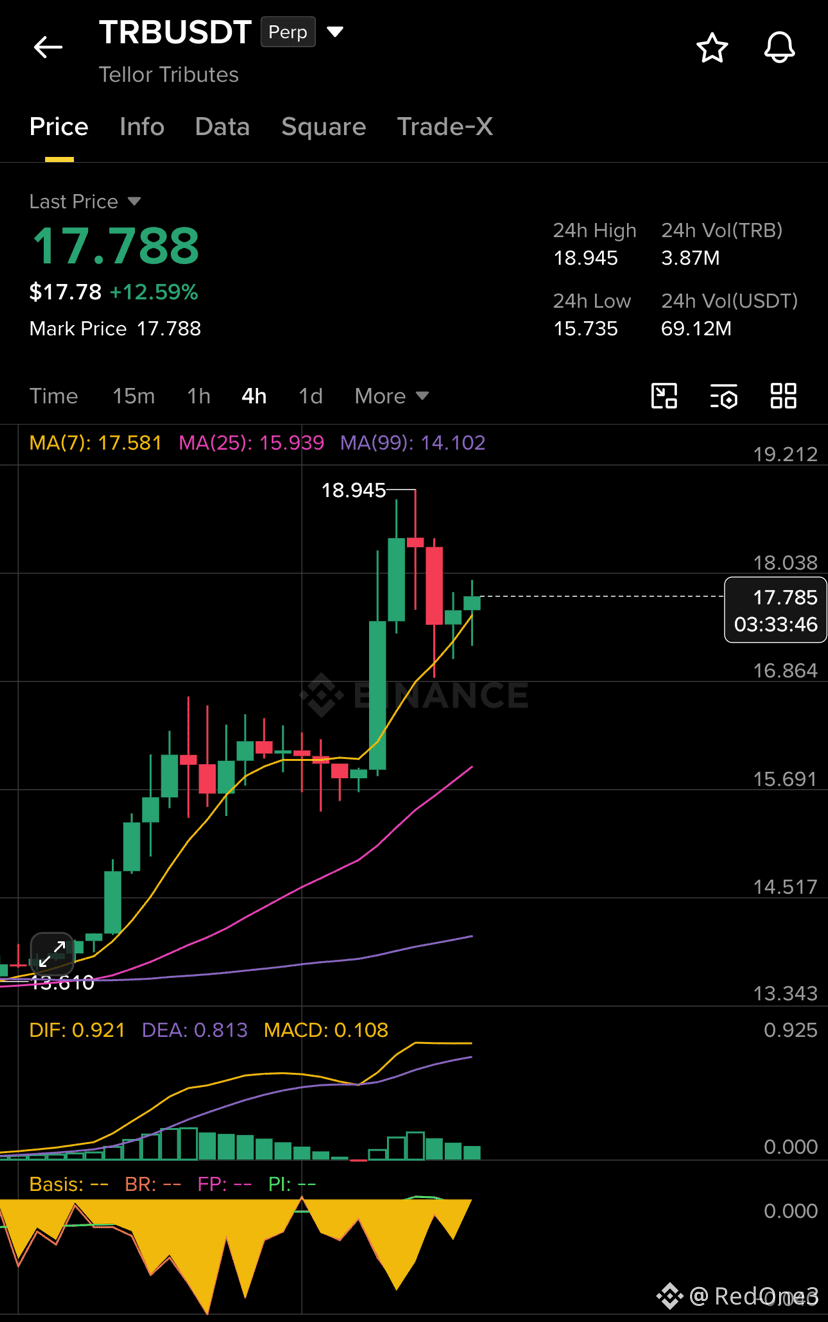
The asset is currently demonstrating notable strength around the $17.788 zone, printing a solid positive stride of (+12.59%).
Looking closely at the 4-hour chart in image_9.png, the price action tells an exciting tale of structural recovery and fresh buying interest breaking through previous consolidation layers.
The Journey From the Base to the Recent High:
After building a reliable foundation near its lower structural base of $13.610, the asset initiated a steady upward march, gathering significant momentum to test a prominent local peak at $18.945. Following that rapid expansion, a brief corrective phase kicked in as short-term traders locked in profits.
This healthy cool-off guided the price back to find dynamic defense, where it cleanly stabilized just above the recent low checkpoint of $15.735. The immediate recovery on the latest candles signals that the market is actively absorbing selling pressure, backed by a robust 24-hour trading volume of 69.12M USDT, confirming that substantial capital is participating in this ongoing trend shift.
The Upcoming Scenario in Plain Terms:
The market structure is currently shaping a high-stakes standoff within an optimal transitional window.
Buyers are demonstrating clear intent to reclaim absolute control, driving price action to challenge the immediate near-term resistance boundary around the $18.038 to $18.945 range. On the flip side, sellers are attempting to contain this push and force a retracement.
As long as the price remains firmly supported above the recent structural pivot floor of $15.735, market participants will likely keep their main focus on a potential breakout toward higher target ranges.
#DYOR 🚨
#TRBUSDT #Tellor $TRB
{future}(TRBUSDT)
🦅 Market Story: What Is Happening Behind the Scenes of TRBUSDT?
The asset is currently demonstrating notable strength around the $17.788 zone, printing a solid positive stride of (+12.59%).
Looking closely at the 4-hour chart in image_9.png, the price action tells an exciting tale of structural recovery and fresh buying interest breaking through previous consolidation layers.
The Journey From the Base to the Recent High:
After building a reliable foundation near its lower structural base of $13.610, the asset initiated a steady upward march, gathering significant momentum to test a prominent local peak at $18.945. Following that rapid expansion, a brief corrective phase kicked in as short-term traders locked in profits.
This healthy cool-off guided the price back to find dynamic defense, where it cleanly stabilized just above the recent low checkpoint of $15.735. The immediate recovery on the latest candles signals that the market is actively absorbing selling pressure, backed by a robust 24-hour trading volume of 69.12M USDT, confirming that substantial capital is participating in this ongoing trend shift.
The Upcoming Scenario in Plain Terms:
The market structure is currently shaping a high-stakes standoff within an optimal transitional window.
Buyers are demonstrating clear intent to reclaim absolute control, driving price action to challenge the immediate near-term resistance boundary around the $18.038 to $18.945 range. On the flip side, sellers are attempting to contain this push and force a retracement.
As long as the price remains firmly supported above the recent structural pivot floor of $15.735, market participants will likely keep their main focus on a potential breakout toward higher target ranges.
#DYOR 🚨
#TRBUSDT #Tellor $TRB
The asset is currently demonstrating notable strength around the $17.788 zone, printing a solid positive stride of (+12.59%).
Looking closely at the 4-hour chart in image_9.png, the price action tells an exciting tale of structural recovery and fresh buying interest breaking through previous consolidation layers.
The Journey From the Base to the Recent High:
After building a reliable foundation near its lower structural base of $13.610, the asset initiated a steady upward march, gathering significant momentum to test a prominent local peak at $18.945. Following that rapid expansion, a brief corrective phase kicked in as short-term traders locked in profits.
This healthy cool-off guided the price back to find dynamic defense, where it cleanly stabilized just above the recent low checkpoint of $15.735. The immediate recovery on the latest candles signals that the market is actively absorbing selling pressure, backed by a robust 24-hour trading volume of 69.12M USDT, confirming that substantial capital is participating in this ongoing trend shift.
The Upcoming Scenario in Plain Terms:
The market structure is currently shaping a high-stakes standoff within an optimal transitional window.
Buyers are demonstrating clear intent to reclaim absolute control, driving price action to challenge the immediate near-term resistance boundary around the $18.038 to $18.945 range. On the flip side, sellers are attempting to contain this push and force a retracement.
As long as the price remains firmly supported above the recent structural pivot floor of $15.735, market participants will likely keep their main focus on a potential breakout toward higher target ranges.
#DYOR 🚨
#TRBUSDT #Tellor $TRB
184

🚨 WHALES ARE DEFENDING THIS BREAKOUT DON'T MISS THE RETEST!
$TRB USDT is holding above its breakout zone after a strong rally. If buyers maintain control, another quick move higher is possible.
📈 #TRBUSDT LONG
Click below to Take Trade 👇
{future}(TRBUSDT)
📍 Entry: 18.80 – 18.95
🛑 Stop Loss: 17.64
🎯 TP1: 19.15
🎯 TP2: 19.45
🎯 TP3: 19.80
⚡ As long as TRB holds above 18.70, the bullish momentum remains valid. A clean break above 19.00 could attract fresh buyers.
#TRBUSDT #Bullish $TLM $LIT
🚨 WHALES ARE DEFENDING THIS BREAKOUT DON'T MISS THE RETEST!
$TRB USDT is holding above its breakout zone after a strong rally. If buyers maintain control, another quick move higher is possible.
📈 #TRBUSDT LONG
Click below to Take Trade 👇
📍 Entry: 18.80 – 18.95
🛑 Stop Loss: 17.64
🎯 TP1: 19.15
🎯 TP2: 19.45
🎯 TP3: 19.80
⚡ As long as TRB holds above 18.70, the bullish momentum remains valid. A clean break above 19.00 could attract fresh buyers.
#TRBUSDT #Bullish $TLM $LIT
$TRB USDT is holding above its breakout zone after a strong rally. If buyers maintain control, another quick move higher is possible.
📈 #TRBUSDT LONG
Click below to Take Trade 👇
📍 Entry: 18.80 – 18.95
🛑 Stop Loss: 17.64
🎯 TP1: 19.15
🎯 TP2: 19.45
🎯 TP3: 19.80
⚡ As long as TRB holds above 18.70, the bullish momentum remains valid. A clean break above 19.00 could attract fresh buyers.
#TRBUSDT #Bullish $TLM $LIT
1
227
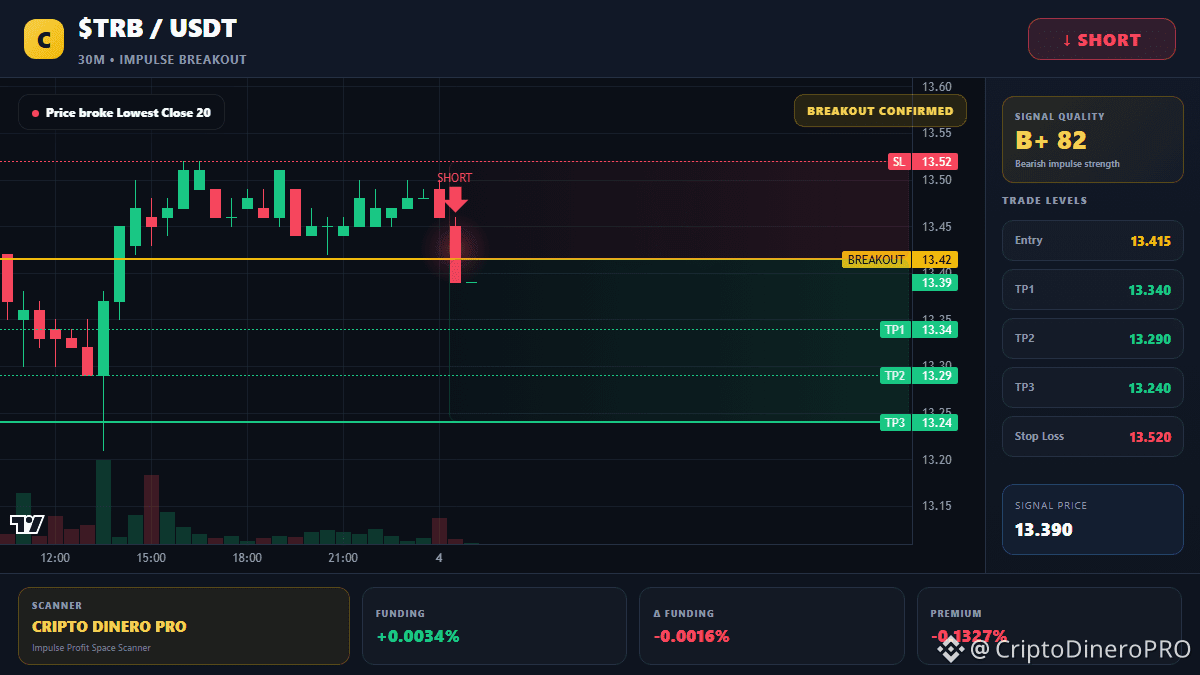
$TRB 🔴 Sell Entry zone 13.22532 - 12.966
🎯 TP1: 12.90117
🎯 TP2: 12.83634
🎯 TP3: 12.77151
🔴 StopLoss: 13.35498
🚀 Leverage: 5x to 10x
Sell Signal 15 Mins Alert for $TRB. Like, Share, Follow to stay updated. Adjust StopLoss and DYOR with proper risk management.
📊 AI Analysis: TRBUSDT sell signal has been identified with an entry zone between 13.22532 and 12.966. This 15-minute bearish setup targets a move toward the next support at 12.750, with immediate resistance at 13.100. Traders should watch for a decisive break below 12.900 to confirm downside continuation, while a reclaim of 13.250 would invalidate the short-term bearish bias.
#TRB #TRBUSDT
$TRB 🔴 Sell Entry zone 13.22532 - 12.966
🎯 TP1: 12.90117
🎯 TP2: 12.83634
🎯 TP3: 12.77151
🔴 StopLoss: 13.35498
🚀 Leverage: 5x to 10x
Sell Signal 15 Mins Alert for $TRB . Like, Share, Follow to stay updated. Adjust StopLoss and DYOR with proper risk management.
📊 AI Analysis: TRBUSDT sell signal has been identified with an entry zone between 13.22532 and 12.966. This 15-minute bearish setup targets a move toward the next support at 12.750, with immediate resistance at 13.100. Traders should watch for a decisive break below 12.900 to confirm downside continuation, while a reclaim of 13.250 would invalidate the short-term bearish bias.
#TRB #TRBUSDT
🎯 TP1: 12.90117
🎯 TP2: 12.83634
🎯 TP3: 12.77151
🔴 StopLoss: 13.35498
🚀 Leverage: 5x to 10x
Sell Signal 15 Mins Alert for $TRB . Like, Share, Follow to stay updated. Adjust StopLoss and DYOR with proper risk management.
📊 AI Analysis: TRBUSDT sell signal has been identified with an entry zone between 13.22532 and 12.966. This 15-minute bearish setup targets a move toward the next support at 12.750, with immediate resistance at 13.100. Traders should watch for a decisive break below 12.900 to confirm downside continuation, while a reclaim of 13.250 would invalidate the short-term bearish bias.
#TRB #TRBUSDT
14

·
--
Bullish
#TRBUSDT
➡️ Entry: 13.64
🎯 Target 1: 13.79 ✅
🎯 Target 2: 13.94 ✅
🎯 Target 3: 14.38
🎯 Target 4: 15.13
🛑 Stop loss 1: 13.33
🛑 Stop loss 2: 12.44
📊
$TRB
{future}(TRBUSDT)
#TRBUSDT
➡️ Entry: 13.64
🎯 Target 1: 13.79 ✅
🎯 Target 2: 13.94 ✅
🎯 Target 3: 14.38
🎯 Target 4: 15.13
🛑 Stop loss 1: 13.33
🛑 Stop loss 2: 12.44
📊
$TRB
➡️ Entry: 13.64
🎯 Target 1: 13.79 ✅
🎯 Target 2: 13.94 ✅
🎯 Target 3: 14.38
🎯 Target 4: 15.13
🛑 Stop loss 1: 13.33
🛑 Stop loss 2: 12.44
📊
$TRB
1
175
Log in to explore more content
Join global crypto users on Binance Square
⚡️ Get latest and useful information about crypto.
💬 Trusted by the world’s largest crypto exchange.
👍 Discover real insights from verified creators.
Email / Phone number
Trending Topics
1
#BitcoinFiveWeeklyLosses
171 views
86 Discussing
2
#AIChipSlumpNasdaq
24 views
50 Discussing
3
#BinanceReopensWithdrawalsForHYPE&APT
137,920 views
1,121 Discussing
4
#SouthKoreaDraftLawTargets15To20%ShareholderCap
138,658 views
746 Discussing
5
#TradFiForBeginners
214,955 views
1,975 Discussing
6
#KeplrAdvisesSocialLoginUsersToTransferAssets
65,447 views
566 Discussing
7
#TetherPlans€28.8MForJuventusCapitalIncrease
50,670 views
431 Discussing
8
#JobsReportRaisesHikeOdds
949,861 views
4,521 Discussing
9
#CPITestsDecemberRateOutlook
415,315 views
1,950 Discussing
10
#US Data Center Rules May Constrain AI Expansion
145,101 views
261 Discussing