
#shortsinyali
shortsinyali
0 views
3 Discussing
Hot
Latest

BTCUSDT 1H SHORT Signal: Downside Scenario with ATR-Based Levels | BTCUSDT 1H SHORT Signal: ATR-Based Levels for Downside Scenario
🇹🇷 TURKISH
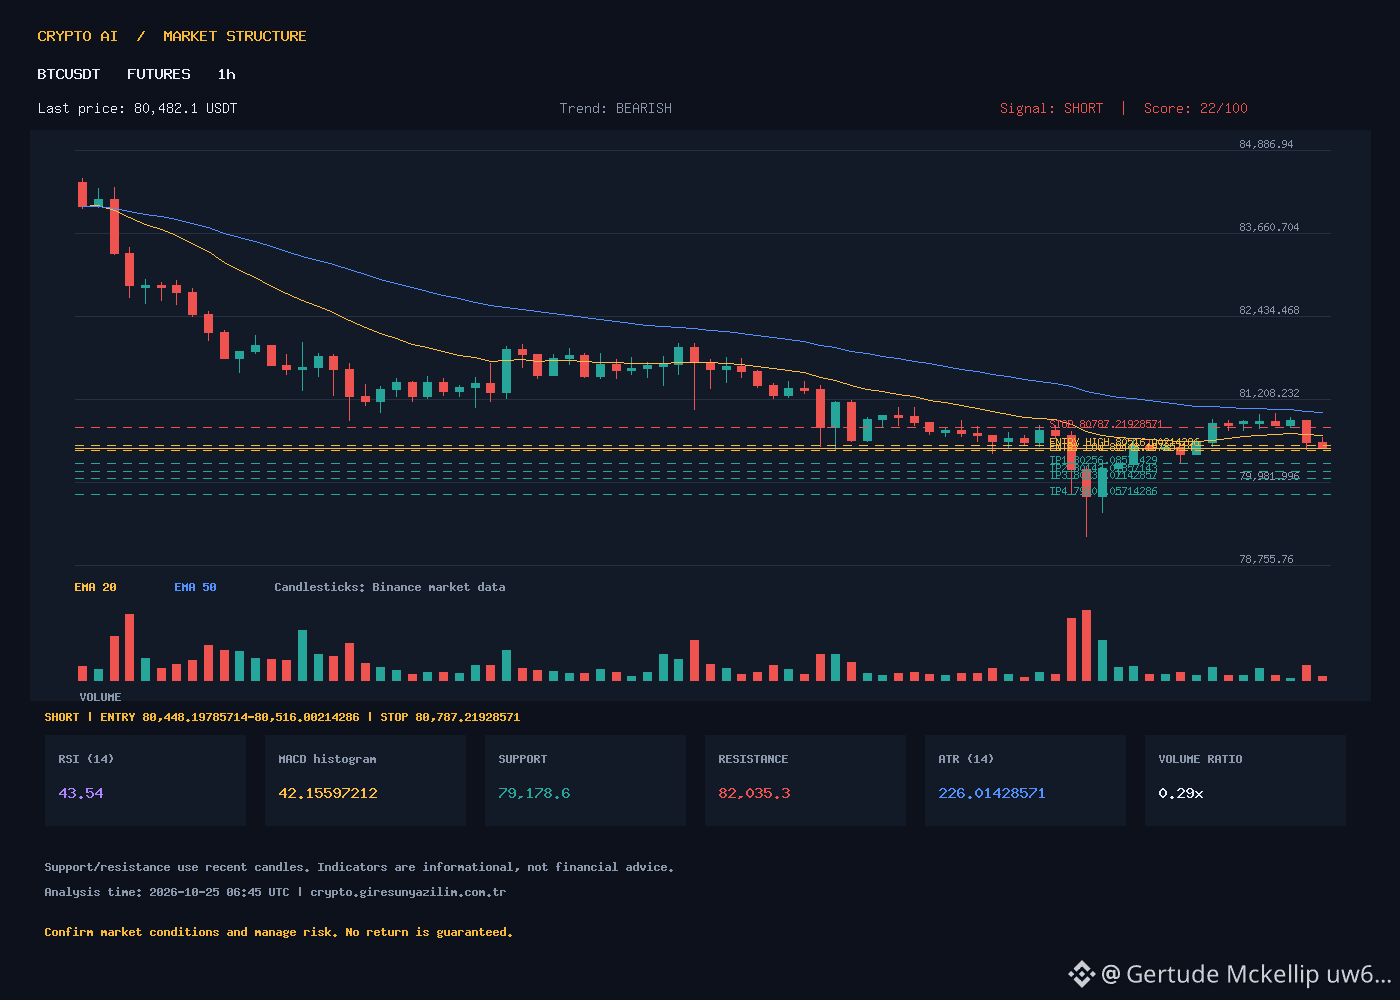
Analysis: BTCUSDT 1-hour chart shows a BEARISH trend, score 22/100. Current price is 80,482.1 USDT. RSI 43.54 (neutral-leaning), EMA20 (80,671) and EMA50 (80,973) are below the price, while EMA200 (81,615) is strong resistance. MACD histogram is positive (+42.16), but the MACD line is below the signal line. ATR 226. Volume is 29% of average (low). Support 79,178.6; resistance 82,035.3.
SHORT signal confirmed. ATR-based levels (not guaranteed):
Entry range: 80,448.20 – 80,516.00 (mid 80,482.10)
Stop-Loss: 80,787.22
TP1: 80,256.09
TP2: 80,143.08
TP3: 80,030.07
TP4: 79,804.06
Risk: Low volume and a positive MACD histogram create a risk of a short-term pullback. Adjust position size according to risk.
Discussion: Does it make sense to take a SHORT position in low volume, or should we wait for volume to increase?
🇬🇧 ENGLISH
Analysis: BTCUSDT 1H chart shows BEARISH trend, score 22/100. Current price 80,482.1 USDT. RSI 43.54 (neutral-leaning), EMA20 (80,671) and EMA50 (80,973) above price while EMA200 (81,615) acts as strong resistance. MACD histogram positive (+42.16) but MACD line below signal line. ATR 226. Volume at 29% of average (low). Support 79,178.6; resistance 82,035.3.
SHORT signal confirmed. ATR-based levels (not guaranteed):
Entry range: 80,448.20 – 80,516.00 (mid 80,482.10)
Stop-Loss: 80,787.22
TP1: 80,256.09
TP2: 80,143.08
TP3: 80,030.07
TP4: 79,804.06
Risk: Low volume and positive MACD histogram suggest short-term pullback risk. Size position according to risk tolerance.
Discussion: Is taking a SHORT in low volume sensible, or should we wait for volume expansion?
#BTCUSDT #Bitcoin #KriptoAnaliz #FuturesTrading #ShortSinyali
BTCUSDT 1H SHORT Signal: Downside Scenario with ATR-Based Levels | BTCUSDT 1H SHORT Signal: ATR-Based Levels for Downside Scenario
🇹🇷 TURKISH
Analysis: BTCUSDT 1-hour chart shows a BEARISH trend, score 22/100. Current price is 80,482.1 USDT. RSI 43.54 (neutral-leaning), EMA20 (80,671) and EMA50 (80,973) are below the price, while EMA200 (81,615) is strong resistance. MACD histogram is positive (+42.16), but the MACD line is below the signal line. ATR 226. Volume is 29% of average (low). Support 79,178.6; resistance 82,035.3.
SHORT signal confirmed. ATR-based levels (not guaranteed):
Entry range: 80,448.20 – 80,516.00 (mid 80,482.10)
Stop-Loss: 80,787.22
TP1: 80,256.09
TP2: 80,143.08
TP3: 80,030.07
TP4: 79,804.06
Risk: Low volume and a positive MACD histogram create a risk of a short-term pullback. Adjust position size according to risk.
Discussion: Does it make sense to take a SHORT position in low volume, or should we wait for volume to increase?
🇬🇧 ENGLISH
Analysis: BTCUSDT 1H chart shows BEARISH trend, score 22/100. Current price 80,482.1 USDT. RSI 43.54 (neutral-leaning), EMA20 (80,671) and EMA50 (80,973) above price while EMA200 (81,615) acts as strong resistance. MACD histogram positive (+42.16) but MACD line below signal line. ATR 226. Volume at 29% of average (low). Support 79,178.6; resistance 82,035.3.
SHORT signal confirmed. ATR-based levels (not guaranteed):
Entry range: 80,448.20 – 80,516.00 (mid 80,482.10)
Stop-Loss: 80,787.22
TP1: 80,256.09
TP2: 80,143.08
TP3: 80,030.07
TP4: 79,804.06
Risk: Low volume and positive MACD histogram suggest short-term pullback risk. Size position according to risk tolerance.
Discussion: Is taking a SHORT in low volume sensible, or should we wait for volume expansion?
#BTCUSDT #Bitcoin #KriptoAnaliz #FuturesTrading #ShortSinyali
🇹🇷 TURKISH
Analysis: BTCUSDT 1-hour chart shows a BEARISH trend, score 22/100. Current price is 80,482.1 USDT. RSI 43.54 (neutral-leaning), EMA20 (80,671) and EMA50 (80,973) are below the price, while EMA200 (81,615) is strong resistance. MACD histogram is positive (+42.16), but the MACD line is below the signal line. ATR 226. Volume is 29% of average (low). Support 79,178.6; resistance 82,035.3.
SHORT signal confirmed. ATR-based levels (not guaranteed):
Entry range: 80,448.20 – 80,516.00 (mid 80,482.10)
Stop-Loss: 80,787.22
TP1: 80,256.09
TP2: 80,143.08
TP3: 80,030.07
TP4: 79,804.06
Risk: Low volume and a positive MACD histogram create a risk of a short-term pullback. Adjust position size according to risk.
Discussion: Does it make sense to take a SHORT position in low volume, or should we wait for volume to increase?
🇬🇧 ENGLISH
Analysis: BTCUSDT 1H chart shows BEARISH trend, score 22/100. Current price 80,482.1 USDT. RSI 43.54 (neutral-leaning), EMA20 (80,671) and EMA50 (80,973) above price while EMA200 (81,615) acts as strong resistance. MACD histogram positive (+42.16) but MACD line below signal line. ATR 226. Volume at 29% of average (low). Support 79,178.6; resistance 82,035.3.
SHORT signal confirmed. ATR-based levels (not guaranteed):
Entry range: 80,448.20 – 80,516.00 (mid 80,482.10)
Stop-Loss: 80,787.22
TP1: 80,256.09
TP2: 80,143.08
TP3: 80,030.07
TP4: 79,804.06
Risk: Low volume and positive MACD histogram suggest short-term pullback risk. Size position according to risk tolerance.
Discussion: Is taking a SHORT in low volume sensible, or should we wait for volume expansion?
#BTCUSDT #Bitcoin #KriptoAnaliz #FuturesTrading #ShortSinyali
9
ETHUSDT 1H Short Position Signal | ETHUSDT 1H Short Signal
🇹🇷 TURKISH
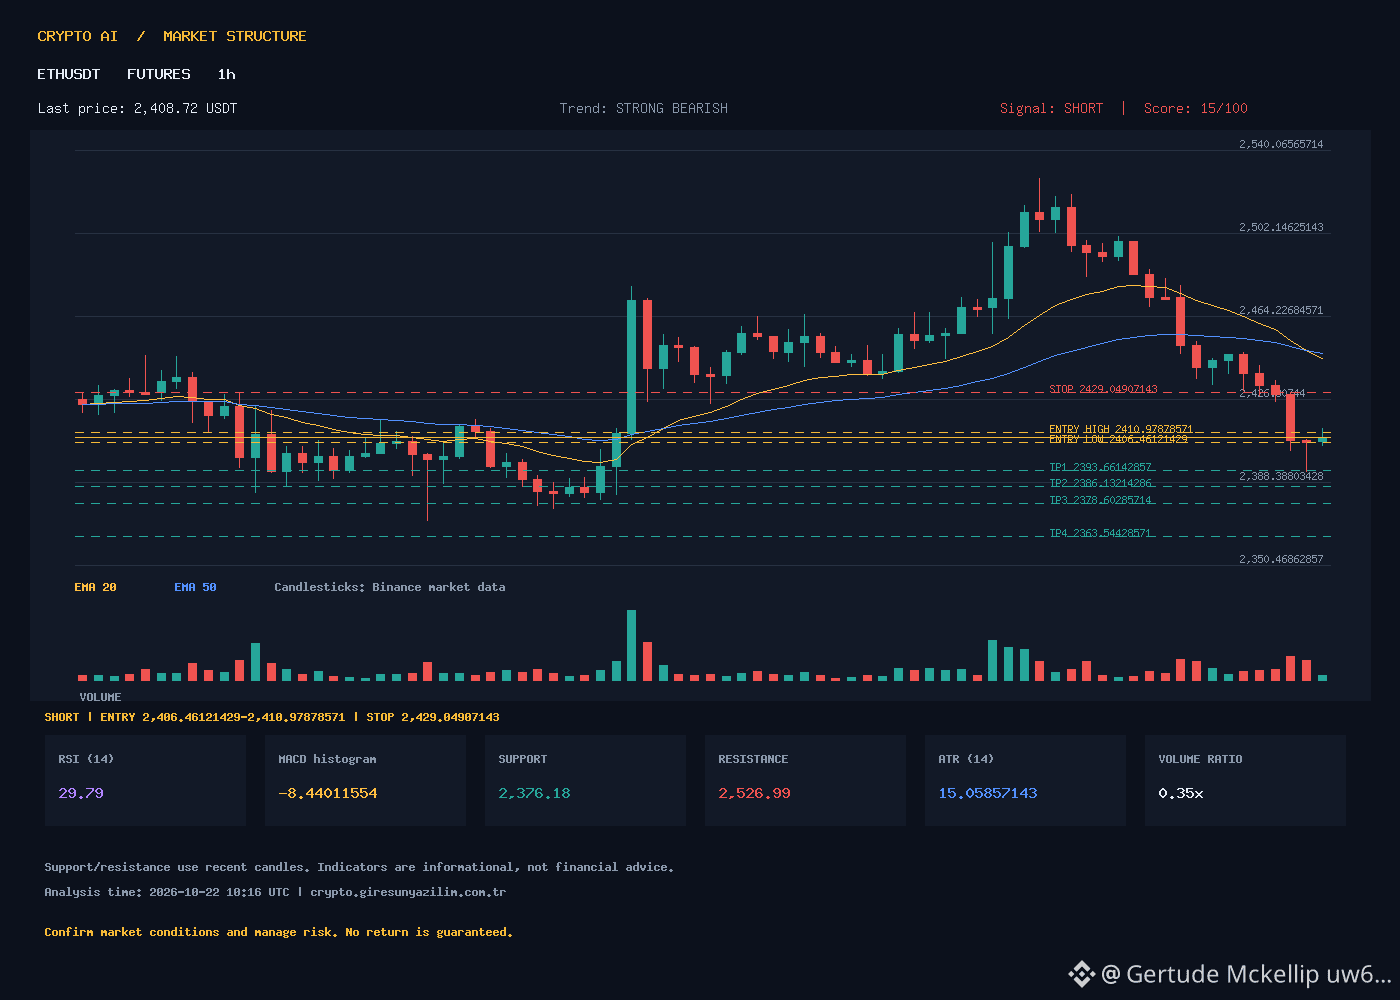
The STRONG BEARISH trend (score 15) continues on the ETHUSDT 1-hour chart. Price is 2408.72, below EMA20 (2444.85), EMA50 (2446.23), and EMA200 (2447.32). RSI is 29.79, in oversold territory, and the MACD histogram at -8.44 indicates strong negative momentum. ATR is 15.06, and volume is 35% of average (58.2K vs. 166K) – low liquidity. Support is 2376.18, resistance is 2526.99.
SHORT signal confirmed. ATR-based scenario levels (not guaranteed):
Entry range: 2406.46 – 2410.98
Stop-Loss: 2429.05
TP1: 2393.66 | TP2: 2386.13 | TP3: 2378.60 | TP4: 2363.54
Risk: RSI is near the bottom, so a technical bounce is possible; volume is low. Adjust position size according to ATR.
Discussion: When RSI drops below 30 into oversold territory, do you expect a short-term pullback, or do you trust the trend to continue?
🇬🇧 ENGLISH
ETHUSDT 1H shows a STRONG BEARISH trend (score 15). Price 2408.72 sits below EMA20 (2444.85), EMA50 (2446.23), EMA200 (2447.32). RSI 29.79 in oversold territory, MACD histogram -8.44 confirms strong negative momentum. ATR 15.06, volume only 35% of average (58.2K vs 166K) – thin liquidity. Support 2376.18, resistance 2526.99.
SHORT signal confirmed. ATR-based scenario levels (not guaranteed outcomes):
Entry range: 2406.46 – 2410.98
Stop-Loss: 2429.05
TP1: 2393.66 | TP2: 2386.13 | TP3: 2378.60 | TP4: 2363.54
Risk: RSI oversold bounce possible; low volume. Size position per ATR.
Discussion: When RSI drops below 30 in oversold conditions, do you anticipate a short-term pullback or trust the trend continuation?
#ETHUSDT #Ethereum #KriptoAnaliz #ShortSinyali #FuturesTrading
ETHUSDT 1H Short Position Signal | ETHUSDT 1H Short Signal
🇹🇷 TURKISH
The STRONG BEARISH trend (score 15) continues on the ETHUSDT 1-hour chart. Price is 2408.72, below EMA20 (2444.85), EMA50 (2446.23), and EMA200 (2447.32). RSI is 29.79, in oversold territory, and the MACD histogram at -8.44 indicates strong negative momentum. ATR is 15.06, and volume is 35% of average (58.2K vs. 166K) – low liquidity. Support is 2376.18, resistance is 2526.99.
SHORT signal confirmed. ATR-based scenario levels (not guaranteed):
Entry range: 2406.46 – 2410.98
Stop-Loss: 2429.05
TP1: 2393.66 | TP2: 2386.13 | TP3: 2378.60 | TP4: 2363.54
Risk: RSI is near the bottom, so a technical bounce is possible; volume is low. Adjust position size according to ATR.
Discussion: When RSI drops below 30 into oversold territory, do you expect a short-term pullback, or do you trust the trend to continue?
🇬🇧 ENGLISH
ETHUSDT 1H shows a STRONG BEARISH trend (score 15). Price 2408.72 sits below EMA20 (2444.85), EMA50 (2446.23), EMA200 (2447.32). RSI 29.79 in oversold territory, MACD histogram -8.44 confirms strong negative momentum. ATR 15.06, volume only 35% of average (58.2K vs 166K) – thin liquidity. Support 2376.18, resistance 2526.99.
SHORT signal confirmed. ATR-based scenario levels (not guaranteed outcomes):
Entry range: 2406.46 – 2410.98
Stop-Loss: 2429.05
TP1: 2393.66 | TP2: 2386.13 | TP3: 2378.60 | TP4: 2363.54
Risk: RSI oversold bounce possible; low volume. Size position per ATR.
Discussion: When RSI drops below 30 in oversold conditions, do you anticipate a short-term pullback or trust the trend continuation?
#ETHUSDT #Ethereum #KriptoAnaliz #ShortSinyali #FuturesTrading
🇹🇷 TURKISH
The STRONG BEARISH trend (score 15) continues on the ETHUSDT 1-hour chart. Price is 2408.72, below EMA20 (2444.85), EMA50 (2446.23), and EMA200 (2447.32). RSI is 29.79, in oversold territory, and the MACD histogram at -8.44 indicates strong negative momentum. ATR is 15.06, and volume is 35% of average (58.2K vs. 166K) – low liquidity. Support is 2376.18, resistance is 2526.99.
SHORT signal confirmed. ATR-based scenario levels (not guaranteed):
Entry range: 2406.46 – 2410.98
Stop-Loss: 2429.05
TP1: 2393.66 | TP2: 2386.13 | TP3: 2378.60 | TP4: 2363.54
Risk: RSI is near the bottom, so a technical bounce is possible; volume is low. Adjust position size according to ATR.
Discussion: When RSI drops below 30 into oversold territory, do you expect a short-term pullback, or do you trust the trend to continue?
🇬🇧 ENGLISH
ETHUSDT 1H shows a STRONG BEARISH trend (score 15). Price 2408.72 sits below EMA20 (2444.85), EMA50 (2446.23), EMA200 (2447.32). RSI 29.79 in oversold territory, MACD histogram -8.44 confirms strong negative momentum. ATR 15.06, volume only 35% of average (58.2K vs 166K) – thin liquidity. Support 2376.18, resistance 2526.99.
SHORT signal confirmed. ATR-based scenario levels (not guaranteed outcomes):
Entry range: 2406.46 – 2410.98
Stop-Loss: 2429.05
TP1: 2393.66 | TP2: 2386.13 | TP3: 2378.60 | TP4: 2363.54
Risk: RSI oversold bounce possible; low volume. Size position per ATR.
Discussion: When RSI drops below 30 in oversold conditions, do you anticipate a short-term pullback or trust the trend continuation?
#ETHUSDT #Ethereum #KriptoAnaliz #ShortSinyali #FuturesTrading
29
Log in to explore more content
Join global crypto users on Binance Square
⚡️ Get latest and useful information about crypto.
💬 Trusted by the world’s largest crypto exchange.
👍 Discover real insights from verified creators.
Email / Phone number
Trending Topics
1
#CanBTCReboundAfterFallingBelow60K?
0 views
72 Discussing
2
#GlobalStocksFaceLongestLosingStreakSince2023
0 views
243 Discussing
3
#AnthropicPlungesTowardIPOPriceonDay2
0 views
22 Discussing
4
#GaoTengBitcoinETFListsOnHKEX
0 views
242 Discussing
5
#TradFiForBeginners
946,825 views
5,488 Discussing
6
#NvidiaBoardReportedlySplitOverHuang’sReturn
258,674 views
2,378 Discussing
7
#TetherBurns8BillionUSDTInPast20Days
0 views
86 Discussing
8
#BitcoinWalletSignatureFlawExploitableWithinSeconds
0 views
38 Discussing
9
#CanGTA6'sLaunchLiftTTWOShares?
207,868 views
1,700 Discussing
10
#HongKongProposesSFCLicensingForFourVirtualAssetServices
404 views
32 Discussing