
#shareanttradetowin20u
shareanttradetowin20u
1,827 views
2 Discussing
Hot
Latest

·
--
Article
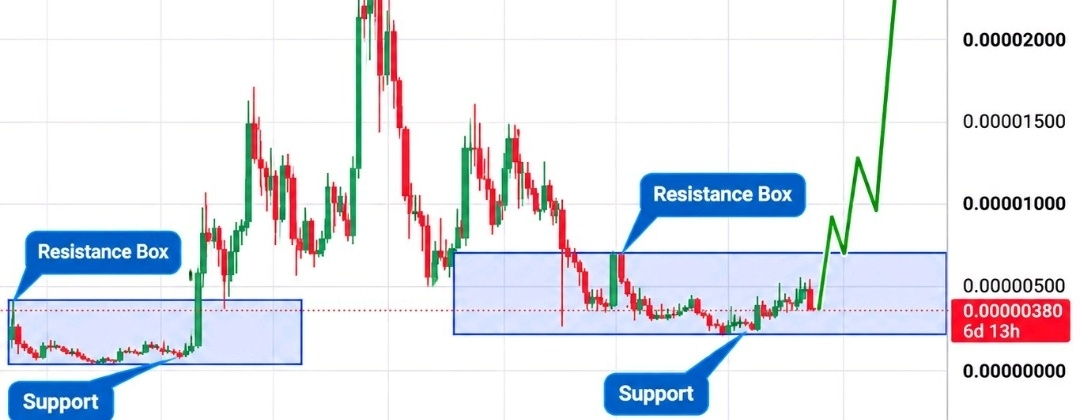
🐸🚀 $PEPE: LONG ACCUMULATION COULD SET THE STAGE FOR A BIG BREAKOUT!I'm watching closely because its weekly chart is showing an interesting structure. After a major rally and a long correction, PEPE has spent considerable time consolidating inside a broad accumulation range. 📊 CURRENT MARKET DATA 💰 Price: $0.00000380 📉 Weekly Change: -2.06% 🏦 Market Cap: Approximately $1.56 Billion (from supplied market data) 🔄 Circulating Supply: 413.77 Trillion PEPE 🪙 Total Supply: 413.77 Trillion PEPE 📈 Previous All-Time High: $0.00002841 📍 KEY TECHNICAL LEVELS 🟢 Support Zone: $0.0000025–$0.0000035 🔵 Resistance Zone: $0.0000060–$0.0000070 🎯 POTENTIAL TAKE-PROFIT TARGETS 🥇 TP1: $0.0000070 🥈 TP2: $0.0000100 🥉 TP3: $0.0000150 🚀 Final Target: $0.0000284–$0.0000330 🔥 WHAT COULD HAPPEN NEXT? If PEPE continues holding its support zone, buyers could gradually build momentum toward the resistance box. A strong weekly breakout above $0.0000070, supported by rising volume, could open the door toward the next targets. The previous all-time high near $0.0000284 is an important long-term level to watch. A $100 billion market cap remains an ambitious possibility, but it would require extraordinary growth and is not a near-term expectation. ⚠️ RISK MANAGEMENT: A weekly breakdown below
{spot}(PEPEUSDT)
support could invalidate this bullish setup. These targets are technical scenarios, not guaranteed outcomes. 🐸 Do you think PEPE can reclaim its previous all-time high? #ShareANTTradeToWin20U $PEPE
🐸🚀 $PEPE: LONG ACCUMULATION COULD SET THE STAGE FOR A BIG BREAKOUT!
I'm watching closely because its weekly chart is showing an interesting structure. After a major rally and a long correction, PEPE has spent considerable time consolidating inside a broad accumulation range. 📊 CURRENT MARKET DATA 💰 Price: $0.00000380 📉 Weekly Change: -2.06% 🏦 Market Cap: Approximately $1.56 Billion (from supplied market data) 🔄 Circulating Supply: 413.77 Trillion PEPE 🪙 Total Supply: 413.77 Trillion PEPE 📈 Previous All-Time High: $0.00002841 📍 KEY TECHNICAL LEVELS 🟢 Support Zone: $0.0000025–$0.0000035 🔵 Resistance Zone: $0.0000060–$0.0000070 🎯 POTENTIAL TAKE-PROFIT TARGETS 🥇 TP1: $0.0000070 🥈 TP2: $0.0000100 🥉 TP3: $0.0000150 🚀 Final Target: $0.0000284–$0.0000330 🔥 WHAT COULD HAPPEN NEXT? If PEPE continues holding its support zone, buyers could gradually build momentum toward the resistance box. A strong weekly breakout above $0.0000070, supported by rising volume, could open the door toward the next targets. The previous all-time high near $0.0000284 is an important long-term level to watch. A $100 billion market cap remains an ambitious possibility, but it would require extraordinary growth and is not a near-term expectation. ⚠️ RISK MANAGEMENT: A weekly breakdown below
support could invalidate this bullish setup. These targets are technical scenarios, not guaranteed outcomes. 🐸 Do you think PEPE can reclaim its previous all-time high? #ShareANTTradeToWin20U $PEPE
support could invalidate this bullish setup. These targets are technical scenarios, not guaranteed outcomes. 🐸 Do you think PEPE can reclaim its previous all-time high? #ShareANTTradeToWin20U $PEPE
1
5
5.6k
Log in to explore more content
Join global crypto users on Binance Square
⚡️ Get latest and useful information about crypto.
💬 Trusted by the world’s largest crypto exchange.
👍 Discover real insights from verified creators.
Email / Phone number
Trending Topics
1
#IsAnthropic’s$1.5TMarketCapJustified?
52,636 views
260 Discussing
2
#BTCBelow$62KAmidHikeFearsAndShiftToAnthropic
11,702 views
82 Discussing
3
#NvidiaBoardReportedlySplitOverHuang’sReturn
226,670 views
1,818 Discussing
4
#CanGTA6'sLaunchLiftTTWOShares?
181,295 views
1,302 Discussing
5
#BlackRockBitcoinETFRecordsLargestDailyOutflow
6,008 views
93 Discussing
6
#LedgerProbesTamperedWalletsInBerlinAndDubai
18,483 views
257 Discussing
7
#13FInstitutionsBitcoinSpotETPHoldingsHitRecord
33,143 views
316 Discussing
8
#BTCRemainsUnderPressureAfterHawkishFOMCMinutes
395,194 views
2,566 Discussing
9
#StrategySTRCPreferredSlips3.65%Below$100Par
13,580 views
99 Discussing
10
#MASToUpgradeSGDTestnetToSGDigitalLedger
54,750 views
481 Discussing