
#pricehistory
pricehistory
26,282 views
25 Discussing
Hot
Latest

ATH and ATL: Two Different Market Perspectives
SHELL's historical price extremes provide useful context for understanding its volatility.
Available market-history trackers place its all-time high near $0.6834 on 27 February 2025 and its all-time low around $0.01746 on 29 July 2026.
In snapshots from 6–7 November 2026, the token was reported around $0.02095–0.02106.
Being closer to the ATL than the ATH describes historical positioning. It does not establish whether the next move will be upward or downward.
#SHELL #PriceHistory #RiskManagement
ATH and ATL: Two Different Market Perspectives
SHELL's historical price extremes provide useful context for understanding its volatility.
Available market-history trackers place its all-time high near $0.6834 on 27 February 2025 and its all-time low around $0.01746 on 29 July 2026.
In snapshots from 6–7 November 2026, the token was reported around $0.02095–0.02106.
Being closer to the ATL than the ATH describes historical positioning. It does not establish whether the next move will be upward or downward.
#SHELL #PriceHistory #RiskManagement
SHELL's historical price extremes provide useful context for understanding its volatility.
Available market-history trackers place its all-time high near $0.6834 on 27 February 2025 and its all-time low around $0.01746 on 29 July 2026.
In snapshots from 6–7 November 2026, the token was reported around $0.02095–0.02106.
Being closer to the ATL than the ATH describes historical positioning. It does not establish whether the next move will be upward or downward.
#SHELL #PriceHistory #RiskManagement
2
How Close Is SHELL to Its Historical Low?
Market-history trackers place SHELL's all-time low at approximately $0.0175, recorded on 29 July 2026.
During the 5–6 November reporting window, several sources showed prices around $0.0203–$0.0204.
This puts the token relatively close to its historical low compared with its previous trading range.
Historical lows provide context, not a guarantee of support or an automatic buying opportunity.
#SHELL #PriceHistory #MarketContext
How Close Is SHELL to Its Historical Low?
Market-history trackers place SHELL's all-time low at approximately $0.0175, recorded on 29 July 2026.
During the 5–6 November reporting window, several sources showed prices around $0.0203–$0.0204.
This puts the token relatively close to its historical low compared with its previous trading range.
Historical lows provide context, not a guarantee of support or an automatic buying opportunity.
#SHELL #PriceHistory #MarketContext
Market-history trackers place SHELL's all-time low at approximately $0.0175, recorded on 29 July 2026.
During the 5–6 November reporting window, several sources showed prices around $0.0203–$0.0204.
This puts the token relatively close to its historical low compared with its previous trading range.
Historical lows provide context, not a guarantee of support or an automatic buying opportunity.
#SHELL #PriceHistory #MarketContext
51
$SHELL | What an All-Time-High Drawdown Can—and Cannot—Tell Us
The research report placed the historical all-time high near $0.68–$0.73 in February 2025, while recent price snapshots were around 0.022. It also cited a possible all-time low near 0.0175 in July 2026. These historical levels should be checked against the same data provider before being used for precise comparisons, because exchanges and aggregators can report different extremes.
Even using the approximate figures, the distance from the previous high is substantial. A token trading around 0.022 is roughly 97% below a peak near 0.70.
A drawdown of this size provides important historical context. It shows how much market value has been lost relative to the previous peak, and it reminds investors that early rallies do not guarantee long-term price stability.
But there is a common analytical mistake: assuming that an asset must return to its all-time high simply because it once traded there. A previous peak is not a valuation floor or a guaranteed future target. Market conditions, liquidity, token supply, demand and project execution may all change over time.
The same caution applies in the opposite direction. A large drawdown does not prove that further declines are impossible, nor does it prove that recovery is impossible.
Historical highs and lows are reference points. They become more useful when combined with current market structure, supply data and evidence of sustained demand.
#PriceHistory #Drawdown #CryptoCycles Tokenomics MarketContext
$SHELL | What an All-Time-High Drawdown Can—and Cannot—Tell Us
The research report placed the historical all-time high near $0.68–$0.73 in February 2025, while recent price snapshots were around 0.022. It also cited a possible all-time low near 0.0175 in July 2026. These historical levels should be checked against the same data provider before being used for precise comparisons, because exchanges and aggregators can report different extremes.
Even using the approximate figures, the distance from the previous high is substantial. A token trading around 0.022 is roughly 97% below a peak near 0.70.
A drawdown of this size provides important historical context. It shows how much market value has been lost relative to the previous peak, and it reminds investors that early rallies do not guarantee long-term price stability.
But there is a common analytical mistake: assuming that an asset must return to its all-time high simply because it once traded there. A previous peak is not a valuation floor or a guaranteed future target. Market conditions, liquidity, token supply, demand and project execution may all change over time.
The same caution applies in the opposite direction. A large drawdown does not prove that further declines are impossible, nor does it prove that recovery is impossible.
Historical highs and lows are reference points. They become more useful when combined with current market structure, supply data and evidence of sustained demand.
#PriceHistory #Drawdown #CryptoCycles Tokenomics MarketContext
The research report placed the historical all-time high near $0.68–$0.73 in February 2025, while recent price snapshots were around 0.022. It also cited a possible all-time low near 0.0175 in July 2026. These historical levels should be checked against the same data provider before being used for precise comparisons, because exchanges and aggregators can report different extremes.
Even using the approximate figures, the distance from the previous high is substantial. A token trading around 0.022 is roughly 97% below a peak near 0.70.
A drawdown of this size provides important historical context. It shows how much market value has been lost relative to the previous peak, and it reminds investors that early rallies do not guarantee long-term price stability.
But there is a common analytical mistake: assuming that an asset must return to its all-time high simply because it once traded there. A previous peak is not a valuation floor or a guaranteed future target. Market conditions, liquidity, token supply, demand and project execution may all change over time.
The same caution applies in the opposite direction. A large drawdown does not prove that further declines are impossible, nor does it prove that recovery is impossible.
Historical highs and lows are reference points. They become more useful when combined with current market structure, supply data and evidence of sustained demand.
#PriceHistory #Drawdown #CryptoCycles Tokenomics MarketContext

29

·
--
$BTC JULY 4TH HISTORY SHOWS A CLEAR PATTERN — WHAT COMES NEXT 🔥
Body:
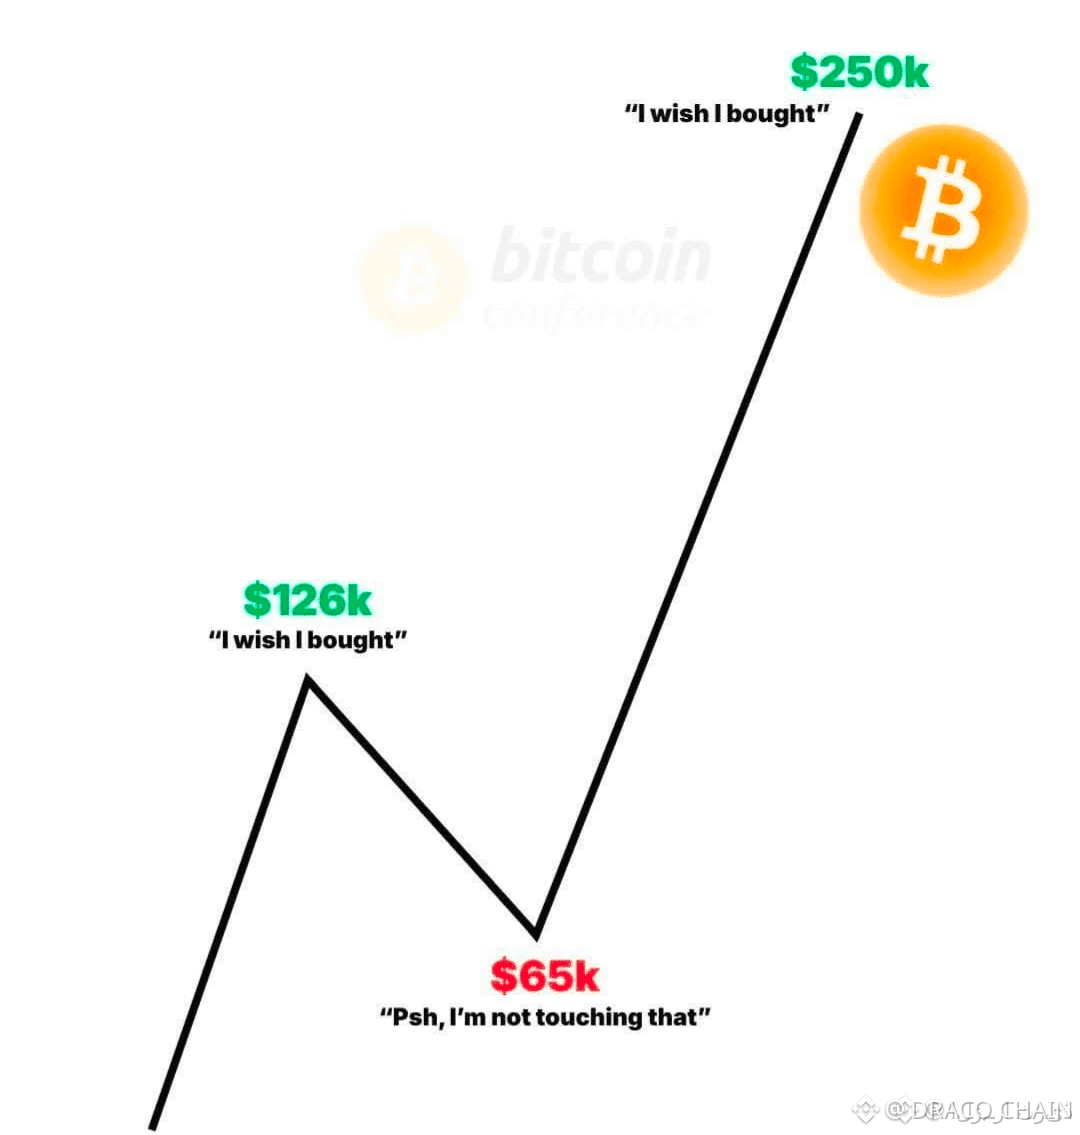
The data is undeniable. Every July 4th since 2016 has painted a distinct chapter in $BTC ’s long-term uptrend — from $683 to $108,000 in 2025. The pullback to $62,000 in 2026 is simply another reset within a larger cycle. Short-term volatility is noise; the structural trend remains intact.
Volume has been drying up on the daily, suggesting a compression phase before the next directional move. If this pattern holds, we could see another leg higher into next year’s July 4th.
Where do you see $BTC on July 4, 2026?
Not financial advice. Always manage your risk.
#BTC #Bitcoin #PriceHistory #July4th #Crypto
🔥
$BTC JULY 4TH HISTORY SHOWS A CLEAR PATTERN — WHAT COMES NEXT 🔥
Body:
The data is undeniable. Every July 4th since 2016 has painted a distinct chapter in $BTC ’s long-term uptrend — from $683 to $108,000 in 2025. The pullback to $62,000 in 2026 is simply another reset within a larger cycle. Short-term volatility is noise; the structural trend remains intact.
Volume has been drying up on the daily, suggesting a compression phase before the next directional move. If this pattern holds, we could see another leg higher into next year’s July 4th.
Where do you see $BTC on July 4, 2026?
Not financial advice. Always manage your risk.
#BTC #Bitcoin #PriceHistory #July4th #Crypto
🔥
Body:
The data is undeniable. Every July 4th since 2016 has painted a distinct chapter in $BTC ’s long-term uptrend — from $683 to $108,000 in 2025. The pullback to $62,000 in 2026 is simply another reset within a larger cycle. Short-term volatility is noise; the structural trend remains intact.
Volume has been drying up on the daily, suggesting a compression phase before the next directional move. If this pattern holds, we could see another leg higher into next year’s July 4th.
Where do you see $BTC on July 4, 2026?
Not financial advice. Always manage your risk.
#BTC #Bitcoin #PriceHistory #July4th #Crypto
🔥
55

·
--
🚨🟡 TRB Price History – From $1 to $600+! 💰📈
Tellor ($TRB) is one of the most volatile & profitable crypto coins in history. 🟡💎
📊 TRB Price Highlights:
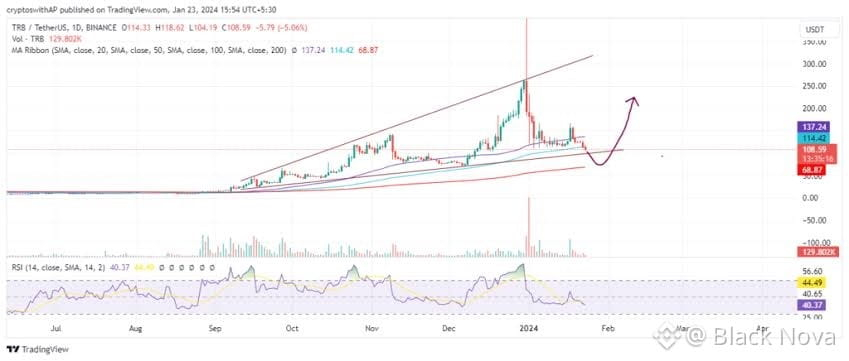
💥 All-Time High (ATH): ~$603 (Dec 2023) 🚀🔥
📉 All-Time Low (ATL): ~$1.10 (Nov 2019) ⚡💸
📅 Yearly Trends:
• 2020: TRB started gaining attention 💹
• 2021: Strong growth & first big gains 💎
• 2023: MASSIVE RALLY → +1400% gain 😱🚀
• 2024–2025: Correction after peak, still higher than early levels 📉🟢
• 2026: Trading around $14–$20 💰💎
💡 Why TRB is Interesting:
✅ Huge profit potential 🚀
✅ Big swings for traders 🎢
✅ Still far above its early lows ⚡
Even though TRB isn’t at its ATH anymore, its history proves it can explode when momentum hits 🔥🟡
Are you holding TRB or waiting for the next big move? 👀💰
#TRB #CryptoTrading #Tellor #PriceHistory #CryptoGains
🚨🟡 TRB Price History – From $1 to $600+! 💰📈
Tellor ($TRB) is one of the most volatile & profitable crypto coins in history. 🟡💎
📊 TRB Price Highlights:
💥 All-Time High (ATH): ~$603 (Dec 2023) 🚀🔥
📉 All-Time Low (ATL): ~$1.10 (Nov 2019) ⚡💸
📅 Yearly Trends:
• 2020: TRB started gaining attention 💹
• 2021: Strong growth & first big gains 💎
• 2023: MASSIVE RALLY → +1400% gain 😱🚀
• 2024–2025: Correction after peak, still higher than early levels 📉🟢
• 2026: Trading around $14–$20 💰💎
💡 Why TRB is Interesting:
✅ Huge profit potential 🚀
✅ Big swings for traders 🎢
✅ Still far above its early lows ⚡
Even though TRB isn’t at its ATH anymore, its history proves it can explode when momentum hits 🔥🟡
Are you holding TRB or waiting for the next big move? 👀💰
#TRB #CryptoTrading #Tellor #PriceHistory #CryptoGains
Tellor ($TRB) is one of the most volatile & profitable crypto coins in history. 🟡💎
📊 TRB Price Highlights:
💥 All-Time High (ATH): ~$603 (Dec 2023) 🚀🔥
📉 All-Time Low (ATL): ~$1.10 (Nov 2019) ⚡💸
📅 Yearly Trends:
• 2020: TRB started gaining attention 💹
• 2021: Strong growth & first big gains 💎
• 2023: MASSIVE RALLY → +1400% gain 😱🚀
• 2024–2025: Correction after peak, still higher than early levels 📉🟢
• 2026: Trading around $14–$20 💰💎
💡 Why TRB is Interesting:
✅ Huge profit potential 🚀
✅ Big swings for traders 🎢
✅ Still far above its early lows ⚡
Even though TRB isn’t at its ATH anymore, its history proves it can explode when momentum hits 🔥🟡
Are you holding TRB or waiting for the next big move? 👀💰
#TRB #CryptoTrading #Tellor #PriceHistory #CryptoGains

1
2
1.7k

·
--
SOLANA PRICE HISTORY $SOL
#PriceHistory
{spot}(SOLUSDT)
🧶 2020 ➡️ Launched $0.22
🧶 2021 ➡️ $215
🧶 2022 ➡️ $10
🧶 2023 ➡️ $132
🧶 2024 ➡️ $200
🧶 2025 ➡️ $295 (New all time high)
🧶 2026 ➡️ $91
SOLANA PRICE HISTORY $SOL
#PriceHistory
🧶 2020 ➡️ Launched $0.22
🧶 2021 ➡️ $215
🧶 2022 ➡️ $10
🧶 2023 ➡️ $132
🧶 2024 ➡️ $200
🧶 2025 ➡️ $295 (New all time high)
🧶 2026 ➡️ $91
#PriceHistory
🧶 2020 ➡️ Launched $0.22
🧶 2021 ➡️ $215
🧶 2022 ➡️ $10
🧶 2023 ➡️ $132
🧶 2024 ➡️ $200
🧶 2025 ➡️ $295 (New all time high)
🧶 2026 ➡️ $91

105

price held the support
If we close 4h/1d above 75.9k--76.2k
We can recover till 77.7k--78.5k
Quick
We'll decide to take partial profit if we reach there becz we saw multiple rejections from these zones
And to considor move above 80k to 82k we need strong hourly and 4h candle to close above 77.9k to break local highs to fill the old gap nd take liquidations
Alhamdulillah we held the shake out and manipulation.
And rest other trades are active with btc too till we dont close btc..
#PriceHistory
$BTC
{spot}(BTCUSDT)
price held the support
If we close 4h/1d above 75.9k--76.2k
We can recover till 77.7k--78.5k
Quick
We'll decide to take partial profit if we reach there becz we saw multiple rejections from these zones
And to considor move above 80k to 82k we need strong hourly and 4h candle to close above 77.9k to break local highs to fill the old gap nd take liquidations
Alhamdulillah we held the shake out and manipulation.
And rest other trades are active with btc too till we dont close btc..
#PriceHistory
$BTC
If we close 4h/1d above 75.9k--76.2k
We can recover till 77.7k--78.5k
Quick
We'll decide to take partial profit if we reach there becz we saw multiple rejections from these zones
And to considor move above 80k to 82k we need strong hourly and 4h candle to close above 77.9k to break local highs to fill the old gap nd take liquidations
Alhamdulillah we held the shake out and manipulation.
And rest other trades are active with btc too till we dont close btc..
#PriceHistory
$BTC
1
88

·
--
Bullish
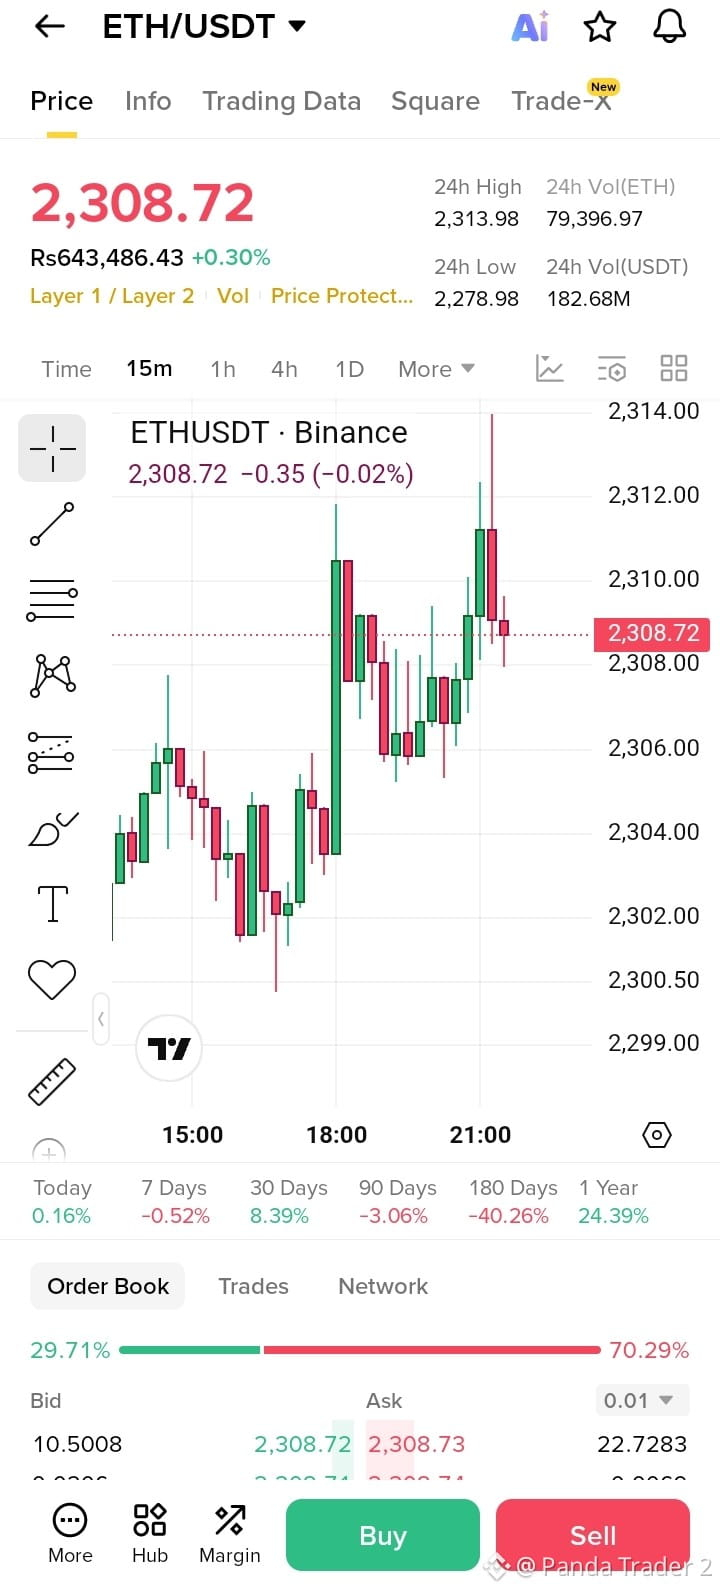
#🚀 $ETH Price Journey (2015 → 2026)
From almost nothing to a global financial asset — Ethereum’s story is pure evolution.
2015 → $0.30
2016 → $8
2017 → $1,400
2018 → $80
2019 → $140
2020 → $700
2021 → $4,800
2022 → $1,100
2023 → $2,200
2024 → $3,500 – $6,000
2025 → $2,800 – $7,000 range
2026 → $3,000 – $8,000+ (cycle dependent)
📊 Every cycle tells the same story: volatility first, expansion later.
ETH isn’t just price action — it’s adoption, infrastructure, and liquidity building over time.
#Ethereum #ETH #Crypto #Blockchain #PriceHistory $ETH
{future}(ETHUSDT)
#🚀 $ETH Price Journey (2015 → 2026)
From almost nothing to a global financial asset — Ethereum’s story is pure evolution.
2015 → $0.30
2016 → $8
2017 → $1,400
2018 → $80
2019 → $140
2020 → $700
2021 → $4,800
2022 → $1,100
2023 → $2,200
2024 → $3,500 – $6,000
2025 → $2,800 – $7,000 range
2026 → $3,000 – $8,000+ (cycle dependent)
📊 Every cycle tells the same story: volatility first, expansion later.
ETH isn’t just price action — it’s adoption, infrastructure, and liquidity building over time.
#Ethereum #ETH #Crypto #Blockchain #PriceHistory $ETH
From almost nothing to a global financial asset — Ethereum’s story is pure evolution.
2015 → $0.30
2016 → $8
2017 → $1,400
2018 → $80
2019 → $140
2020 → $700
2021 → $4,800
2022 → $1,100
2023 → $2,200
2024 → $3,500 – $6,000
2025 → $2,800 – $7,000 range
2026 → $3,000 – $8,000+ (cycle dependent)
📊 Every cycle tells the same story: volatility first, expansion later.
ETH isn’t just price action — it’s adoption, infrastructure, and liquidity building over time.
#Ethereum #ETH #Crypto #Blockchain #PriceHistory $ETH
6
Log in to explore more content
Join global crypto users on Binance Square
⚡️ Get latest and useful information about crypto.
💬 Trusted by the world’s largest crypto exchange.
👍 Discover real insights from verified creators.
Email / Phone number
Trending Topics
1
#KeplrAdvisesSocialLoginUsersToTransferAssets
1,126 views
63 Discussing
2
#TetherPlans€28.8MForJuventusCapitalIncrease
1,051 views
60 Discussing
3
#JobsReportRaisesHikeOdds
634,055 views
3,907 Discussing
4
#CPITestsDecemberRateOutlook
214,437 views
1,511 Discussing
5
#US Data Center Rules May Constrain AI Expansion
88,605 views
245 Discussing
6
#ARKPlans14ThematicETFsCoveringAIAndTokenizedMarkets
5,580 views
79 Discussing
7
#WillAnthropicListOnTime
199,571 views
1,652 Discussing
8
#WillUS-IranTensionsBoostSafe-HavenDemand?
104,828 views
722 Discussing
9
#BitcoinETFsSee$412MNetOutflows
19,453 views
84 Discussing
10
#HKSFCPlansToRestrictCryptoAndExchangeTerms
82,768 views
693 Discussing