
#nextbullrun
nextbullrun
807,499 views
633 Discussing
Hot
Latest


·
--
🚨 The US is paying more in interest on its debt than it spends on defense.
Think about that. Over $1.2 TRILLION every year just to service debt. And the problem is accelerating.
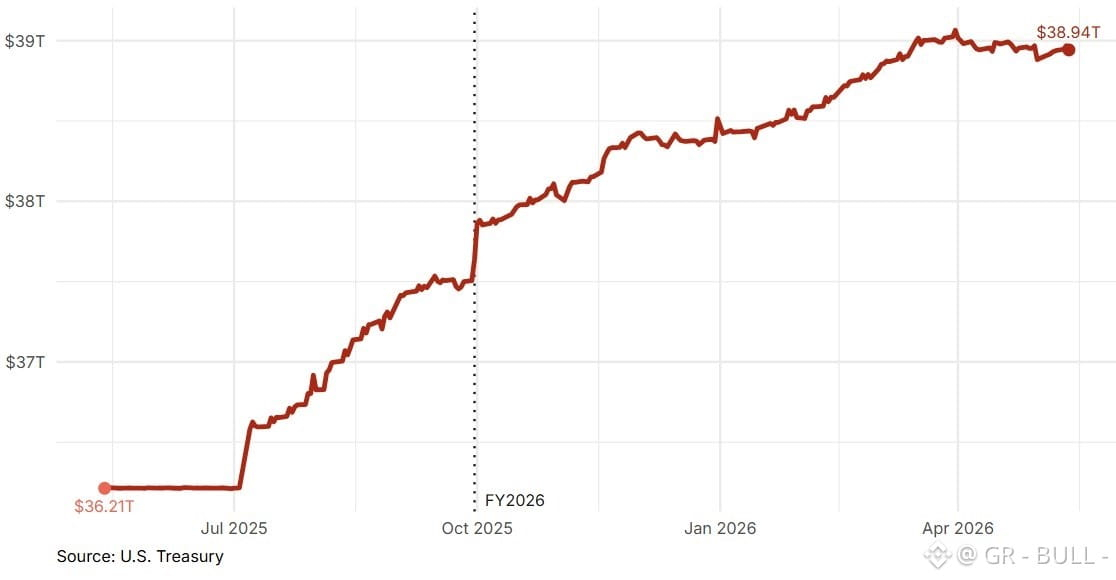
💥 The US now carries $39 TRILLION in debt, with $9 trillion coming due this year alone. Most of that debt was borrowed when rates were near zero. Now, it’s being rolled over at much higher yields—meaning the cost of keeping the system afloat skyrockets every year.
This is why bond markets are suddenly center stage. The entire economy became addicted to cheap money: governments, companies, consumers—all borrowed aggressively. And now, with rates staying high, the math starts to break.
Every time the system has faced stress, the Fed has responded the same way:
2008: Money printing.
2020: Even more money printing.
In 2020 alone, the Fed added $3 TRILLION to its balance sheet within months to stop markets from freezing.
But this time? The debt is dramatically larger. The next round of intervention could be unprecedented in scale.
🔥 If yields keep rising while debt explodes, the Fed may have no choice but to print at levels the world has never seen before.
And this is exactly when the next big bull run will ignite.
💣 The math is breaking. The stage is set. History is about to repeat—on a scale bigger than ever.
#DebtCrisis
#BondMarketAlert
#EconomicWakeUp
#FedWatch
#nextbullrun
🚨 The US is paying more in interest on its debt than it spends on defense.
Think about that. Over $1.2 TRILLION every year just to service debt. And the problem is accelerating.
💥 The US now carries $39 TRILLION in debt, with $9 trillion coming due this year alone. Most of that debt was borrowed when rates were near zero. Now, it’s being rolled over at much higher yields—meaning the cost of keeping the system afloat skyrockets every year.
This is why bond markets are suddenly center stage. The entire economy became addicted to cheap money: governments, companies, consumers—all borrowed aggressively. And now, with rates staying high, the math starts to break.
Every time the system has faced stress, the Fed has responded the same way:
2008: Money printing.
2020: Even more money printing.
In 2020 alone, the Fed added $3 TRILLION to its balance sheet within months to stop markets from freezing.
But this time? The debt is dramatically larger. The next round of intervention could be unprecedented in scale.
🔥 If yields keep rising while debt explodes, the Fed may have no choice but to print at levels the world has never seen before.
And this is exactly when the next big bull run will ignite.
💣 The math is breaking. The stage is set. History is about to repeat—on a scale bigger than ever.
#DebtCrisis
#BondMarketAlert
#EconomicWakeUp
#FedWatch
#nextbullrun
Think about that. Over $1.2 TRILLION every year just to service debt. And the problem is accelerating.
💥 The US now carries $39 TRILLION in debt, with $9 trillion coming due this year alone. Most of that debt was borrowed when rates were near zero. Now, it’s being rolled over at much higher yields—meaning the cost of keeping the system afloat skyrockets every year.
This is why bond markets are suddenly center stage. The entire economy became addicted to cheap money: governments, companies, consumers—all borrowed aggressively. And now, with rates staying high, the math starts to break.
Every time the system has faced stress, the Fed has responded the same way:
2008: Money printing.
2020: Even more money printing.
In 2020 alone, the Fed added $3 TRILLION to its balance sheet within months to stop markets from freezing.
But this time? The debt is dramatically larger. The next round of intervention could be unprecedented in scale.
🔥 If yields keep rising while debt explodes, the Fed may have no choice but to print at levels the world has never seen before.
And this is exactly when the next big bull run will ignite.
💣 The math is breaking. The stage is set. History is about to repeat—on a scale bigger than ever.
#DebtCrisis
#BondMarketAlert
#EconomicWakeUp
#FedWatch
#nextbullrun
309

## ₿ BTCUSDT Monthly Chart Analysis — Is Bitcoin Preparing for the Next Big Move?
Bitcoin (**BTCUSD## ₿ BTCUSDT Monthly Chart Analysis — Is Bitcoin Preparing for the Next Big Move?
Bitcoin (**BTCUSDT**) is currently trading around **$77,840**, and the 1-month chart shown in the Binance screenshot is giving an interesting technical setup.
After a major decline from the previous highs, BTC appears to be forming a **potential base around the $60,000–$62,000 area**. The trendline structure drawn on the chart suggests that Bitcoin could be entering a new recovery phase, but confirmation is still needed.
Recent market data also shows BTC has pushed above $80,000 during August before pulling back, with the **$80K–$82K zone acting as an important resistance area**. ([Reuters][1])
### 📊 Key Levels to Watch
**🟢 Support Zones**
* **$70,000–$72,000** — first important support
* **$60,000–$62,000** — major monthly support / previous base
* **$55,000–$58,000** — deeper bearish scenario
**🔴 Resistance Zones**
* **$80,000–$82,000** — immediate breakout zone
* **$90,000–$95,000** — next major target if the breakout succeeds
* **$100,000–$105,000** — major psychological and technical target
### 🔥 My Monthly-Chart Prediction
The structure shown in the chart gives me a **cautiously bullish bias**.
If BTC can establish a strong monthly close above **$80K–$82K**, the next move could target **$90K**, followed by **$95K–$100K**. A sustained breakout above $100K could significantly strengthen the longer-term bullish structure.
On the other hand, if Bitcoin is rejected around $80K–$82K and loses **$70K**, a retest of the **$60K–$62K support zone** becomes possible.
The broader market has recently shown strong recovery momentum: Bitcoin gained roughly 24–28% during August according to recent reports, although the rally has also brought it into an important resistance area. ([Barron's][2])
### 🎯 Possible Scenarios
**Bullish scenario 🚀**
$80K breakout → $85K → $90K → $95K → **$100K+**
**Neutral scenario ⚖️**
BTC remains between **$70K–$82K**, consolidating before the next major breakout.
**Bearish scenario 🐻**
Rejection from $80K–$82K → $70K breakdown → possible retest of **$60K–$62K**.
### 🧠 Final View
The monthly chart is interesting because Bitcoin has recovered strongly from the lower support area, while the trendline projection suggests the possibility of a larger upward move.
**My key confirmation level is $82,000.**
A convincing monthly breakout and close above this zone would make **$90K–$100K** increasingly realistic.
But remember: **a prediction is not a guarantee.** Bitcoin remains highly volatile, so traders should watch monthly closes and support/resistance rather than entering purely because of a projected target.
**BTCUSDT: $77,840 📈**
**Key resistance: $80K–$82K**
**Major support: $60K–$62K**
**Bullish target: $90K–$100K+**
*This is technical analysis for educational purposes, not financial advice.*
#Bitcoin #BTC #BTCUSDT #Binance #Crypto "Bitcoin rises above $80,000 as soft dollar, debasement fears boost momentum"
#BTC走势分析 #nextbullrun #BinanceSquareFamily #crypto $BTC
## ₿ BTCUSDT Monthly Chart Analysis — Is Bitcoin Preparing for the Next Big Move? Bitcoin (**BTCUSD
## ₿ BTCUSDT Monthly Chart Analysis — Is Bitcoin Preparing for the Next Big Move?
Bitcoin (**BTCUSDT**) is currently trading around **$77,840**, and the 1-month chart shown in the Binance screenshot is giving an interesting technical setup.
After a major decline from the previous highs, BTC appears to be forming a **potential base around the $60,000–$62,000 area**. The trendline structure drawn on the chart suggests that Bitcoin could be entering a new recovery phase, but confirmation is still needed.
Recent market data also shows BTC has pushed above $80,000 during August before pulling back, with the **$80K–$82K zone acting as an important resistance area**. ([Reuters][1])
### 📊 Key Levels to Watch
**🟢 Support Zones**
* **$70,000–$72,000** — first important support
* **$60,000–$62,000** — major monthly support / previous base
* **$55,000–$58,000** — deeper bearish scenario
**🔴 Resistance Zones**
* **$80,000–$82,000** — immediate breakout zone
* **$90,000–$95,000** — next major target if the breakout succeeds
* **$100,000–$105,000** — major psychological and technical target
### 🔥 My Monthly-Chart Prediction
The structure shown in the chart gives me a **cautiously bullish bias**.
If BTC can establish a strong monthly close above **$80K–$82K**, the next move could target **$90K**, followed by **$95K–$100K**. A sustained breakout above $100K could significantly strengthen the longer-term bullish structure.
On the other hand, if Bitcoin is rejected around $80K–$82K and loses **$70K**, a retest of the **$60K–$62K support zone** becomes possible.
The broader market has recently shown strong recovery momentum: Bitcoin gained roughly 24–28% during August according to recent reports, although the rally has also brought it into an important resistance area. ([Barron's][2])
### 🎯 Possible Scenarios
**Bullish scenario 🚀**
$80K breakout → $85K → $90K → $95K → **$100K+**
**Neutral scenario ⚖️**
BTC remains between **$70K–$82K**, consolidating before the next major breakout.
**Bearish scenario 🐻**
Rejection from $80K–$82K → $70K breakdown → possible retest of **$60K–$62K**.
### 🧠 Final View
The monthly chart is interesting because Bitcoin has recovered strongly from the lower support area, while the trendline projection suggests the possibility of a larger upward move.
**My key confirmation level is $82,000.**
A convincing monthly breakout and close above this zone would make **$90K–$100K** increasingly realistic.
But remember: **a prediction is not a guarantee.** Bitcoin remains highly volatile, so traders should watch monthly closes and support/resistance rather than entering purely because of a projected target.
**BTCUSDT: $77,840 📈**
**Key resistance: $80K–$82K**
**Major support: $60K–$62K**
**Bullish target: $90K–$100K+**
*This is technical analysis for educational purposes, not financial advice.*
#Bitcoin #BTC #BTCUSDT #Binance #Crypto "Bitcoin rises above $80,000 as soft dollar, debasement fears boost momentum"
#BTC走势分析 #nextbullrun #BinanceSquareFamily #crypto $BTC
Bitcoin (**BTCUSDT**) is currently trading around **$77,840**, and the 1-month chart shown in the Binance screenshot is giving an interesting technical setup.
After a major decline from the previous highs, BTC appears to be forming a **potential base around the $60,000–$62,000 area**. The trendline structure drawn on the chart suggests that Bitcoin could be entering a new recovery phase, but confirmation is still needed.
Recent market data also shows BTC has pushed above $80,000 during August before pulling back, with the **$80K–$82K zone acting as an important resistance area**. ([Reuters][1])
### 📊 Key Levels to Watch
**🟢 Support Zones**
* **$70,000–$72,000** — first important support
* **$60,000–$62,000** — major monthly support / previous base
* **$55,000–$58,000** — deeper bearish scenario
**🔴 Resistance Zones**
* **$80,000–$82,000** — immediate breakout zone
* **$90,000–$95,000** — next major target if the breakout succeeds
* **$100,000–$105,000** — major psychological and technical target
### 🔥 My Monthly-Chart Prediction
The structure shown in the chart gives me a **cautiously bullish bias**.
If BTC can establish a strong monthly close above **$80K–$82K**, the next move could target **$90K**, followed by **$95K–$100K**. A sustained breakout above $100K could significantly strengthen the longer-term bullish structure.
On the other hand, if Bitcoin is rejected around $80K–$82K and loses **$70K**, a retest of the **$60K–$62K support zone** becomes possible.
The broader market has recently shown strong recovery momentum: Bitcoin gained roughly 24–28% during August according to recent reports, although the rally has also brought it into an important resistance area. ([Barron's][2])
### 🎯 Possible Scenarios
**Bullish scenario 🚀**
$80K breakout → $85K → $90K → $95K → **$100K+**
**Neutral scenario ⚖️**
BTC remains between **$70K–$82K**, consolidating before the next major breakout.
**Bearish scenario 🐻**
Rejection from $80K–$82K → $70K breakdown → possible retest of **$60K–$62K**.
### 🧠 Final View
The monthly chart is interesting because Bitcoin has recovered strongly from the lower support area, while the trendline projection suggests the possibility of a larger upward move.
**My key confirmation level is $82,000.**
A convincing monthly breakout and close above this zone would make **$90K–$100K** increasingly realistic.
But remember: **a prediction is not a guarantee.** Bitcoin remains highly volatile, so traders should watch monthly closes and support/resistance rather than entering purely because of a projected target.
**BTCUSDT: $77,840 📈**
**Key resistance: $80K–$82K**
**Major support: $60K–$62K**
**Bullish target: $90K–$100K+**
*This is technical analysis for educational purposes, not financial advice.*
#Bitcoin #BTC #BTCUSDT #Binance #Crypto "Bitcoin rises above $80,000 as soft dollar, debasement fears boost momentum"
#BTC走势分析 #nextbullrun #BinanceSquareFamily #crypto $BTC
1
77

·
--
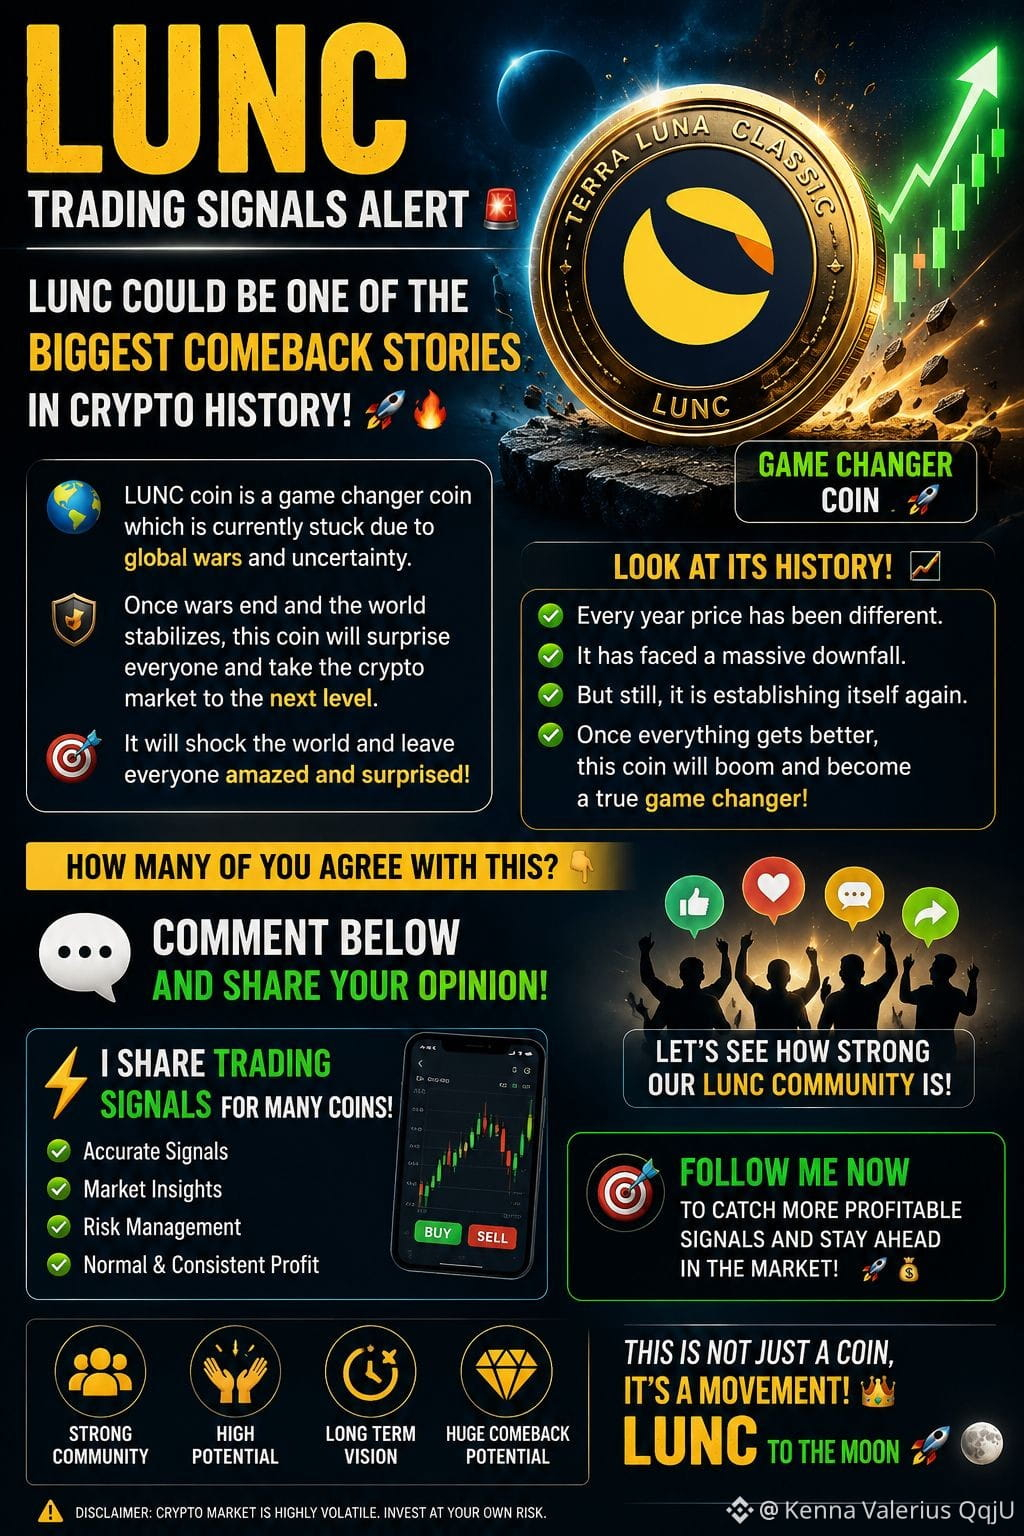
🚀🔥 $LUNC TRADING SIGNALS ALERT 🔥🚀
🌍 LUNC could be one of the biggest comeback stories in crypto history!
Right now, the market is facing uncertainty and global challenges, but many investors believe that once conditions improve, LUNC has the potential to shock the entire crypto market. ⚡
📉 This coin has gone through one of the biggest crashes ever seen in crypto, yet it is still alive, rebuilding, and supported by a strong community. That alone makes it one of the most watched projects in the market. 🚀
💎 If crypto enters the next major bull cycle, LUNC could become a true game-changer and surprise millions of investors worldwide.
🔥 Why are people still watching LUNC? ✅ Massive community support
✅ Historic recovery potential
✅ High-risk, high-reward opportunity
✅ One of the most talked-about comeback coins in crypto
📢 Do you agree with this view?
💬 Drop your opinion in the comments: Can LUNC become one of the biggest crypto comebacks of all time? YES or NO? 👇🔥
🚀 I also share crypto trading signals make small profit and market updates regularly. Follow my signals and stay connected for potential trading opportunities and market insights. 📊💰
🚨 FOLLOW NOW & DON'T MISS THE NEXT BIG MOVE! 🚨
#LUNC #TerraLunaClassic #CryptoSignals #CryptoNews #BullRun #Altcoins #CryptoTrading #Bitcoin #CryptoCommunity #LunaClassic #CryptoMarket #TradingSignals #CryptoInvestor #NextBullRun
🚀🔥 $LUNC TRADING SIGNALS ALERT 🔥🚀
🌍 LUNC could be one of the biggest comeback stories in crypto history!
Right now, the market is facing uncertainty and global challenges, but many investors believe that once conditions improve, LUNC has the potential to shock the entire crypto market. ⚡
📉 This coin has gone through one of the biggest crashes ever seen in crypto, yet it is still alive, rebuilding, and supported by a strong community. That alone makes it one of the most watched projects in the market. 🚀
💎 If crypto enters the next major bull cycle, LUNC could become a true game-changer and surprise millions of investors worldwide.
🔥 Why are people still watching LUNC? ✅ Massive community support
✅ Historic recovery potential
✅ High-risk, high-reward opportunity
✅ One of the most talked-about comeback coins in crypto
📢 Do you agree with this view?
💬 Drop your opinion in the comments: Can LUNC become one of the biggest crypto comebacks of all time? YES or NO? 👇🔥
🚀 I also share crypto trading signals make small profit and market updates regularly. Follow my signals and stay connected for potential trading opportunities and market insights. 📊💰
🚨 FOLLOW NOW & DON'T MISS THE NEXT BIG MOVE! 🚨
#LUNC #TerraLunaClassic #CryptoSignals #CryptoNews #BullRun #Altcoins #CryptoTrading #Bitcoin #CryptoCommunity #LunaClassic #CryptoMarket #TradingSignals #CryptoInvestor #NextBullRun
🌍 LUNC could be one of the biggest comeback stories in crypto history!
Right now, the market is facing uncertainty and global challenges, but many investors believe that once conditions improve, LUNC has the potential to shock the entire crypto market. ⚡
📉 This coin has gone through one of the biggest crashes ever seen in crypto, yet it is still alive, rebuilding, and supported by a strong community. That alone makes it one of the most watched projects in the market. 🚀
💎 If crypto enters the next major bull cycle, LUNC could become a true game-changer and surprise millions of investors worldwide.
🔥 Why are people still watching LUNC? ✅ Massive community support
✅ Historic recovery potential
✅ High-risk, high-reward opportunity
✅ One of the most talked-about comeback coins in crypto
📢 Do you agree with this view?
💬 Drop your opinion in the comments: Can LUNC become one of the biggest crypto comebacks of all time? YES or NO? 👇🔥
🚀 I also share crypto trading signals make small profit and market updates regularly. Follow my signals and stay connected for potential trading opportunities and market insights. 📊💰
🚨 FOLLOW NOW & DON'T MISS THE NEXT BIG MOVE! 🚨
#LUNC #TerraLunaClassic #CryptoSignals #CryptoNews #BullRun #Altcoins #CryptoTrading #Bitcoin #CryptoCommunity #LunaClassic #CryptoMarket #TradingSignals #CryptoInvestor #NextBullRun
167

·
--
Bullish
This Is Confirm In Next BullRun 👀🧐
$ADA * $1
$ENA * $1
$TRX * $1
$DOT * $5
$SUI * $5
$DEXE * $10
$SSV * $30
$EGLD * $100+
Right now this is all I'm seeing 🧐🤑 among this which one is Your favorite and what are you collecting 👀🧐
#HoldForGold #nextbullrun #CryptoPatience
{spot}(TRXUSDT)
{spot}(SSVUSDT)
{spot}(SUIUSDT)
This Is Confirm In Next BullRun 👀🧐
$ADA * $1
$ENA * $1
$TRX * $1
$DOT * $5
$SUI * $5
$DEXE * $10
$SSV * $30
$EGLD * $100+
Right now this is all I'm seeing 🧐🤑 among this which one is Your favorite and what are you collecting 👀🧐
#HoldForGold #nextbullrun #CryptoPatience
$ADA * $1
$ENA * $1
$TRX * $1
$DOT * $5
$SUI * $5
$DEXE * $10
$SSV * $30
$EGLD * $100+
Right now this is all I'm seeing 🧐🤑 among this which one is Your favorite and what are you collecting 👀🧐
#HoldForGold #nextbullrun #CryptoPatience


262
·
--
In the currencies that could lead the next wave, the sectors that the market is currently most tracking are:
RWA (such as ONDO and OM)
AI (such as TAO, RENDER, and ASI)
DePIN (such as FIL, AKT, and HNT
#NextBullRun
In the currencies that could lead the next wave, the sectors that the market is currently most tracking are:
RWA (such as ONDO and OM)
AI (such as TAO, RENDER, and ASI)
DePIN (such as FIL, AKT, and HNT
#NextBullRun
RWA (such as ONDO and OM)
AI (such as TAO, RENDER, and ASI)
DePIN (such as FIL, AKT, and HNT
#NextBullRun
334

🔥 My Top 5 Coins for the Upcoming Bull Market 🚀🚀
I am investing in these gems and here are their expected directions 💎
💥 $GIGGLE → Target: $500+
💥 $ARB → Target: $2+
💥 $SUI → Target: $10+
💥 $ENA → Target: $1.5+
💥 $TIA → Target: $10+
📈 Why these coins?
• Huge potential for growth
• Strong community and increasing adoption
• Perfect timing for the upcoming bull cycle
⚡ Invest early, set your smart strategy, and ride the wave 🌊
#CryptoPicks #NextBullRun
🔥 My Top 5 Coins for the Upcoming Bull Market 🚀🚀
I am investing in these gems and here are their expected directions 💎
💥 $GIGGLE → Target: $500+
💥 $ARB → Target: $2+
💥 $SUI → Target: $10+
💥 $ENA → Target: $1.5+
💥 $TIA → Target: $10+
📈 Why these coins?
• Huge potential for growth
• Strong community and increasing adoption
• Perfect timing for the upcoming bull cycle
⚡ Invest early, set your smart strategy, and ride the wave 🌊
#CryptoPicks #NextBullRun
I am investing in these gems and here are their expected directions 💎
💥 $GIGGLE → Target: $500+
💥 $ARB → Target: $2+
💥 $SUI → Target: $10+
💥 $ENA → Target: $1.5+
💥 $TIA → Target: $10+
📈 Why these coins?
• Huge potential for growth
• Strong community and increasing adoption
• Perfect timing for the upcoming bull cycle
⚡ Invest early, set your smart strategy, and ride the wave 🌊
#CryptoPicks #NextBullRun

2
2
3
1.6k

·
--
Bullish
🚀 $BITCOIN isn’t just rising — it’s redefining money.
In a world plagued by inflation, surveillance, and financial censorship, BTC stands tall as the people’s currency.
So.......?
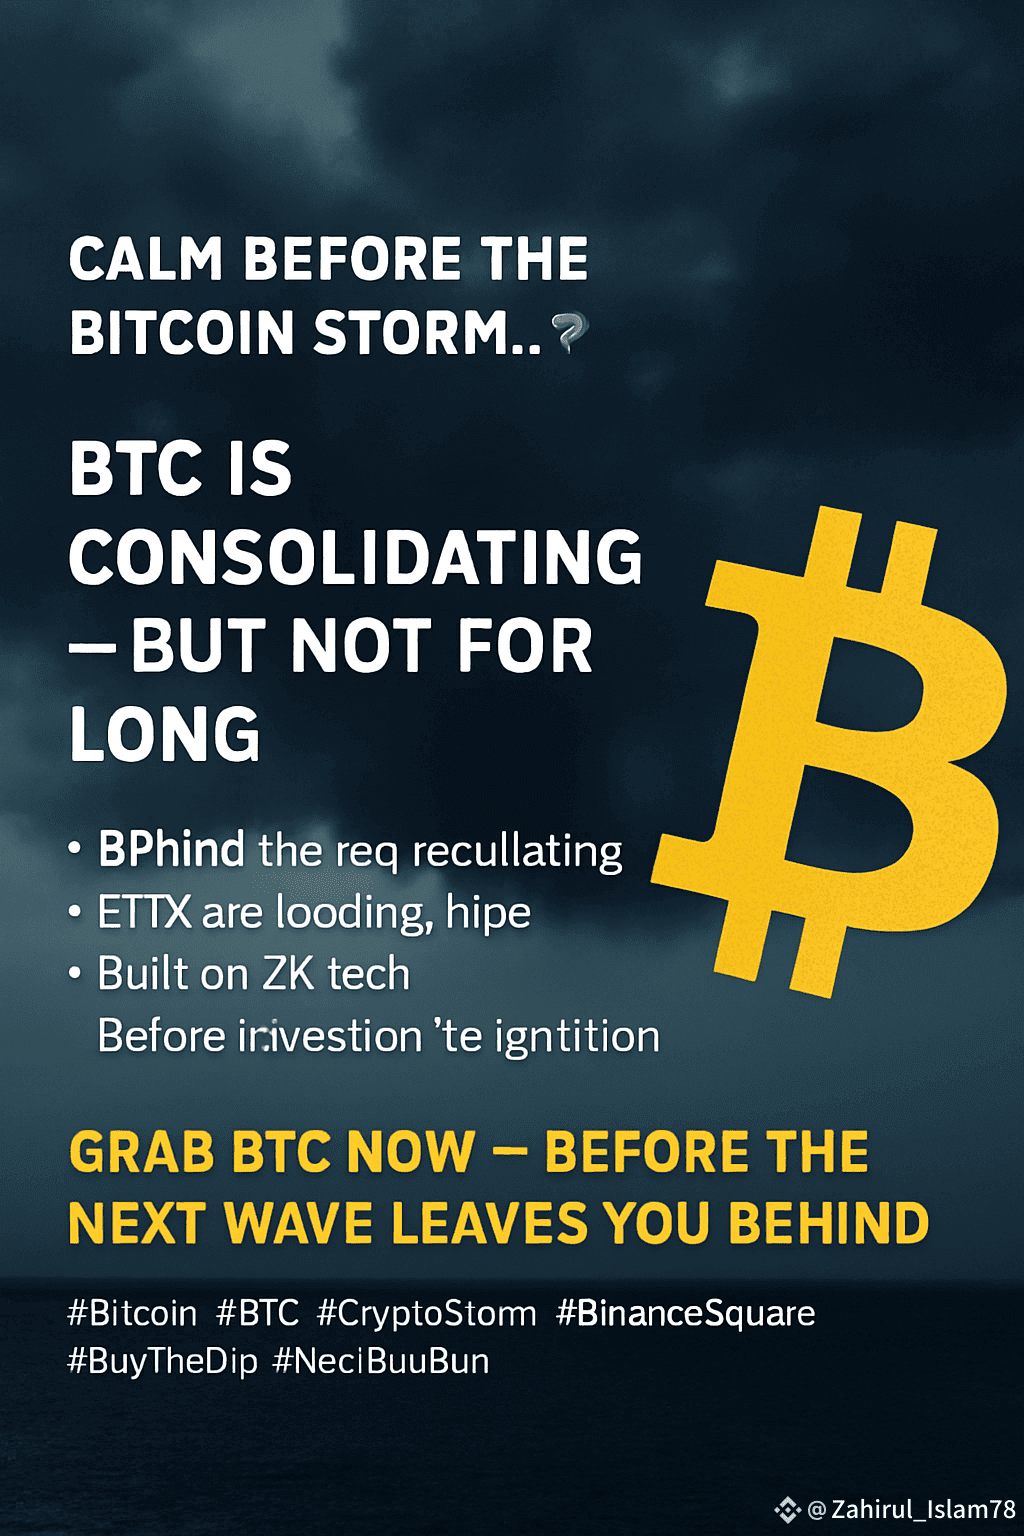
🌪️ $BTC Calm before the Bitcoin storm...
BTC is consolidating — but not for long.
Smart money is accumulating. ETFs are loading. Halving hype is building.
📉 Don’t wait for the breakout. 📈 Position before the ignition.
🔥 Grab BTC now — before the next wave leaves you behind.
The next global monetary standard is being built — block by block.
#Bitcoin #BTC #BinanceSquare #CryptoRevolution #SoundMoney #CryptoStorm #BinanceSquare #BuyTheDip #NextBullRun
{spot}(BTCUSDT)
🚀 $BITCOIN isn’t just rising — it’s redefining money.
In a world plagued by inflation, surveillance, and financial censorship, BTC stands tall as the people’s currency.
So.......?
🌪️ $BTC Calm before the Bitcoin storm...
BTC is consolidating — but not for long.
Smart money is accumulating. ETFs are loading. Halving hype is building.
📉 Don’t wait for the breakout. 📈 Position before the ignition.
🔥 Grab BTC now — before the next wave leaves you behind.
The next global monetary standard is being built — block by block.
#Bitcoin #BTC #BinanceSquare #CryptoRevolution #SoundMoney #CryptoStorm #BinanceSquare #BuyTheDip #NextBullRun
In a world plagued by inflation, surveillance, and financial censorship, BTC stands tall as the people’s currency.
So.......?
🌪️ $BTC Calm before the Bitcoin storm...
BTC is consolidating — but not for long.
Smart money is accumulating. ETFs are loading. Halving hype is building.
📉 Don’t wait for the breakout. 📈 Position before the ignition.
🔥 Grab BTC now — before the next wave leaves you behind.
The next global monetary standard is being built — block by block.
#Bitcoin #BTC #BinanceSquare #CryptoRevolution #SoundMoney #CryptoStorm #BinanceSquare #BuyTheDip #NextBullRun
2.2k
1.2k
156
2.2k

·
--
Bullish
$BTC $BTC
🚨 Crypto is no longer a gamble. It's a movement.
In 2025, the narrative has changed:
🧠 Artificial intelligence merges with blockchain
Projects like Fetch.ai, Bittensor, and Matrix AI are exploding in volume. Why? Because Web3 is becoming intelligent. And this is just the beginning.
🌍 L2s are becoming the mass infrastructure
Base, zkSync, Linea, Scroll... and of course opBNB, the ultra-scalable L2 of BNB Chain, attracts builders with fees < $0.001 💸
The world does not want to wait 12 minutes for a swap. It wants speed.
💸 Memecoins? Still here — but smarter.
$PEPE, $WIF, and now $BENJI or $BOME: this is no longer just fun. It's storytelling + community + liquidity. And those who understand this early win big.
---
📢 TL;DR?
The real alpha hunters:
✅ Build
✅ Learn
✅ Stay curious
✅ Don't follow, they anticipate
---
🎯 Binance is more than an exchange.
It's where trends become the norm.
➡️ Web3 Gaming
➡️ DeFi 2.0
➡️ Exclusive launchpools
➡️ Major airdrops
👉 Ready for what's coming? Or are you going to say “I should have” again?
#CryptoTrends #Web3Culture #BNBChain #BinanceAlpha #CryptoNarratives #Blockchain2025 #AIxCrypto #NextBullRun
$BTC $BTC
🚨 Crypto is no longer a gamble. It's a movement.
In 2025, the narrative has changed:
🧠 Artificial intelligence merges with blockchain
Projects like Fetch.ai, Bittensor, and Matrix AI are exploding in volume. Why? Because Web3 is becoming intelligent. And this is just the beginning.
🌍 L2s are becoming the mass infrastructure
Base, zkSync, Linea, Scroll... and of course opBNB, the ultra-scalable L2 of BNB Chain, attracts builders with fees < $0.001 💸
The world does not want to wait 12 minutes for a swap. It wants speed.
💸 Memecoins? Still here — but smarter.
$PEPE, $WIF, and now $BENJI or $BOME: this is no longer just fun. It's storytelling + community + liquidity. And those who understand this early win big.
---
📢 TL;DR?
The real alpha hunters:
✅ Build
✅ Learn
✅ Stay curious
✅ Don't follow, they anticipate
---
🎯 Binance is more than an exchange.
It's where trends become the norm.
➡️ Web3 Gaming
➡️ DeFi 2.0
➡️ Exclusive launchpools
➡️ Major airdrops
👉 Ready for what's coming? Or are you going to say “I should have” again?
#CryptoTrends #Web3Culture #BNBChain #BinanceAlpha #CryptoNarratives #Blockchain2025 #AIxCrypto #NextBullRun
🚨 Crypto is no longer a gamble. It's a movement.
In 2025, the narrative has changed:
🧠 Artificial intelligence merges with blockchain
Projects like Fetch.ai, Bittensor, and Matrix AI are exploding in volume. Why? Because Web3 is becoming intelligent. And this is just the beginning.
🌍 L2s are becoming the mass infrastructure
Base, zkSync, Linea, Scroll... and of course opBNB, the ultra-scalable L2 of BNB Chain, attracts builders with fees < $0.001 💸
The world does not want to wait 12 minutes for a swap. It wants speed.
💸 Memecoins? Still here — but smarter.
$PEPE, $WIF, and now $BENJI or $BOME: this is no longer just fun. It's storytelling + community + liquidity. And those who understand this early win big.
---
📢 TL;DR?
The real alpha hunters:
✅ Build
✅ Learn
✅ Stay curious
✅ Don't follow, they anticipate
---
🎯 Binance is more than an exchange.
It's where trends become the norm.
➡️ Web3 Gaming
➡️ DeFi 2.0
➡️ Exclusive launchpools
➡️ Major airdrops
👉 Ready for what's coming? Or are you going to say “I should have” again?
#CryptoTrends #Web3Culture #BNBChain #BinanceAlpha #CryptoNarratives #Blockchain2025 #AIxCrypto #NextBullRun
1
1
1
251

·
--
Bullish
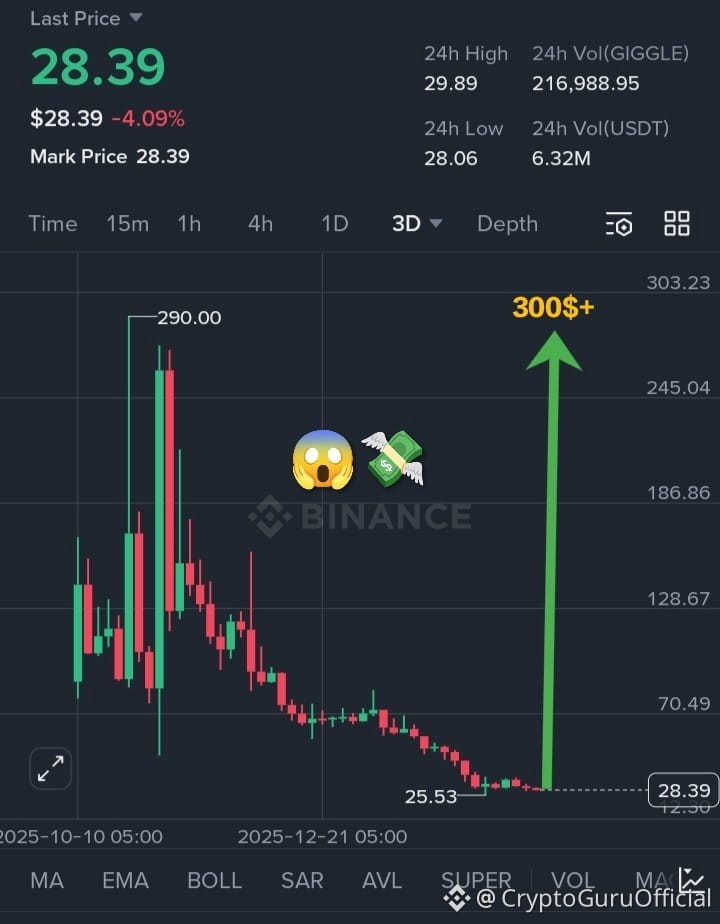
💥 Can $100 Turn Into $1,000+ with $GIGGLE ? 😱🚀
Imagine accumulating $GIGGLE at just $28 — a deep discounted zone after massive correction from $290. Smart money watches these levels closely. 👀
With only $100, you could secure approximately 3.5+ GIGGLE in your portfolio 💎
Now imagine the expansion phase 👇
🌕 At $100 → $350
💥 At $200 → $700
⚡ At $300 → $1,050+
🏆 Full recovery potential could create massive upside 🤯💰
This is the power of early positioning during fear and accumulation zones.
📊 Most investors wait for confirmation…
💼 Smart investors accumulate during discounts.
🚀 $GIGGLE is currently sitting in a high risk-reward accumulation zone.
Will you position early or chase the breakout later? 👀
#GIGGLE #CryptoOpportunity #SmartMoney #BinanceSquare #NextBullRun
💥 Can $100 Turn Into $1,000+ with $GIGGLE ? 😱🚀
Imagine accumulating $GIGGLE at just $28 — a deep discounted zone after massive correction from $290. Smart money watches these levels closely. 👀
With only $100, you could secure approximately 3.5+ GIGGLE in your portfolio 💎
Now imagine the expansion phase 👇
🌕 At $100 → $350
💥 At $200 → $700
⚡ At $300 → $1,050+
🏆 Full recovery potential could create massive upside 🤯💰
This is the power of early positioning during fear and accumulation zones.
📊 Most investors wait for confirmation…
💼 Smart investors accumulate during discounts.
🚀 $GIGGLE is currently sitting in a high risk-reward accumulation zone.
Will you position early or chase the breakout later? 👀
#GIGGLE #CryptoOpportunity #SmartMoney #BinanceSquare #NextBullRun
Imagine accumulating $GIGGLE at just $28 — a deep discounted zone after massive correction from $290. Smart money watches these levels closely. 👀
With only $100, you could secure approximately 3.5+ GIGGLE in your portfolio 💎
Now imagine the expansion phase 👇
🌕 At $100 → $350
💥 At $200 → $700
⚡ At $300 → $1,050+
🏆 Full recovery potential could create massive upside 🤯💰
This is the power of early positioning during fear and accumulation zones.
📊 Most investors wait for confirmation…
💼 Smart investors accumulate during discounts.
🚀 $GIGGLE is currently sitting in a high risk-reward accumulation zone.
Will you position early or chase the breakout later? 👀
#GIGGLE #CryptoOpportunity #SmartMoney #BinanceSquare #NextBullRun
1
1
12
3.7k

·
--
💥 Spot Bitcoin ETFs Scoop $300.5M in a Single Day! 🚀🔥
The bulls are waking up! 🐂 Yesterday alone, Spot Bitcoin ETFs grabbed $300.5 MILLION worth of BTC — a massive signal of growing institutional demand. 📈
💎 This kind of inflow isn’t just numbers… it’s proof that big money is betting on Bitcoin’s future. Every dollar flowing into ETFs means fewer coins available on the market, creating a powerful supply shock setup.
🚀 Momentum is REAL, and the charts are starting to show it. Could this be the start of the next big leg up for BTC? 👀
👉 One thing is certain: Bitcoin’s future has never looked stronger.
$BTC
{spot}(BTCUSDT)
$ETH
{spot}(ETHUSDT)
$BNB
{spot}(BNBUSDT)
#Bitcoin #BTC #CryptoNews #ETFs #CryptoMarket #InstitutionalMoney #HODL #Bullish #BinanceSquare #CryptoCommunity #NextBullRun
💥 Spot Bitcoin ETFs Scoop $300.5M in a Single Day! 🚀🔥
The bulls are waking up! 🐂 Yesterday alone, Spot Bitcoin ETFs grabbed $300.5 MILLION worth of BTC — a massive signal of growing institutional demand. 📈
💎 This kind of inflow isn’t just numbers… it’s proof that big money is betting on Bitcoin’s future. Every dollar flowing into ETFs means fewer coins available on the market, creating a powerful supply shock setup.
🚀 Momentum is REAL, and the charts are starting to show it. Could this be the start of the next big leg up for BTC? 👀
👉 One thing is certain: Bitcoin’s future has never looked stronger.
$BTC
$ETH
$BNB
#Bitcoin #BTC #CryptoNews #ETFs #CryptoMarket #InstitutionalMoney #HODL #Bullish #BinanceSquare #CryptoCommunity #NextBullRun
The bulls are waking up! 🐂 Yesterday alone, Spot Bitcoin ETFs grabbed $300.5 MILLION worth of BTC — a massive signal of growing institutional demand. 📈
💎 This kind of inflow isn’t just numbers… it’s proof that big money is betting on Bitcoin’s future. Every dollar flowing into ETFs means fewer coins available on the market, creating a powerful supply shock setup.
🚀 Momentum is REAL, and the charts are starting to show it. Could this be the start of the next big leg up for BTC? 👀
👉 One thing is certain: Bitcoin’s future has never looked stronger.
$BTC
$ETH
$BNB
#Bitcoin #BTC #CryptoNews #ETFs #CryptoMarket #InstitutionalMoney #HODL #Bullish #BinanceSquare #CryptoCommunity #NextBullRun
1
1
12
21.6k

🚀 Next Bull Run: Not Every Altcoin Will Win
The days of buying any random altcoin and watching it go 20x may be over.
This cycle is different.
Bitcoin ETFs, institutional capital, RWA tokenization, stablecoin growth, and real on-chain revenue are changing how capital flows through the crypto market. The next winners may not be the loudest projects — they may be the projects quietly building real adoption.
What I'm Watching:
✅ Developer Activity
✅ Real User Growth
✅ Stablecoin Adoption
✅ Institutional Partnerships
✅ RWA (Real World Asset) Growth
✅ Sustainable Tokenomics
✅ Manageable Token Unlock Schedules
Projects That Continue To Stand Out:
$SOL — Strong developer growth, ETF exposure, massive ecosystem activity.
$ETH — Still the foundation of DeFi, RWAs, and institutional adoption.
$LINK — The infrastructure layer connecting traditional finance to blockchain.
$AVAX — Enterprise and institutional blockchain adoption continues to grow.
$APT — Improving tokenomics, growing RWA presence, and declining unlock pressure over time.
$SUI — One of the fastest-growing developer ecosystems in crypto today.
My Biggest Takeaway:
The market is becoming more selective.
The next bull run may reward:
Real usage over hypeRevenue over narrativesAdoption over promisesStrong ecosystems over short-term trends
A project doesn't need to be the most popular today to become one of the biggest winners tomorrow.
Question for the community:
If you could only hold 3 altcoins for the next 5 years (excluding BTC), which would you choose and why? 👇
#crypto #altcoins #nextbullrun #Investing #nextaltseason
🚀 Next Bull Run: Not Every Altcoin Will Win
The days of buying any random altcoin and watching it go 20x may be over.
This cycle is different.
Bitcoin ETFs, institutional capital, RWA tokenization, stablecoin growth, and real on-chain revenue are changing how capital flows through the crypto market. The next winners may not be the loudest projects — they may be the projects quietly building real adoption.
What I'm Watching:
✅ Developer Activity
✅ Real User Growth
✅ Stablecoin Adoption
✅ Institutional Partnerships
✅ RWA (Real World Asset) Growth
✅ Sustainable Tokenomics
✅ Manageable Token Unlock Schedules
Projects That Continue To Stand Out:
$SOL — Strong developer growth, ETF exposure, massive ecosystem activity.
$ETH — Still the foundation of DeFi, RWAs, and institutional adoption.
$LINK — The infrastructure layer connecting traditional finance to blockchain.
$AVAX — Enterprise and institutional blockchain adoption continues to grow.
$APT — Improving tokenomics, growing RWA presence, and declining unlock pressure over time.
$SUI — One of the fastest-growing developer ecosystems in crypto today.
My Biggest Takeaway:
The market is becoming more selective.
The next bull run may reward:
Real usage over hypeRevenue over narrativesAdoption over promisesStrong ecosystems over short-term trends
A project doesn't need to be the most popular today to become one of the biggest winners tomorrow.
Question for the community:
If you could only hold 3 altcoins for the next 5 years (excluding BTC), which would you choose and why? 👇
#crypto #altcoins #nextbullrun #Investing #nextaltseason
The days of buying any random altcoin and watching it go 20x may be over.
This cycle is different.
Bitcoin ETFs, institutional capital, RWA tokenization, stablecoin growth, and real on-chain revenue are changing how capital flows through the crypto market. The next winners may not be the loudest projects — they may be the projects quietly building real adoption.
What I'm Watching:
✅ Developer Activity
✅ Real User Growth
✅ Stablecoin Adoption
✅ Institutional Partnerships
✅ RWA (Real World Asset) Growth
✅ Sustainable Tokenomics
✅ Manageable Token Unlock Schedules
Projects That Continue To Stand Out:
$SOL — Strong developer growth, ETF exposure, massive ecosystem activity.
$ETH — Still the foundation of DeFi, RWAs, and institutional adoption.
$LINK — The infrastructure layer connecting traditional finance to blockchain.
$AVAX — Enterprise and institutional blockchain adoption continues to grow.
$APT — Improving tokenomics, growing RWA presence, and declining unlock pressure over time.
$SUI — One of the fastest-growing developer ecosystems in crypto today.
My Biggest Takeaway:
The market is becoming more selective.
The next bull run may reward:
Real usage over hypeRevenue over narrativesAdoption over promisesStrong ecosystems over short-term trends
A project doesn't need to be the most popular today to become one of the biggest winners tomorrow.
Question for the community:
If you could only hold 3 altcoins for the next 5 years (excluding BTC), which would you choose and why? 👇
#crypto #altcoins #nextbullrun #Investing #nextaltseason

1
209
Log in to explore more content
Join global crypto users on Binance Square
⚡️ Get latest and useful information about crypto.
💬 Trusted by the world’s largest crypto exchange.
👍 Discover real insights from verified creators.
Email / Phone number
Trending Topics
1
#WhatWillDriveCryptoandStocks’NextRebound?
2,645 views
104 Discussing
2
#Anthropic’s6xIPODemandSignalsPotentialRecordRaise
694 views
38 Discussing
3
#HuangExitNvidiaStrategyInFocus
133,014 views
1,324 Discussing
4
#AnthropicRejectsIPODelayValuationinQuestion
746,670 views
5,516 Discussing
5
#HedgeFundsCMEBitcoinNetShortsFall89%
6,600 views
106 Discussing
6
#BitMineReports$6.3BNetLossForFiscal2026
18,036 views
156 Discussing
7
#TradFiForBeginners
546,262 views
3,805 Discussing
8
#SoFiExpandsSoFiUSDStablecoinToPolygon
5,111 views
89 Discussing
9
#TetherGoldXAUTCompletesKPMGAudit
6,962 views
94 Discussing
10
#ChipStocksExtendLossesAfterNvidiaCEOChange
49,979 views
523 Discussing