
#msft
msft
77,948 views
1,138 Discussing
Hot
Latest

·
--
Multi-period resonance: $ONG / $MSFT / $SMCI 30 minutes strengthen, 4-hour uptrend confirmation 🔥
════════════════════
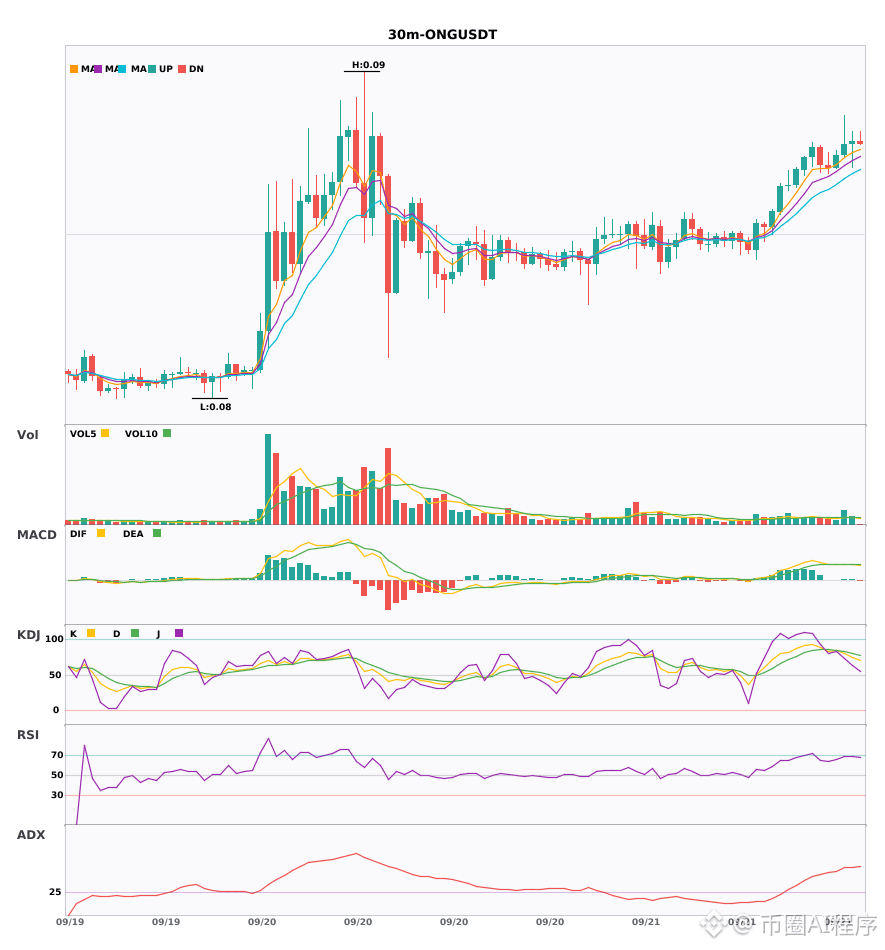
🔴 $ONG 30 minutes Bullish signal
⚠️ Technical analysis: 4-hour bullish resonance confirmed | Enter on the 30-minute timeframe: MACD golden cross above zero, bullish momentum released | EMA5 > EMA8 > EMA13 bullish alignment | KDJ strong trend, bulls in control (K is 79.5, D is 83.1) | Volume expands (1.8x)
════════════════════
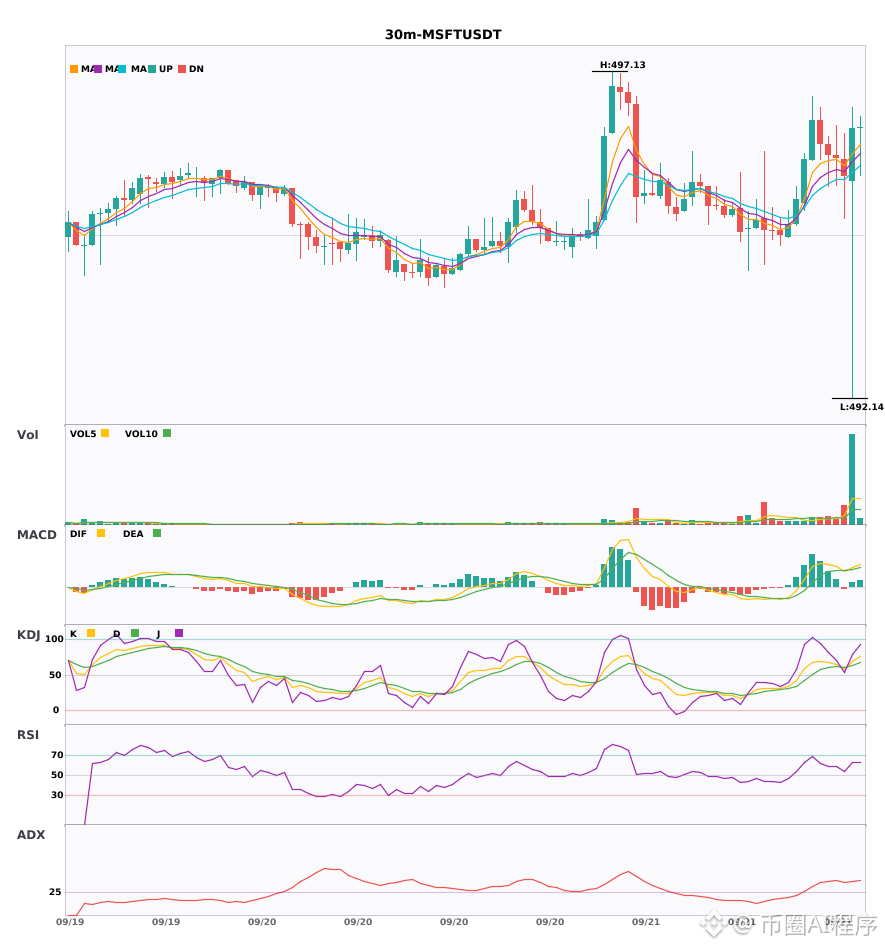
🔴 $MSFT 30 minutes Bullish signal
⚠️ Technical analysis: 4-hour bullish resonance confirmed | Enter on the 30-minute timeframe: MACD golden cross above zero, bullish momentum released | EMA5 > EMA8 > EMA13 bullish alignment | KDJ golden cross, bullish in the short term (K is 68.6, D is 63.4) | Volume surges (5.9x)
════════════════════
🔴 $SMCI 30 minutes Bullish signal
⚠️ Technical analysis: 4-hour bullish resonance confirmed | Enter on the 30-minute timeframe: MACD golden cross above zero, bullish momentum released | EMA5 > EMA8 > EMA13 bullish alignment | KDJ golden cross, bullish in the short term (K is 76.5, D is 75.0) | Volume surges (8.0x)
════════════════════
🔔 Watch for first-hand market moves/abnormalities 🔔
#多周期共振 #ONG #MSFT #SMCI
📌 When trading, pay attention to whether the candlestick pattern matches
Multi-period resonance: $ONG / $MSFT / $SMCI 30 minutes strengthen, 4-hour uptrend confirmation 🔥
════════════════════
🔴 $ONG 30 minutes Bullish signal
⚠️ Technical analysis: 4-hour bullish resonance confirmed | Enter on the 30-minute timeframe: MACD golden cross above zero, bullish momentum released | EMA5 > EMA8 > EMA13 bullish alignment | KDJ strong trend, bulls in control (K is 79.5, D is 83.1) | Volume expands (1.8x)
════════════════════
🔴 $MSFT 30 minutes Bullish signal
⚠️ Technical analysis: 4-hour bullish resonance confirmed | Enter on the 30-minute timeframe: MACD golden cross above zero, bullish momentum released | EMA5 > EMA8 > EMA13 bullish alignment | KDJ golden cross, bullish in the short term (K is 68.6, D is 63.4) | Volume surges (5.9x)
════════════════════
🔴 $SMCI 30 minutes Bullish signal
⚠️ Technical analysis: 4-hour bullish resonance confirmed | Enter on the 30-minute timeframe: MACD golden cross above zero, bullish momentum released | EMA5 > EMA8 > EMA13 bullish alignment | KDJ golden cross, bullish in the short term (K is 76.5, D is 75.0) | Volume surges (8.0x)
════════════════════
🔔 Watch for first-hand market moves/abnormalities 🔔
#多周期共振 #ONG #MSFT #SMCI
📌 When trading, pay attention to whether the candlestick pattern matches
════════════════════
🔴 $ONG 30 minutes Bullish signal
⚠️ Technical analysis: 4-hour bullish resonance confirmed | Enter on the 30-minute timeframe: MACD golden cross above zero, bullish momentum released | EMA5 > EMA8 > EMA13 bullish alignment | KDJ strong trend, bulls in control (K is 79.5, D is 83.1) | Volume expands (1.8x)
════════════════════
🔴 $MSFT 30 minutes Bullish signal
⚠️ Technical analysis: 4-hour bullish resonance confirmed | Enter on the 30-minute timeframe: MACD golden cross above zero, bullish momentum released | EMA5 > EMA8 > EMA13 bullish alignment | KDJ golden cross, bullish in the short term (K is 68.6, D is 63.4) | Volume surges (5.9x)
════════════════════
🔴 $SMCI 30 minutes Bullish signal
⚠️ Technical analysis: 4-hour bullish resonance confirmed | Enter on the 30-minute timeframe: MACD golden cross above zero, bullish momentum released | EMA5 > EMA8 > EMA13 bullish alignment | KDJ golden cross, bullish in the short term (K is 76.5, D is 75.0) | Volume surges (8.0x)
════════════════════
🔔 Watch for first-hand market moves/abnormalities 🔔
#多周期共振 #ONG #MSFT #SMCI
📌 When trading, pay attention to whether the candlestick pattern matches
121

·
--
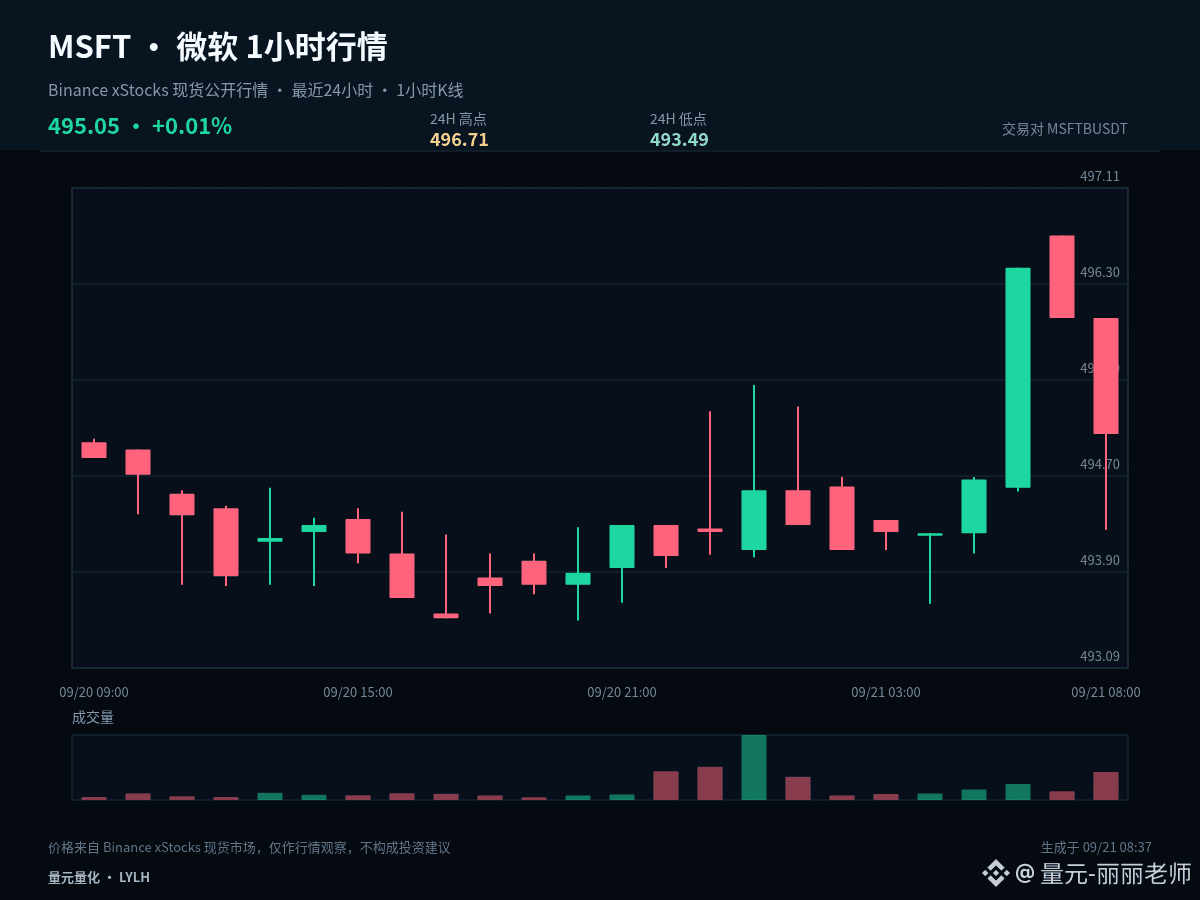
$MSFTB #MSFT From a layout perspective, the focus is not on chasing already-made fluctuations, but on determining in advance the position you are willing to wait for. Current price 495.05, 1 hour -0.20%, 24 hours +0.02%。
At present, the 1-hour -0.20% and 24-hour +0.02% have not formed sufficiently clear same-direction coordination between the two cycles. In a range-trading market, the tolerance for chasing and selling is lower; it’s more suitable to use the upper boundary to confirm direction, and the lower boundary to confirm support/continuation. The midline is only used as a dividing line between relative strength and weakness.
The first observation zone is 495.1, used to judge whether a normal pullback has ended; the second observation zone is 493.49, used to judge whether a deeper retracement can form support. On the upside, watch 496.71; after a breakout, a pullback confirmation is required to avoid mistaking a brief wick-through for the trend already being opened.
For existing positions, handle them in segments based on key levels to avoid making all judgments at once. Those with no position should wait for breakout confirmation or pullback stabilization. For U.S. stock-linked instruments, also be mindful of volatility brought by trading session transitions; your plan should be based on price conditions rather than letting emotions replace execution.
The meaning of scaling in is not to keep averaging down costs, but to control the pace while the structure remains valid. Once a key support fails, you should stop the original layout plan and wait for a new price range to form.
For short-term positions, the key is not to predict every candlestick, but to ensure that entries, trimming, and exits have a basis. If there’s no confirmation, do less; if key levels fail, redo your plan—control single-trade risk first, then discuss subsequent upside.
#BitcoinMarketCapTopsTesla
$MSFTB #MSFT From a layout perspective, the focus is not on chasing already-made fluctuations, but on determining in advance the position you are willing to wait for. Current price 495.05, 1 hour -0.20%, 24 hours +0.02%。
At present, the 1-hour -0.20% and 24-hour +0.02% have not formed sufficiently clear same-direction coordination between the two cycles. In a range-trading market, the tolerance for chasing and selling is lower; it’s more suitable to use the upper boundary to confirm direction, and the lower boundary to confirm support/continuation. The midline is only used as a dividing line between relative strength and weakness.
The first observation zone is 495.1, used to judge whether a normal pullback has ended; the second observation zone is 493.49, used to judge whether a deeper retracement can form support. On the upside, watch 496.71; after a breakout, a pullback confirmation is required to avoid mistaking a brief wick-through for the trend already being opened.
For existing positions, handle them in segments based on key levels to avoid making all judgments at once. Those with no position should wait for breakout confirmation or pullback stabilization. For U.S. stock-linked instruments, also be mindful of volatility brought by trading session transitions; your plan should be based on price conditions rather than letting emotions replace execution.
The meaning of scaling in is not to keep averaging down costs, but to control the pace while the structure remains valid. Once a key support fails, you should stop the original layout plan and wait for a new price range to form.
For short-term positions, the key is not to predict every candlestick, but to ensure that entries, trimming, and exits have a basis. If there’s no confirmation, do less; if key levels fail, redo your plan—control single-trade risk first, then discuss subsequent upside.
#BitcoinMarketCapTopsTesla
At present, the 1-hour -0.20% and 24-hour +0.02% have not formed sufficiently clear same-direction coordination between the two cycles. In a range-trading market, the tolerance for chasing and selling is lower; it’s more suitable to use the upper boundary to confirm direction, and the lower boundary to confirm support/continuation. The midline is only used as a dividing line between relative strength and weakness.
The first observation zone is 495.1, used to judge whether a normal pullback has ended; the second observation zone is 493.49, used to judge whether a deeper retracement can form support. On the upside, watch 496.71; after a breakout, a pullback confirmation is required to avoid mistaking a brief wick-through for the trend already being opened.
For existing positions, handle them in segments based on key levels to avoid making all judgments at once. Those with no position should wait for breakout confirmation or pullback stabilization. For U.S. stock-linked instruments, also be mindful of volatility brought by trading session transitions; your plan should be based on price conditions rather than letting emotions replace execution.
The meaning of scaling in is not to keep averaging down costs, but to control the pace while the structure remains valid. Once a key support fails, you should stop the original layout plan and wait for a new price range to form.
For short-term positions, the key is not to predict every candlestick, but to ensure that entries, trimming, and exits have a basis. If there’s no confirmation, do less; if key levels fail, redo your plan—control single-trade risk first, then discuss subsequent upside.
#BitcoinMarketCapTopsTesla
51

·
--
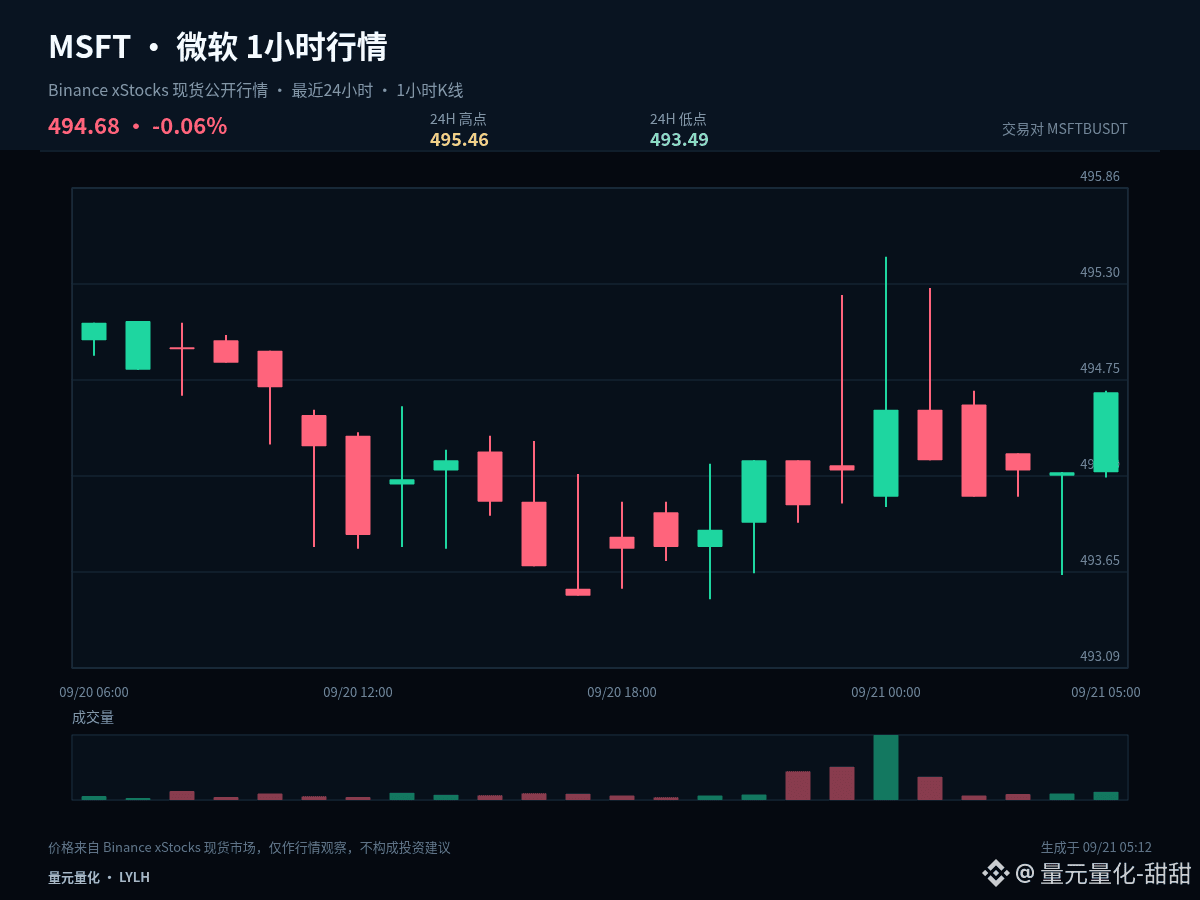
$MSFTB #MSFT Can this price action continue? It doesn’t depend on how much it has risen before; it depends on whether the trend can complete the sequence of “push, consolidation, and re-confirmation.” Currently, the 1-hour change is +0.09%, and the 24-hour change is -0.05%.
Currently, the 1-hour is +0.09% and the 24-hour is -0.05%, and the two timeframes have not formed enough clear same-direction coordination. In range-bound conditions, the margin for error when chasing or cutting is lower. It’s more suitable to confirm the direction with the upper boundary, confirm the holding/support with the lower boundary, and use the midline only as the line separating strength and weakness.
The first condition for trend continuation is that 494.475 is not effectively broken down; the second condition is that the price can retest and regain footing at 495.46. If, after the push, price stays in the lower half of the midline for a long time, it indicates weakening of active buying. If 493.49 is further lost, the original continuation assumption needs to be canceled.
The subsequent path has three ways to handle it: if it effectively holds above 495.46, wait for a pullback that doesn’t break and then reassess the continuation; if it breaks down through 493.49, prioritize controlling risk and wait for new support; if it keeps oscillating around 494.475, treat it as range turnover and don’t repeatedly chase direction from the middle position.
For existing positions, you can handle them in segments based on key levels to avoid making all judgments at once. For those who are currently in cash, wait for breakout confirmation or pullback stabilization. For U.S. stock-related instruments, also pay attention to volatility caused by trading session transitions. The plan should be based on price conditions—don’t let emotions replace execution.
Risk control still comes before the conclusion: execute only when conditions are met; if the price invalidates the setup, reassess promptly. The larger the volatility, the more restrained each single position should be. The above is a scenario-based interpretation based on the current 1-hour and 24-hour data and does not constitute any return guarantee.
#XRPExchangeReservesHitSevenYearLow
$MSFTB #MSFT Can this price action continue? It doesn’t depend on how much it has risen before; it depends on whether the trend can complete the sequence of “push, consolidation, and re-confirmation.” Currently, the 1-hour change is +0.09%, and the 24-hour change is -0.05%.
Currently, the 1-hour is +0.09% and the 24-hour is -0.05%, and the two timeframes have not formed enough clear same-direction coordination. In range-bound conditions, the margin for error when chasing or cutting is lower. It’s more suitable to confirm the direction with the upper boundary, confirm the holding/support with the lower boundary, and use the midline only as the line separating strength and weakness.
The first condition for trend continuation is that 494.475 is not effectively broken down; the second condition is that the price can retest and regain footing at 495.46. If, after the push, price stays in the lower half of the midline for a long time, it indicates weakening of active buying. If 493.49 is further lost, the original continuation assumption needs to be canceled.
The subsequent path has three ways to handle it: if it effectively holds above 495.46, wait for a pullback that doesn’t break and then reassess the continuation; if it breaks down through 493.49, prioritize controlling risk and wait for new support; if it keeps oscillating around 494.475, treat it as range turnover and don’t repeatedly chase direction from the middle position.
For existing positions, you can handle them in segments based on key levels to avoid making all judgments at once. For those who are currently in cash, wait for breakout confirmation or pullback stabilization. For U.S. stock-related instruments, also pay attention to volatility caused by trading session transitions. The plan should be based on price conditions—don’t let emotions replace execution.
Risk control still comes before the conclusion: execute only when conditions are met; if the price invalidates the setup, reassess promptly. The larger the volatility, the more restrained each single position should be. The above is a scenario-based interpretation based on the current 1-hour and 24-hour data and does not constitute any return guarantee.
#XRPExchangeReservesHitSevenYearLow
Currently, the 1-hour is +0.09% and the 24-hour is -0.05%, and the two timeframes have not formed enough clear same-direction coordination. In range-bound conditions, the margin for error when chasing or cutting is lower. It’s more suitable to confirm the direction with the upper boundary, confirm the holding/support with the lower boundary, and use the midline only as the line separating strength and weakness.
The first condition for trend continuation is that 494.475 is not effectively broken down; the second condition is that the price can retest and regain footing at 495.46. If, after the push, price stays in the lower half of the midline for a long time, it indicates weakening of active buying. If 493.49 is further lost, the original continuation assumption needs to be canceled.
The subsequent path has three ways to handle it: if it effectively holds above 495.46, wait for a pullback that doesn’t break and then reassess the continuation; if it breaks down through 493.49, prioritize controlling risk and wait for new support; if it keeps oscillating around 494.475, treat it as range turnover and don’t repeatedly chase direction from the middle position.
For existing positions, you can handle them in segments based on key levels to avoid making all judgments at once. For those who are currently in cash, wait for breakout confirmation or pullback stabilization. For U.S. stock-related instruments, also pay attention to volatility caused by trading session transitions. The plan should be based on price conditions—don’t let emotions replace execution.
Risk control still comes before the conclusion: execute only when conditions are met; if the price invalidates the setup, reassess promptly. The larger the volatility, the more restrained each single position should be. The above is a scenario-based interpretation based on the current 1-hour and 24-hour data and does not constitute any return guarantee.
#XRPExchangeReservesHitSevenYearLow
5
·
--
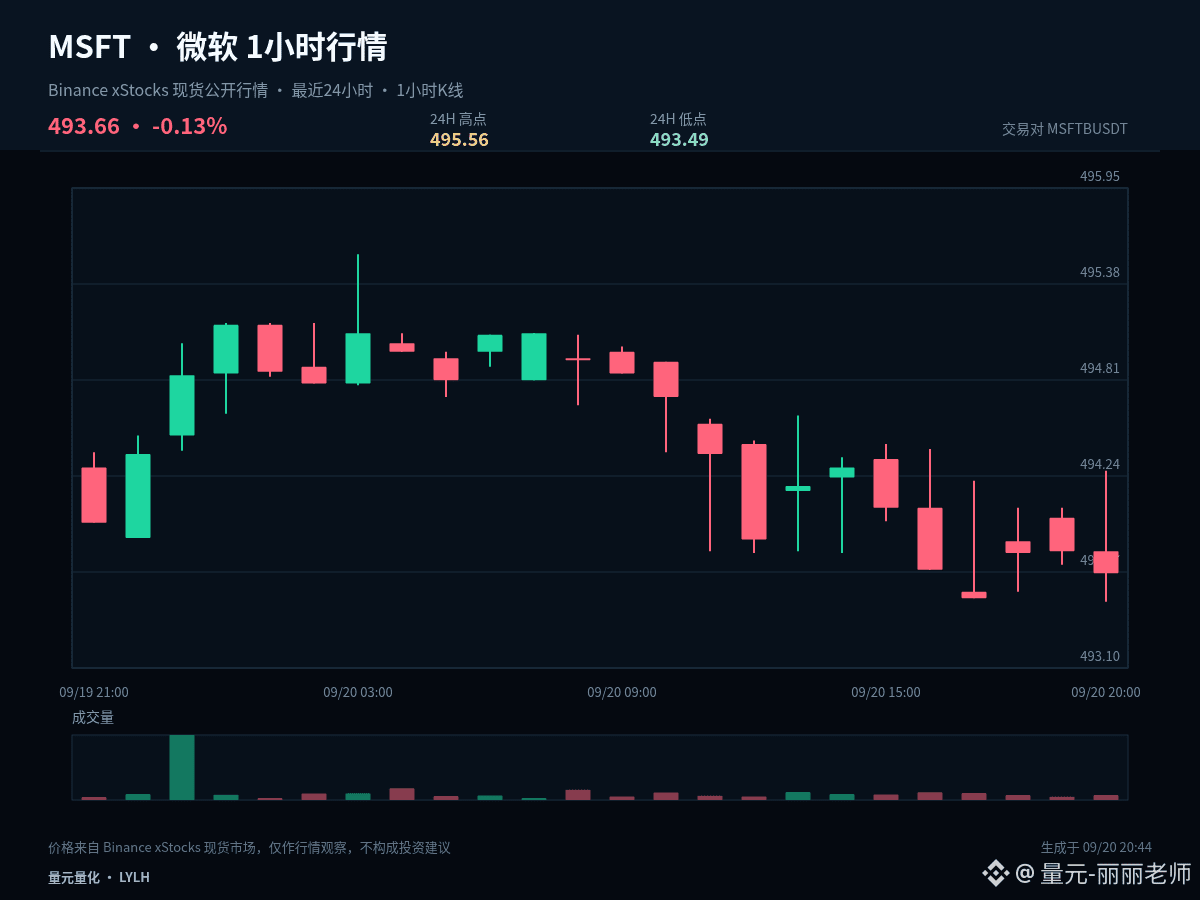
$MSFTB #MSFT It is currently more suitable to first confirm a rebound rather than defining a reversal in advance. Current price is 493.66, 1 hour -0.03%, 24 hours -0.13%. Whether the two cycles realign in the same direction is the key focus for the next stage.
The current price is close to the lower end of the past 24 hours' range: 1 hour -0.03%, 24 hours -0.13%. The core of the low-end analysis is not to guess a bottom early, but to observe whether it can quickly reclaim after a breakdown. If it can reclaim, it indicates sell pressure is being absorbed; if it keeps lingering below the lower bound, it suggests the weakness has not ended.
If the rebound can reclaim 494.525 and further hold above 495.56, it would indicate that buy-side demand is starting to change the original weak trend. If it rises back toward the midline and then falls again—especially if it drops back toward 493.49—that looks more like a failed repair, and you should not continue to rely on a strengthening expectation.
Confirming a failed rebound also needs evidence. You shouldn’t chase a short just because of a single spike followed by a drop. A more reasonable sequence is to observe whether the resistance level is rejected, whether the low points form again and move lower, and then decide actions based on whether subsequent pullbacks reclaim the key levels.
Position management should distinguish between swing/medium-term and short-term. For existing medium-term positions, first assess whether the structure is broken; don’t be repeatedly influenced by a single 1-hour candlestick. For short-term positions, execute around support, resistance, and closing confirmation. Those without a position don’t need to chase prices in the middle of the range; waiting for a clearer location usually offers an advantage.
Risk control should still come before conclusions: only act when conditions are met, and reassess immediately if the price action invalidates the scenario. The greater the volatility, the more restrained you should be with any single position. The above is a scenario analysis based on the current 1-hour and 24-hour data and does not constitute a promise of returns.
#XRPExchangeReservesHitSevenYearLow
$MSFTB #MSFT It is currently more suitable to first confirm a rebound rather than defining a reversal in advance. Current price is 493.66, 1 hour -0.03%, 24 hours -0.13%. Whether the two cycles realign in the same direction is the key focus for the next stage.
The current price is close to the lower end of the past 24 hours' range: 1 hour -0.03%, 24 hours -0.13%. The core of the low-end analysis is not to guess a bottom early, but to observe whether it can quickly reclaim after a breakdown. If it can reclaim, it indicates sell pressure is being absorbed; if it keeps lingering below the lower bound, it suggests the weakness has not ended.
If the rebound can reclaim 494.525 and further hold above 495.56, it would indicate that buy-side demand is starting to change the original weak trend. If it rises back toward the midline and then falls again—especially if it drops back toward 493.49—that looks more like a failed repair, and you should not continue to rely on a strengthening expectation.
Confirming a failed rebound also needs evidence. You shouldn’t chase a short just because of a single spike followed by a drop. A more reasonable sequence is to observe whether the resistance level is rejected, whether the low points form again and move lower, and then decide actions based on whether subsequent pullbacks reclaim the key levels.
Position management should distinguish between swing/medium-term and short-term. For existing medium-term positions, first assess whether the structure is broken; don’t be repeatedly influenced by a single 1-hour candlestick. For short-term positions, execute around support, resistance, and closing confirmation. Those without a position don’t need to chase prices in the middle of the range; waiting for a clearer location usually offers an advantage.
Risk control should still come before conclusions: only act when conditions are met, and reassess immediately if the price action invalidates the scenario. The greater the volatility, the more restrained you should be with any single position. The above is a scenario analysis based on the current 1-hour and 24-hour data and does not constitute a promise of returns.
#XRPExchangeReservesHitSevenYearLow
The current price is close to the lower end of the past 24 hours' range: 1 hour -0.03%, 24 hours -0.13%. The core of the low-end analysis is not to guess a bottom early, but to observe whether it can quickly reclaim after a breakdown. If it can reclaim, it indicates sell pressure is being absorbed; if it keeps lingering below the lower bound, it suggests the weakness has not ended.
If the rebound can reclaim 494.525 and further hold above 495.56, it would indicate that buy-side demand is starting to change the original weak trend. If it rises back toward the midline and then falls again—especially if it drops back toward 493.49—that looks more like a failed repair, and you should not continue to rely on a strengthening expectation.
Confirming a failed rebound also needs evidence. You shouldn’t chase a short just because of a single spike followed by a drop. A more reasonable sequence is to observe whether the resistance level is rejected, whether the low points form again and move lower, and then decide actions based on whether subsequent pullbacks reclaim the key levels.
Position management should distinguish between swing/medium-term and short-term. For existing medium-term positions, first assess whether the structure is broken; don’t be repeatedly influenced by a single 1-hour candlestick. For short-term positions, execute around support, resistance, and closing confirmation. Those without a position don’t need to chase prices in the middle of the range; waiting for a clearer location usually offers an advantage.
Risk control should still come before conclusions: only act when conditions are met, and reassess immediately if the price action invalidates the scenario. The greater the volatility, the more restrained you should be with any single position. The above is a scenario analysis based on the current 1-hour and 24-hour data and does not constitute a promise of returns.
#XRPExchangeReservesHitSevenYearLow
2
·
--
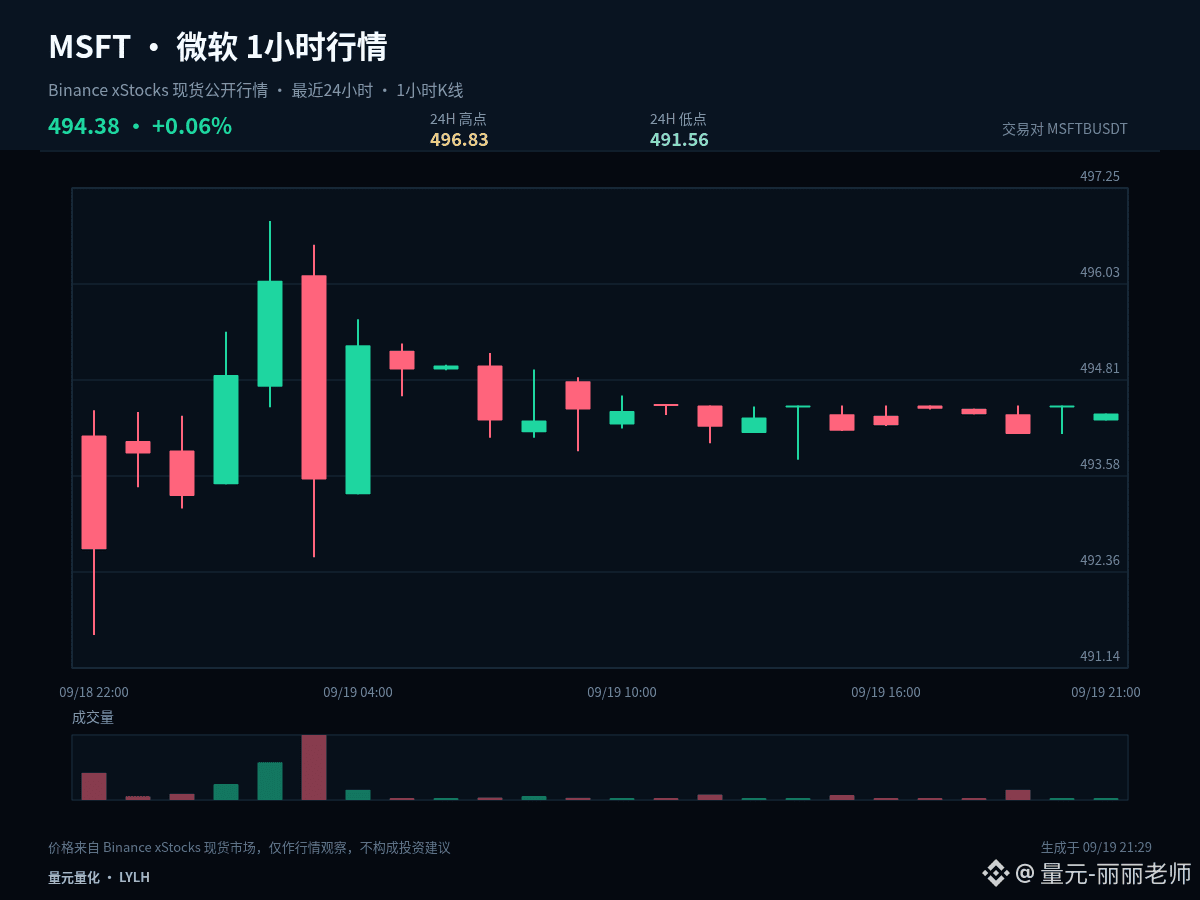
$MSFTB #MSFT Put the intraday conclusion first: if it can’t be reclaimed at 494.195, then you need to keep defending 491.56. Current price: 494.38, 1-hour -0.02%, 24-hour -0.70%.
With the current 1-hour -0.02% and 24-hour -0.70%, the two time frames have not formed a sufficiently clear directional alignment. In a range-bound market, the tolerance for chasing breakouts and reacting to dips is low. It’s more suitable to confirm direction using the upper boundary and confirm support using the lower boundary; the midline is only used to judge strength vs weakness.
For the short term, first watch whether 491.56 can form continuous support, and then whether 494.195 can be reclaimed again. The former determines whether the selloff can slow down; the latter determines whether the rebound can strengthen. Without confirmation on both fronts, it’s not advisable to judge opportunity based on the size of the drop alone.
For execution, set clear conditions: after breaking above 496.83, you need confirmation—not just a momentary spike to chase. After testing 491.56, you need to see whether it can be quickly reclaimed—not just “buy the dip.” If the middle zone doesn’t offer sufficient reward-to-risk, waiting is also part of the strategy.
Existing positions can be handled in stages based on key levels to avoid making all decisions at once. For those without a position, wait for breakout confirmation or a pullback to stabilize. For US stocks/underlyings, also watch for volatility caused by trading session transitions. Your plan should be based on price conditions, not on emotion replacing execution.
Simplifying the conclusion doesn’t mean simplifying risk control. In real execution, you still need to wait for price confirmation, and leave room to exit if the thesis proves wrong. The true disagreement in this行情 is whether it will continue or return to the range. Will you wait for breakout confirmation, or wait for a support pullback? Tell me which price level you’re most focused on.
#HKCompletesFirstHKDStablecoinUseCase
$MSFTB #MSFT Put the intraday conclusion first: if it can’t be reclaimed at 494.195, then you need to keep defending 491.56. Current price: 494.38, 1-hour -0.02%, 24-hour -0.70%.
With the current 1-hour -0.02% and 24-hour -0.70%, the two time frames have not formed a sufficiently clear directional alignment. In a range-bound market, the tolerance for chasing breakouts and reacting to dips is low. It’s more suitable to confirm direction using the upper boundary and confirm support using the lower boundary; the midline is only used to judge strength vs weakness.
For the short term, first watch whether 491.56 can form continuous support, and then whether 494.195 can be reclaimed again. The former determines whether the selloff can slow down; the latter determines whether the rebound can strengthen. Without confirmation on both fronts, it’s not advisable to judge opportunity based on the size of the drop alone.
For execution, set clear conditions: after breaking above 496.83, you need confirmation—not just a momentary spike to chase. After testing 491.56, you need to see whether it can be quickly reclaimed—not just “buy the dip.” If the middle zone doesn’t offer sufficient reward-to-risk, waiting is also part of the strategy.
Existing positions can be handled in stages based on key levels to avoid making all decisions at once. For those without a position, wait for breakout confirmation or a pullback to stabilize. For US stocks/underlyings, also watch for volatility caused by trading session transitions. Your plan should be based on price conditions, not on emotion replacing execution.
Simplifying the conclusion doesn’t mean simplifying risk control. In real execution, you still need to wait for price confirmation, and leave room to exit if the thesis proves wrong. The true disagreement in this行情 is whether it will continue or return to the range. Will you wait for breakout confirmation, or wait for a support pullback? Tell me which price level you’re most focused on.
#HKCompletesFirstHKDStablecoinUseCase
With the current 1-hour -0.02% and 24-hour -0.70%, the two time frames have not formed a sufficiently clear directional alignment. In a range-bound market, the tolerance for chasing breakouts and reacting to dips is low. It’s more suitable to confirm direction using the upper boundary and confirm support using the lower boundary; the midline is only used to judge strength vs weakness.
For the short term, first watch whether 491.56 can form continuous support, and then whether 494.195 can be reclaimed again. The former determines whether the selloff can slow down; the latter determines whether the rebound can strengthen. Without confirmation on both fronts, it’s not advisable to judge opportunity based on the size of the drop alone.
For execution, set clear conditions: after breaking above 496.83, you need confirmation—not just a momentary spike to chase. After testing 491.56, you need to see whether it can be quickly reclaimed—not just “buy the dip.” If the middle zone doesn’t offer sufficient reward-to-risk, waiting is also part of the strategy.
Existing positions can be handled in stages based on key levels to avoid making all decisions at once. For those without a position, wait for breakout confirmation or a pullback to stabilize. For US stocks/underlyings, also watch for volatility caused by trading session transitions. Your plan should be based on price conditions, not on emotion replacing execution.
Simplifying the conclusion doesn’t mean simplifying risk control. In real execution, you still need to wait for price confirmation, and leave room to exit if the thesis proves wrong. The true disagreement in this行情 is whether it will continue or return to the range. Will you wait for breakout confirmation, or wait for a support pullback? Tell me which price level you’re most focused on.
#HKCompletesFirstHKDStablecoinUseCase
9
·
--
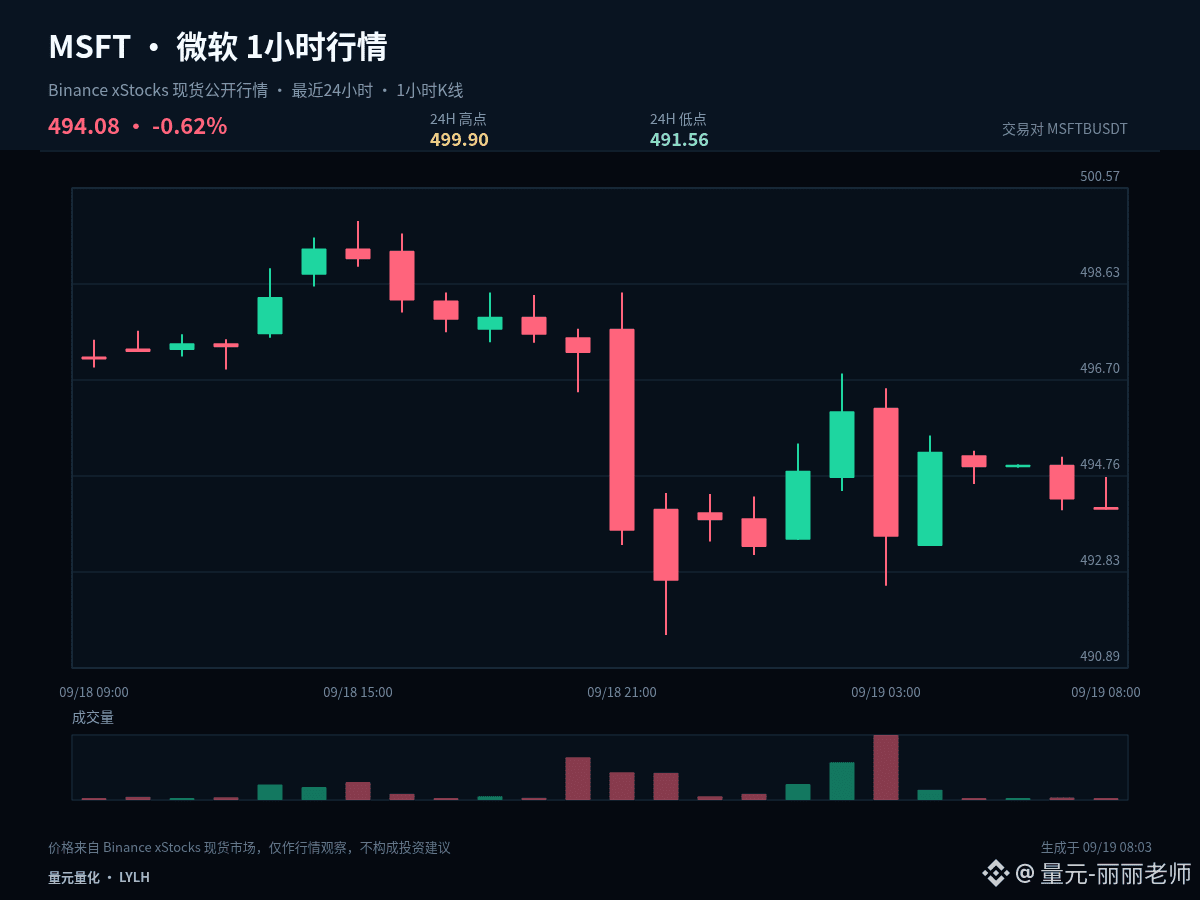
$MSFTB #MSFT Make an intraday viewpoint record: Current price 494.08, 1 hour -0.04%, 24 hours -0.57%, with a high-low swing of about 1.7% over the past 24 hours.
Currently, 1 hour is -0.04% and 24 hours is -0.57%; the two timeframes have not formed sufficiently clear directional alignment. In a range market, the tolerance for chasing and killing trades is low. It’s more suitable to use the upper boundary to confirm direction and the lower boundary to confirm pullback/hold. The midline is only used as the strength/weakness dividing line.
The three price levels you need to track together are: midline 495.73, the upper confirmation level 499.9, and the lower defensive level 491.56. The midline determines short-term initiative, while the upper and lower bounds determine whether the market truly breaks away from the original trading range.
Set execution conditions clearly: after breaking above 499.9, you need confirmation—not chasing just because you see a momentary surge; after dipping to 491.56, you need to see whether price can quickly reclaim—don’t just catch every drop. If the middle region doesn’t offer enough reward-to-risk, waiting is also part of the strategy.
Position management should distinguish between medium-term and short-term holdings. For existing medium-term positions, first check whether the structure is broken; don’t let repeated moves on a single 1-hour K-line affect you. For short-term positions, execute around support, resistance, and close confirmation. Those in cash (no position) don’t need to chase price in the middle of the range—waiting for a clearer location usually has the advantage.
Your trading plan must include invalidation conditions. If your judgment is correct, you can realize profits in stages. If your judgment is wrong, you must also be allowed to exit; you can’t use adding to position to disguise the fact that the original logic has changed. The market will update, and your viewpoint should adjust according to price evidence.
The real disagreement in this行情 is whether it will continue or revert back to the range. Will you wait for a breakout confirmation, or wait for a support retest? Share the price level you’re most focused on.
#ZcashDevelopersTargetNU7MainnetActivationNov5
$MSFTB #MSFT Make an intraday viewpoint record: Current price 494.08, 1 hour -0.04%, 24 hours -0.57%, with a high-low swing of about 1.7% over the past 24 hours.
Currently, 1 hour is -0.04% and 24 hours is -0.57%; the two timeframes have not formed sufficiently clear directional alignment. In a range market, the tolerance for chasing and killing trades is low. It’s more suitable to use the upper boundary to confirm direction and the lower boundary to confirm pullback/hold. The midline is only used as the strength/weakness dividing line.
The three price levels you need to track together are: midline 495.73, the upper confirmation level 499.9, and the lower defensive level 491.56. The midline determines short-term initiative, while the upper and lower bounds determine whether the market truly breaks away from the original trading range.
Set execution conditions clearly: after breaking above 499.9, you need confirmation—not chasing just because you see a momentary surge; after dipping to 491.56, you need to see whether price can quickly reclaim—don’t just catch every drop. If the middle region doesn’t offer enough reward-to-risk, waiting is also part of the strategy.
Position management should distinguish between medium-term and short-term holdings. For existing medium-term positions, first check whether the structure is broken; don’t let repeated moves on a single 1-hour K-line affect you. For short-term positions, execute around support, resistance, and close confirmation. Those in cash (no position) don’t need to chase price in the middle of the range—waiting for a clearer location usually has the advantage.
Your trading plan must include invalidation conditions. If your judgment is correct, you can realize profits in stages. If your judgment is wrong, you must also be allowed to exit; you can’t use adding to position to disguise the fact that the original logic has changed. The market will update, and your viewpoint should adjust according to price evidence.
The real disagreement in this行情 is whether it will continue or revert back to the range. Will you wait for a breakout confirmation, or wait for a support retest? Share the price level you’re most focused on.
#ZcashDevelopersTargetNU7MainnetActivationNov5
Currently, 1 hour is -0.04% and 24 hours is -0.57%; the two timeframes have not formed sufficiently clear directional alignment. In a range market, the tolerance for chasing and killing trades is low. It’s more suitable to use the upper boundary to confirm direction and the lower boundary to confirm pullback/hold. The midline is only used as the strength/weakness dividing line.
The three price levels you need to track together are: midline 495.73, the upper confirmation level 499.9, and the lower defensive level 491.56. The midline determines short-term initiative, while the upper and lower bounds determine whether the market truly breaks away from the original trading range.
Set execution conditions clearly: after breaking above 499.9, you need confirmation—not chasing just because you see a momentary surge; after dipping to 491.56, you need to see whether price can quickly reclaim—don’t just catch every drop. If the middle region doesn’t offer enough reward-to-risk, waiting is also part of the strategy.
Position management should distinguish between medium-term and short-term holdings. For existing medium-term positions, first check whether the structure is broken; don’t let repeated moves on a single 1-hour K-line affect you. For short-term positions, execute around support, resistance, and close confirmation. Those in cash (no position) don’t need to chase price in the middle of the range—waiting for a clearer location usually has the advantage.
Your trading plan must include invalidation conditions. If your judgment is correct, you can realize profits in stages. If your judgment is wrong, you must also be allowed to exit; you can’t use adding to position to disguise the fact that the original logic has changed. The market will update, and your viewpoint should adjust according to price evidence.
The real disagreement in this行情 is whether it will continue or revert back to the range. Will you wait for a breakout confirmation, or wait for a support retest? Share the price level you’re most focused on.
#ZcashDevelopersTargetNU7MainnetActivationNov5
61
·
--
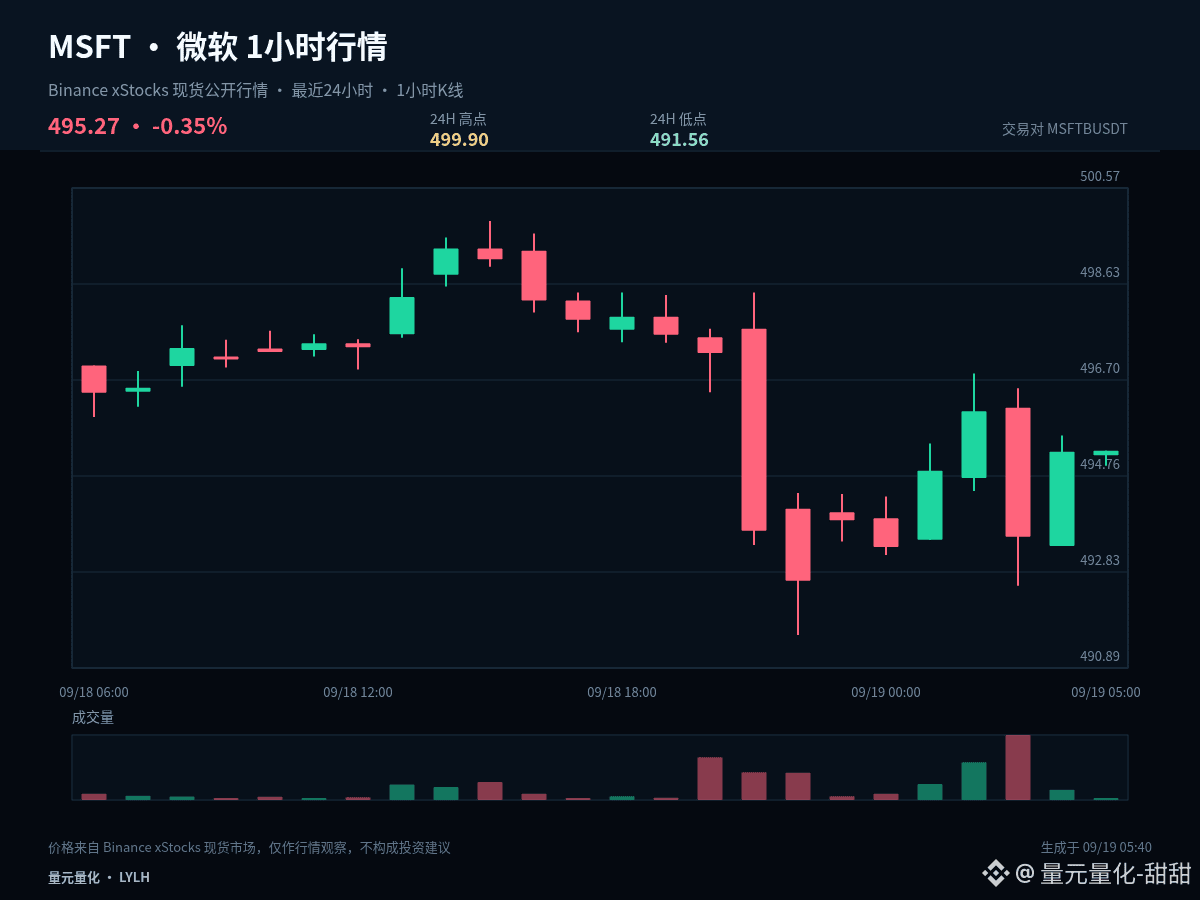
$MSFTB #MSFT Current price 495.27, +0.00% in the past 1 hour, -0.34% in the past 24 hours. Instead of deciding long or short first, it’s better to clearly list the possible paths and the corresponding actions.
For the current 1-hour +0.00% and 24-hour -0.34%, the two timeframes have not formed a sufficiently clear directional alignment. In a range-bound market, the tolerance for chasing or killing the trade is low. It’s more suitable to use the upper boundary confirmation for direction and the lower boundary confirmation for support/holding. The middle axis should only serve as the line separating relative strength.
The first path is upward: the price needs to break above 499.9 and form stable closes above it. Only then is it a valid confirmation if a subsequent retest holds without breaking. The second path is downward: if 491.56 is lost and the rebound fails to reclaim it, it indicates insufficient support. In that case, prioritize defense rather than rushing to add positions.
If the price continues to stay between 499.9 and 491.56, 495.73 should be regarded only as a short-term reference for initiative. The middle of the range has no clear advantage, so don’t force an entry just for the sake of being involved—wait for the market to show its direction.
Existing positions can be handled in stages according to key levels to avoid making all decisions at once. Those with no positions should wait for breakout confirmation or for a pullback to stabilize. For U.S. equity instruments, also note the volatility caused by trading-session transitions. Your plan should follow price conditions—don’t let emotions replace execution.
Any trading plan must include invalidation conditions. If the judgment is correct, you can realize it in portions. If the judgment is wrong, you must also allow yourself to exit—don’t use adding to disguise the fact that the original logic has changed. The market will update, and your view should adjust in line with the price evidence.
#HKMAPlansWholesaleCBDCByYearEnd
$MSFTB #MSFT Current price 495.27, +0.00% in the past 1 hour, -0.34% in the past 24 hours. Instead of deciding long or short first, it’s better to clearly list the possible paths and the corresponding actions.
For the current 1-hour +0.00% and 24-hour -0.34%, the two timeframes have not formed a sufficiently clear directional alignment. In a range-bound market, the tolerance for chasing or killing the trade is low. It’s more suitable to use the upper boundary confirmation for direction and the lower boundary confirmation for support/holding. The middle axis should only serve as the line separating relative strength.
The first path is upward: the price needs to break above 499.9 and form stable closes above it. Only then is it a valid confirmation if a subsequent retest holds without breaking. The second path is downward: if 491.56 is lost and the rebound fails to reclaim it, it indicates insufficient support. In that case, prioritize defense rather than rushing to add positions.
If the price continues to stay between 499.9 and 491.56, 495.73 should be regarded only as a short-term reference for initiative. The middle of the range has no clear advantage, so don’t force an entry just for the sake of being involved—wait for the market to show its direction.
Existing positions can be handled in stages according to key levels to avoid making all decisions at once. Those with no positions should wait for breakout confirmation or for a pullback to stabilize. For U.S. equity instruments, also note the volatility caused by trading-session transitions. Your plan should follow price conditions—don’t let emotions replace execution.
Any trading plan must include invalidation conditions. If the judgment is correct, you can realize it in portions. If the judgment is wrong, you must also allow yourself to exit—don’t use adding to disguise the fact that the original logic has changed. The market will update, and your view should adjust in line with the price evidence.
#HKMAPlansWholesaleCBDCByYearEnd
For the current 1-hour +0.00% and 24-hour -0.34%, the two timeframes have not formed a sufficiently clear directional alignment. In a range-bound market, the tolerance for chasing or killing the trade is low. It’s more suitable to use the upper boundary confirmation for direction and the lower boundary confirmation for support/holding. The middle axis should only serve as the line separating relative strength.
The first path is upward: the price needs to break above 499.9 and form stable closes above it. Only then is it a valid confirmation if a subsequent retest holds without breaking. The second path is downward: if 491.56 is lost and the rebound fails to reclaim it, it indicates insufficient support. In that case, prioritize defense rather than rushing to add positions.
If the price continues to stay between 499.9 and 491.56, 495.73 should be regarded only as a short-term reference for initiative. The middle of the range has no clear advantage, so don’t force an entry just for the sake of being involved—wait for the market to show its direction.
Existing positions can be handled in stages according to key levels to avoid making all decisions at once. Those with no positions should wait for breakout confirmation or for a pullback to stabilize. For U.S. equity instruments, also note the volatility caused by trading-session transitions. Your plan should follow price conditions—don’t let emotions replace execution.
Any trading plan must include invalidation conditions. If the judgment is correct, you can realize it in portions. If the judgment is wrong, you must also allow yourself to exit—don’t use adding to disguise the fact that the original logic has changed. The market will update, and your view should adjust in line with the price evidence.
#HKMAPlansWholesaleCBDCByYearEnd
3

·
--
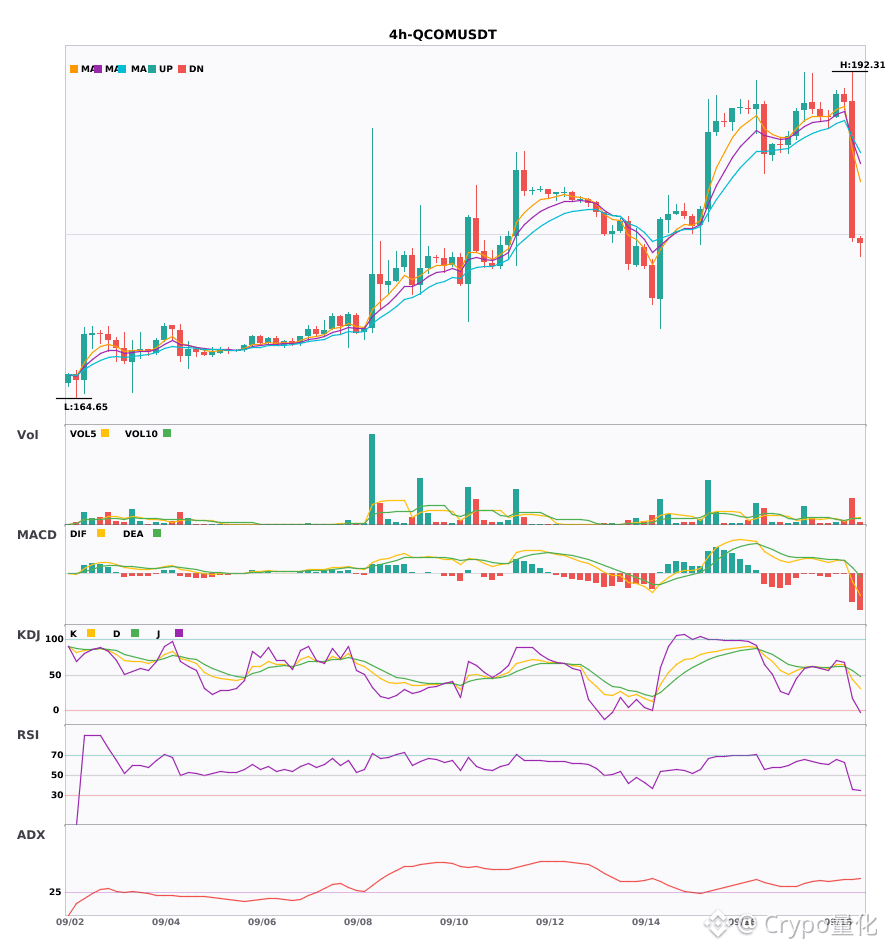
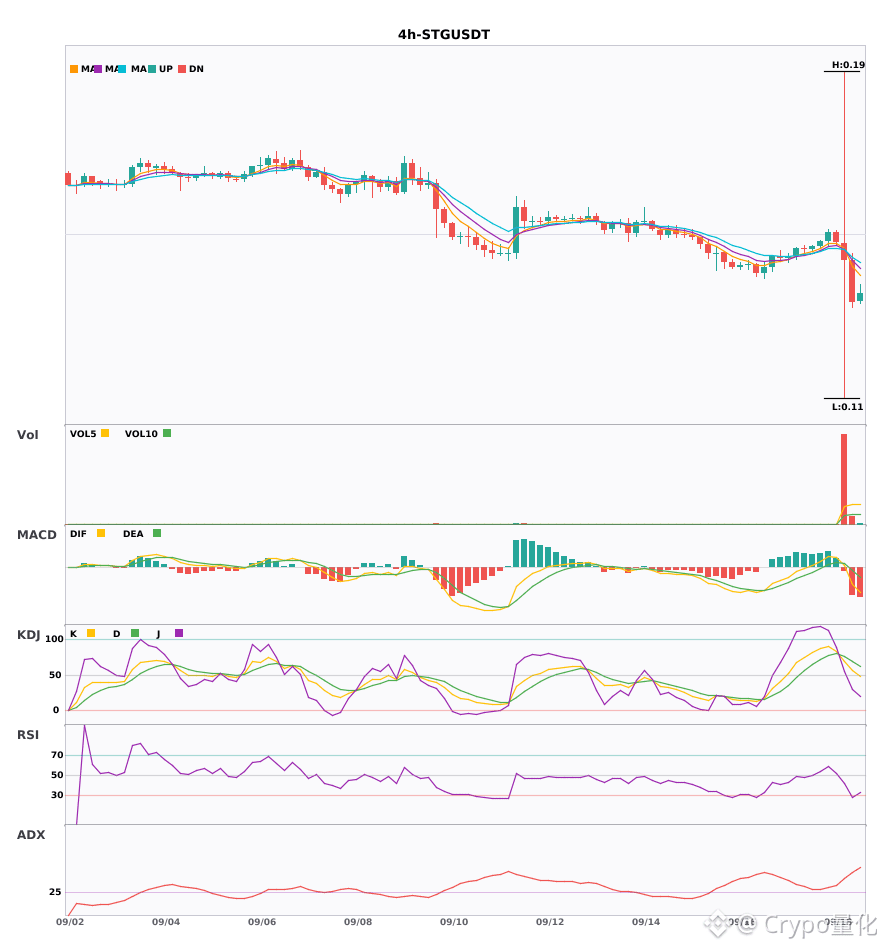
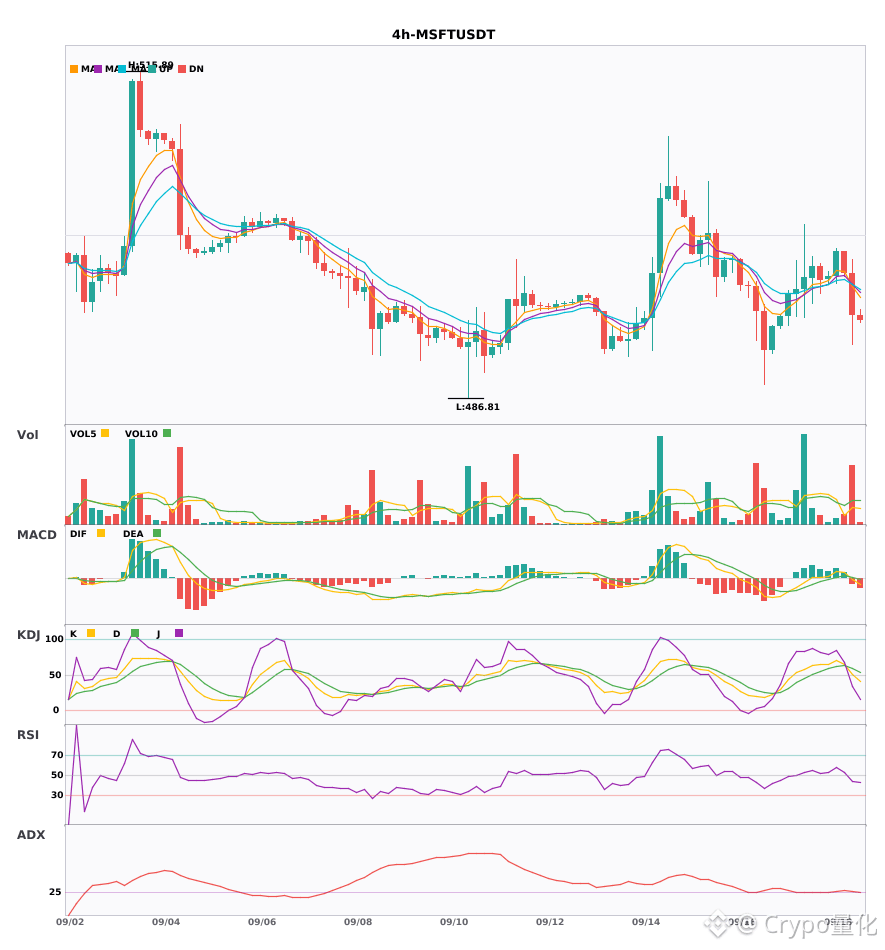
$QCOM $STG $MSFT 4 Hourly bearish bias. In the short term, watch out for pressure 🔥
════════════════════
🟢 $QCOM 4 Hour — Bearish signal
⚠️ Technicals: ADX(42) shows a clear trending market | MACD DIF breaks below the zero line, trend turns bearish | EMA5 crosses below EMA8, short-term turns bearish | KDJ forms a bearish cross, short-term looks bearish (K is 43.2, D is 56.0) | Volume spikes (4.0x)
════════════════════
🟢 $STG 4 Hour — Bearish signal
⚠️ Technicals: ADX(53) indicates a very strong trend (be wary of an overheated pullback) | MACD DIF breaks below the zero line, trend turns bearish | EMA5 crosses below EMA8, short-term turns bearish | KDJ is running strongly, bulls still in advantage (K is 55.8, D is 69.2) | Volume spikes (9.7x)
📢 Market update: Binance will support the token consolidation of StarGate Finance (STG) into LayerZero (ZRO).
════════════════════
🟢 $MSFT 4 Hour — Bearish signal
⚠️ Technicals: ADX(29) — the trend is forming, you may participate | MACD dead cross below zero, bearish momentum accelerates | EMA5 crosses below EMA8, short-term turns bearish | KDJ forms a bearish cross, short-term looks bearish (K is 50.9, D is 59.1) | Volume expands (2.5x)
════════════════════
🔔 Follow for first-hand alerts on market moves 🔔
#技术分析 #QCOM #STG #MSFT
📌 When trading, pay attention to whether the candlestick pattern matches
$QCOM $STG $MSFT 4 Hourly bearish bias. In the short term, watch out for pressure 🔥
════════════════════
🟢 $QCOM 4 Hour — Bearish signal
⚠️ Technicals: ADX(42) shows a clear trending market | MACD DIF breaks below the zero line, trend turns bearish | EMA5 crosses below EMA8, short-term turns bearish | KDJ forms a bearish cross, short-term looks bearish (K is 43.2, D is 56.0) | Volume spikes (4.0x)
════════════════════
🟢 $STG 4 Hour — Bearish signal
⚠️ Technicals: ADX(53) indicates a very strong trend (be wary of an overheated pullback) | MACD DIF breaks below the zero line, trend turns bearish | EMA5 crosses below EMA8, short-term turns bearish | KDJ is running strongly, bulls still in advantage (K is 55.8, D is 69.2) | Volume spikes (9.7x)
📢 Market update: Binance will support the token consolidation of StarGate Finance (STG) into LayerZero (ZRO).
════════════════════
🟢 $MSFT 4 Hour — Bearish signal
⚠️ Technicals: ADX(29) — the trend is forming, you may participate | MACD dead cross below zero, bearish momentum accelerates | EMA5 crosses below EMA8, short-term turns bearish | KDJ forms a bearish cross, short-term looks bearish (K is 50.9, D is 59.1) | Volume expands (2.5x)
════════════════════
🔔 Follow for first-hand alerts on market moves 🔔
#技术分析 #QCOM #STG #MSFT
📌 When trading, pay attention to whether the candlestick pattern matches
════════════════════
🟢 $QCOM 4 Hour — Bearish signal
⚠️ Technicals: ADX(42) shows a clear trending market | MACD DIF breaks below the zero line, trend turns bearish | EMA5 crosses below EMA8, short-term turns bearish | KDJ forms a bearish cross, short-term looks bearish (K is 43.2, D is 56.0) | Volume spikes (4.0x)
════════════════════
🟢 $STG 4 Hour — Bearish signal
⚠️ Technicals: ADX(53) indicates a very strong trend (be wary of an overheated pullback) | MACD DIF breaks below the zero line, trend turns bearish | EMA5 crosses below EMA8, short-term turns bearish | KDJ is running strongly, bulls still in advantage (K is 55.8, D is 69.2) | Volume spikes (9.7x)
📢 Market update: Binance will support the token consolidation of StarGate Finance (STG) into LayerZero (ZRO).
════════════════════
🟢 $MSFT 4 Hour — Bearish signal
⚠️ Technicals: ADX(29) — the trend is forming, you may participate | MACD dead cross below zero, bearish momentum accelerates | EMA5 crosses below EMA8, short-term turns bearish | KDJ forms a bearish cross, short-term looks bearish (K is 50.9, D is 59.1) | Volume expands (2.5x)
════════════════════
🔔 Follow for first-hand alerts on market moves 🔔
#技术分析 #QCOM #STG #MSFT
📌 When trading, pay attention to whether the candlestick pattern matches
137
·
--
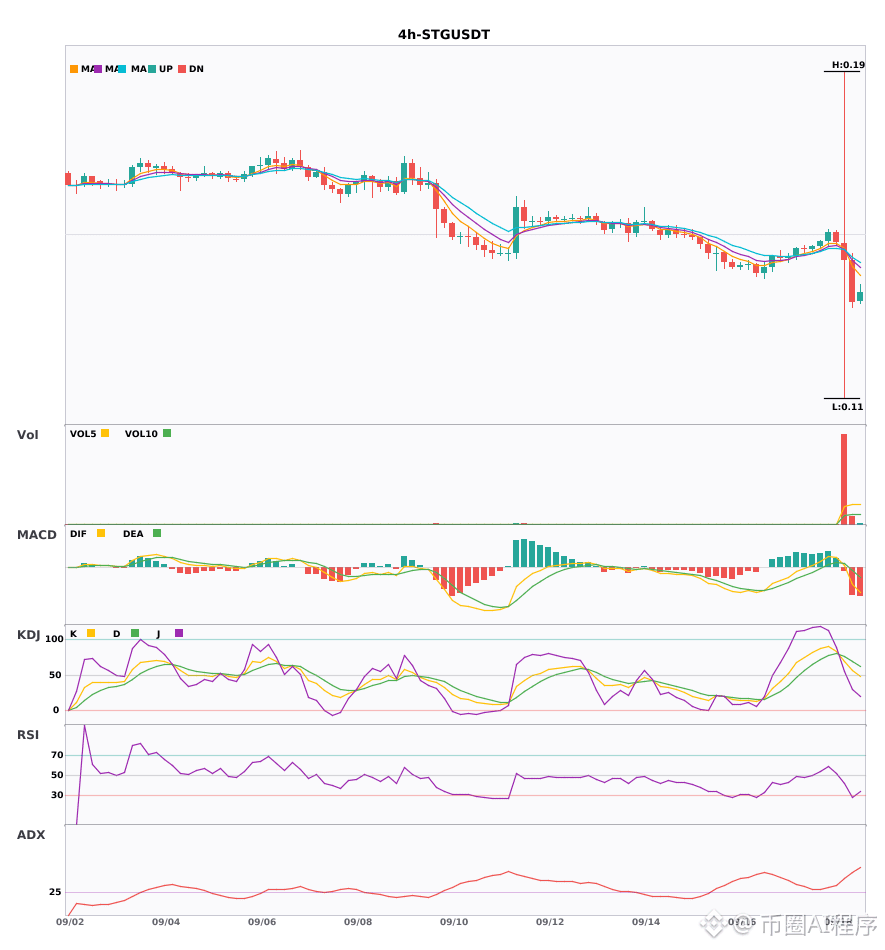
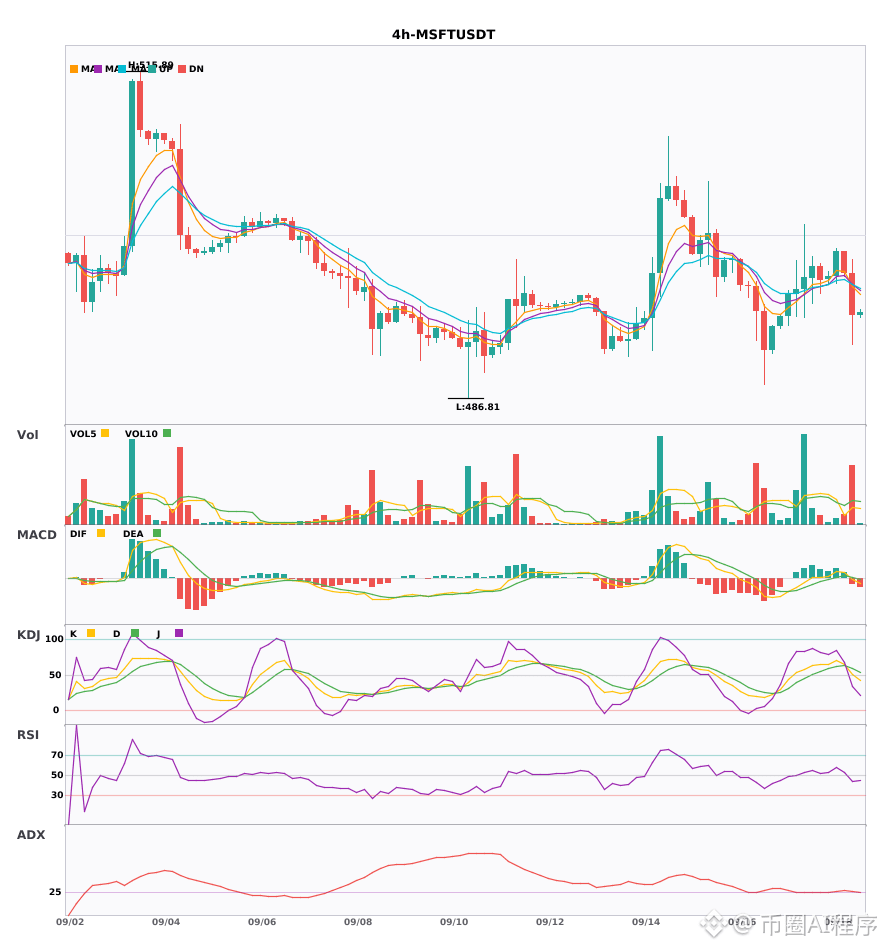
Multi-period resonance $STG/$MSFT four-hour weakness; daily bearish trend confirmation 🔥
════════════════════
🟢 $STG four-hour Bearish Signal
⚠️ Technical analysis: Daily bearish resonance confirmed | 4-hour entry: MACDDIF falls below the zero axis, trend turns bearish | EMA5 crosses below EMA8, short-term turns bearish | KDJ runs strongly; bulls dominate (K=55.8 D=69.2) | Volume surges (9.7x)
📢 Market dynamics: Binance will support the consolidation of the StarGate Finance (STG) token into the LayerZero (ZRO) token.
════════════════════
🟢 $MSFT four-hour Bearish Signal
⚠️ Technical analysis: Multi-period bearish resonance: daily bearish confirmation; 4-hour provides a signal to enter short | MACD forms a dead cross below zero with a 2.5x volume expansion; EMA5 crosses below EMA8; KDJ dead cross suggests near-term downside (K=50.9 D=59.1)
════════════════════
🔔 Watch for first-hand market alerts on sudden moves 🔔
#多周期共振 #STG #MSFT
📌 When trading, pay attention to whether the candlestick pattern matches
Multi-period resonance $STG /$MSFT four-hour weakness; daily bearish trend confirmation 🔥
════════════════════
🟢 $STG four-hour Bearish Signal
⚠️ Technical analysis: Daily bearish resonance confirmed | 4-hour entry: MACDDIF falls below the zero axis, trend turns bearish | EMA5 crosses below EMA8, short-term turns bearish | KDJ runs strongly; bulls dominate (K=55.8 D=69.2) | Volume surges (9.7x)
📢 Market dynamics: Binance will support the consolidation of the StarGate Finance (STG) token into the LayerZero (ZRO) token.
════════════════════
🟢 $MSFT four-hour Bearish Signal
⚠️ Technical analysis: Multi-period bearish resonance: daily bearish confirmation; 4-hour provides a signal to enter short | MACD forms a dead cross below zero with a 2.5x volume expansion; EMA5 crosses below EMA8; KDJ dead cross suggests near-term downside (K=50.9 D=59.1)
════════════════════
🔔 Watch for first-hand market alerts on sudden moves 🔔
#多周期共振 #STG #MSFT
📌 When trading, pay attention to whether the candlestick pattern matches
════════════════════
🟢 $STG four-hour Bearish Signal
⚠️ Technical analysis: Daily bearish resonance confirmed | 4-hour entry: MACDDIF falls below the zero axis, trend turns bearish | EMA5 crosses below EMA8, short-term turns bearish | KDJ runs strongly; bulls dominate (K=55.8 D=69.2) | Volume surges (9.7x)
📢 Market dynamics: Binance will support the consolidation of the StarGate Finance (STG) token into the LayerZero (ZRO) token.
════════════════════
🟢 $MSFT four-hour Bearish Signal
⚠️ Technical analysis: Multi-period bearish resonance: daily bearish confirmation; 4-hour provides a signal to enter short | MACD forms a dead cross below zero with a 2.5x volume expansion; EMA5 crosses below EMA8; KDJ dead cross suggests near-term downside (K=50.9 D=59.1)
════════════════════
🔔 Watch for first-hand market alerts on sudden moves 🔔
#多周期共振 #STG #MSFT
📌 When trading, pay attention to whether the candlestick pattern matches
44
·
--
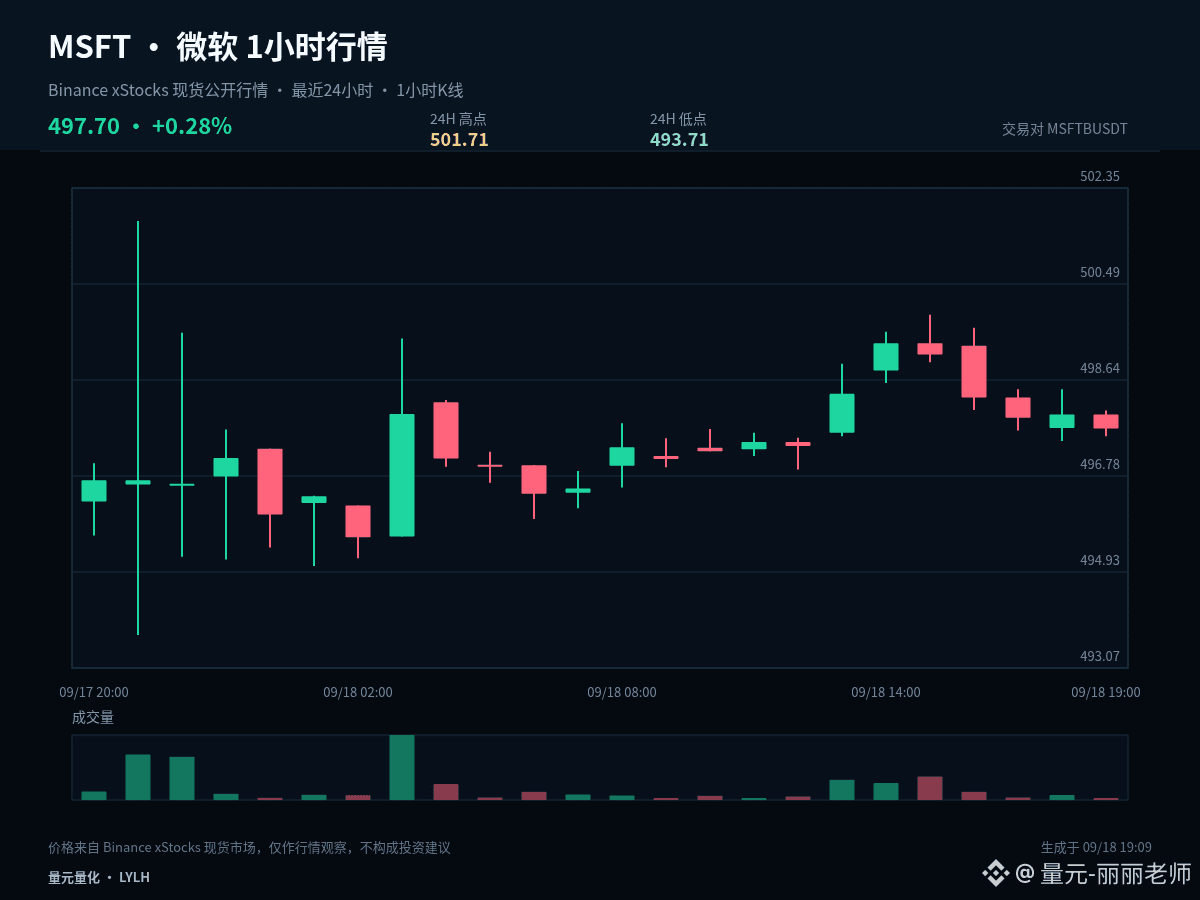
$MSFTB #MSFT Order book record: current price 497.7, 1 hour -0.05%, 24 hours +0.67%, and the amplitude over the past 24 hours is about 1.6%. First write down the current data and my judgment; later we’ll verify with the price action.
$MSFTB #MSFT is still trading back and forth within the past 24-hour range, with no clear directional advantage. The mid-range position is the hardest on patience—waiting for boundary signals is usually more effective.
For key price levels: 497.71 is the central axis that must be reclaimed for a weak recovery to hold. If the price can’t regain this level, any rebound should be viewed as a technical repair. Below, 493.71 still has a chance of being tested again; only after reclaiming the central axis do we have the right to further observe 501.71.
My scenario analysis isn’t betting on a single direction. A breakout above 501.71 that can be maintained means the upward space is reopened; a breakdown below 493.71 with no successful retest implies the structure weakens further. If it trades between the two, continue monitoring the closing prices on both sides of 497.71.
When reviewing, I’ll check three things: how the price reacts when it first approaches a key level, whether the 1-hour close completes the confirmation, and whether—after my judgment is invalidated—I adjusts according to the plan. Compared with only recording outcomes, these three items help uncover execution problems more effectively.
Risk control remains before the conclusion: execute only when conditions are met, and reassess promptly if the price invalidates the setup. The higher the volatility, the more restrained each position should be. The above is my market outlook based on current 1-hour and 24-hour data, and it does not constitute any promise of returns.
#HKMAPlansWholesaleCBDCByYearEnd
$MSFTB #MSFT Order book record: current price 497.7, 1 hour -0.05%, 24 hours +0.67%, and the amplitude over the past 24 hours is about 1.6%. First write down the current data and my judgment; later we’ll verify with the price action.
$MSFTB #MSFT is still trading back and forth within the past 24-hour range, with no clear directional advantage. The mid-range position is the hardest on patience—waiting for boundary signals is usually more effective.
For key price levels: 497.71 is the central axis that must be reclaimed for a weak recovery to hold. If the price can’t regain this level, any rebound should be viewed as a technical repair. Below, 493.71 still has a chance of being tested again; only after reclaiming the central axis do we have the right to further observe 501.71.
My scenario analysis isn’t betting on a single direction. A breakout above 501.71 that can be maintained means the upward space is reopened; a breakdown below 493.71 with no successful retest implies the structure weakens further. If it trades between the two, continue monitoring the closing prices on both sides of 497.71.
When reviewing, I’ll check three things: how the price reacts when it first approaches a key level, whether the 1-hour close completes the confirmation, and whether—after my judgment is invalidated—I adjusts according to the plan. Compared with only recording outcomes, these three items help uncover execution problems more effectively.
Risk control remains before the conclusion: execute only when conditions are met, and reassess promptly if the price invalidates the setup. The higher the volatility, the more restrained each position should be. The above is my market outlook based on current 1-hour and 24-hour data, and it does not constitute any promise of returns.
#HKMAPlansWholesaleCBDCByYearEnd
$MSFTB #MSFT is still trading back and forth within the past 24-hour range, with no clear directional advantage. The mid-range position is the hardest on patience—waiting for boundary signals is usually more effective.
For key price levels: 497.71 is the central axis that must be reclaimed for a weak recovery to hold. If the price can’t regain this level, any rebound should be viewed as a technical repair. Below, 493.71 still has a chance of being tested again; only after reclaiming the central axis do we have the right to further observe 501.71.
My scenario analysis isn’t betting on a single direction. A breakout above 501.71 that can be maintained means the upward space is reopened; a breakdown below 493.71 with no successful retest implies the structure weakens further. If it trades between the two, continue monitoring the closing prices on both sides of 497.71.
When reviewing, I’ll check three things: how the price reacts when it first approaches a key level, whether the 1-hour close completes the confirmation, and whether—after my judgment is invalidated—I adjusts according to the plan. Compared with only recording outcomes, these three items help uncover execution problems more effectively.
Risk control remains before the conclusion: execute only when conditions are met, and reassess promptly if the price invalidates the setup. The higher the volatility, the more restrained each position should be. The above is my market outlook based on current 1-hour and 24-hour data, and it does not constitute any promise of returns.
#HKMAPlansWholesaleCBDCByYearEnd
14
·
--
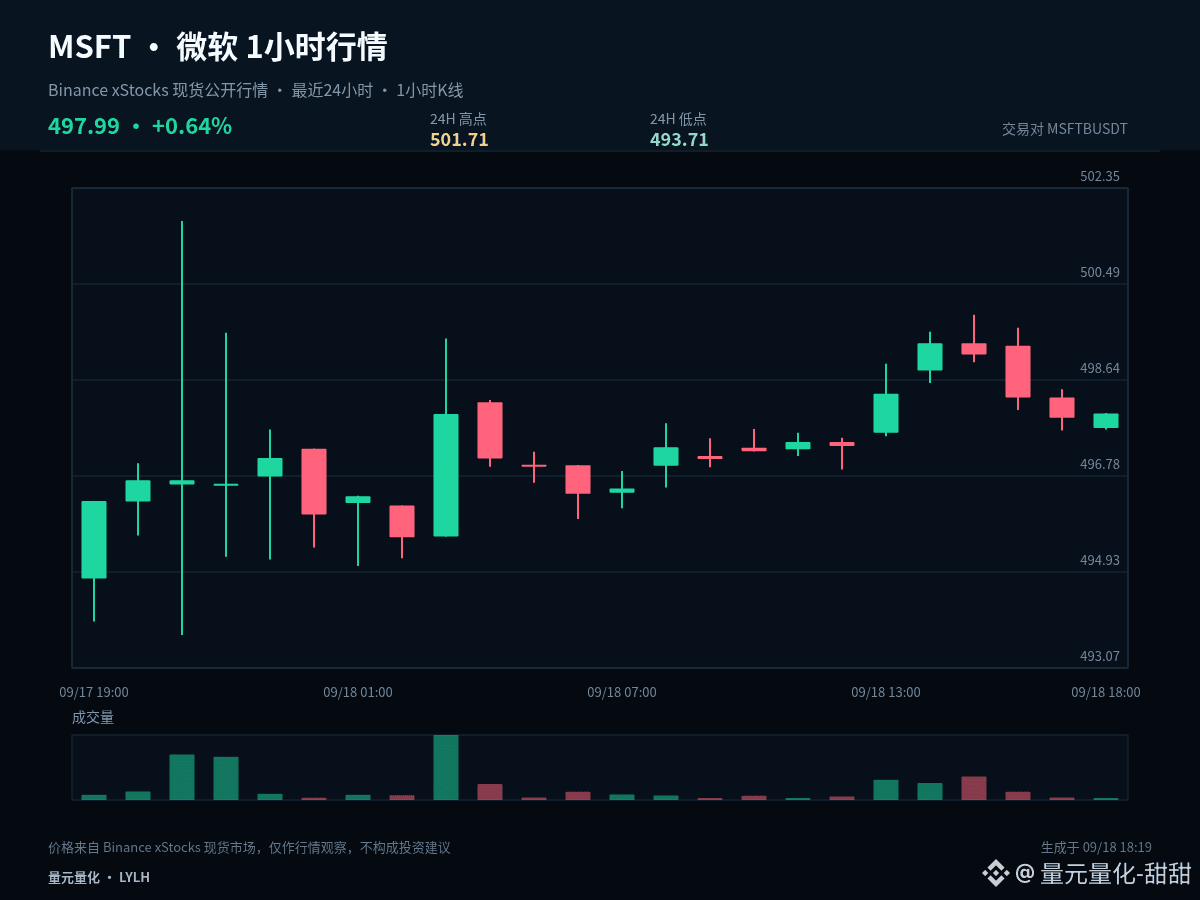
$MSFTB #MSFT If I had to keep just one observation price in this round, I’d choose 497.71. Current price is 497.99; in the last 1 hour +0.02%, in the last 24 hours +0.81%. The gain/loss around the midline can help filter a lot of intraday noise.
As long as the price stays above 497.71, it suggests the pullback is still being controlled by the bulls. The next target is to test the pressure at 501.71. If the price falls back below the midline again, the prior strength will be discounted—and we should also prevent further movement back to 493.71.
Current readings: 1 hour +0.02%, 24 hours +0.81%. The two timeframes have not formed a sufficiently clear same-direction alignment. In a range-bound market, the tolerance for chasing or cutting trades is low. It’s more suitable to confirm direction with the upper boundary, and confirm continuation/holding with the lower boundary. The midline should only be treated as the line separating strength and weakness.
Going forward, handle the path in three ways: if it effectively holds and stands above 501.71, wait for a pullback that doesn’t break, then reassess whether the move can continue; if it breaks down through 493.71, prioritize risk control and wait for new support; if it keeps oscillating around 497.71, treat it as rotation within the range and avoid repeatedly chasing direction from the middle.
For positions you already hold, manage them in stages based on key levels to avoid making all decisions at once. For those who are currently flat, wait for breakout confirmation or for a pullback to stabilize. For U.S. stock-related instruments, also watch for volatility caused by trading session transitions. Your plan should be based on price conditions—don’t let emotions replace execution.
Next, I’ll focus on tracking whether 497.71 can hold or fails. Do you lean more toward first testing 501.71, or first returning to 493.71? Feel free to share your view and rationale.
#SPGlobalToAcquireOpenZeppelin
$MSFTB #MSFT If I had to keep just one observation price in this round, I’d choose 497.71. Current price is 497.99; in the last 1 hour +0.02%, in the last 24 hours +0.81%. The gain/loss around the midline can help filter a lot of intraday noise.
As long as the price stays above 497.71, it suggests the pullback is still being controlled by the bulls. The next target is to test the pressure at 501.71. If the price falls back below the midline again, the prior strength will be discounted—and we should also prevent further movement back to 493.71.
Current readings: 1 hour +0.02%, 24 hours +0.81%. The two timeframes have not formed a sufficiently clear same-direction alignment. In a range-bound market, the tolerance for chasing or cutting trades is low. It’s more suitable to confirm direction with the upper boundary, and confirm continuation/holding with the lower boundary. The midline should only be treated as the line separating strength and weakness.
Going forward, handle the path in three ways: if it effectively holds and stands above 501.71, wait for a pullback that doesn’t break, then reassess whether the move can continue; if it breaks down through 493.71, prioritize risk control and wait for new support; if it keeps oscillating around 497.71, treat it as rotation within the range and avoid repeatedly chasing direction from the middle.
For positions you already hold, manage them in stages based on key levels to avoid making all decisions at once. For those who are currently flat, wait for breakout confirmation or for a pullback to stabilize. For U.S. stock-related instruments, also watch for volatility caused by trading session transitions. Your plan should be based on price conditions—don’t let emotions replace execution.
Next, I’ll focus on tracking whether 497.71 can hold or fails. Do you lean more toward first testing 501.71, or first returning to 493.71? Feel free to share your view and rationale.
#SPGlobalToAcquireOpenZeppelin
As long as the price stays above 497.71, it suggests the pullback is still being controlled by the bulls. The next target is to test the pressure at 501.71. If the price falls back below the midline again, the prior strength will be discounted—and we should also prevent further movement back to 493.71.
Current readings: 1 hour +0.02%, 24 hours +0.81%. The two timeframes have not formed a sufficiently clear same-direction alignment. In a range-bound market, the tolerance for chasing or cutting trades is low. It’s more suitable to confirm direction with the upper boundary, and confirm continuation/holding with the lower boundary. The midline should only be treated as the line separating strength and weakness.
Going forward, handle the path in three ways: if it effectively holds and stands above 501.71, wait for a pullback that doesn’t break, then reassess whether the move can continue; if it breaks down through 493.71, prioritize risk control and wait for new support; if it keeps oscillating around 497.71, treat it as rotation within the range and avoid repeatedly chasing direction from the middle.
For positions you already hold, manage them in stages based on key levels to avoid making all decisions at once. For those who are currently flat, wait for breakout confirmation or for a pullback to stabilize. For U.S. stock-related instruments, also watch for volatility caused by trading session transitions. Your plan should be based on price conditions—don’t let emotions replace execution.
Next, I’ll focus on tracking whether 497.71 can hold or fails. Do you lean more toward first testing 501.71, or first returning to 493.71? Feel free to share your view and rationale.
#SPGlobalToAcquireOpenZeppelin
6

·
--
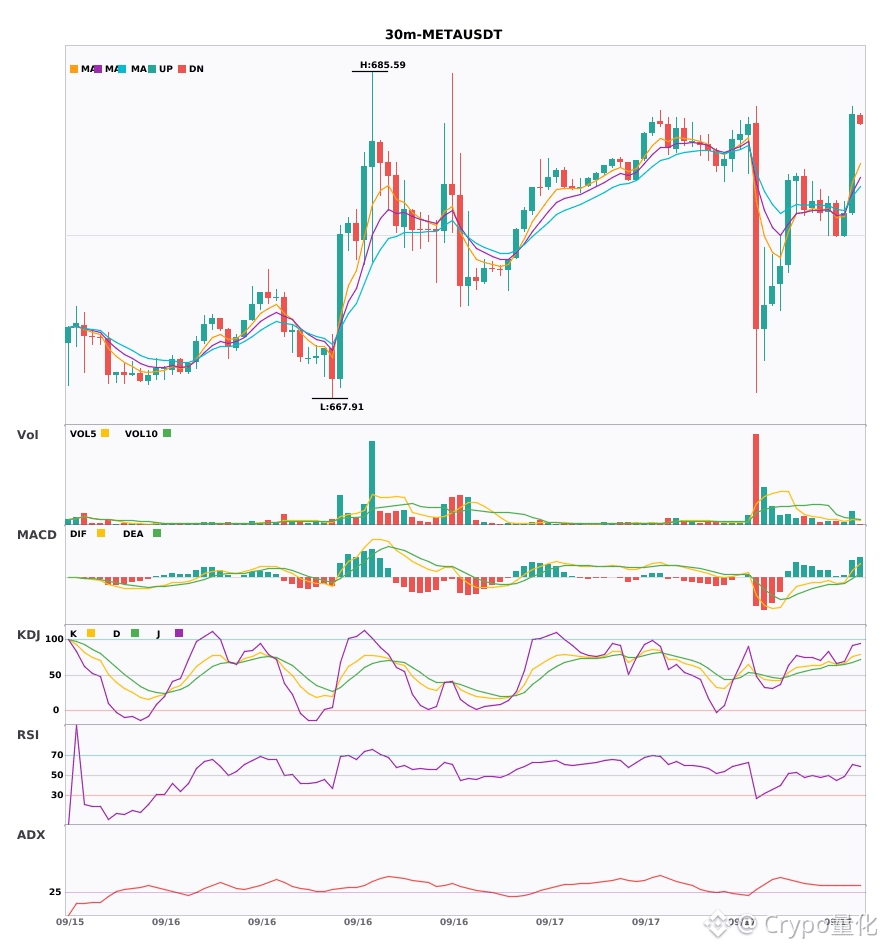
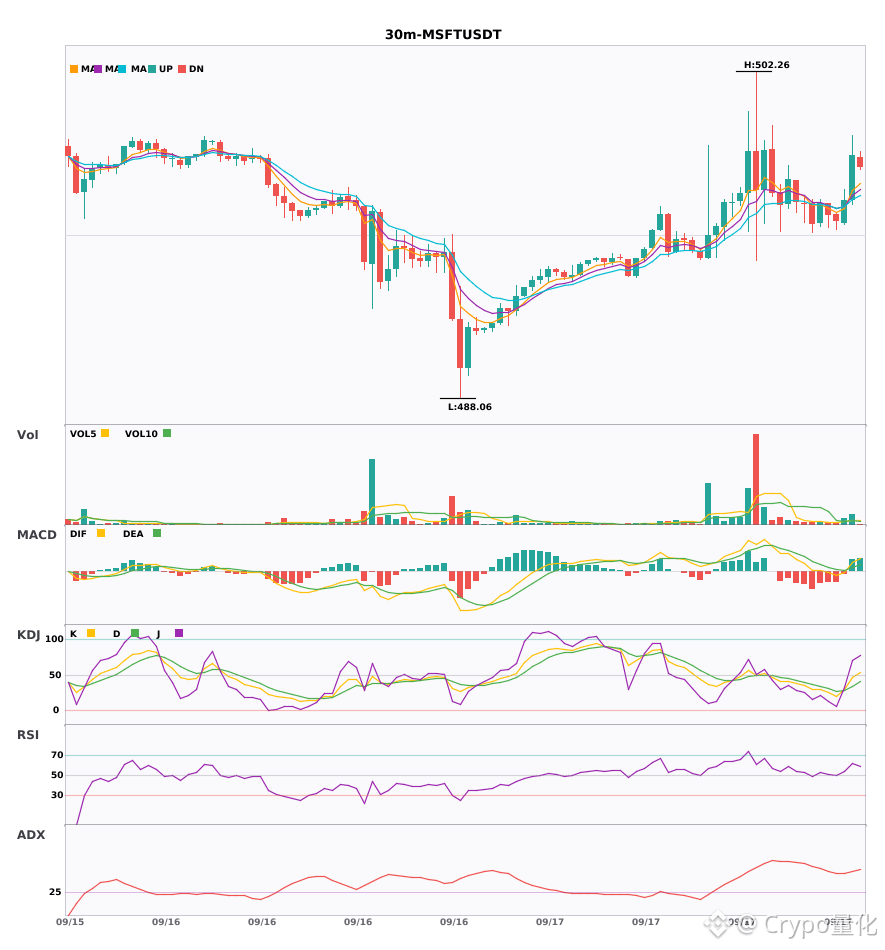
$META and $MSFT 30-minute chart both suddenly show two bullish signals🔥
════════════════════
🔴 $META 30-minute bullish signal
⚠️ Technicals: ADX (33) indicates a clear trending market | MACD DIF breaks above the zero line, trend turns bullish | EMA5 crosses above EMA8, short-term turns bullish | KDJ is running strongly, bulls dominate (K is 75.5, D is 67.9) | Volume expands (1.9x)
════════════════════
🔴 $MSFT 30-minute bullish signal
⚠️ Technicals: ADX (46) is a very strong trend (be cautious of overheated pullbacks) | MACD forms a golden cross above zero, bullish momentum released | EMA5 crosses above EMA8, short-term turns bullish | KDJ is weaker, bears dominate (K is 46.0, D is 34.2) | Volume expands (2.4x)
════════════════════
🔔 Watch for first-hand market updates and sudden moves 🔔
#技术分析 #META #MSFT
📌 When trading, pay attention to whether the candlestick pattern matches
$META and $MSFT 30-minute chart both suddenly show two bullish signals🔥
════════════════════
🔴 $META 30-minute bullish signal
⚠️ Technicals: ADX (33) indicates a clear trending market | MACD DIF breaks above the zero line, trend turns bullish | EMA5 crosses above EMA8, short-term turns bullish | KDJ is running strongly, bulls dominate (K is 75.5, D is 67.9) | Volume expands (1.9x)
════════════════════
🔴 $MSFT 30-minute bullish signal
⚠️ Technicals: ADX (46) is a very strong trend (be cautious of overheated pullbacks) | MACD forms a golden cross above zero, bullish momentum released | EMA5 crosses above EMA8, short-term turns bullish | KDJ is weaker, bears dominate (K is 46.0, D is 34.2) | Volume expands (2.4x)
════════════════════
🔔 Watch for first-hand market updates and sudden moves 🔔
#技术分析 #META #MSFT
📌 When trading, pay attention to whether the candlestick pattern matches
════════════════════
🔴 $META 30-minute bullish signal
⚠️ Technicals: ADX (33) indicates a clear trending market | MACD DIF breaks above the zero line, trend turns bullish | EMA5 crosses above EMA8, short-term turns bullish | KDJ is running strongly, bulls dominate (K is 75.5, D is 67.9) | Volume expands (1.9x)
════════════════════
🔴 $MSFT 30-minute bullish signal
⚠️ Technicals: ADX (46) is a very strong trend (be cautious of overheated pullbacks) | MACD forms a golden cross above zero, bullish momentum released | EMA5 crosses above EMA8, short-term turns bullish | KDJ is weaker, bears dominate (K is 46.0, D is 34.2) | Volume expands (2.4x)
════════════════════
🔔 Watch for first-hand market updates and sudden moves 🔔
#技术分析 #META #MSFT
📌 When trading, pay attention to whether the candlestick pattern matches
36
·
--
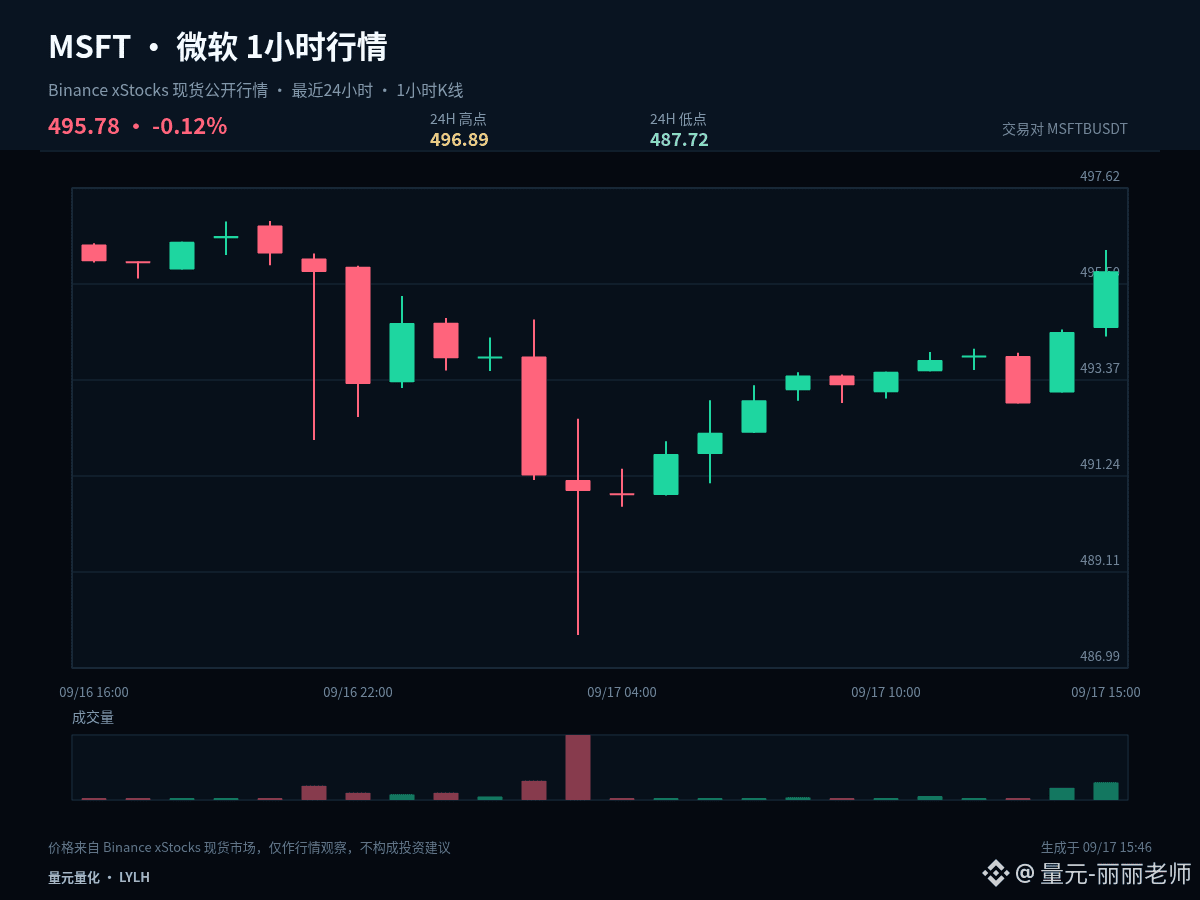
$MSFTB #MSFT In a strong market, pullbacks often reveal the real order flow more clearly than an accelerated rally. Currently, the 1-hour change is +0.27% and the 24-hour change is -0.20%. We need to determine whether this is a normal cool-down or a structural weakening.
The current price is near the upper band of the last 24 hours’ range: 1 hour +0.27%, 24 hours -0.20%. In the high zone, the most important thing is to confirm acceptance after a breakout. If the price can stay above the upper band, it shows the market acknowledges a higher range; if it briefly pierces and then quickly reclaims, we need to guard against a false breakout.
Short-term dominance has not been clearly broken yet. 492.305 is the primary benchmark for the quality of the pullback. Hold it first, then test 496.89—this would indicate a relatively strong consolidation. If it breaks below the midline and remains there, then the observation focus should be shifted down to 487.72.
My scenario analysis is not betting on a single direction. A breakout above 496.89 and the ability to hold it indicates that upside space has been reopened. Breaking below 487.72 and failing to reclaim it after a retest indicates further structural deterioration. If price remains between the two, continue to watch the closing behavior on both sides around 492.305.
Position management must distinguish between swing trades and short-term trades. For existing swing positions, first check whether the structure is broken; don’t be repeatedly influenced by a single 1-hour candlestick. For short-term positions, execute around support, resistance, and confirmation at the close. If you are in cash (no position), there’s no need to chase near the middle of the range—waiting for a clearer location usually provides an advantage.
A trading plan must include invalidation conditions. If the judgment is correct, you can realize profits in stages; if it’s wrong, you must allow yourself to exit. Don’t use adding positions to conceal the fact that the original logic has already changed. The market will update, and your viewpoint should adjust based on price evidence.
#AmazonGetsWarrantsToBuyGeneracStock
$MSFTB #MSFT In a strong market, pullbacks often reveal the real order flow more clearly than an accelerated rally. Currently, the 1-hour change is +0.27% and the 24-hour change is -0.20%. We need to determine whether this is a normal cool-down or a structural weakening.
The current price is near the upper band of the last 24 hours’ range: 1 hour +0.27%, 24 hours -0.20%. In the high zone, the most important thing is to confirm acceptance after a breakout. If the price can stay above the upper band, it shows the market acknowledges a higher range; if it briefly pierces and then quickly reclaims, we need to guard against a false breakout.
Short-term dominance has not been clearly broken yet. 492.305 is the primary benchmark for the quality of the pullback. Hold it first, then test 496.89—this would indicate a relatively strong consolidation. If it breaks below the midline and remains there, then the observation focus should be shifted down to 487.72.
My scenario analysis is not betting on a single direction. A breakout above 496.89 and the ability to hold it indicates that upside space has been reopened. Breaking below 487.72 and failing to reclaim it after a retest indicates further structural deterioration. If price remains between the two, continue to watch the closing behavior on both sides around 492.305.
Position management must distinguish between swing trades and short-term trades. For existing swing positions, first check whether the structure is broken; don’t be repeatedly influenced by a single 1-hour candlestick. For short-term positions, execute around support, resistance, and confirmation at the close. If you are in cash (no position), there’s no need to chase near the middle of the range—waiting for a clearer location usually provides an advantage.
A trading plan must include invalidation conditions. If the judgment is correct, you can realize profits in stages; if it’s wrong, you must allow yourself to exit. Don’t use adding positions to conceal the fact that the original logic has already changed. The market will update, and your viewpoint should adjust based on price evidence.
#AmazonGetsWarrantsToBuyGeneracStock
The current price is near the upper band of the last 24 hours’ range: 1 hour +0.27%, 24 hours -0.20%. In the high zone, the most important thing is to confirm acceptance after a breakout. If the price can stay above the upper band, it shows the market acknowledges a higher range; if it briefly pierces and then quickly reclaims, we need to guard against a false breakout.
Short-term dominance has not been clearly broken yet. 492.305 is the primary benchmark for the quality of the pullback. Hold it first, then test 496.89—this would indicate a relatively strong consolidation. If it breaks below the midline and remains there, then the observation focus should be shifted down to 487.72.
My scenario analysis is not betting on a single direction. A breakout above 496.89 and the ability to hold it indicates that upside space has been reopened. Breaking below 487.72 and failing to reclaim it after a retest indicates further structural deterioration. If price remains between the two, continue to watch the closing behavior on both sides around 492.305.
Position management must distinguish between swing trades and short-term trades. For existing swing positions, first check whether the structure is broken; don’t be repeatedly influenced by a single 1-hour candlestick. For short-term positions, execute around support, resistance, and confirmation at the close. If you are in cash (no position), there’s no need to chase near the middle of the range—waiting for a clearer location usually provides an advantage.
A trading plan must include invalidation conditions. If the judgment is correct, you can realize profits in stages; if it’s wrong, you must allow yourself to exit. Don’t use adding positions to conceal the fact that the original logic has already changed. The market will update, and your viewpoint should adjust based on price evidence.
#AmazonGetsWarrantsToBuyGeneracStock
11
·
--
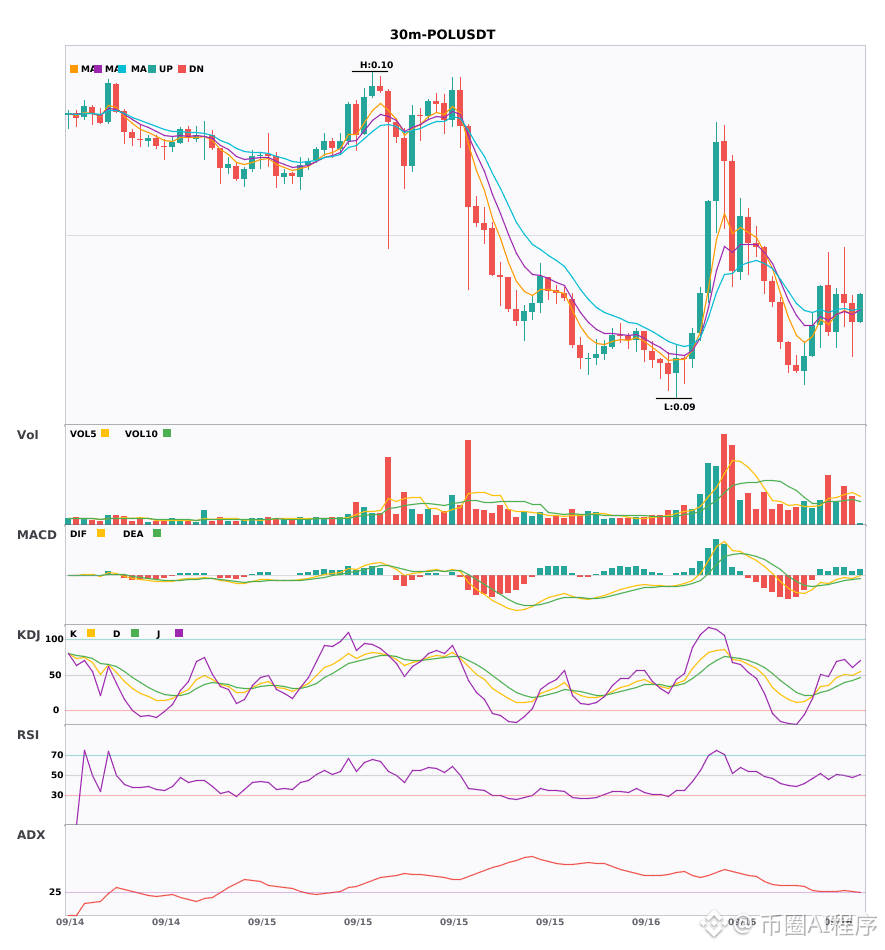
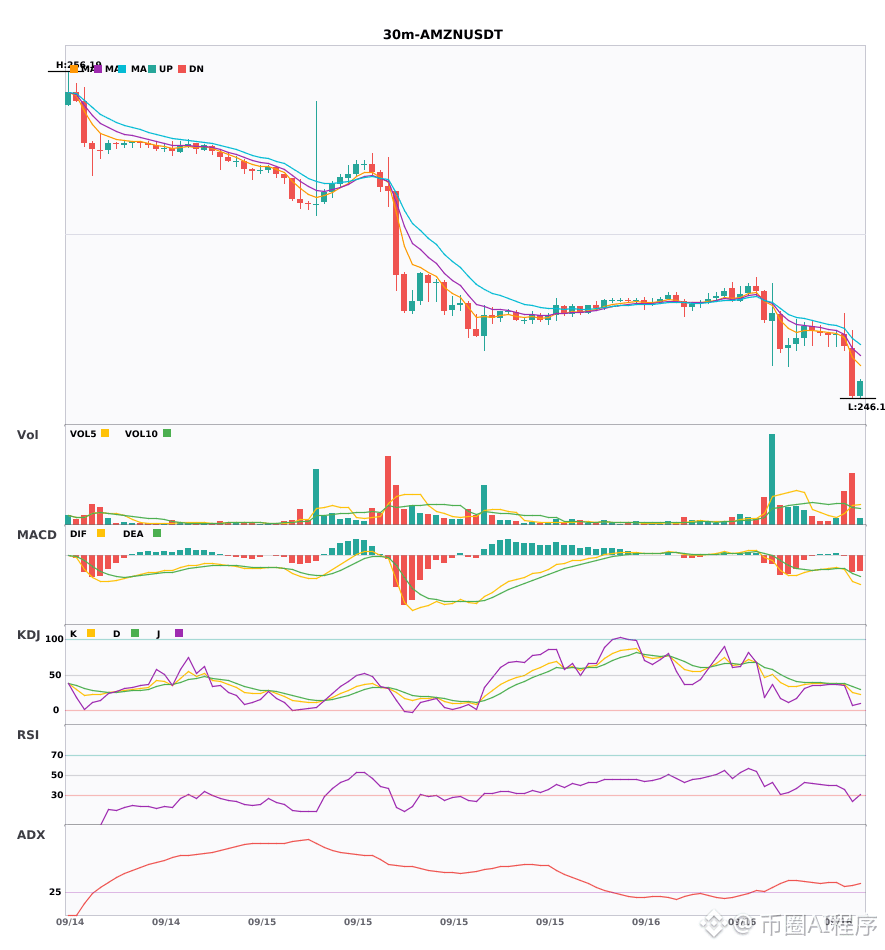
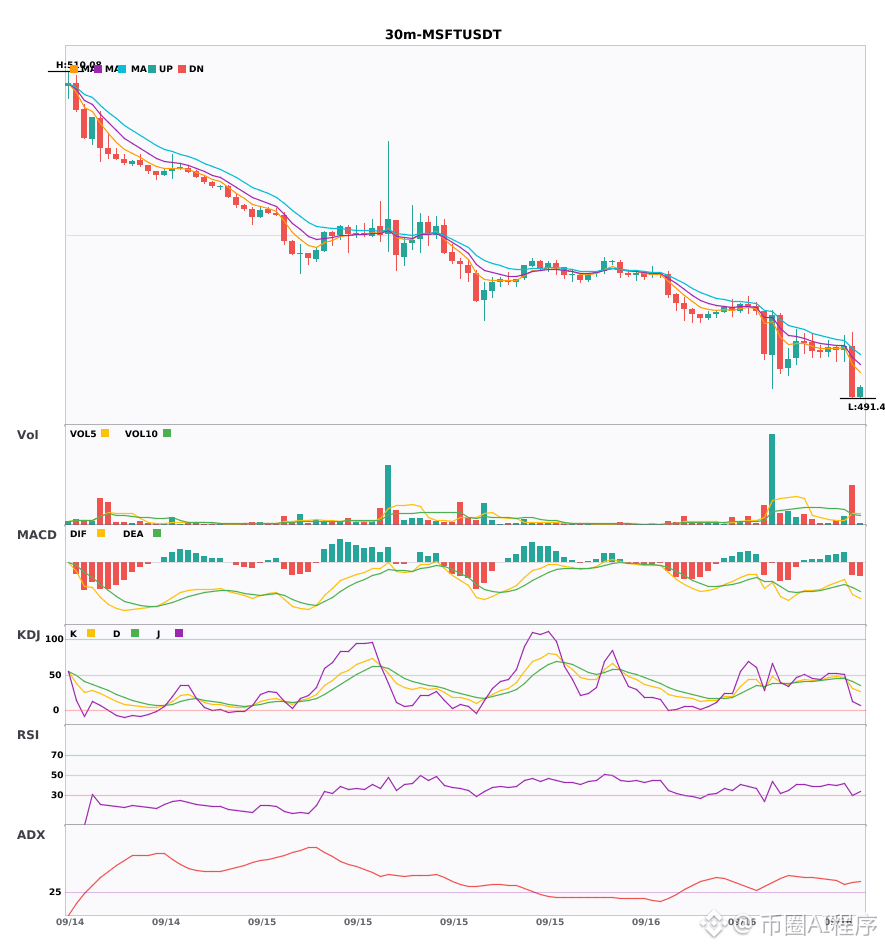
$POL / $AMZN / $MSFT 30 minutes short signal, 4-hour bearish trend confirmed 🔥
════════════════════
🟢 $POL 30-minute short signal
⚠️ Technicals: 4-hour bearish resonance confirmed | Enter on 30 minutes: EMA5 crossing below EMA8; short-term turns bearish | KDJ running weak, shorts dominant (K is 48.9, D is 42.8) | Volume expands (1.6x)
════════════════════
🟢 $AMZN 30-minute short signal
⚠️ Technicals: 4-hour bearish resonance confirmed | Enter on 30 minutes: MACD forms a dead cross below zero; shorts accelerate | EMA5 < EMA8 < EMA13 bearish alignment | KDJ running weak, shorts dominant (K is 37.3, D is 38.0) | Volume expands (1.5x)
════════════════════
🟢 $MSFT 3 30-minute short signal
⚠️ Technicals: 4-hour bearish resonance confirmed | Enter on 30 minutes: MACD dead cross below zero; shorts accelerate | EMA5 < EMA8 < EMA13 bearish alignment | KDJ dead cross; near-term bearish (K is 31.5, D is 40.7) | Volume explodes (3.8x)
════════════════════
🔔 Pay attention to get real-time first-hand market moves 🔔
#多周期共振 #POL #AMZN #MSFT
📌 When trading, make sure the candlestick pattern matches
$POL / $AMZN / $MSFT 30 minutes short signal, 4-hour bearish trend confirmed 🔥
════════════════════
🟢 $POL 30-minute short signal
⚠️ Technicals: 4-hour bearish resonance confirmed | Enter on 30 minutes: EMA5 crossing below EMA8; short-term turns bearish | KDJ running weak, shorts dominant (K is 48.9, D is 42.8) | Volume expands (1.6x)
════════════════════
🟢 $AMZN 30-minute short signal
⚠️ Technicals: 4-hour bearish resonance confirmed | Enter on 30 minutes: MACD forms a dead cross below zero; shorts accelerate | EMA5 < EMA8 < EMA13 bearish alignment | KDJ running weak, shorts dominant (K is 37.3, D is 38.0) | Volume expands (1.5x)
════════════════════
🟢 $MSFT 3 30-minute short signal
⚠️ Technicals: 4-hour bearish resonance confirmed | Enter on 30 minutes: MACD dead cross below zero; shorts accelerate | EMA5 < EMA8 < EMA13 bearish alignment | KDJ dead cross; near-term bearish (K is 31.5, D is 40.7) | Volume explodes (3.8x)
════════════════════
🔔 Pay attention to get real-time first-hand market moves 🔔
#多周期共振 #POL #AMZN #MSFT
📌 When trading, make sure the candlestick pattern matches
════════════════════
🟢 $POL 30-minute short signal
⚠️ Technicals: 4-hour bearish resonance confirmed | Enter on 30 minutes: EMA5 crossing below EMA8; short-term turns bearish | KDJ running weak, shorts dominant (K is 48.9, D is 42.8) | Volume expands (1.6x)
════════════════════
🟢 $AMZN 30-minute short signal
⚠️ Technicals: 4-hour bearish resonance confirmed | Enter on 30 minutes: MACD forms a dead cross below zero; shorts accelerate | EMA5 < EMA8 < EMA13 bearish alignment | KDJ running weak, shorts dominant (K is 37.3, D is 38.0) | Volume expands (1.5x)
════════════════════
🟢 $MSFT 3 30-minute short signal
⚠️ Technicals: 4-hour bearish resonance confirmed | Enter on 30 minutes: MACD dead cross below zero; shorts accelerate | EMA5 < EMA8 < EMA13 bearish alignment | KDJ dead cross; near-term bearish (K is 31.5, D is 40.7) | Volume explodes (3.8x)
════════════════════
🔔 Pay attention to get real-time first-hand market moves 🔔
#多周期共振 #POL #AMZN #MSFT
📌 When trading, make sure the candlestick pattern matches
55
·
--
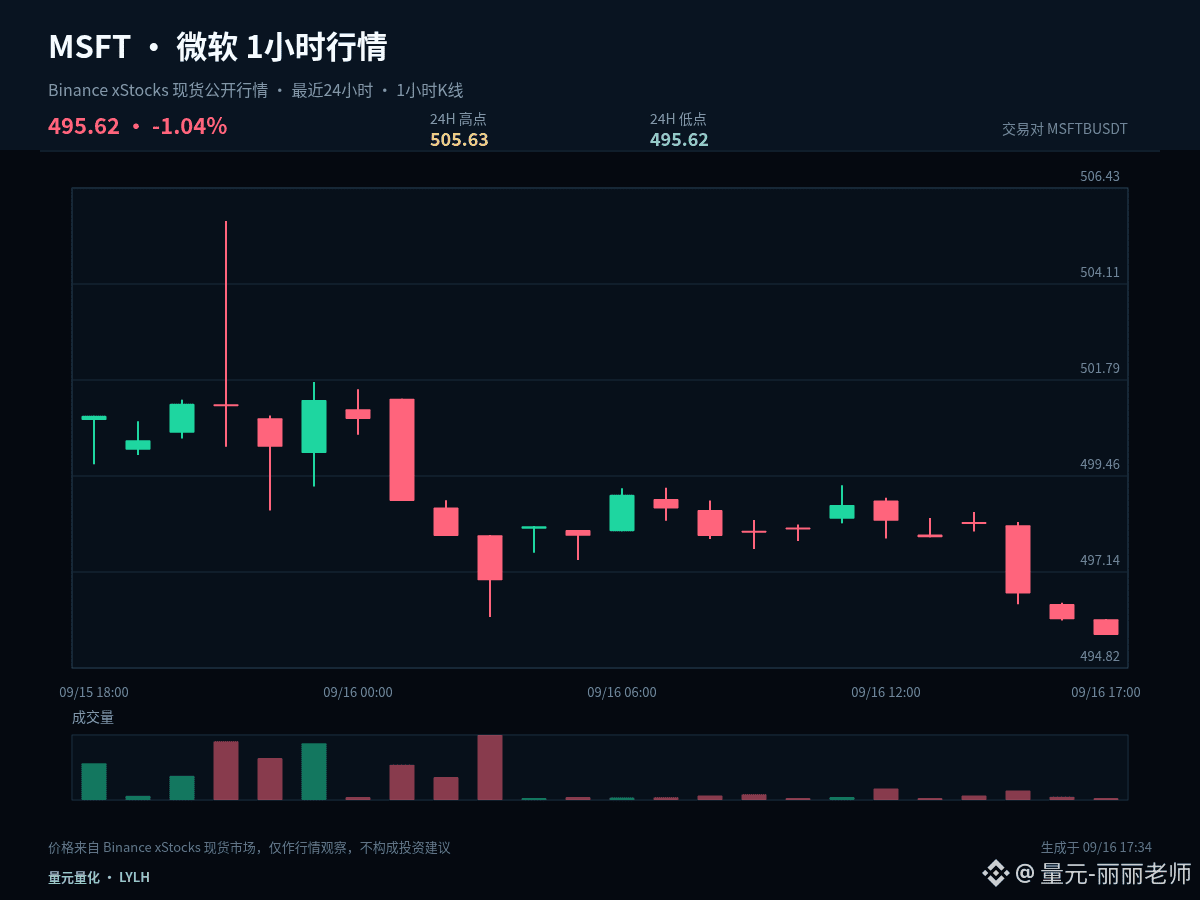
Entering the market only after the hype surrounding $MSFTB #MSFT has built up requires careful assessment of its current position. Currently, it's down 0.08% in the 1-hour chart and down 0.81% in the 24-hour chart; the already completed price action cannot be assumed to be replicable.
$MSFTB #MSFT has returned to near its 24-hour low. The next step is to observe the weakening of selling pressure and confirmation of support. Don't rush to predict a reversal until a bottoming structure is established.
In a weak market, it's easy to mistake a rebound for a reversal. Until 500.625 is recovered, observe the recovery; if it breaks below 495.62, it indicates a lack of effective support below.
The subsequent path can be handled in three ways: If it effectively holds above 505.63, wait for a pullback that doesn't break below before assessing the continuation; if it breaks below 495.62, prioritize risk control and wait for new support; if it continues to oscillate around 500.625, treat it as a range-bound trading pattern and avoid repeatedly chasing the direction in the middle.
Position management should distinguish between medium-term and short-term. For existing medium-term positions, first check if the structure is broken, don't be repeatedly influenced by a single 1-hour candlestick; short-term positions should be executed based on support, resistance, and closing confirmation. Those without positions should not chase prices in the middle of the range; waiting for a clearer position is usually more advantageous.
Missing a move won't directly cause a loss; chasing at the end of a fluctuation without a plan will put your position in a passive position. The focus of short-term positions is not predicting every candlestick, but ensuring that entry, reduction, and exit are based on evidence. Trade less without confirmation; if key levels fail, revise the plan, control individual risk first, then consider subsequent potential gains.
#MSTRTradingVolumeSurpassesMorganStanley
Entering the market only after the hype surrounding $MSFTB #MSFT has built up requires careful assessment of its current position. Currently, it's down 0.08% in the 1-hour chart and down 0.81% in the 24-hour chart; the already completed price action cannot be assumed to be replicable.
$MSFTB #MSFT has returned to near its 24-hour low. The next step is to observe the weakening of selling pressure and confirmation of support. Don't rush to predict a reversal until a bottoming structure is established.
In a weak market, it's easy to mistake a rebound for a reversal. Until 500.625 is recovered, observe the recovery; if it breaks below 495.62, it indicates a lack of effective support below.
The subsequent path can be handled in three ways: If it effectively holds above 505.63, wait for a pullback that doesn't break below before assessing the continuation; if it breaks below 495.62, prioritize risk control and wait for new support; if it continues to oscillate around 500.625, treat it as a range-bound trading pattern and avoid repeatedly chasing the direction in the middle.
Position management should distinguish between medium-term and short-term. For existing medium-term positions, first check if the structure is broken, don't be repeatedly influenced by a single 1-hour candlestick; short-term positions should be executed based on support, resistance, and closing confirmation. Those without positions should not chase prices in the middle of the range; waiting for a clearer position is usually more advantageous.
Missing a move won't directly cause a loss; chasing at the end of a fluctuation without a plan will put your position in a passive position. The focus of short-term positions is not predicting every candlestick, but ensuring that entry, reduction, and exit are based on evidence. Trade less without confirmation; if key levels fail, revise the plan, control individual risk first, then consider subsequent potential gains.
#MSTRTradingVolumeSurpassesMorganStanley
$MSFTB #MSFT has returned to near its 24-hour low. The next step is to observe the weakening of selling pressure and confirmation of support. Don't rush to predict a reversal until a bottoming structure is established.
In a weak market, it's easy to mistake a rebound for a reversal. Until 500.625 is recovered, observe the recovery; if it breaks below 495.62, it indicates a lack of effective support below.
The subsequent path can be handled in three ways: If it effectively holds above 505.63, wait for a pullback that doesn't break below before assessing the continuation; if it breaks below 495.62, prioritize risk control and wait for new support; if it continues to oscillate around 500.625, treat it as a range-bound trading pattern and avoid repeatedly chasing the direction in the middle.
Position management should distinguish between medium-term and short-term. For existing medium-term positions, first check if the structure is broken, don't be repeatedly influenced by a single 1-hour candlestick; short-term positions should be executed based on support, resistance, and closing confirmation. Those without positions should not chase prices in the middle of the range; waiting for a clearer position is usually more advantageous.
Missing a move won't directly cause a loss; chasing at the end of a fluctuation without a plan will put your position in a passive position. The focus of short-term positions is not predicting every candlestick, but ensuring that entry, reduction, and exit are based on evidence. Trade less without confirmation; if key levels fail, revise the plan, control individual risk first, then consider subsequent potential gains.
#MSTRTradingVolumeSurpassesMorganStanley
9
·
--
$MSFTB #MSFT Only after momentum heats up do we prepare to enter; we also need to assess the position first. In the current 1-hour window +0.23%, and in the 24-hour window -0.93%. The space that has already been traveled cannot simply be used as the next segment’s copyable space.
$MSFTB #MSFT A clear one-sided trend has not yet formed. The rhythm between the 1-hour and 24-hour timeframes is still in conflict. At this stage, attention should be placed on the boundaries of the range, not on the color of every single candlestick.
For the bulls, the more favorable rhythm is to return near 500.84, see sell pressure weaken, and then attempt again at 505.63. If it accelerates without a pullback, the risk-reward ratio of chasing the price declines.
My scenario analysis is not betting on only one direction. A break above 505.63 and the ability to hold it indicates that the upside room has been reopened; a fall below 496.05 and failure to reclaim it suggests the structure weakens further. If price moves within the space between the two, then continue to observe the closing results on both sides of 500.84.
Position management must differentiate between mid-term and short-term positions. For existing mid-term positions, first check whether the structure is broken; there’s no need to be repeatedly influenced by a single 1-hour candlestick. For short-term positions, execute around support, resistance, and confirmation by closes. If you are currently in cash, there’s no need to chase prices in the middle of the range—waiting for a clearer location usually has an advantage.
Missing a trading move doesn’t directly cause losses; chasing at the end of volatility without a plan is what makes positions passive. Risk control still comes before conclusions: execute only when conditions occur, and if the price invalidates the setup, reassess promptly. The larger the volatility, the more restrained each single position should be. The above is a盘面(market chart) projection based on current 1-hour and 24-hour data, and it does not constitute a promise of returns.
#StrategyMarketCapPassesFord
$MSFTB #MSFT Only after momentum heats up do we prepare to enter; we also need to assess the position first. In the current 1-hour window +0.23%, and in the 24-hour window -0.93%. The space that has already been traveled cannot simply be used as the next segment’s copyable space.
$MSFTB #MSFT A clear one-sided trend has not yet formed. The rhythm between the 1-hour and 24-hour timeframes is still in conflict. At this stage, attention should be placed on the boundaries of the range, not on the color of every single candlestick.
For the bulls, the more favorable rhythm is to return near 500.84, see sell pressure weaken, and then attempt again at 505.63. If it accelerates without a pullback, the risk-reward ratio of chasing the price declines.
My scenario analysis is not betting on only one direction. A break above 505.63 and the ability to hold it indicates that the upside room has been reopened; a fall below 496.05 and failure to reclaim it suggests the structure weakens further. If price moves within the space between the two, then continue to observe the closing results on both sides of 500.84.
Position management must differentiate between mid-term and short-term positions. For existing mid-term positions, first check whether the structure is broken; there’s no need to be repeatedly influenced by a single 1-hour candlestick. For short-term positions, execute around support, resistance, and confirmation by closes. If you are currently in cash, there’s no need to chase prices in the middle of the range—waiting for a clearer location usually has an advantage.
Missing a trading move doesn’t directly cause losses; chasing at the end of volatility without a plan is what makes positions passive. Risk control still comes before conclusions: execute only when conditions occur, and if the price invalidates the setup, reassess promptly. The larger the volatility, the more restrained each single position should be. The above is a盘面(market chart) projection based on current 1-hour and 24-hour data, and it does not constitute a promise of returns.
#StrategyMarketCapPassesFord
$MSFTB #MSFT A clear one-sided trend has not yet formed. The rhythm between the 1-hour and 24-hour timeframes is still in conflict. At this stage, attention should be placed on the boundaries of the range, not on the color of every single candlestick.
For the bulls, the more favorable rhythm is to return near 500.84, see sell pressure weaken, and then attempt again at 505.63. If it accelerates without a pullback, the risk-reward ratio of chasing the price declines.
My scenario analysis is not betting on only one direction. A break above 505.63 and the ability to hold it indicates that the upside room has been reopened; a fall below 496.05 and failure to reclaim it suggests the structure weakens further. If price moves within the space between the two, then continue to observe the closing results on both sides of 500.84.
Position management must differentiate between mid-term and short-term positions. For existing mid-term positions, first check whether the structure is broken; there’s no need to be repeatedly influenced by a single 1-hour candlestick. For short-term positions, execute around support, resistance, and confirmation by closes. If you are currently in cash, there’s no need to chase prices in the middle of the range—waiting for a clearer location usually has an advantage.
Missing a trading move doesn’t directly cause losses; chasing at the end of volatility without a plan is what makes positions passive. Risk control still comes before conclusions: execute only when conditions occur, and if the price invalidates the setup, reassess promptly. The larger the volatility, the more restrained each single position should be. The above is a盘面(market chart) projection based on current 1-hour and 24-hour data, and it does not constitute a promise of returns.
#StrategyMarketCapPassesFord
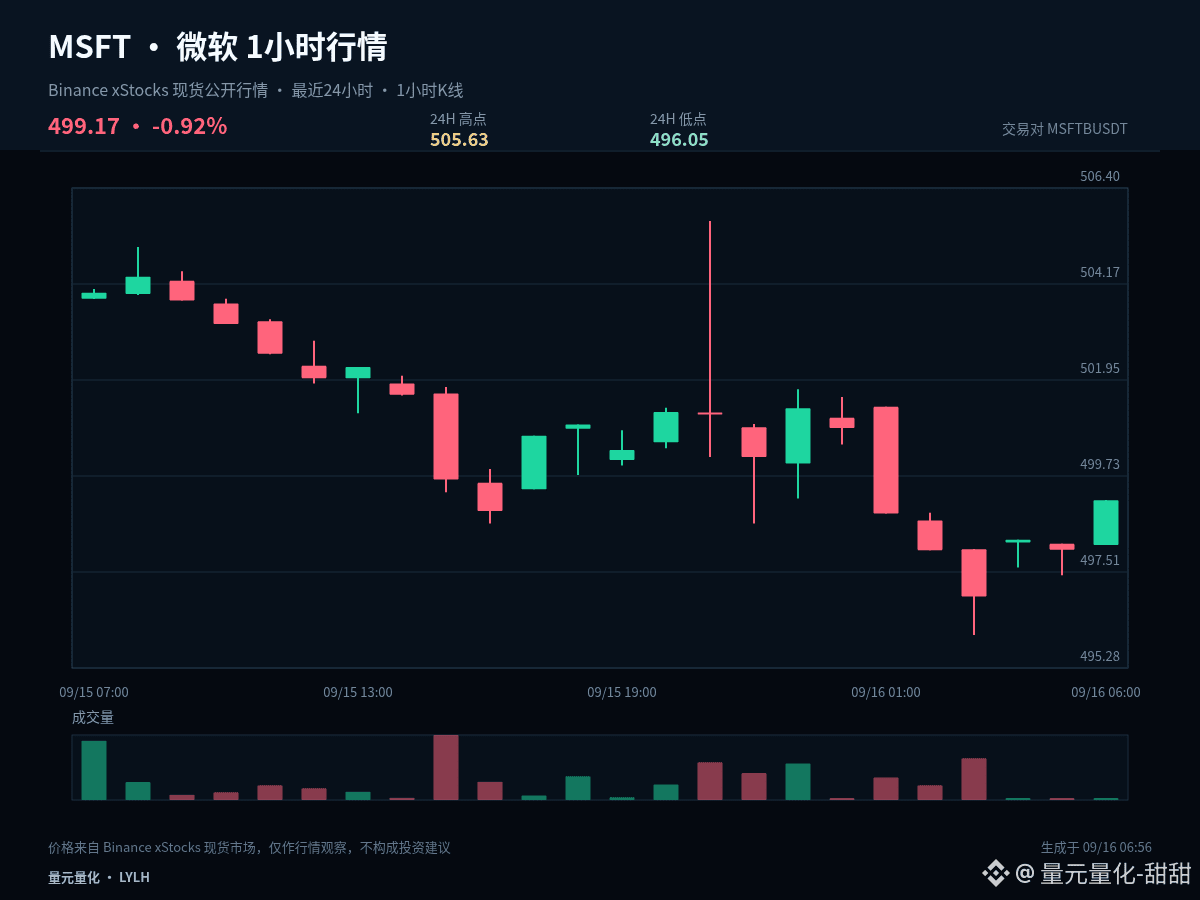
7
·
--
$MSFTB #MSFT In a strong trend, pullbacks often reveal the real underlying support better than accelerated rallies. The current 1-hour move is +0.19%, and the 24-hour move is -1.41%, so we need to judge whether this is normal cooling or a weakening structure.
The current 1-hour +0.19% and 24-hour -1.41% do not form a sufficiently clear alignment across the two timeframes. In range-bound conditions, chasing strength and selling weakness has a lower margin for error; it is more suitable to use the upper boundary to confirm direction, the lower boundary to confirm support, and the midpoint only as a dividing line between strength and weakness.
Short-term initiative has not been clearly broken. 500.84 is the primary standard for judging the quality of the pullback. Holding above it and then retesting 505.63 would count as relatively strong consolidation; falling below the midpoint and remaining there would require shifting attention down to 496.05.
My projection does not rely on a single direction. If price breaks above 505.63 and can hold there, it means upside room has reopened; if it breaks below 496.05 and fails to rebound, it means the structure is weakening further; if it trades between the two, continue watching how it closes on either side of 500.84.
Existing positions can be managed in stages according to key levels to avoid making a full decision all at once. Those with no position should wait for a breakout confirmation or a successful retest and stabilization. For U.S. stock-related names, also pay attention to volatility caused by trading session changes. The plan should be based on price conditions, not emotions.
The focus of short-term positioning is not to predict every candlestick, but to ensure entries, reductions, and exits all have a basis. If there is no confirmation, do less; if a key level fails, redraw the plan. First control the risk on each trade, then talk about the upside room ahead.
#ClarityActOddsHalveOnPolymarket
$MSFTB #MSFT In a strong trend, pullbacks often reveal the real underlying support better than accelerated rallies. The current 1-hour move is +0.19%, and the 24-hour move is -1.41%, so we need to judge whether this is normal cooling or a weakening structure.
The current 1-hour +0.19% and 24-hour -1.41% do not form a sufficiently clear alignment across the two timeframes. In range-bound conditions, chasing strength and selling weakness has a lower margin for error; it is more suitable to use the upper boundary to confirm direction, the lower boundary to confirm support, and the midpoint only as a dividing line between strength and weakness.
Short-term initiative has not been clearly broken. 500.84 is the primary standard for judging the quality of the pullback. Holding above it and then retesting 505.63 would count as relatively strong consolidation; falling below the midpoint and remaining there would require shifting attention down to 496.05.
My projection does not rely on a single direction. If price breaks above 505.63 and can hold there, it means upside room has reopened; if it breaks below 496.05 and fails to rebound, it means the structure is weakening further; if it trades between the two, continue watching how it closes on either side of 500.84.
Existing positions can be managed in stages according to key levels to avoid making a full decision all at once. Those with no position should wait for a breakout confirmation or a successful retest and stabilization. For U.S. stock-related names, also pay attention to volatility caused by trading session changes. The plan should be based on price conditions, not emotions.
The focus of short-term positioning is not to predict every candlestick, but to ensure entries, reductions, and exits all have a basis. If there is no confirmation, do less; if a key level fails, redraw the plan. First control the risk on each trade, then talk about the upside room ahead.
#ClarityActOddsHalveOnPolymarket
The current 1-hour +0.19% and 24-hour -1.41% do not form a sufficiently clear alignment across the two timeframes. In range-bound conditions, chasing strength and selling weakness has a lower margin for error; it is more suitable to use the upper boundary to confirm direction, the lower boundary to confirm support, and the midpoint only as a dividing line between strength and weakness.
Short-term initiative has not been clearly broken. 500.84 is the primary standard for judging the quality of the pullback. Holding above it and then retesting 505.63 would count as relatively strong consolidation; falling below the midpoint and remaining there would require shifting attention down to 496.05.
My projection does not rely on a single direction. If price breaks above 505.63 and can hold there, it means upside room has reopened; if it breaks below 496.05 and fails to rebound, it means the structure is weakening further; if it trades between the two, continue watching how it closes on either side of 500.84.
Existing positions can be managed in stages according to key levels to avoid making a full decision all at once. Those with no position should wait for a breakout confirmation or a successful retest and stabilization. For U.S. stock-related names, also pay attention to volatility caused by trading session changes. The plan should be based on price conditions, not emotions.
The focus of short-term positioning is not to predict every candlestick, but to ensure entries, reductions, and exits all have a basis. If there is no confirmation, do less; if a key level fails, redraw the plan. First control the risk on each trade, then talk about the upside room ahead.
#ClarityActOddsHalveOnPolymarket
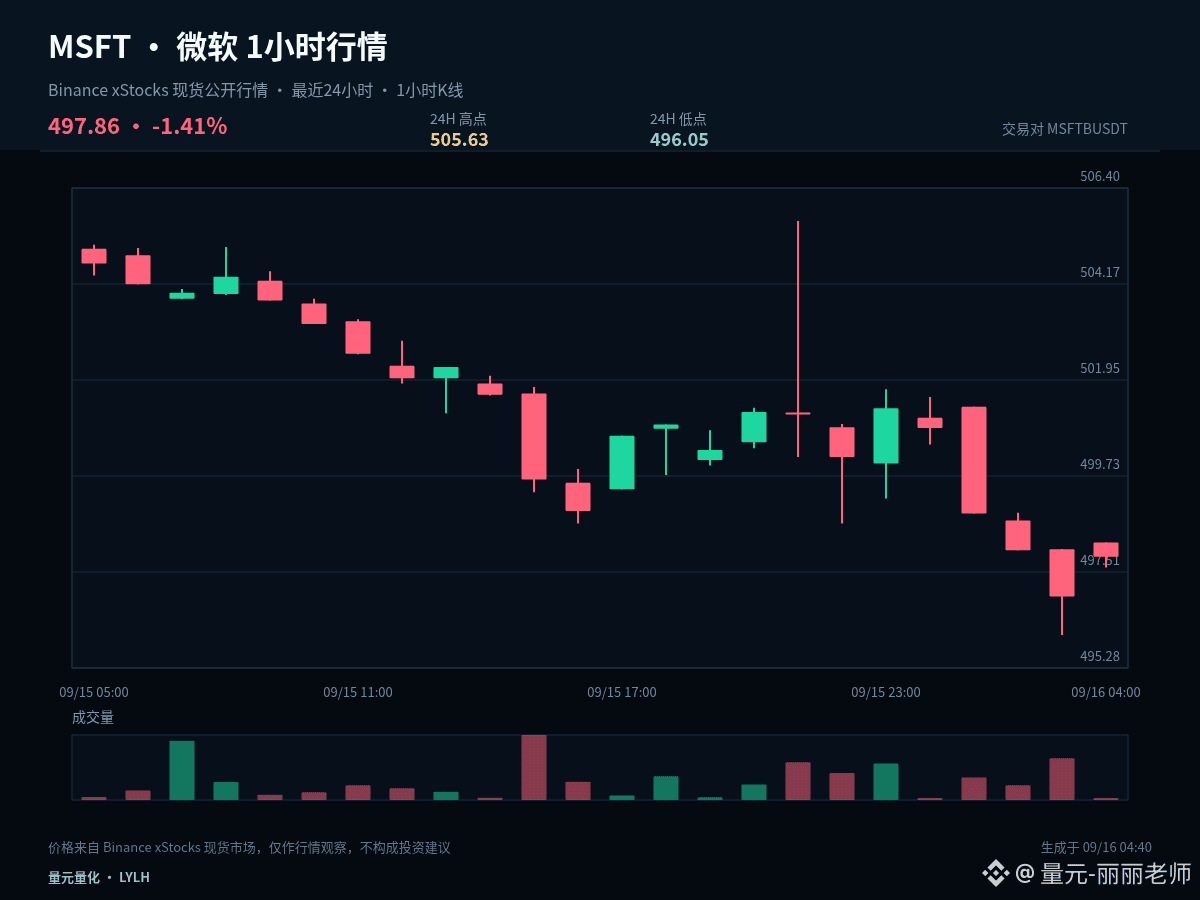
14

·
--
$MSFT #MSFT
Alert: Long Alert | MSFT
MSFT 15m shows a 15m breakout; the 1h volume is starting to rise.
Key signals: 1h turnover 24.5x / 4h turnover 11.2x / strong 1h body and closes high / break above 1h 20 high / break above 1h 55 high / stands above VWAP on 1h
1h turnover: 24.5x
24h turnover: 28.0M USDT
Funding rate: +0.0000% (longs and shorts balanced)
Score: 11/12
Short-term key level: breakout at 506.15
Support level: 490.71
Upside to watch: 555.02 / 605.47
After triggering, you may execute according to the direction; invalidation is the stop-loss level.
$MSFT #MSFT
Alert: Long Alert | MSFT
MSFT 15m shows a 15m breakout; the 1h volume is starting to rise.
Key signals: 1h turnover 24.5x / 4h turnover 11.2x / strong 1h body and closes high / break above 1h 20 high / break above 1h 55 high / stands above VWAP on 1h
1h turnover: 24.5x
24h turnover: 28.0M USDT
Funding rate: +0.0000% (longs and shorts balanced)
Score: 11/12
Short-term key level: breakout at 506.15
Support level: 490.71
Upside to watch: 555.02 / 605.47
After triggering, you may execute according to the direction; invalidation is the stop-loss level.
Alert: Long Alert | MSFT
MSFT 15m shows a 15m breakout; the 1h volume is starting to rise.
Key signals: 1h turnover 24.5x / 4h turnover 11.2x / strong 1h body and closes high / break above 1h 20 high / break above 1h 55 high / stands above VWAP on 1h
1h turnover: 24.5x
24h turnover: 28.0M USDT
Funding rate: +0.0000% (longs and shorts balanced)
Score: 11/12
Short-term key level: breakout at 506.15
Support level: 490.71
Upside to watch: 555.02 / 605.47
After triggering, you may execute according to the direction; invalidation is the stop-loss level.
1.2k
·
--
$BANK / $AAPL / $MSFT 4-hour resonance turns from weak to strong; multiple-head signals appear at the same time 🔥
════════════════════
🔴 $BANK 4-hour bull signals
⚠️ Technicals: ADX58 trend is very strong—watch for an overheat pullback. MACD DIF breaks above the zero line to go long. Moving averages are bullish and diverging upward. Trading volume surges 4.8x.
════════════════════
🔴 $AAPL 4-hour bull signals
⚠️ Technicals: ADX41 trend is clear. MACD DIF breaks above the zero line to go long. EMA5 crosses above EMA8. KDJ golden cross hasn’t entered overbought. Volume increases 3.1x
════════════════════
🔴 $MSFT 4-hour bull signals
⚠️ Technicals: ADX(37) trend is very obvious | MACD DIF breaks above the zero line—market turns bullish | EMA5 golden cross with EMA8; short-term bullish | Trading volume explodes, expanding 4.1x
════════════════════
🔔 Follow to get the first-hand intraday tick/volatility events 🔔
#技术分析 #BANK #AAPL #MSFT
📌 When trading, pay attention to whether the candlestick pattern matches
$BANK / $AAPL / $MSFT 4-hour resonance turns from weak to strong; multiple-head signals appear at the same time 🔥
════════════════════
🔴 $BANK 4-hour bull signals
⚠️ Technicals: ADX58 trend is very strong—watch for an overheat pullback. MACD DIF breaks above the zero line to go long. Moving averages are bullish and diverging upward. Trading volume surges 4.8x.
════════════════════
🔴 $AAPL 4-hour bull signals
⚠️ Technicals: ADX41 trend is clear. MACD DIF breaks above the zero line to go long. EMA5 crosses above EMA8. KDJ golden cross hasn’t entered overbought. Volume increases 3.1x
════════════════════
🔴 $MSFT 4-hour bull signals
⚠️ Technicals: ADX(37) trend is very obvious | MACD DIF breaks above the zero line—market turns bullish | EMA5 golden cross with EMA8; short-term bullish | Trading volume explodes, expanding 4.1x
════════════════════
🔔 Follow to get the first-hand intraday tick/volatility events 🔔
#技术分析 #BANK #AAPL #MSFT
📌 When trading, pay attention to whether the candlestick pattern matches
════════════════════
🔴 $BANK 4-hour bull signals
⚠️ Technicals: ADX58 trend is very strong—watch for an overheat pullback. MACD DIF breaks above the zero line to go long. Moving averages are bullish and diverging upward. Trading volume surges 4.8x.
════════════════════
🔴 $AAPL 4-hour bull signals
⚠️ Technicals: ADX41 trend is clear. MACD DIF breaks above the zero line to go long. EMA5 crosses above EMA8. KDJ golden cross hasn’t entered overbought. Volume increases 3.1x
════════════════════
🔴 $MSFT 4-hour bull signals
⚠️ Technicals: ADX(37) trend is very obvious | MACD DIF breaks above the zero line—market turns bullish | EMA5 golden cross with EMA8; short-term bullish | Trading volume explodes, expanding 4.1x
════════════════════
🔔 Follow to get the first-hand intraday tick/volatility events 🔔
#技术分析 #BANK #AAPL #MSFT
📌 When trading, pay attention to whether the candlestick pattern matches
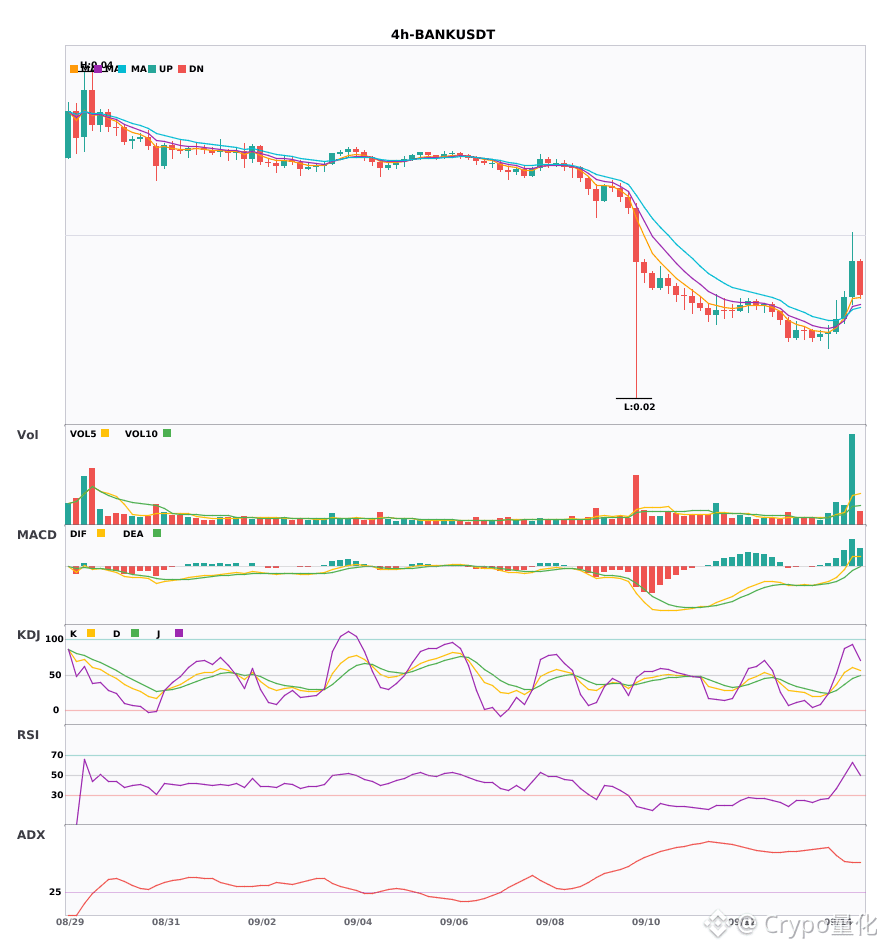
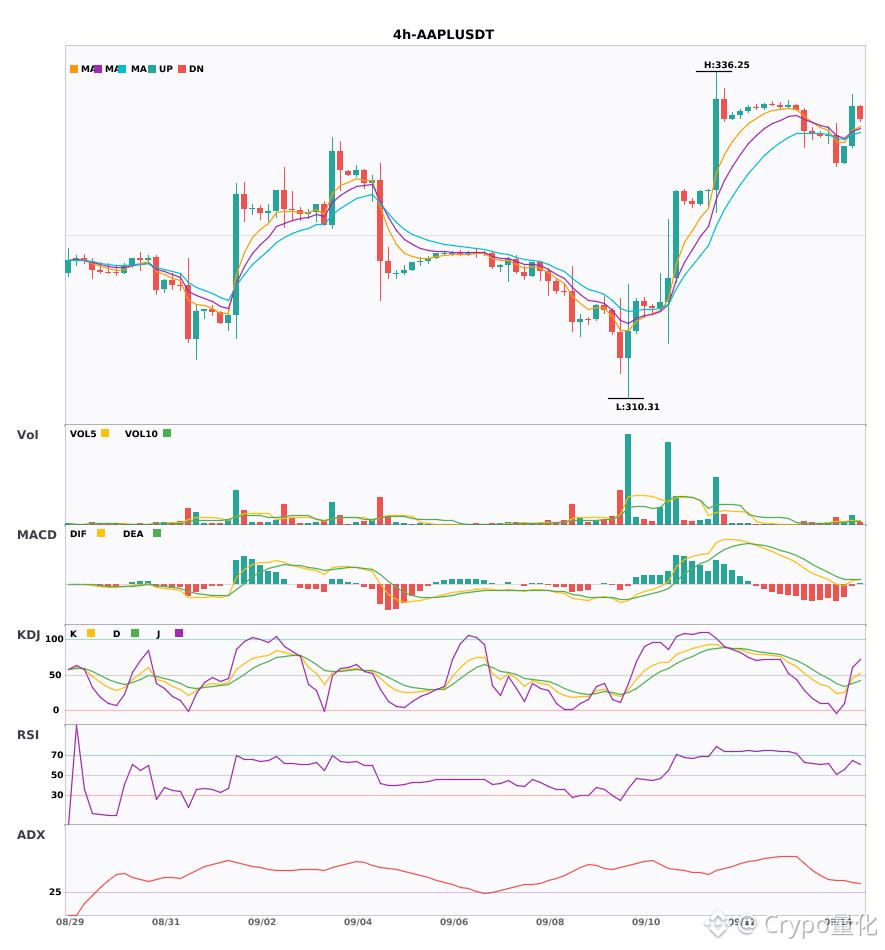
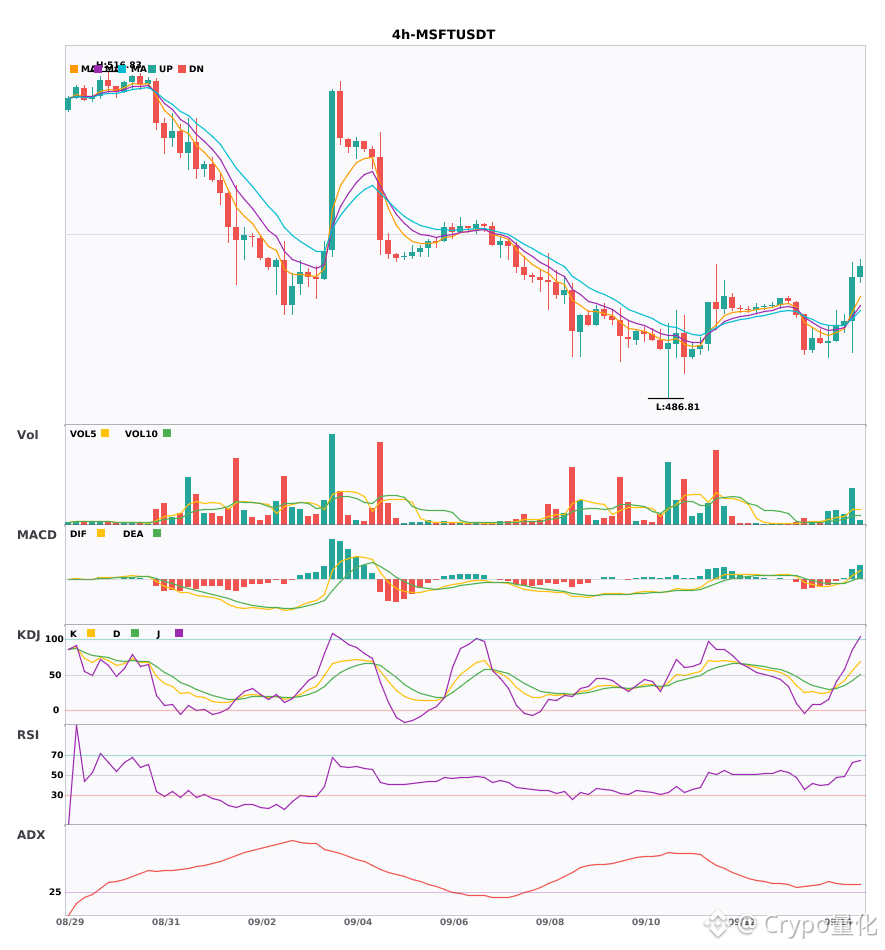
154
Log in to explore more content
Join global crypto users on Binance Square
⚡️ Get latest and useful information about crypto.
💬 Trusted by the world’s largest crypto exchange.
👍 Discover real insights from verified creators.
Email / Phone number
Trending Topics
1
#NEARRisesNearly80%InAWeek
2,691 views
269 Discussing
2
#MultiversXPlansHardForkRecovery
3,695 views
282 Discussing
3
#CircleLaunchesInstitutionalBTCBackedBorrowing
6,283 views
424 Discussing
4
#BitcoinHits$85K
9,211 views
221 Discussing
5
#ZetaChainVotesToMigrateZETAToSolana
5,568 views
275 Discussing
6
#ECBStartsBlockchainEuroSettlement
16,598 views
554 Discussing
7
#SouthAfricaProposesCryptoExchangeControls
27,962 views
748 Discussing
8
#SolanaCutsTargetSlotTimeTo250ms
30,989 views
663 Discussing
9
#EthereumSurpasses$2700
21,764 views
220 Discussing
10
#CanaryFilesSecondAmendmentForStakedSEIETF
47,644 views
1,005 Discussing