
#liquidationmap
liquidationmap
402,669 views
1,088 Discussing
Hot
Latest

·
--
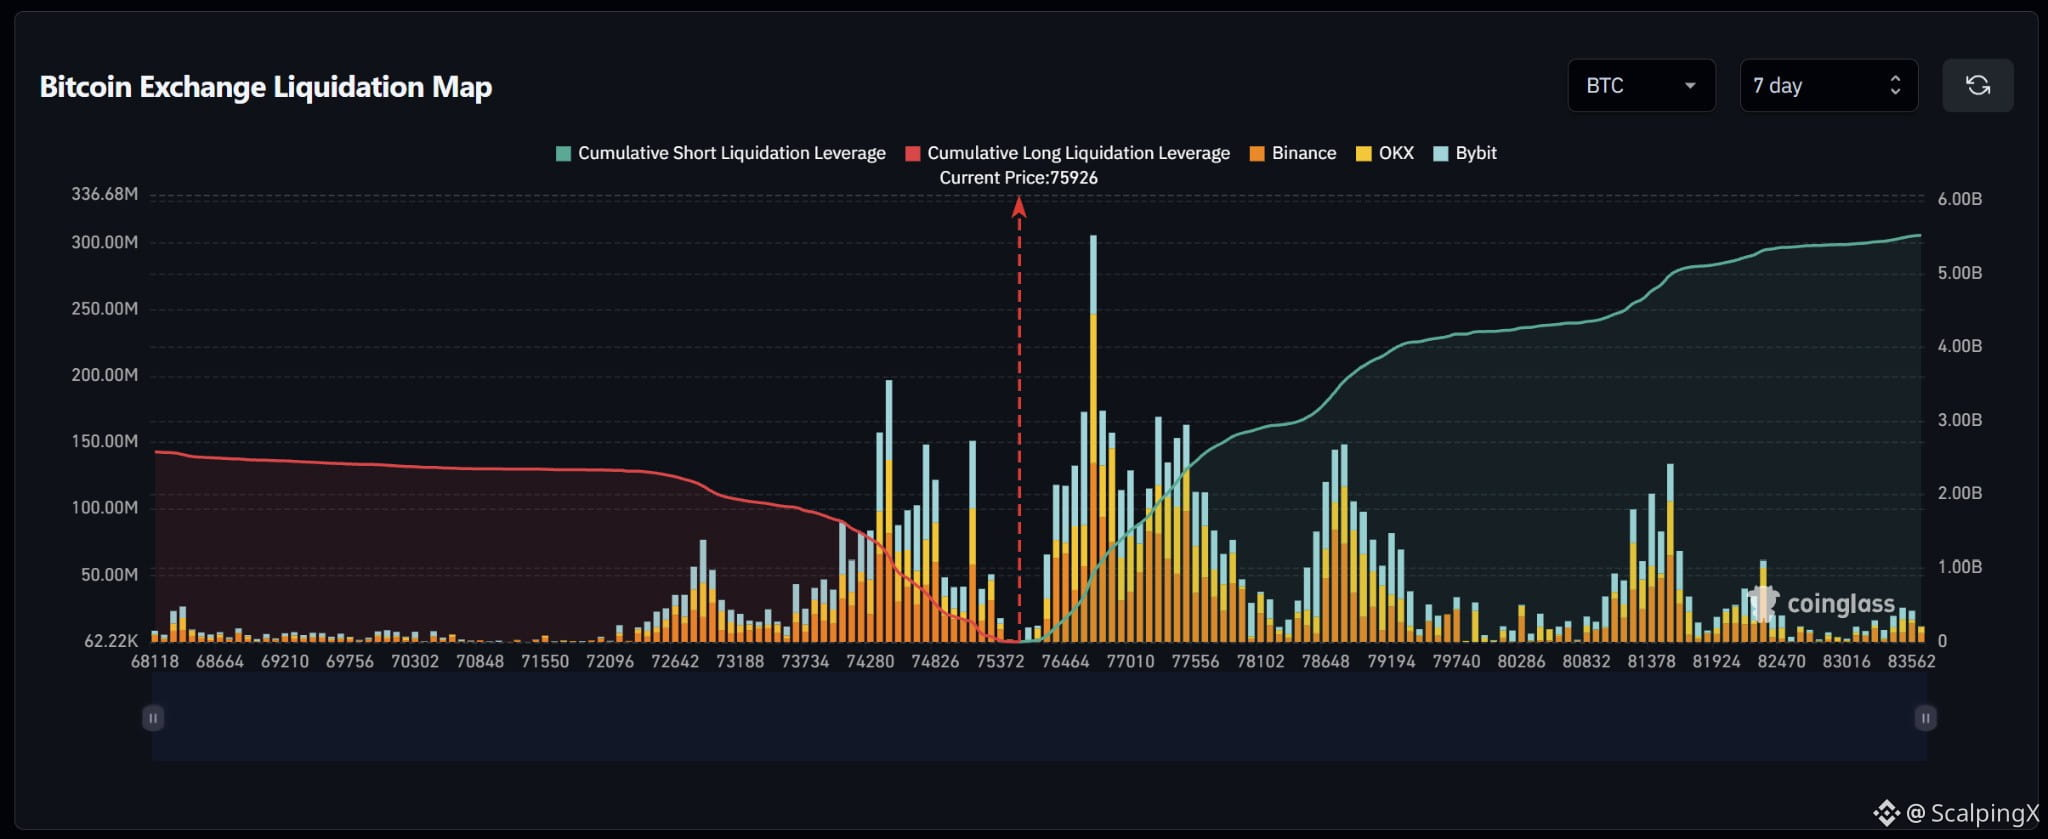
$BTC – Liquidation Map (7 days) – Index ~75,926
🧭 The preferred scenario is an upside short-liquidation sweep at 76,300–76,800. Estimated cumulative exposure is around $5.5B short versus $2.6B long within the displayed range, with large short clusters relatively close to price.
🔺 Clearing and holding above 76,800 shifts attention to 77,100–77,600. The bar near 76,700 is the map’s largest, at roughly $300M; the reaction after sweeping this cluster matters more than merely reaching it.
🎯 Holding above 77,600 brings 78,600–79,200 into focus. Bars around 79,700–80,900 are smaller and sparser; another notable cluster sits further away at 81,300–81,600.
⚖️ Losing 75,600 without reclaiming it weakens the upside scenario, shifting attention to 75,300–75,500, then 74,600–75,100. A large long-side bar stands near 74,700. A sweep of 76,300–76,800 followed by a quick drop below 76,300 would increase the risk of a failed upside move.
#LiquidationMap
$BTC – Liquidation Map (7 days) – Index ~75,926
🧭 The preferred scenario is an upside short-liquidation sweep at 76,300–76,800. Estimated cumulative exposure is around $5.5B short versus $2.6B long within the displayed range, with large short clusters relatively close to price.
🔺 Clearing and holding above 76,800 shifts attention to 77,100–77,600. The bar near 76,700 is the map’s largest, at roughly $300M; the reaction after sweeping this cluster matters more than merely reaching it.
🎯 Holding above 77,600 brings 78,600–79,200 into focus. Bars around 79,700–80,900 are smaller and sparser; another notable cluster sits further away at 81,300–81,600.
⚖️ Losing 75,600 without reclaiming it weakens the upside scenario, shifting attention to 75,300–75,500, then 74,600–75,100. A large long-side bar stands near 74,700. A sweep of 76,300–76,800 followed by a quick drop below 76,300 would increase the risk of a failed upside move.
#LiquidationMap
🧭 The preferred scenario is an upside short-liquidation sweep at 76,300–76,800. Estimated cumulative exposure is around $5.5B short versus $2.6B long within the displayed range, with large short clusters relatively close to price.
🔺 Clearing and holding above 76,800 shifts attention to 77,100–77,600. The bar near 76,700 is the map’s largest, at roughly $300M; the reaction after sweeping this cluster matters more than merely reaching it.
🎯 Holding above 77,600 brings 78,600–79,200 into focus. Bars around 79,700–80,900 are smaller and sparser; another notable cluster sits further away at 81,300–81,600.
⚖️ Losing 75,600 without reclaiming it weakens the upside scenario, shifting attention to 75,300–75,500, then 74,600–75,100. A large long-side bar stands near 74,700. A sweep of 76,300–76,800 followed by a quick drop below 76,300 would increase the risk of a failed upside move.
#LiquidationMap
42
·
--
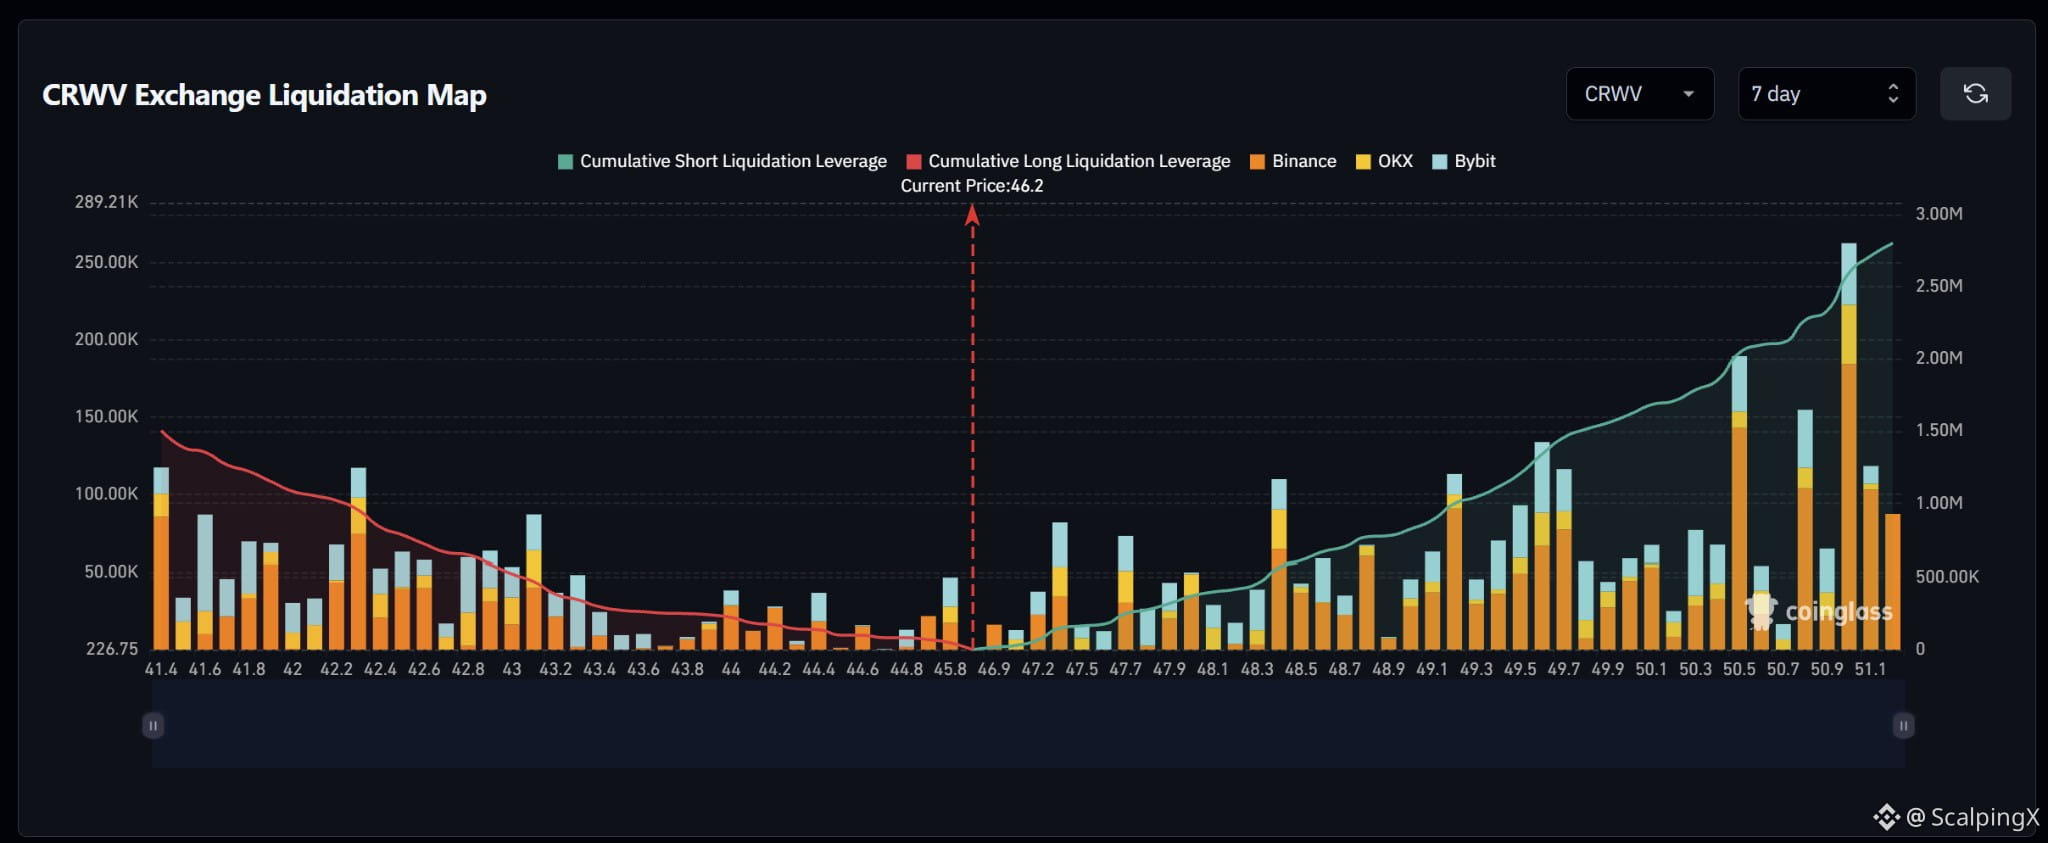
$CRWV – Liquidation Map (7 days) – Index ~46.2
🧭 The preferred scenario is an upside short-liquidation sweep, starting near 47.2–47.3. Estimated cumulative short exposure is around $2.8M versus $1.5M long within the displayed range, with large clusters spread across several higher levels.
🔺 Clearing and holding above 47.3 shifts attention to 47.7–48.0, then the spike near 48.4. Nearby bars at 46.9–47.1 are small; sustained momentum after the initial sweep remains key.
🎯 Holding above 48.5 brings 49.2–49.7, then 50.5–51.1, into focus. The bar near 51.0 is the map’s largest, at roughly $260,000, but remains distant and would require successive continuation moves.
⚖️ Losing 45.8 without reclaiming it weakens the upside scenario. Bars around 44–45.5 are relatively small and sparse; stronger long clusters sit further below at 42.3–43.2. A sweep of 47.2–47.3 followed by a quick drop below 47.2 would increase the risk of a failed upside move.
#LiquidationMap
$CRWV – Liquidation Map (7 days) – Index ~46.2
🧭 The preferred scenario is an upside short-liquidation sweep, starting near 47.2–47.3. Estimated cumulative short exposure is around $2.8M versus $1.5M long within the displayed range, with large clusters spread across several higher levels.
🔺 Clearing and holding above 47.3 shifts attention to 47.7–48.0, then the spike near 48.4. Nearby bars at 46.9–47.1 are small; sustained momentum after the initial sweep remains key.
🎯 Holding above 48.5 brings 49.2–49.7, then 50.5–51.1, into focus. The bar near 51.0 is the map’s largest, at roughly $260,000, but remains distant and would require successive continuation moves.
⚖️ Losing 45.8 without reclaiming it weakens the upside scenario. Bars around 44–45.5 are relatively small and sparse; stronger long clusters sit further below at 42.3–43.2. A sweep of 47.2–47.3 followed by a quick drop below 47.2 would increase the risk of a failed upside move.
#LiquidationMap
🧭 The preferred scenario is an upside short-liquidation sweep, starting near 47.2–47.3. Estimated cumulative short exposure is around $2.8M versus $1.5M long within the displayed range, with large clusters spread across several higher levels.
🔺 Clearing and holding above 47.3 shifts attention to 47.7–48.0, then the spike near 48.4. Nearby bars at 46.9–47.1 are small; sustained momentum after the initial sweep remains key.
🎯 Holding above 48.5 brings 49.2–49.7, then 50.5–51.1, into focus. The bar near 51.0 is the map’s largest, at roughly $260,000, but remains distant and would require successive continuation moves.
⚖️ Losing 45.8 without reclaiming it weakens the upside scenario. Bars around 44–45.5 are relatively small and sparse; stronger long clusters sit further below at 42.3–43.2. A sweep of 47.2–47.3 followed by a quick drop below 47.2 would increase the risk of a failed upside move.
#LiquidationMap
102
·
--
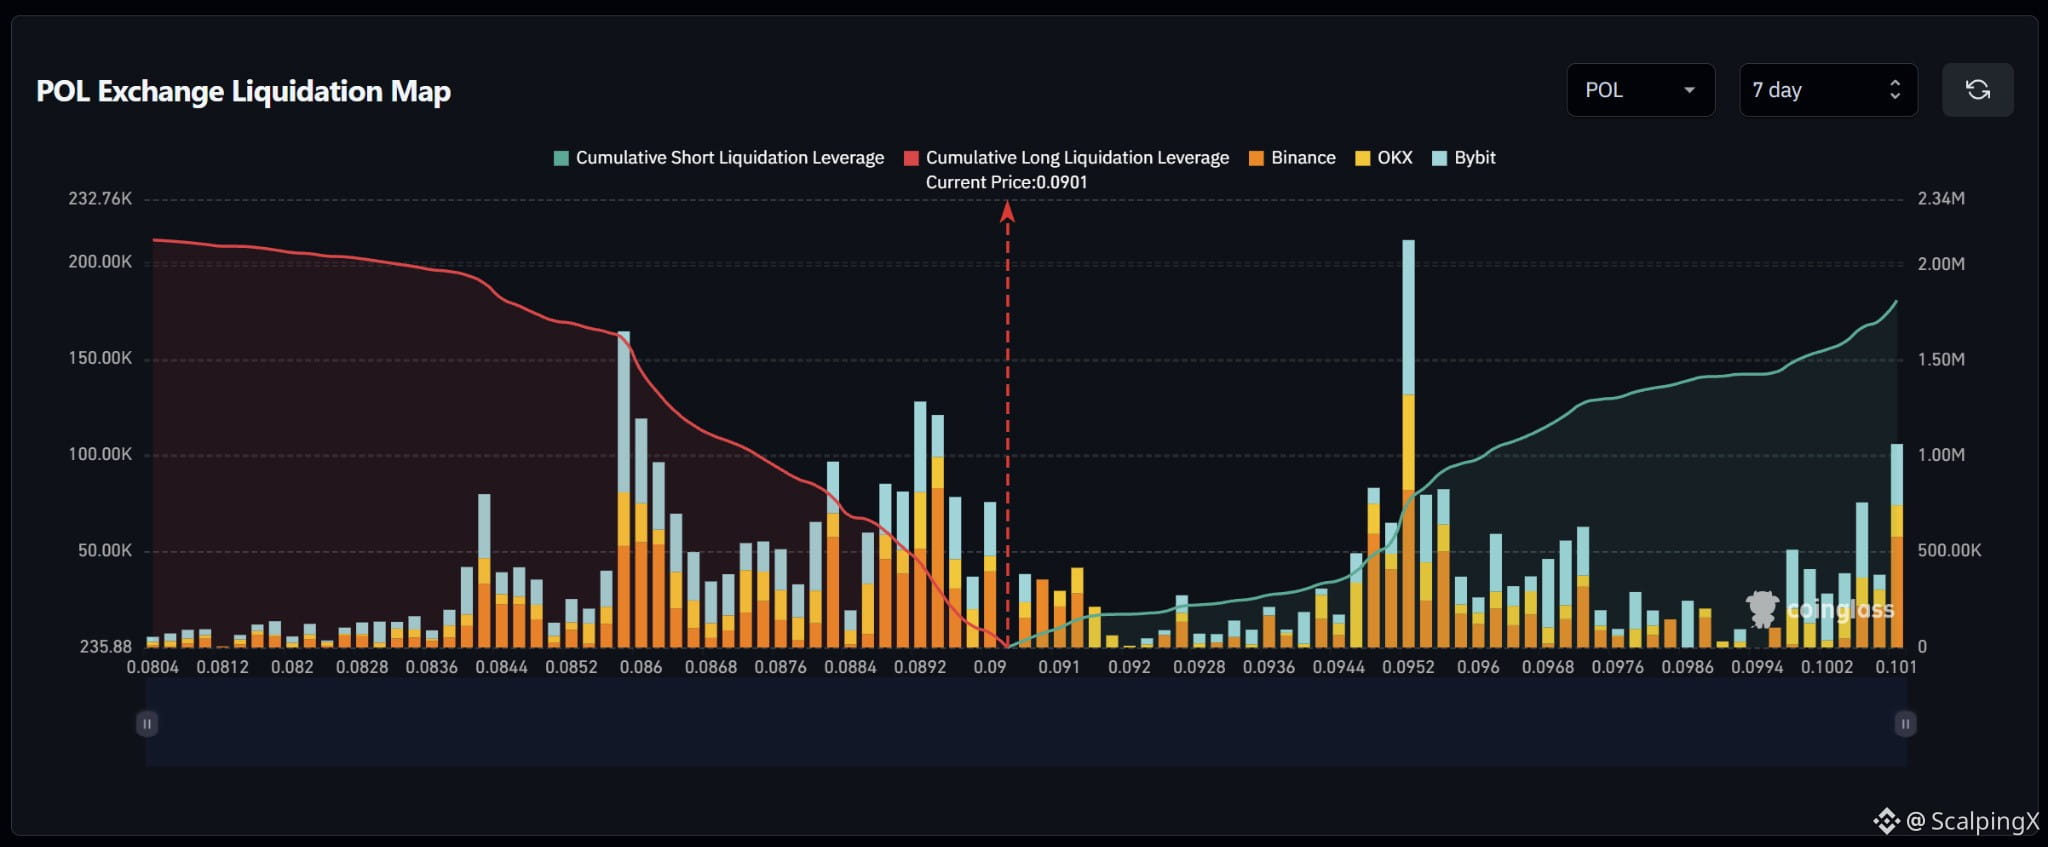
$POL – Liquidation Map (7 days) – Index ~0.0901
🧭 The preferred scenario is a nearby long-liquidation sweep at 0.0889–0.0900. Estimated cumulative exposure is fairly balanced, but nearby long bars are denser, while the largest short cluster sits further away at 0.0945–0.0956.
🔻 Losing 0.0900 without reclaiming it shifts attention to 0.0889–0.0895. Two large bars near 0.0892–0.0894 stand out; consecutive long liquidations could amplify volatility.
🎯 Holding below 0.0889 after the sweep brings 0.0880–0.0884, then 0.0858–0.0865, into focus. Conversely, a sweep below 0.0900 followed by a quick reclaim of 0.0901 would weaken the downside scenario.
⚖️ Clearing the short cluster at 0.0904–0.0914 and holding above 0.0914 shifts attention to 0.0945–0.0956. The 0.0918–0.0940 range is sparse; the bar near 0.0952 is the map’s largest, at roughly $210,000. Holding above 0.0956 would bring 0.0960–0.0972 into view.
#LiquidationMap
$POL – Liquidation Map (7 days) – Index ~0.0901
🧭 The preferred scenario is a nearby long-liquidation sweep at 0.0889–0.0900. Estimated cumulative exposure is fairly balanced, but nearby long bars are denser, while the largest short cluster sits further away at 0.0945–0.0956.
🔻 Losing 0.0900 without reclaiming it shifts attention to 0.0889–0.0895. Two large bars near 0.0892–0.0894 stand out; consecutive long liquidations could amplify volatility.
🎯 Holding below 0.0889 after the sweep brings 0.0880–0.0884, then 0.0858–0.0865, into focus. Conversely, a sweep below 0.0900 followed by a quick reclaim of 0.0901 would weaken the downside scenario.
⚖️ Clearing the short cluster at 0.0904–0.0914 and holding above 0.0914 shifts attention to 0.0945–0.0956. The 0.0918–0.0940 range is sparse; the bar near 0.0952 is the map’s largest, at roughly $210,000. Holding above 0.0956 would bring 0.0960–0.0972 into view.
#LiquidationMap
🧭 The preferred scenario is a nearby long-liquidation sweep at 0.0889–0.0900. Estimated cumulative exposure is fairly balanced, but nearby long bars are denser, while the largest short cluster sits further away at 0.0945–0.0956.
🔻 Losing 0.0900 without reclaiming it shifts attention to 0.0889–0.0895. Two large bars near 0.0892–0.0894 stand out; consecutive long liquidations could amplify volatility.
🎯 Holding below 0.0889 after the sweep brings 0.0880–0.0884, then 0.0858–0.0865, into focus. Conversely, a sweep below 0.0900 followed by a quick reclaim of 0.0901 would weaken the downside scenario.
⚖️ Clearing the short cluster at 0.0904–0.0914 and holding above 0.0914 shifts attention to 0.0945–0.0956. The 0.0918–0.0940 range is sparse; the bar near 0.0952 is the map’s largest, at roughly $210,000. Holding above 0.0956 would bring 0.0960–0.0972 into view.
#LiquidationMap
13

·
--
Bullish
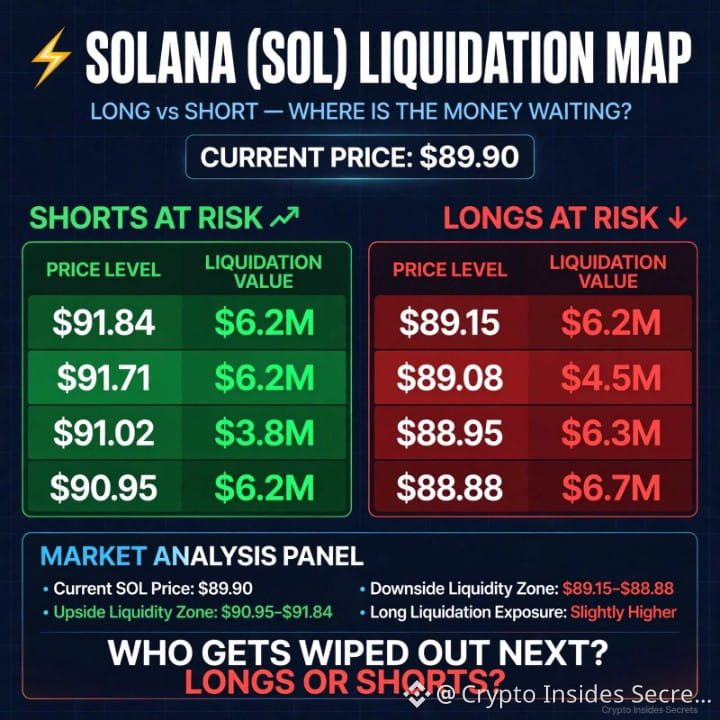
🚨 SOLANA'S NEXT MOVE COULD WIPE OUT MILLIONS! ⚡
Sitting at $89.90, and BOTH sides of the market are loaded with liquidation liquidity!
🟢 SHORTS IN DANGER
- $90.95 → $6.2M
- $91.02 → $3.8M
- $91.71 → $6.2M
- $91.84 → $6.2M
🔴 LONGS IN DANGER
- $89.15 → $6.2M
- $89.08 → $4.5M
- $88.95 → $6.3M
- $88.88 → $6.7M
⚠️ THE INTERESTING PART:
Downside long-liquidation exposure is slightly higher.
A sharp move below $89 could trigger a liquidation cascade. But a sudden breakout toward $91–$92 could turn into a brutal SHORT SQUEEZE!
🔥 WHO GETS HUNTED FIRST?
LONGS or SHORTS?
Remember: Liquidity attracts price, but it never guarantees direction.
#SOL #Solana #liquidationmap #CryptoTrading #CryptoInsidesSecrets
$ZEC $TIA
🚨 SOLANA'S NEXT MOVE COULD WIPE OUT MILLIONS! ⚡
Sitting at $89.90, and BOTH sides of the market are loaded with liquidation liquidity!
🟢 SHORTS IN DANGER
- $90.95 → $6.2M
- $91.02 → $3.8M
- $91.71 → $6.2M
- $91.84 → $6.2M
🔴 LONGS IN DANGER
- $89.15 → $6.2M
- $89.08 → $4.5M
- $88.95 → $6.3M
- $88.88 → $6.7M
⚠️ THE INTERESTING PART:
Downside long-liquidation exposure is slightly higher.
A sharp move below $89 could trigger a liquidation cascade. But a sudden breakout toward $91–$92 could turn into a brutal SHORT SQUEEZE!
🔥 WHO GETS HUNTED FIRST?
LONGS or SHORTS?
Remember: Liquidity attracts price, but it never guarantees direction.
#SOL #Solana #liquidationmap #CryptoTrading #CryptoInsidesSecrets
$ZEC $TIA
Sitting at $89.90, and BOTH sides of the market are loaded with liquidation liquidity!
🟢 SHORTS IN DANGER
- $90.95 → $6.2M
- $91.02 → $3.8M
- $91.71 → $6.2M
- $91.84 → $6.2M
🔴 LONGS IN DANGER
- $89.15 → $6.2M
- $89.08 → $4.5M
- $88.95 → $6.3M
- $88.88 → $6.7M
⚠️ THE INTERESTING PART:
Downside long-liquidation exposure is slightly higher.
A sharp move below $89 could trigger a liquidation cascade. But a sudden breakout toward $91–$92 could turn into a brutal SHORT SQUEEZE!
🔥 WHO GETS HUNTED FIRST?
LONGS or SHORTS?
Remember: Liquidity attracts price, but it never guarantees direction.
#SOL #Solana #liquidationmap #CryptoTrading #CryptoInsidesSecrets
$ZEC $TIA

1
238
·
--
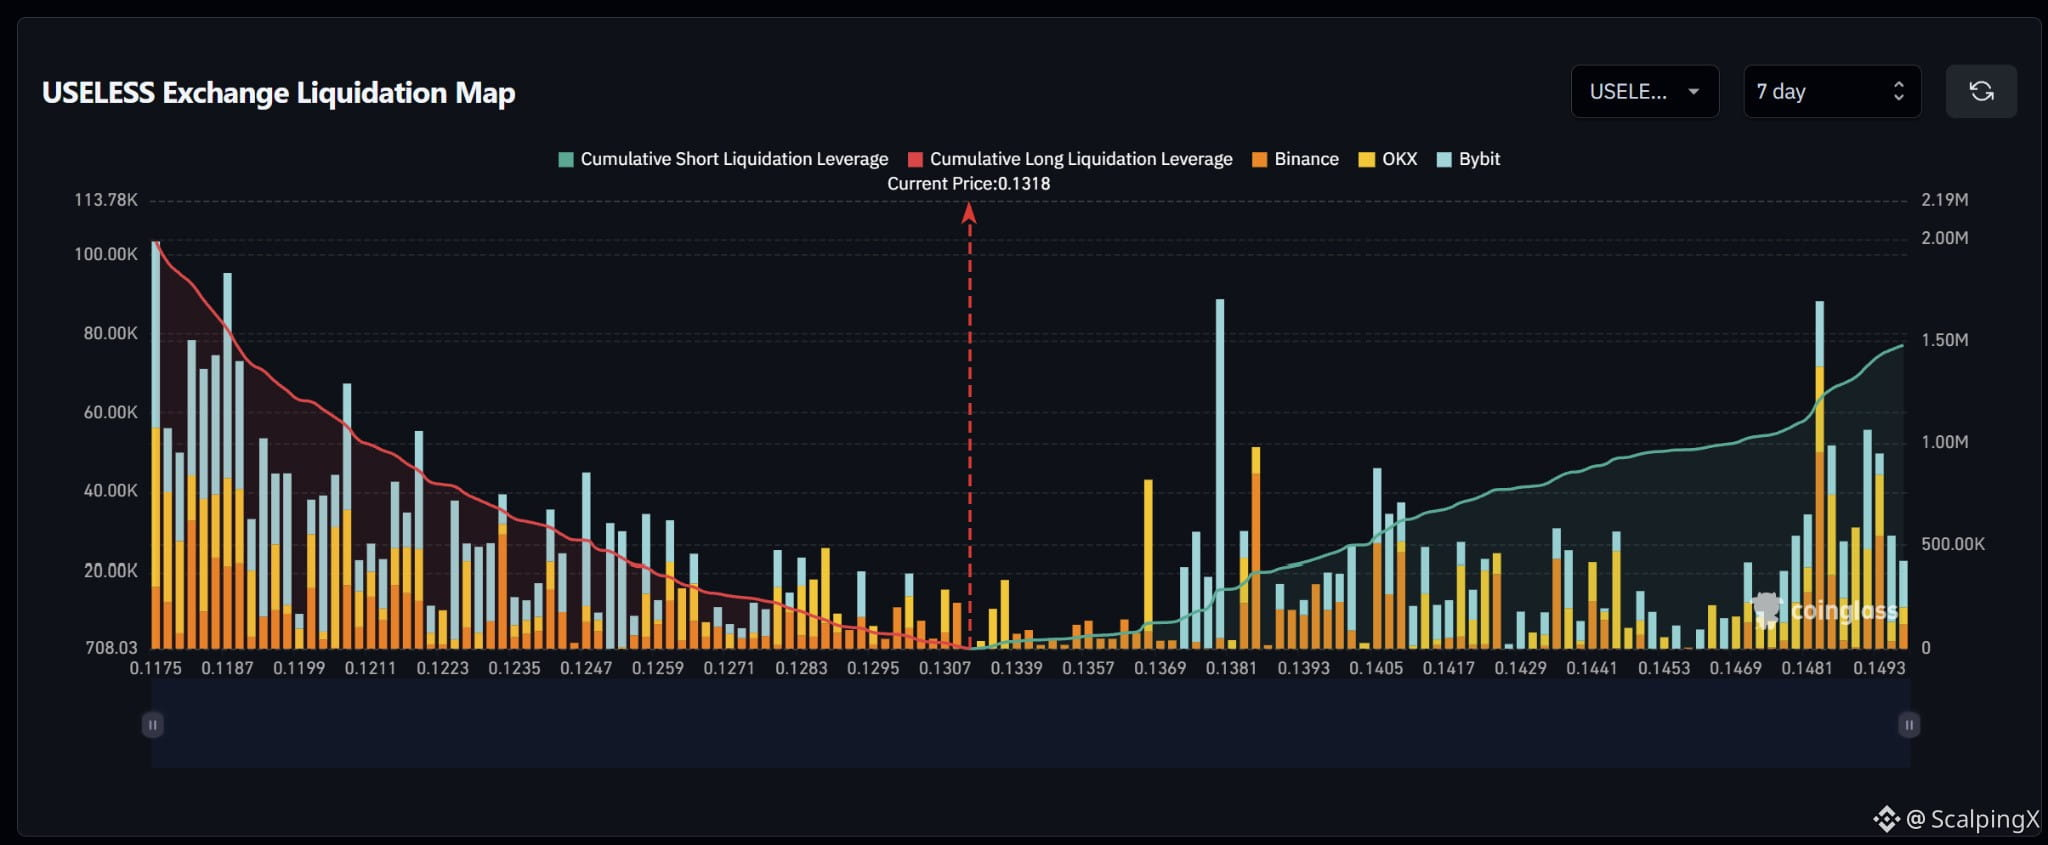
$USELESS – Liquidation Map (7 days) – Index ~0.1318
🧭 The preferred scenario is an upside short-liquidation sweep, starting around 0.1333–0.1337. Estimated cumulative long exposure is larger, but most strong long clusters sit far below at 0.1175–0.1223.
🔺 Clearing and holding above 0.1337 shifts attention to 0.1366–0.1386. Bars around 0.1340–0.1363 are small and sparse. The large spike near 0.1380 stands out next and could amplify volatility if short liquidations trigger.
🎯 Holding above 0.1386 after the sweep brings 0.1403–0.1409 into focus. A larger cluster sits further away at 0.1482–0.1494, but intervening clusters are more scattered, offering little basis to expect a direct move there.
⚖️ Losing 0.1310 without reclaiming it weakens the upside scenario, shifting attention to 0.1295–0.1305, then 0.1278–0.1287. A sweep of 0.1333–0.1337 followed by a quick drop below 0.1333 would increase the risk of a failed upside move.
#LiquidationMap
$USELESS – Liquidation Map (7 days) – Index ~0.1318
🧭 The preferred scenario is an upside short-liquidation sweep, starting around 0.1333–0.1337. Estimated cumulative long exposure is larger, but most strong long clusters sit far below at 0.1175–0.1223.
🔺 Clearing and holding above 0.1337 shifts attention to 0.1366–0.1386. Bars around 0.1340–0.1363 are small and sparse. The large spike near 0.1380 stands out next and could amplify volatility if short liquidations trigger.
🎯 Holding above 0.1386 after the sweep brings 0.1403–0.1409 into focus. A larger cluster sits further away at 0.1482–0.1494, but intervening clusters are more scattered, offering little basis to expect a direct move there.
⚖️ Losing 0.1310 without reclaiming it weakens the upside scenario, shifting attention to 0.1295–0.1305, then 0.1278–0.1287. A sweep of 0.1333–0.1337 followed by a quick drop below 0.1333 would increase the risk of a failed upside move.
#LiquidationMap
🧭 The preferred scenario is an upside short-liquidation sweep, starting around 0.1333–0.1337. Estimated cumulative long exposure is larger, but most strong long clusters sit far below at 0.1175–0.1223.
🔺 Clearing and holding above 0.1337 shifts attention to 0.1366–0.1386. Bars around 0.1340–0.1363 are small and sparse. The large spike near 0.1380 stands out next and could amplify volatility if short liquidations trigger.
🎯 Holding above 0.1386 after the sweep brings 0.1403–0.1409 into focus. A larger cluster sits further away at 0.1482–0.1494, but intervening clusters are more scattered, offering little basis to expect a direct move there.
⚖️ Losing 0.1310 without reclaiming it weakens the upside scenario, shifting attention to 0.1295–0.1305, then 0.1278–0.1287. A sweep of 0.1333–0.1337 followed by a quick drop below 0.1333 would increase the risk of a failed upside move.
#LiquidationMap
10
·
--
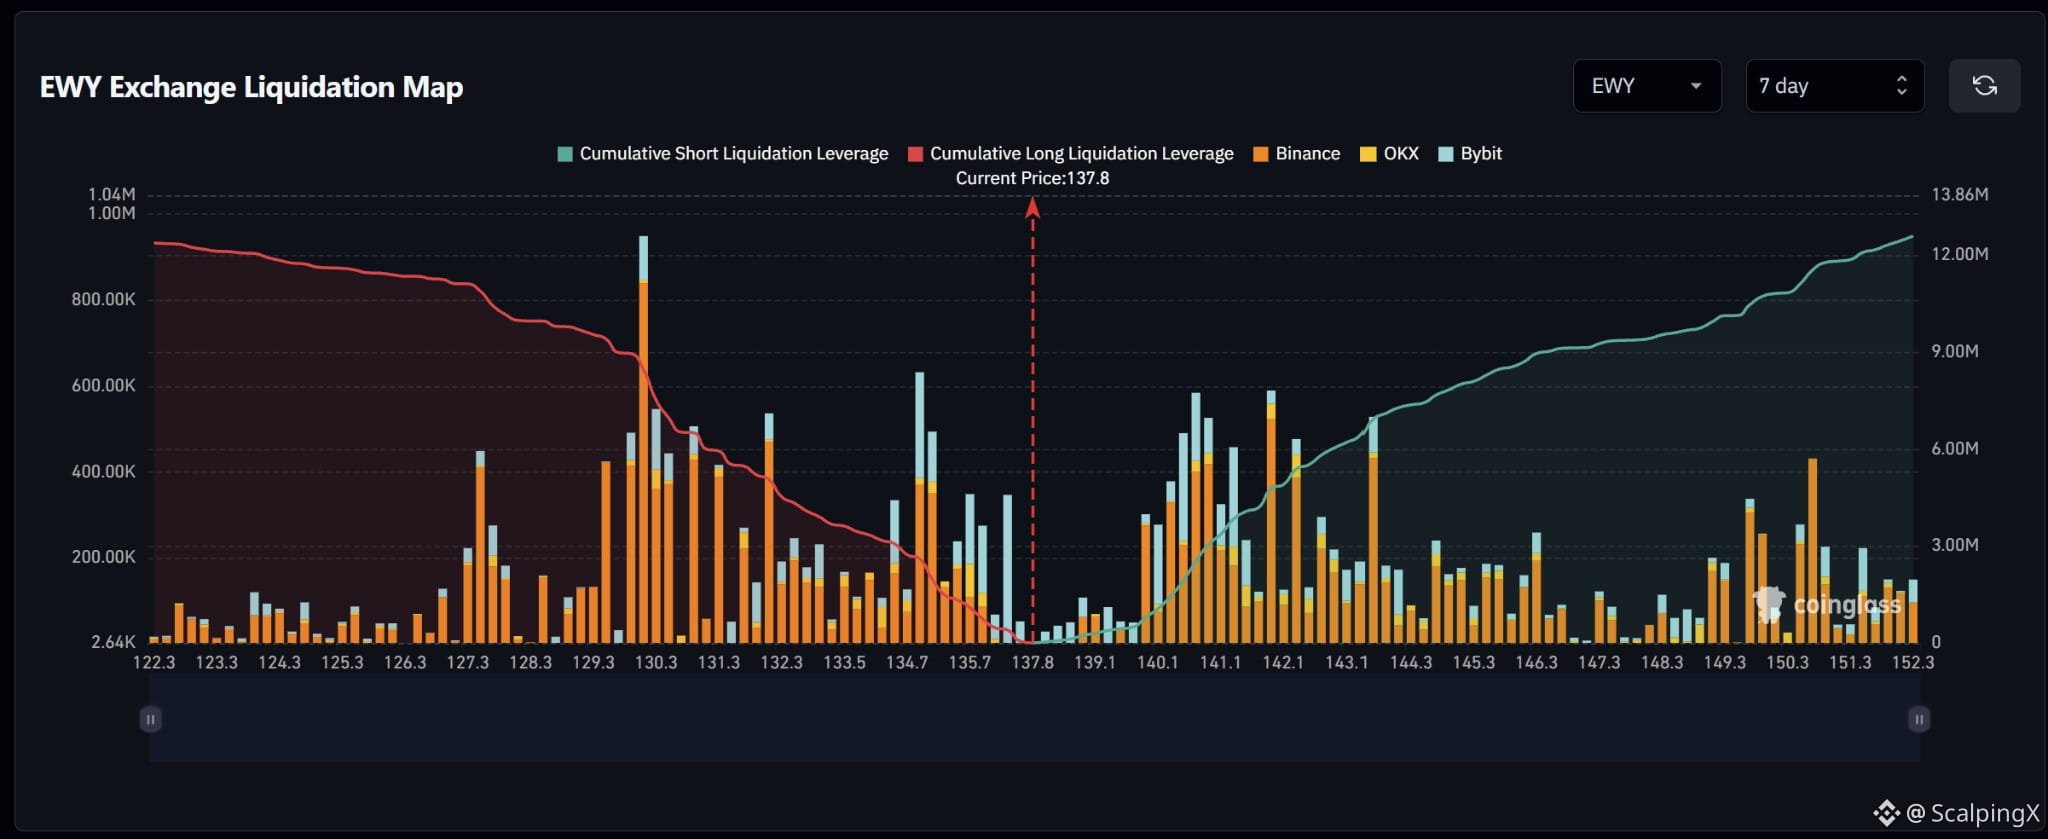
$EWY – Liquidation Map (7 days) – Index ~137.8
🧭 The preferred scenario is a long-liquidation sweep at 135.7–136.5, where large bars sit closer to price than the main short cluster at 140–142.5. Estimated cumulative exposure is fairly balanced within the displayed range.
🔻 Losing 136.5 without reclaiming it shifts attention to 135.7–136.2, then 134.6–135.1. The bar near 134.9 stands out; consecutive long liquidations could amplify volatility.
🎯 Holding below 134.6 after the sweep brings 132.0–132.6, then 129.5–131.4, into focus. The bar near 130.1 is the map’s largest, approaching $950,000. A sweep of 135.7–136.5 followed by a quick reclaim of 136.5 would weaken the downside scenario.
⚖️ Clearing and holding above 140.2 shifts attention to short clusters at 140.5–141.3, 142.0–142.5 and 143.5–144.0. Bars around 138–139.7 are relatively small; sustained momentum upon reaching the denser short clusters would be worth watching.
#LiquidationMap
$EWY – Liquidation Map (7 days) – Index ~137.8
🧭 The preferred scenario is a long-liquidation sweep at 135.7–136.5, where large bars sit closer to price than the main short cluster at 140–142.5. Estimated cumulative exposure is fairly balanced within the displayed range.
🔻 Losing 136.5 without reclaiming it shifts attention to 135.7–136.2, then 134.6–135.1. The bar near 134.9 stands out; consecutive long liquidations could amplify volatility.
🎯 Holding below 134.6 after the sweep brings 132.0–132.6, then 129.5–131.4, into focus. The bar near 130.1 is the map’s largest, approaching $950,000. A sweep of 135.7–136.5 followed by a quick reclaim of 136.5 would weaken the downside scenario.
⚖️ Clearing and holding above 140.2 shifts attention to short clusters at 140.5–141.3, 142.0–142.5 and 143.5–144.0. Bars around 138–139.7 are relatively small; sustained momentum upon reaching the denser short clusters would be worth watching.
#LiquidationMap
🧭 The preferred scenario is a long-liquidation sweep at 135.7–136.5, where large bars sit closer to price than the main short cluster at 140–142.5. Estimated cumulative exposure is fairly balanced within the displayed range.
🔻 Losing 136.5 without reclaiming it shifts attention to 135.7–136.2, then 134.6–135.1. The bar near 134.9 stands out; consecutive long liquidations could amplify volatility.
🎯 Holding below 134.6 after the sweep brings 132.0–132.6, then 129.5–131.4, into focus. The bar near 130.1 is the map’s largest, approaching $950,000. A sweep of 135.7–136.5 followed by a quick reclaim of 136.5 would weaken the downside scenario.
⚖️ Clearing and holding above 140.2 shifts attention to short clusters at 140.5–141.3, 142.0–142.5 and 143.5–144.0. Bars around 138–139.7 are relatively small; sustained momentum upon reaching the denser short clusters would be worth watching.
#LiquidationMap
18
·
--
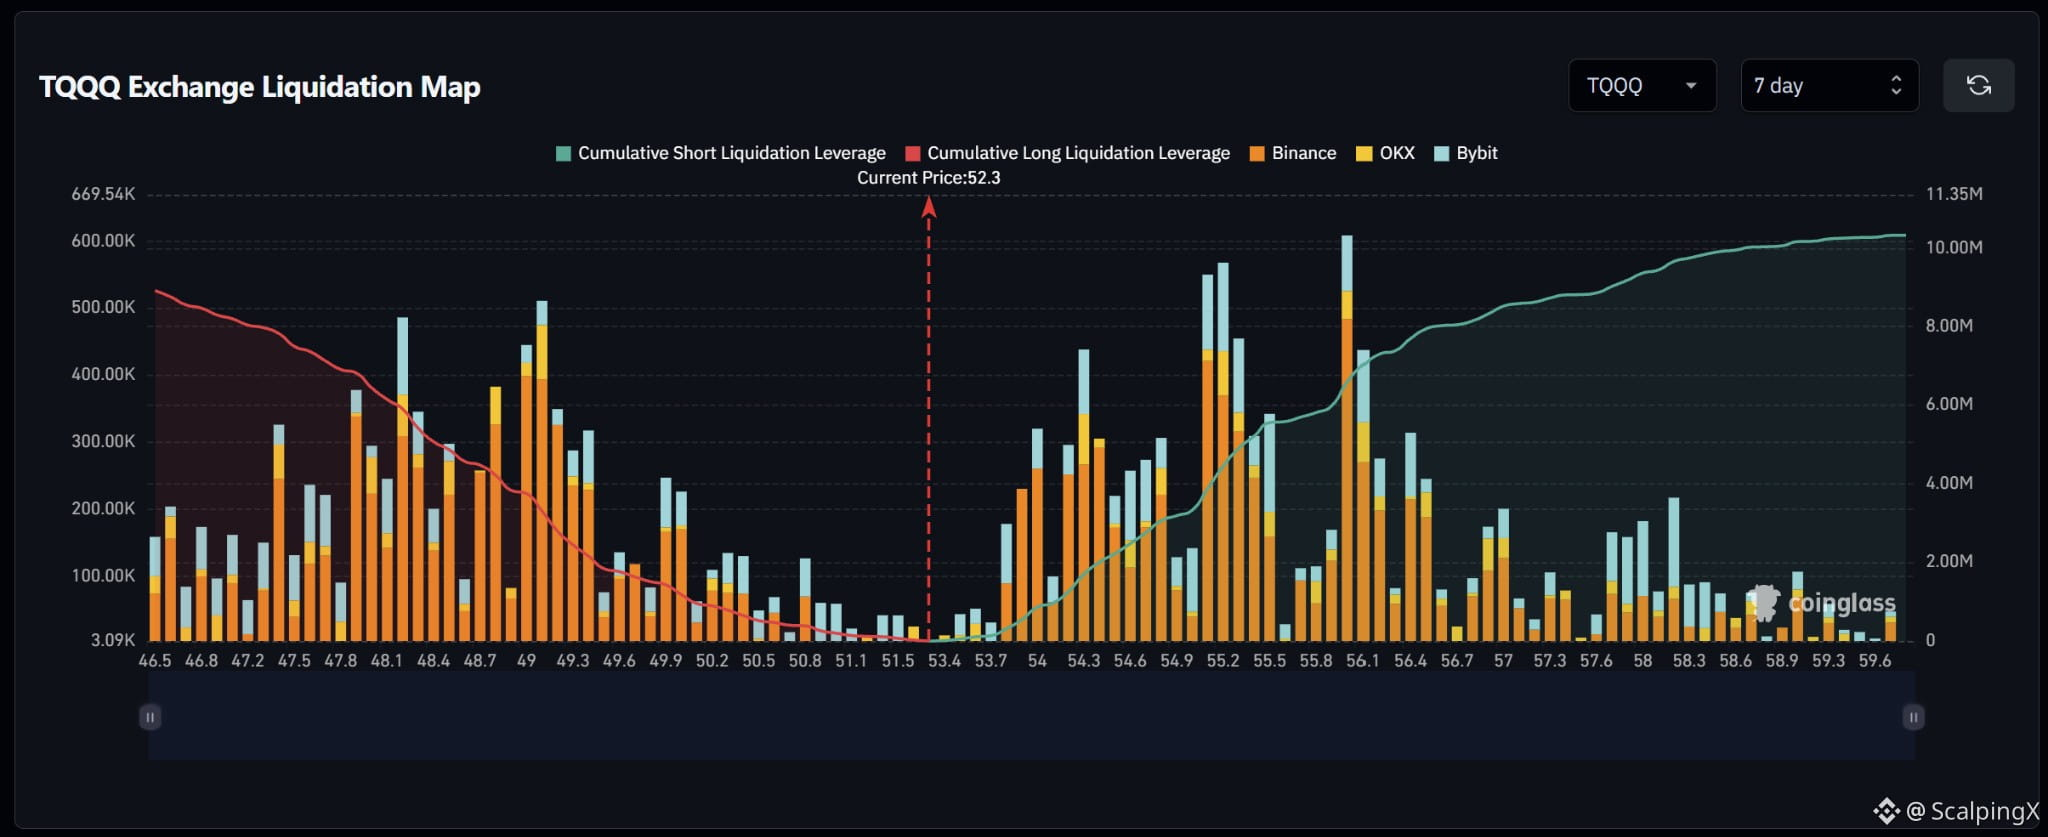
$TQQQ – Liquidation Map (7 days) – Index ~52.3
🧭 The preferred scenario is an upside short-liquidation sweep at 53.8–54.4. Large short clusters sit closer to price than the strongest long clusters below. Estimated cumulative exposure is around $10.3M short versus $8.8M long within the displayed range.
🔺 Clearing and holding above 54.4 shifts attention to 55.1–55.5. Two large bars near 55.1–55.2 stand out; consecutive short liquidations could amplify volatility.
🎯 Holding above 55.5 after the sweep brings 56.0–56.5 into focus. The bar near 56.0 is the map’s largest, at roughly $600,000. Beyond 56.7, clusters become smaller and more scattered, with notable spikes remaining near 57.0 and 58.2.
⚖️ Losing 52 without reclaiming it weakens the upside scenario, shifting attention to 51.3–51.7, then 50.7–50.9 and 49.9–50.4. A sweep of 53.8–54.4 followed by a quick drop below 53.8 would increase the risk of a failed upside move.
#LiquidationMap
$TQQQ – Liquidation Map (7 days) – Index ~52.3
🧭 The preferred scenario is an upside short-liquidation sweep at 53.8–54.4. Large short clusters sit closer to price than the strongest long clusters below. Estimated cumulative exposure is around $10.3M short versus $8.8M long within the displayed range.
🔺 Clearing and holding above 54.4 shifts attention to 55.1–55.5. Two large bars near 55.1–55.2 stand out; consecutive short liquidations could amplify volatility.
🎯 Holding above 55.5 after the sweep brings 56.0–56.5 into focus. The bar near 56.0 is the map’s largest, at roughly $600,000. Beyond 56.7, clusters become smaller and more scattered, with notable spikes remaining near 57.0 and 58.2.
⚖️ Losing 52 without reclaiming it weakens the upside scenario, shifting attention to 51.3–51.7, then 50.7–50.9 and 49.9–50.4. A sweep of 53.8–54.4 followed by a quick drop below 53.8 would increase the risk of a failed upside move.
#LiquidationMap
🧭 The preferred scenario is an upside short-liquidation sweep at 53.8–54.4. Large short clusters sit closer to price than the strongest long clusters below. Estimated cumulative exposure is around $10.3M short versus $8.8M long within the displayed range.
🔺 Clearing and holding above 54.4 shifts attention to 55.1–55.5. Two large bars near 55.1–55.2 stand out; consecutive short liquidations could amplify volatility.
🎯 Holding above 55.5 after the sweep brings 56.0–56.5 into focus. The bar near 56.0 is the map’s largest, at roughly $600,000. Beyond 56.7, clusters become smaller and more scattered, with notable spikes remaining near 57.0 and 58.2.
⚖️ Losing 52 without reclaiming it weakens the upside scenario, shifting attention to 51.3–51.7, then 50.7–50.9 and 49.9–50.4. A sweep of 53.8–54.4 followed by a quick drop below 53.8 would increase the risk of a failed upside move.
#LiquidationMap
1
11
·
--
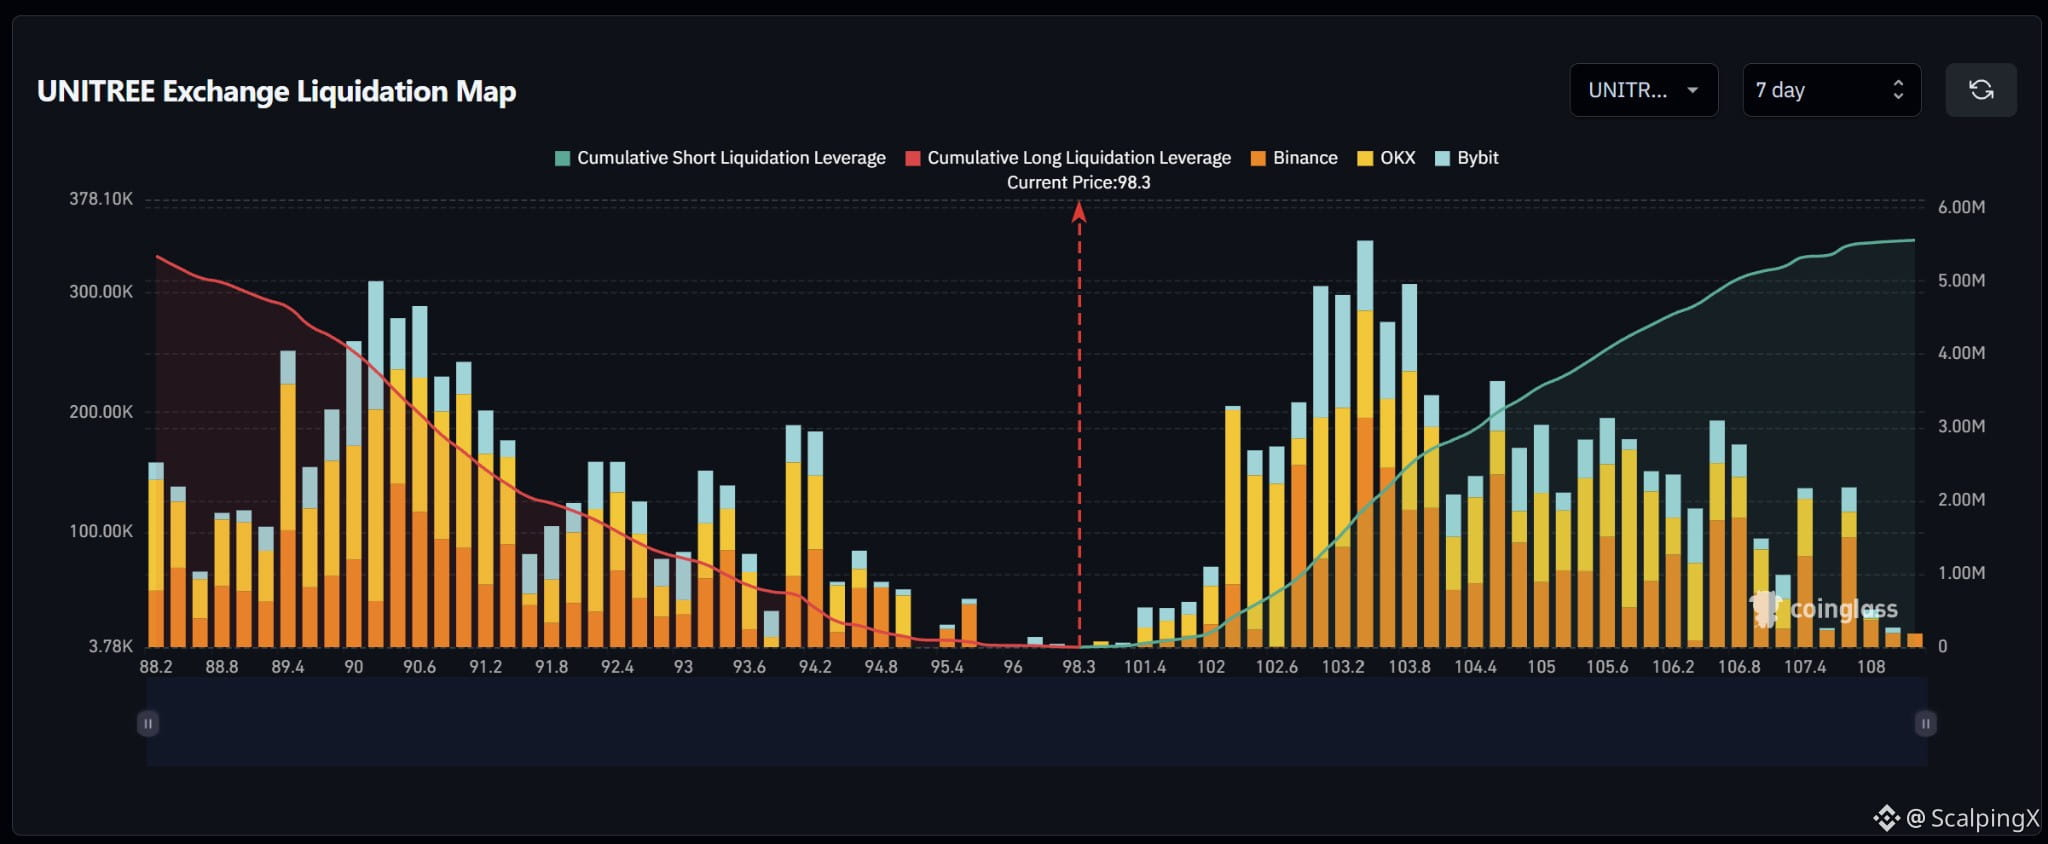
$UNITREE – Liquidation Map (7 days) – Index ~98.3
🧭 The preferred scenario is an upside short-liquidation sweep, starting at 101.4–102.0. Estimated cumulative exposure is fairly balanced, but long bars around 96–98 are small, while a major short cluster sits at 102.2–104.0.
🔺 Clearing and holding above 102.0 shifts attention to 102.2–104.0, with the largest spike near 103.4. Several consecutive large bars could amplify volatility if short liquidations are triggered.
🎯 Holding above 104.0 after the sweep brings 104.6–105.8, then 106.5–107.8, into focus. Beyond 108, additional liquidation exposure drops markedly within the displayed range.
⚖️ Losing 98 without reclaiming it weakens the upside scenario. The 96–98 range is sparse; more notable long clusters sit at 95.4–95.7, then 94.2–94.5. A sweep of 102.2–104.0 followed by a quick drop below 102 would increase the risk of a failed upside move.
#LiquidationMap
$UNITREE – Liquidation Map (7 days) – Index ~98.3
🧭 The preferred scenario is an upside short-liquidation sweep, starting at 101.4–102.0. Estimated cumulative exposure is fairly balanced, but long bars around 96–98 are small, while a major short cluster sits at 102.2–104.0.
🔺 Clearing and holding above 102.0 shifts attention to 102.2–104.0, with the largest spike near 103.4. Several consecutive large bars could amplify volatility if short liquidations are triggered.
🎯 Holding above 104.0 after the sweep brings 104.6–105.8, then 106.5–107.8, into focus. Beyond 108, additional liquidation exposure drops markedly within the displayed range.
⚖️ Losing 98 without reclaiming it weakens the upside scenario. The 96–98 range is sparse; more notable long clusters sit at 95.4–95.7, then 94.2–94.5. A sweep of 102.2–104.0 followed by a quick drop below 102 would increase the risk of a failed upside move.
#LiquidationMap
🧭 The preferred scenario is an upside short-liquidation sweep, starting at 101.4–102.0. Estimated cumulative exposure is fairly balanced, but long bars around 96–98 are small, while a major short cluster sits at 102.2–104.0.
🔺 Clearing and holding above 102.0 shifts attention to 102.2–104.0, with the largest spike near 103.4. Several consecutive large bars could amplify volatility if short liquidations are triggered.
🎯 Holding above 104.0 after the sweep brings 104.6–105.8, then 106.5–107.8, into focus. Beyond 108, additional liquidation exposure drops markedly within the displayed range.
⚖️ Losing 98 without reclaiming it weakens the upside scenario. The 96–98 range is sparse; more notable long clusters sit at 95.4–95.7, then 94.2–94.5. A sweep of 102.2–104.0 followed by a quick drop below 102 would increase the risk of a failed upside move.
#LiquidationMap
14
·
--
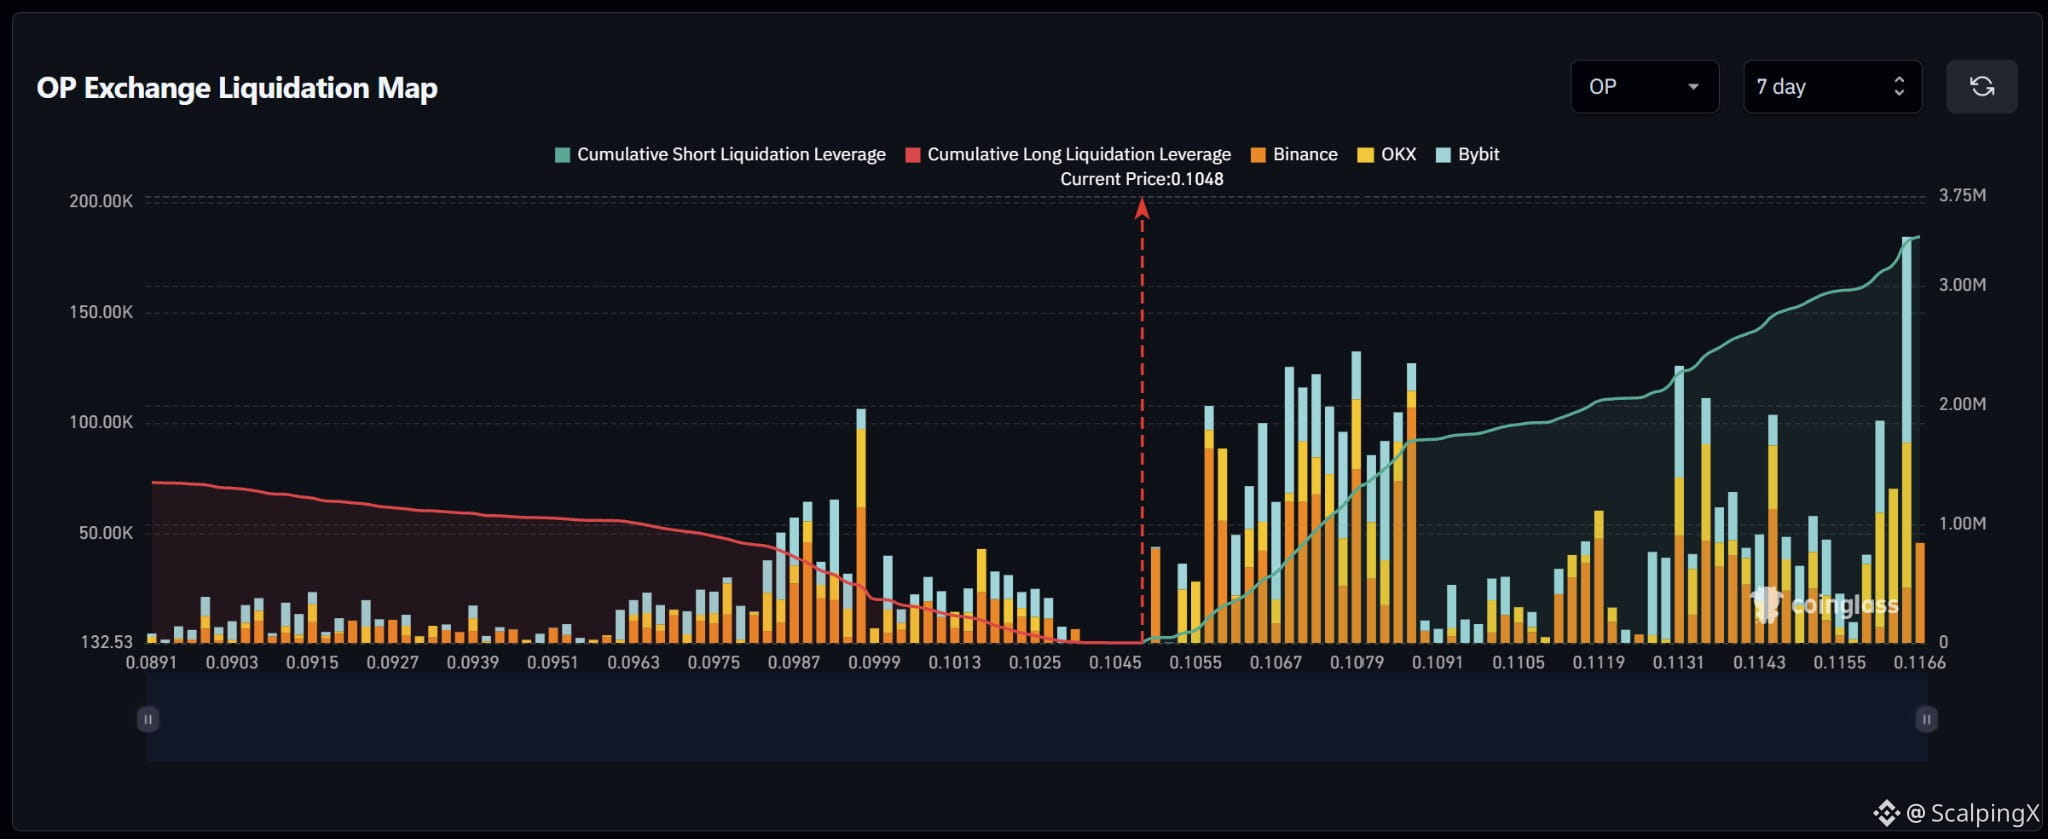
$OP – Liquidation Map (7 days) – Index ~0.1048
🧭 The preferred scenario is an upside short-liquidation sweep at 0.1056–0.1059. Short clusters are dense near price; estimated cumulative exposure is around $3.4M short versus $1.3M long within the displayed range.
🔺 Clearing and holding above 0.1059 shifts attention to 0.1063–0.1087. This range contains consecutive large bars, particularly near 0.1069, 0.1079 and 0.1087, where short liquidations could amplify volatility.
🎯 Holding above 0.1087 after the sweep brings 0.1110–0.1119, then 0.1130–0.1145, into focus. Bars around 0.1090–0.1108 are relatively small and sparse; a further large spike sits near 0.1164.
⚖️ Losing 0.1044 without reclaiming it weakens the upside scenario, shifting attention to 0.1020–0.1030, then 0.0985–0.0999. A sweep of 0.1056–0.1059 followed by a quick drop below 0.1055 would increase the risk of a failed upside move.
#LiquidationMap
$OP – Liquidation Map (7 days) – Index ~0.1048
🧭 The preferred scenario is an upside short-liquidation sweep at 0.1056–0.1059. Short clusters are dense near price; estimated cumulative exposure is around $3.4M short versus $1.3M long within the displayed range.
🔺 Clearing and holding above 0.1059 shifts attention to 0.1063–0.1087. This range contains consecutive large bars, particularly near 0.1069, 0.1079 and 0.1087, where short liquidations could amplify volatility.
🎯 Holding above 0.1087 after the sweep brings 0.1110–0.1119, then 0.1130–0.1145, into focus. Bars around 0.1090–0.1108 are relatively small and sparse; a further large spike sits near 0.1164.
⚖️ Losing 0.1044 without reclaiming it weakens the upside scenario, shifting attention to 0.1020–0.1030, then 0.0985–0.0999. A sweep of 0.1056–0.1059 followed by a quick drop below 0.1055 would increase the risk of a failed upside move.
#LiquidationMap
🧭 The preferred scenario is an upside short-liquidation sweep at 0.1056–0.1059. Short clusters are dense near price; estimated cumulative exposure is around $3.4M short versus $1.3M long within the displayed range.
🔺 Clearing and holding above 0.1059 shifts attention to 0.1063–0.1087. This range contains consecutive large bars, particularly near 0.1069, 0.1079 and 0.1087, where short liquidations could amplify volatility.
🎯 Holding above 0.1087 after the sweep brings 0.1110–0.1119, then 0.1130–0.1145, into focus. Bars around 0.1090–0.1108 are relatively small and sparse; a further large spike sits near 0.1164.
⚖️ Losing 0.1044 without reclaiming it weakens the upside scenario, shifting attention to 0.1020–0.1030, then 0.0985–0.0999. A sweep of 0.1056–0.1059 followed by a quick drop below 0.1055 would increase the risk of a failed upside move.
#LiquidationMap
20
·
--
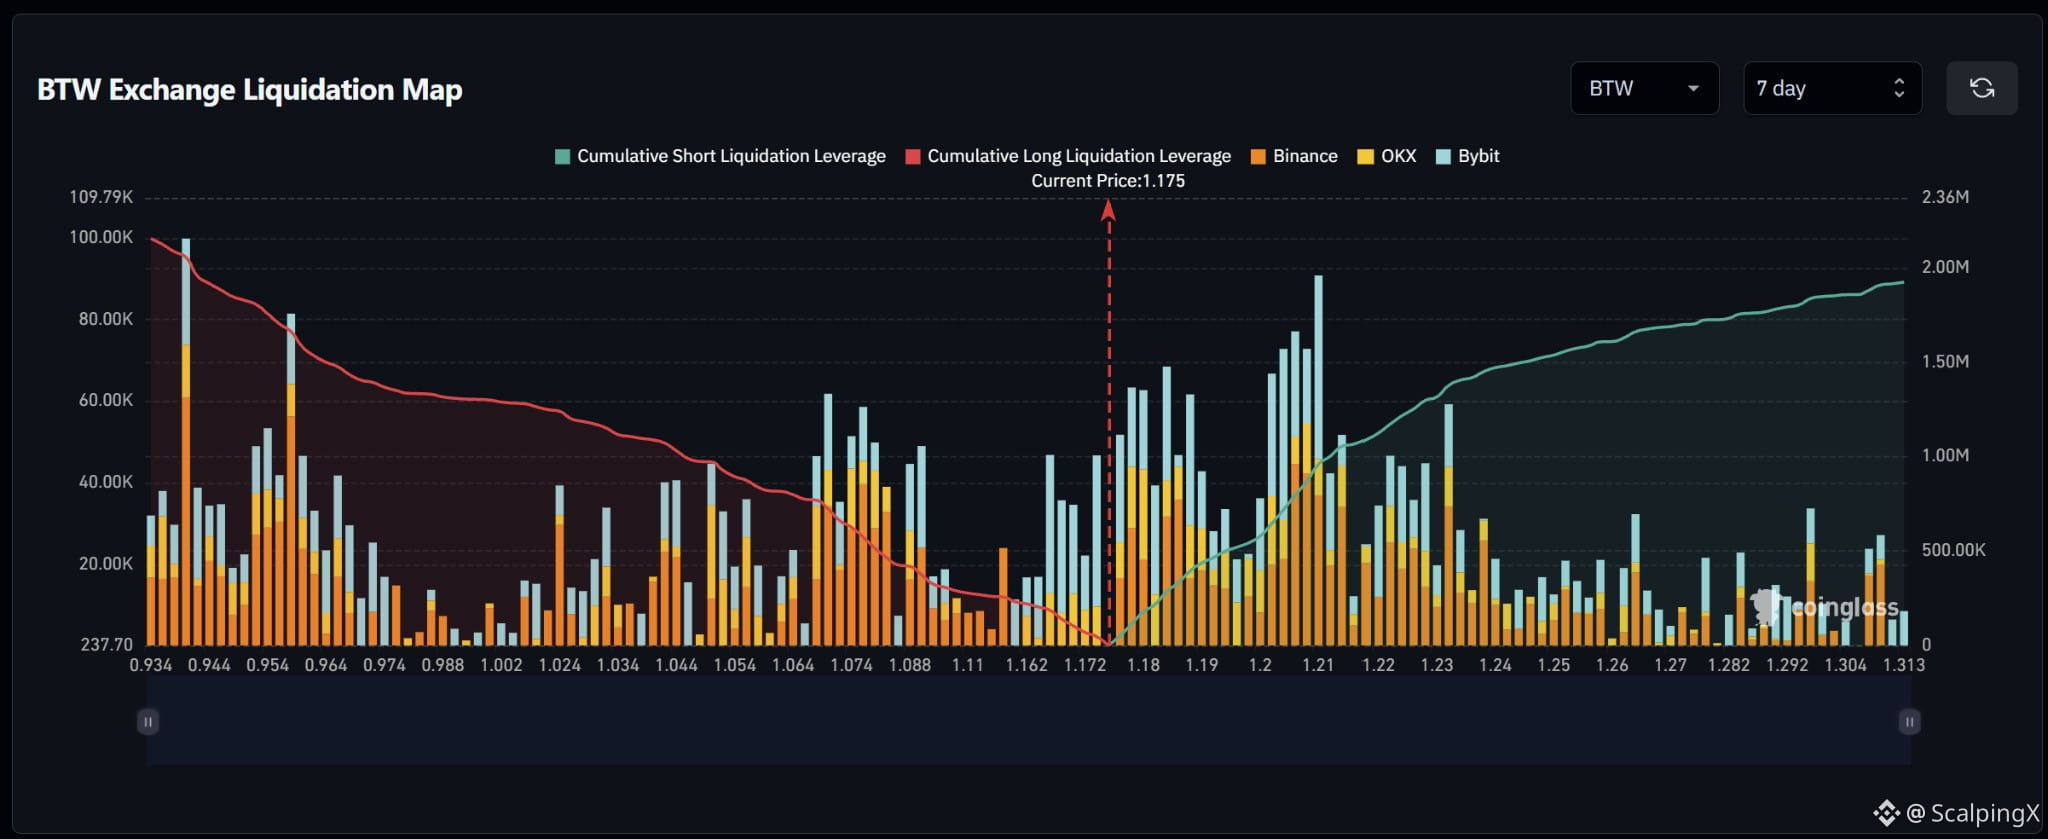
$BTW – Liquidation Map (7 days) – Index ~1.175
🧭 The preferred scenario is an upside short-liquidation sweep at 1.177–1.191, where bars cluster densely just above price. Estimated cumulative exposure is relatively balanced within the displayed range.
🔺 Clearing and holding above 1.191 shifts attention to 1.202–1.211. Bars around 1.194–1.200 are smaller, while the next range contains several consecutive large spikes, particularly near 1.210. Short liquidations here could amplify volatility.
🎯 Holding above 1.211 after the sweep brings 1.220–1.233 into focus. Beyond 1.240, bars generally become smaller and more scattered, with cumulative exposure rising more slowly.
⚖️ Losing 1.172 without reclaiming it weakens the upside scenario, shifting attention to long clusters at 1.165–1.170, then 1.158–1.163. A sweep of 1.180–1.191 followed by a quick drop below 1.180 would increase the risk of a failed upside move.
#LiquidationMap
$BTW – Liquidation Map (7 days) – Index ~1.175
🧭 The preferred scenario is an upside short-liquidation sweep at 1.177–1.191, where bars cluster densely just above price. Estimated cumulative exposure is relatively balanced within the displayed range.
🔺 Clearing and holding above 1.191 shifts attention to 1.202–1.211. Bars around 1.194–1.200 are smaller, while the next range contains several consecutive large spikes, particularly near 1.210. Short liquidations here could amplify volatility.
🎯 Holding above 1.211 after the sweep brings 1.220–1.233 into focus. Beyond 1.240, bars generally become smaller and more scattered, with cumulative exposure rising more slowly.
⚖️ Losing 1.172 without reclaiming it weakens the upside scenario, shifting attention to long clusters at 1.165–1.170, then 1.158–1.163. A sweep of 1.180–1.191 followed by a quick drop below 1.180 would increase the risk of a failed upside move.
#LiquidationMap
🧭 The preferred scenario is an upside short-liquidation sweep at 1.177–1.191, where bars cluster densely just above price. Estimated cumulative exposure is relatively balanced within the displayed range.
🔺 Clearing and holding above 1.191 shifts attention to 1.202–1.211. Bars around 1.194–1.200 are smaller, while the next range contains several consecutive large spikes, particularly near 1.210. Short liquidations here could amplify volatility.
🎯 Holding above 1.211 after the sweep brings 1.220–1.233 into focus. Beyond 1.240, bars generally become smaller and more scattered, with cumulative exposure rising more slowly.
⚖️ Losing 1.172 without reclaiming it weakens the upside scenario, shifting attention to long clusters at 1.165–1.170, then 1.158–1.163. A sweep of 1.180–1.191 followed by a quick drop below 1.180 would increase the risk of a failed upside move.
#LiquidationMap
129
·
--
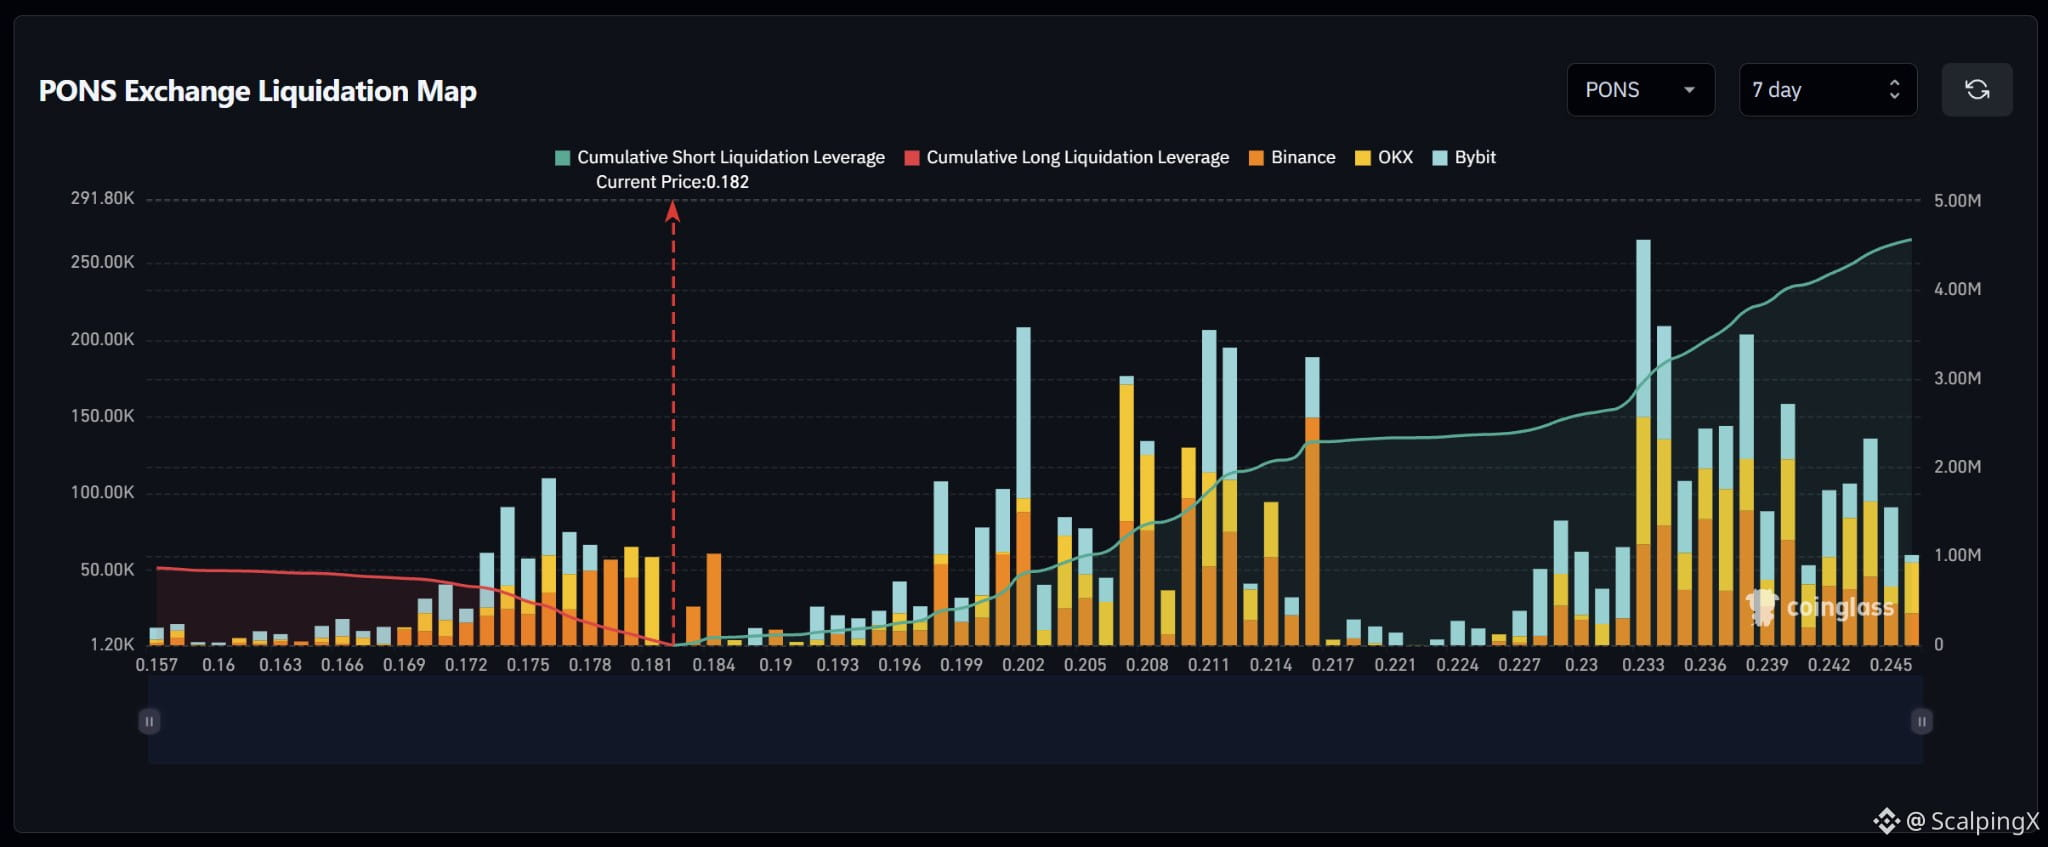
$PONS – Liquidation Map (7 days) – Index ~0.182
🧭 The preferred scenario is a nearby long-liquidation sweep at 0.179–0.181. Estimated cumulative short exposure is substantially larger, but most strong clusters sit further away at 0.198–0.216 and 0.233–0.245.
🔻 Losing 0.181 without reclaiming it shifts attention to 0.179, then 0.174–0.178. The bar near 0.176 is the largest long-side spike; consecutive liquidations across this range could amplify volatility.
🎯 A further break below 0.174 brings 0.170–0.173 into focus. Below 0.169, additional liquidation exposure is limited. A sweep of 0.179–0.181 followed by a quick reclaim of 0.182 would weaken the downside scenario.
⚖️ Clearing and holding above the nearest short cluster at 0.184–0.185 shifts attention to 0.198–0.205, then 0.207–0.216. Bars around 0.189–0.196 are smaller, while 0.217–0.227 is sparse. The next major cluster lies at 0.233–0.245, with a prominent spike near 0.233.
#LiquidationMap
$PONS – Liquidation Map (7 days) – Index ~0.182
🧭 The preferred scenario is a nearby long-liquidation sweep at 0.179–0.181. Estimated cumulative short exposure is substantially larger, but most strong clusters sit further away at 0.198–0.216 and 0.233–0.245.
🔻 Losing 0.181 without reclaiming it shifts attention to 0.179, then 0.174–0.178. The bar near 0.176 is the largest long-side spike; consecutive liquidations across this range could amplify volatility.
🎯 A further break below 0.174 brings 0.170–0.173 into focus. Below 0.169, additional liquidation exposure is limited. A sweep of 0.179–0.181 followed by a quick reclaim of 0.182 would weaken the downside scenario.
⚖️ Clearing and holding above the nearest short cluster at 0.184–0.185 shifts attention to 0.198–0.205, then 0.207–0.216. Bars around 0.189–0.196 are smaller, while 0.217–0.227 is sparse. The next major cluster lies at 0.233–0.245, with a prominent spike near 0.233.
#LiquidationMap
🧭 The preferred scenario is a nearby long-liquidation sweep at 0.179–0.181. Estimated cumulative short exposure is substantially larger, but most strong clusters sit further away at 0.198–0.216 and 0.233–0.245.
🔻 Losing 0.181 without reclaiming it shifts attention to 0.179, then 0.174–0.178. The bar near 0.176 is the largest long-side spike; consecutive liquidations across this range could amplify volatility.
🎯 A further break below 0.174 brings 0.170–0.173 into focus. Below 0.169, additional liquidation exposure is limited. A sweep of 0.179–0.181 followed by a quick reclaim of 0.182 would weaken the downside scenario.
⚖️ Clearing and holding above the nearest short cluster at 0.184–0.185 shifts attention to 0.198–0.205, then 0.207–0.216. Bars around 0.189–0.196 are smaller, while 0.217–0.227 is sparse. The next major cluster lies at 0.233–0.245, with a prominent spike near 0.233.
#LiquidationMap
38
·
--
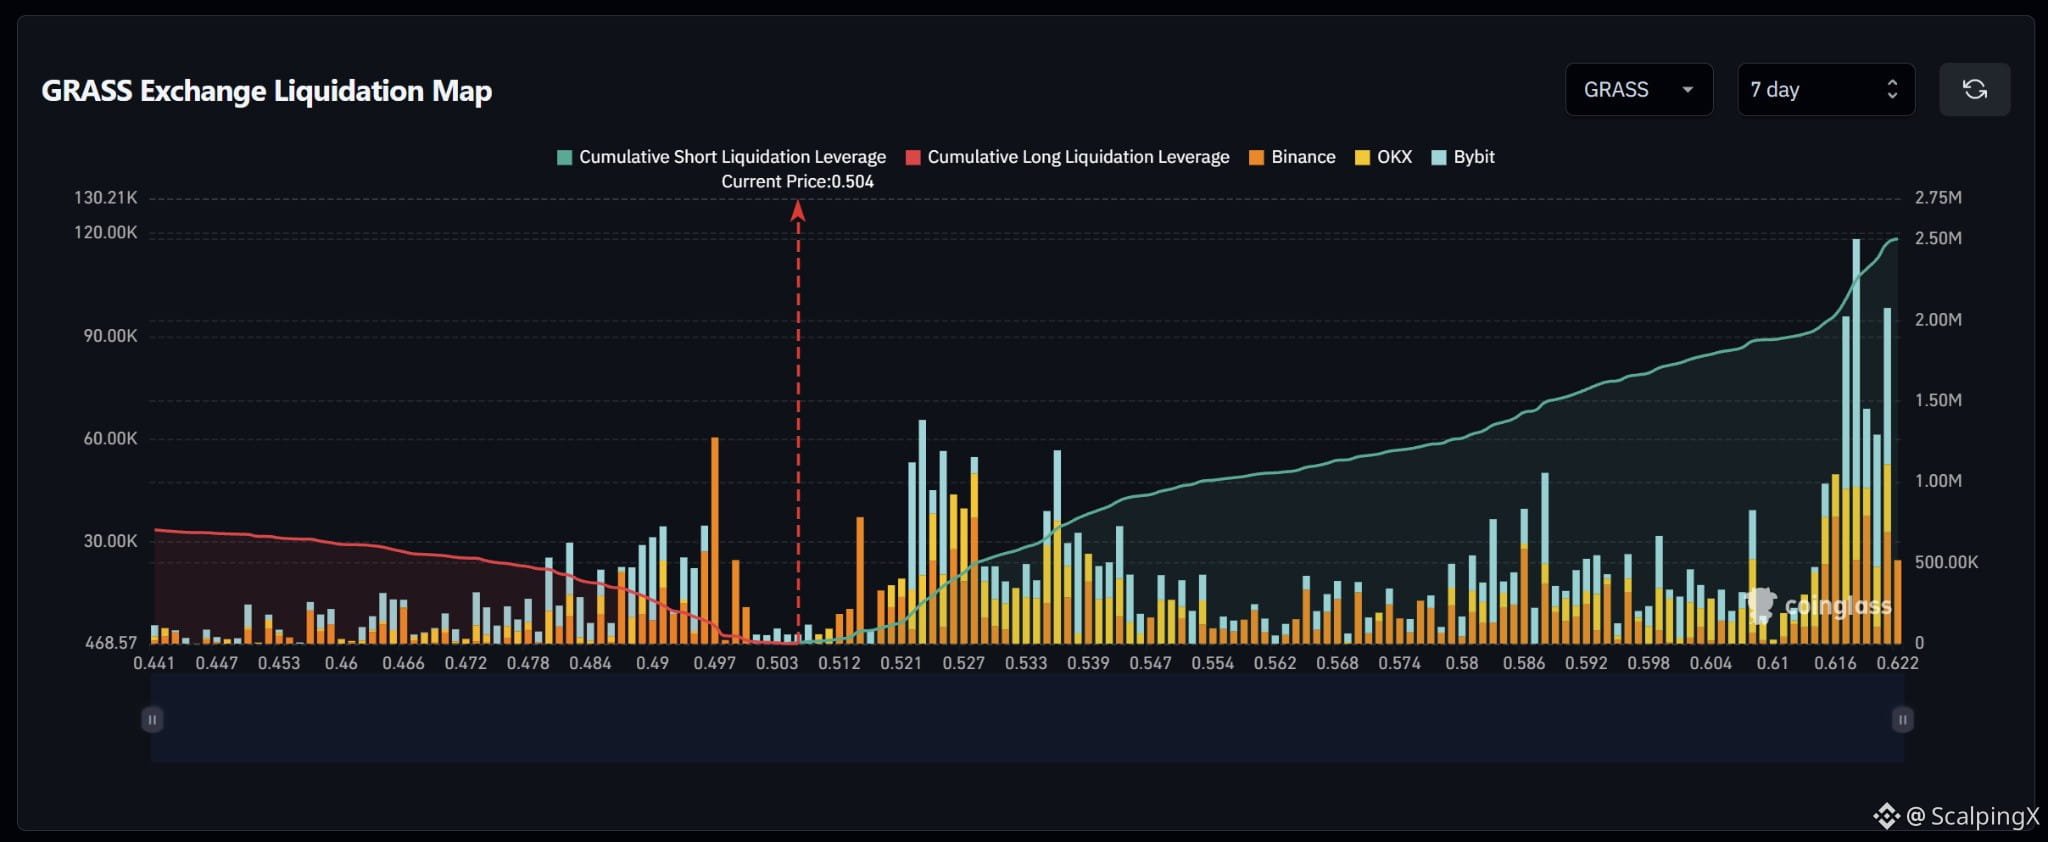
$GRASS – Liquidation Map (7 days) – Index ~0.504
🧭 The preferred scenario is a nearby long-liquidation sweep at 0.495–0.498, particularly near 0.496. Estimated cumulative short exposure is substantially larger, but the biggest cluster sits far away at 0.615–0.621.
🔻 Losing 0.501 without reclaiming it shifts attention to 0.495–0.498. Holding below 0.495 after the sweep brings 0.489–0.494, then 0.480–0.485, into focus. Below 0.478, bars generally become smaller and sparser.
🎯 A sweep near 0.496 followed by a quick reclaim of 0.501 would weaken the downside scenario. Attention would then turn to the reaction at 0.513–0.515 before shifting toward denser short clusters.
⚖️ Clearing and holding above 0.515 brings 0.521–0.529 and 0.535–0.544 into view. The bar near 0.523 stands out locally. Above 0.547, clusters are more scattered before the major 0.615–0.621 range. Larger total short exposure does not imply a direct move there.
#LiquidationMap
$GRASS – Liquidation Map (7 days) – Index ~0.504
🧭 The preferred scenario is a nearby long-liquidation sweep at 0.495–0.498, particularly near 0.496. Estimated cumulative short exposure is substantially larger, but the biggest cluster sits far away at 0.615–0.621.
🔻 Losing 0.501 without reclaiming it shifts attention to 0.495–0.498. Holding below 0.495 after the sweep brings 0.489–0.494, then 0.480–0.485, into focus. Below 0.478, bars generally become smaller and sparser.
🎯 A sweep near 0.496 followed by a quick reclaim of 0.501 would weaken the downside scenario. Attention would then turn to the reaction at 0.513–0.515 before shifting toward denser short clusters.
⚖️ Clearing and holding above 0.515 brings 0.521–0.529 and 0.535–0.544 into view. The bar near 0.523 stands out locally. Above 0.547, clusters are more scattered before the major 0.615–0.621 range. Larger total short exposure does not imply a direct move there.
#LiquidationMap
🧭 The preferred scenario is a nearby long-liquidation sweep at 0.495–0.498, particularly near 0.496. Estimated cumulative short exposure is substantially larger, but the biggest cluster sits far away at 0.615–0.621.
🔻 Losing 0.501 without reclaiming it shifts attention to 0.495–0.498. Holding below 0.495 after the sweep brings 0.489–0.494, then 0.480–0.485, into focus. Below 0.478, bars generally become smaller and sparser.
🎯 A sweep near 0.496 followed by a quick reclaim of 0.501 would weaken the downside scenario. Attention would then turn to the reaction at 0.513–0.515 before shifting toward denser short clusters.
⚖️ Clearing and holding above 0.515 brings 0.521–0.529 and 0.535–0.544 into view. The bar near 0.523 stands out locally. Above 0.547, clusters are more scattered before the major 0.615–0.621 range. Larger total short exposure does not imply a direct move there.
#LiquidationMap
15
·
--
Bullish
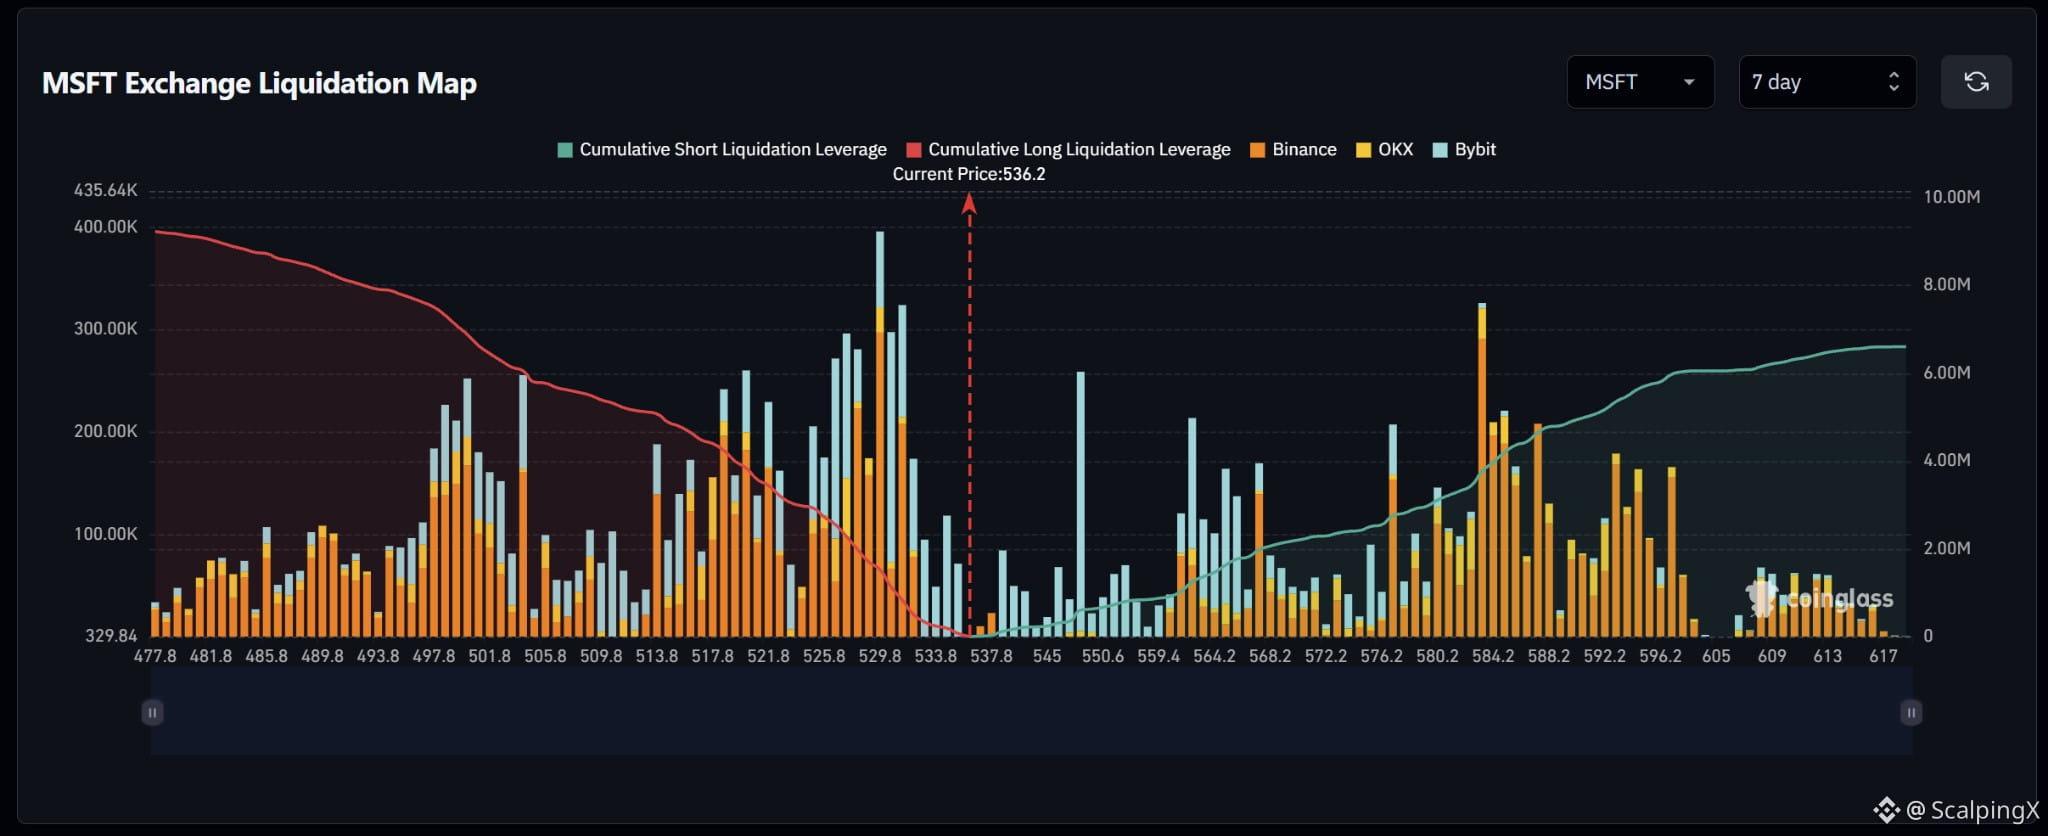
$MSFT – Liquidation Map (7 days) – Index ~536.2
🧭 The preferred scenario is a downside long-liquidation sweep at 532–534, followed by 526–532. Large long clusters sit closer to price than the short clusters. Estimated cumulative exposure is around $9.2M long versus $6.6M short within the displayed range.
🔻 Losing 534 without reclaiming it shifts attention to 529–532. The bar near 529.8 is the map’s largest, approaching $400,000; long liquidations here could amplify volatility.
🎯 Holding below 529 after the sweep brings 525–528, then 517–522, into focus. Conversely, a sweep of 532–534 followed by a quick reclaim of 536.2 would weaken the downside scenario.
⚖️ Clearing and holding above 545 shifts attention to short bars around 547–551, particularly near 547. The 552–559 range is sparse; subsequent clusters sit at 561–568 and 582–588. The large spike near 583 is notable but remains far from the snapshot price.
#LiquidationMap
$MSFT – Liquidation Map (7 days) – Index ~536.2
🧭 The preferred scenario is a downside long-liquidation sweep at 532–534, followed by 526–532. Large long clusters sit closer to price than the short clusters. Estimated cumulative exposure is around $9.2M long versus $6.6M short within the displayed range.
🔻 Losing 534 without reclaiming it shifts attention to 529–532. The bar near 529.8 is the map’s largest, approaching $400,000; long liquidations here could amplify volatility.
🎯 Holding below 529 after the sweep brings 525–528, then 517–522, into focus. Conversely, a sweep of 532–534 followed by a quick reclaim of 536.2 would weaken the downside scenario.
⚖️ Clearing and holding above 545 shifts attention to short bars around 547–551, particularly near 547. The 552–559 range is sparse; subsequent clusters sit at 561–568 and 582–588. The large spike near 583 is notable but remains far from the snapshot price.
#LiquidationMap
🧭 The preferred scenario is a downside long-liquidation sweep at 532–534, followed by 526–532. Large long clusters sit closer to price than the short clusters. Estimated cumulative exposure is around $9.2M long versus $6.6M short within the displayed range.
🔻 Losing 534 without reclaiming it shifts attention to 529–532. The bar near 529.8 is the map’s largest, approaching $400,000; long liquidations here could amplify volatility.
🎯 Holding below 529 after the sweep brings 525–528, then 517–522, into focus. Conversely, a sweep of 532–534 followed by a quick reclaim of 536.2 would weaken the downside scenario.
⚖️ Clearing and holding above 545 shifts attention to short bars around 547–551, particularly near 547. The 552–559 range is sparse; subsequent clusters sit at 561–568 and 582–588. The large spike near 583 is notable but remains far from the snapshot price.
#LiquidationMap
8
·
--
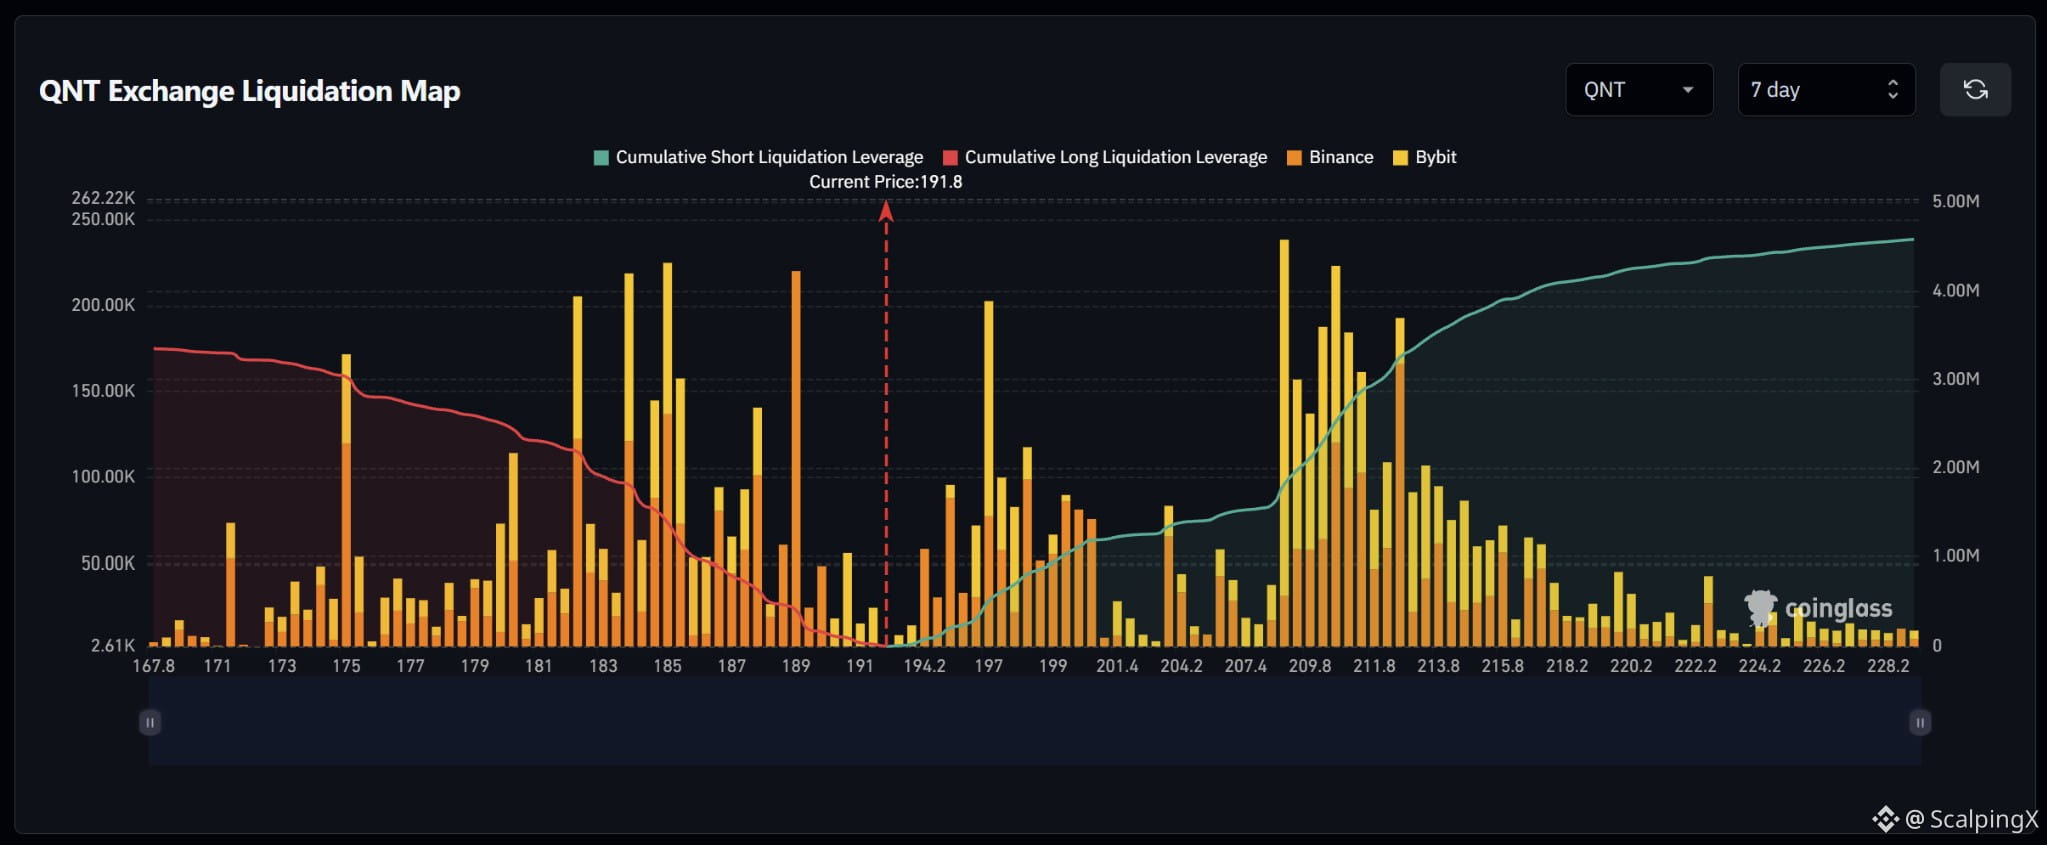
$QNT – Liquidation Map (7 days) – Index ~191.8
🧭 The preferred scenario is a long-liquidation sweep around 188.8–189.2, where a large bar sits close to price. Although estimated cumulative short exposure exceeds the long side, the densest short cluster lies further away at 208.5–213.5.
🔻 Losing 191 without reclaiming it shifts attention to 188.8–189.2. Holding below 188.8 after the sweep brings clusters around 187.5–188.0, then 183–185.5, into focus.
🎯 Several large long bars sit within 183–185.5, potentially amplifying volatility if liquidations trigger in succession. Conversely, a sweep near 189 followed by a quick reclaim of 191 would weaken the downside scenario.
⚖️ Clearing and holding above 195 shifts attention to short clusters at 196.5–198.5, then 199–200.5. Bars around 201–207 are sparse; 208.5–213.5 is the next major cluster, with notable spikes near 209 and 210.5. Beyond 218, additional liquidation exposure drops markedly.
#LiquidationMap
$QNT – Liquidation Map (7 days) – Index ~191.8
🧭 The preferred scenario is a long-liquidation sweep around 188.8–189.2, where a large bar sits close to price. Although estimated cumulative short exposure exceeds the long side, the densest short cluster lies further away at 208.5–213.5.
🔻 Losing 191 without reclaiming it shifts attention to 188.8–189.2. Holding below 188.8 after the sweep brings clusters around 187.5–188.0, then 183–185.5, into focus.
🎯 Several large long bars sit within 183–185.5, potentially amplifying volatility if liquidations trigger in succession. Conversely, a sweep near 189 followed by a quick reclaim of 191 would weaken the downside scenario.
⚖️ Clearing and holding above 195 shifts attention to short clusters at 196.5–198.5, then 199–200.5. Bars around 201–207 are sparse; 208.5–213.5 is the next major cluster, with notable spikes near 209 and 210.5. Beyond 218, additional liquidation exposure drops markedly.
#LiquidationMap
🧭 The preferred scenario is a long-liquidation sweep around 188.8–189.2, where a large bar sits close to price. Although estimated cumulative short exposure exceeds the long side, the densest short cluster lies further away at 208.5–213.5.
🔻 Losing 191 without reclaiming it shifts attention to 188.8–189.2. Holding below 188.8 after the sweep brings clusters around 187.5–188.0, then 183–185.5, into focus.
🎯 Several large long bars sit within 183–185.5, potentially amplifying volatility if liquidations trigger in succession. Conversely, a sweep near 189 followed by a quick reclaim of 191 would weaken the downside scenario.
⚖️ Clearing and holding above 195 shifts attention to short clusters at 196.5–198.5, then 199–200.5. Bars around 201–207 are sparse; 208.5–213.5 is the next major cluster, with notable spikes near 209 and 210.5. Beyond 218, additional liquidation exposure drops markedly.
#LiquidationMap
24
·
--
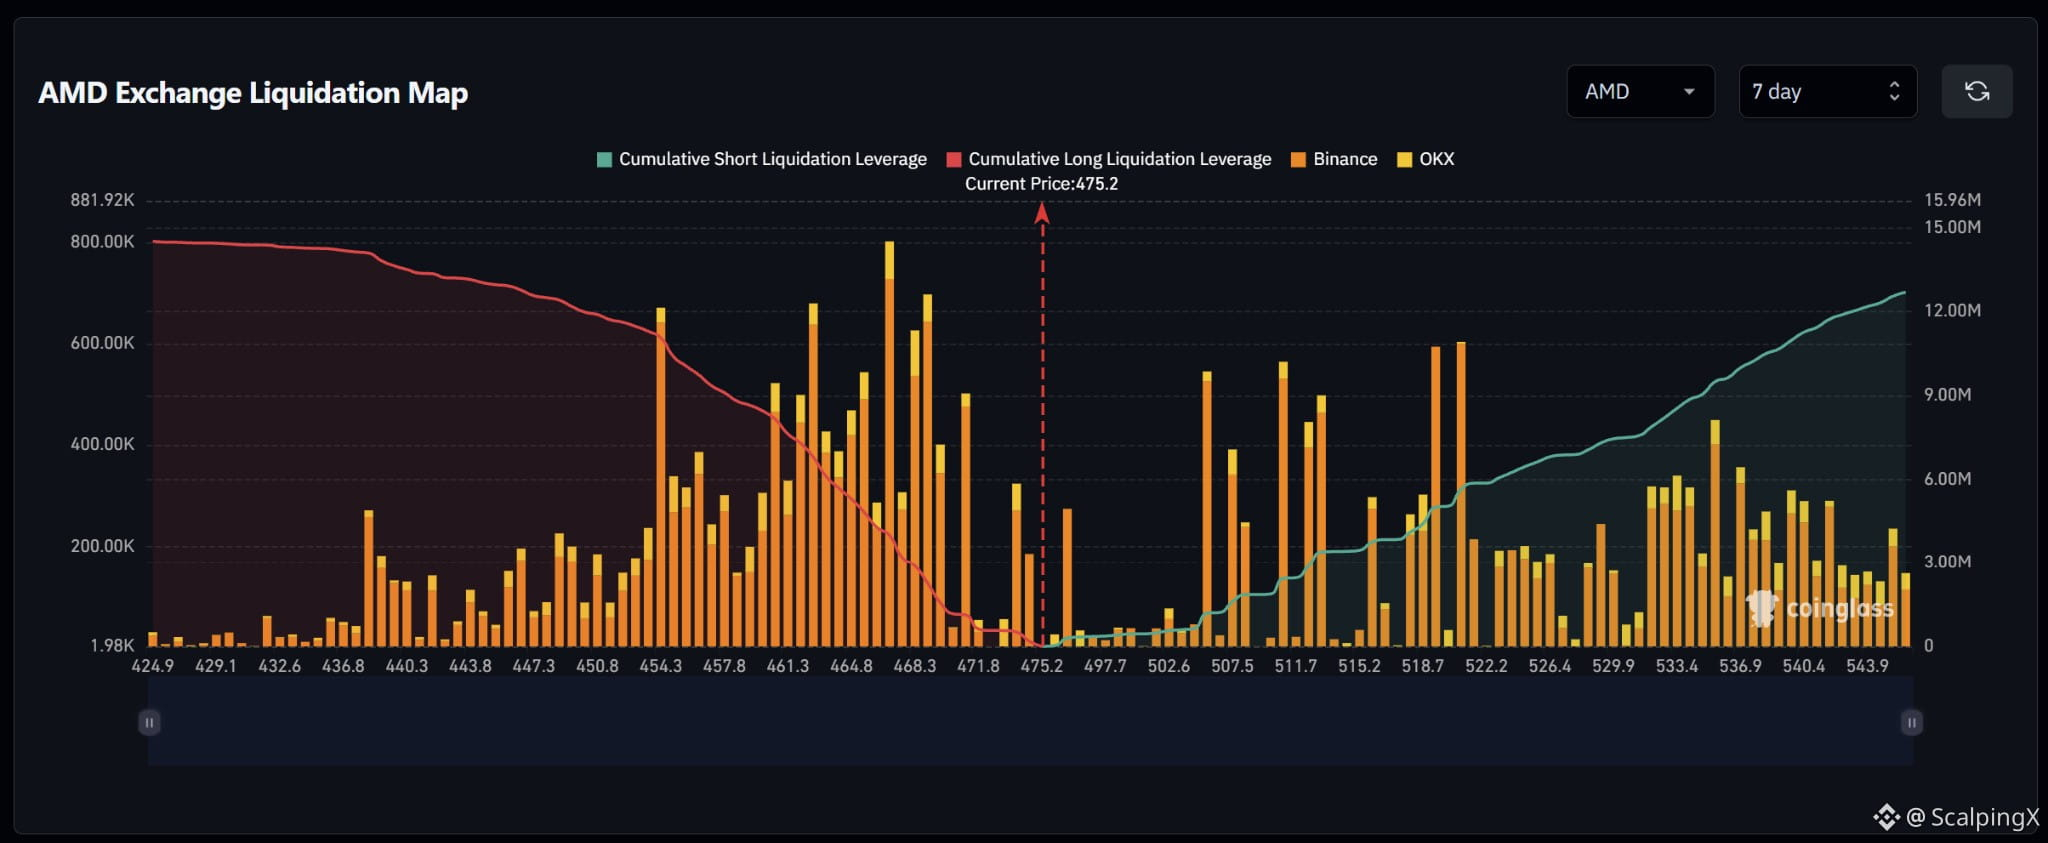
$AMD – Liquidation Map (7 days) – Index ~475.2
🧭 The preferred scenario is a downside long-liquidation sweep at 473–474, followed by 468–471. Dense long clusters sit closer to price than the larger short clusters above; estimated cumulative exposure is relatively balanced within the displayed range.
🔻 Losing 473 without reclaiming it shifts attention to 468–471. Holding below 468 after the sweep brings 466–467 into focus, where the map’s largest bar reaches roughly $800,000.
🎯 A further break below 466 brings 461–465, then 454–458, into view. Consecutive long liquidations across this range could amplify volatility. A sweep of 473–474 followed by a quick reclaim of 475.2 would weaken the downside scenario.
⚖️ If price advances and holds above 503, attention shifts to short clusters at 505–508, 511–513 and 518–521. Bars around 498–503 are small, while larger upside spikes are more scattered; sustained momentum would help distinguish continuation from an isolated sweep.
#LiquidationMap
$AMD – Liquidation Map (7 days) – Index ~475.2
🧭 The preferred scenario is a downside long-liquidation sweep at 473–474, followed by 468–471. Dense long clusters sit closer to price than the larger short clusters above; estimated cumulative exposure is relatively balanced within the displayed range.
🔻 Losing 473 without reclaiming it shifts attention to 468–471. Holding below 468 after the sweep brings 466–467 into focus, where the map’s largest bar reaches roughly $800,000.
🎯 A further break below 466 brings 461–465, then 454–458, into view. Consecutive long liquidations across this range could amplify volatility. A sweep of 473–474 followed by a quick reclaim of 475.2 would weaken the downside scenario.
⚖️ If price advances and holds above 503, attention shifts to short clusters at 505–508, 511–513 and 518–521. Bars around 498–503 are small, while larger upside spikes are more scattered; sustained momentum would help distinguish continuation from an isolated sweep.
#LiquidationMap
🧭 The preferred scenario is a downside long-liquidation sweep at 473–474, followed by 468–471. Dense long clusters sit closer to price than the larger short clusters above; estimated cumulative exposure is relatively balanced within the displayed range.
🔻 Losing 473 without reclaiming it shifts attention to 468–471. Holding below 468 after the sweep brings 466–467 into focus, where the map’s largest bar reaches roughly $800,000.
🎯 A further break below 466 brings 461–465, then 454–458, into view. Consecutive long liquidations across this range could amplify volatility. A sweep of 473–474 followed by a quick reclaim of 475.2 would weaken the downside scenario.
⚖️ If price advances and holds above 503, attention shifts to short clusters at 505–508, 511–513 and 518–521. Bars around 498–503 are small, while larger upside spikes are more scattered; sustained momentum would help distinguish continuation from an isolated sweep.
#LiquidationMap
13
·
--
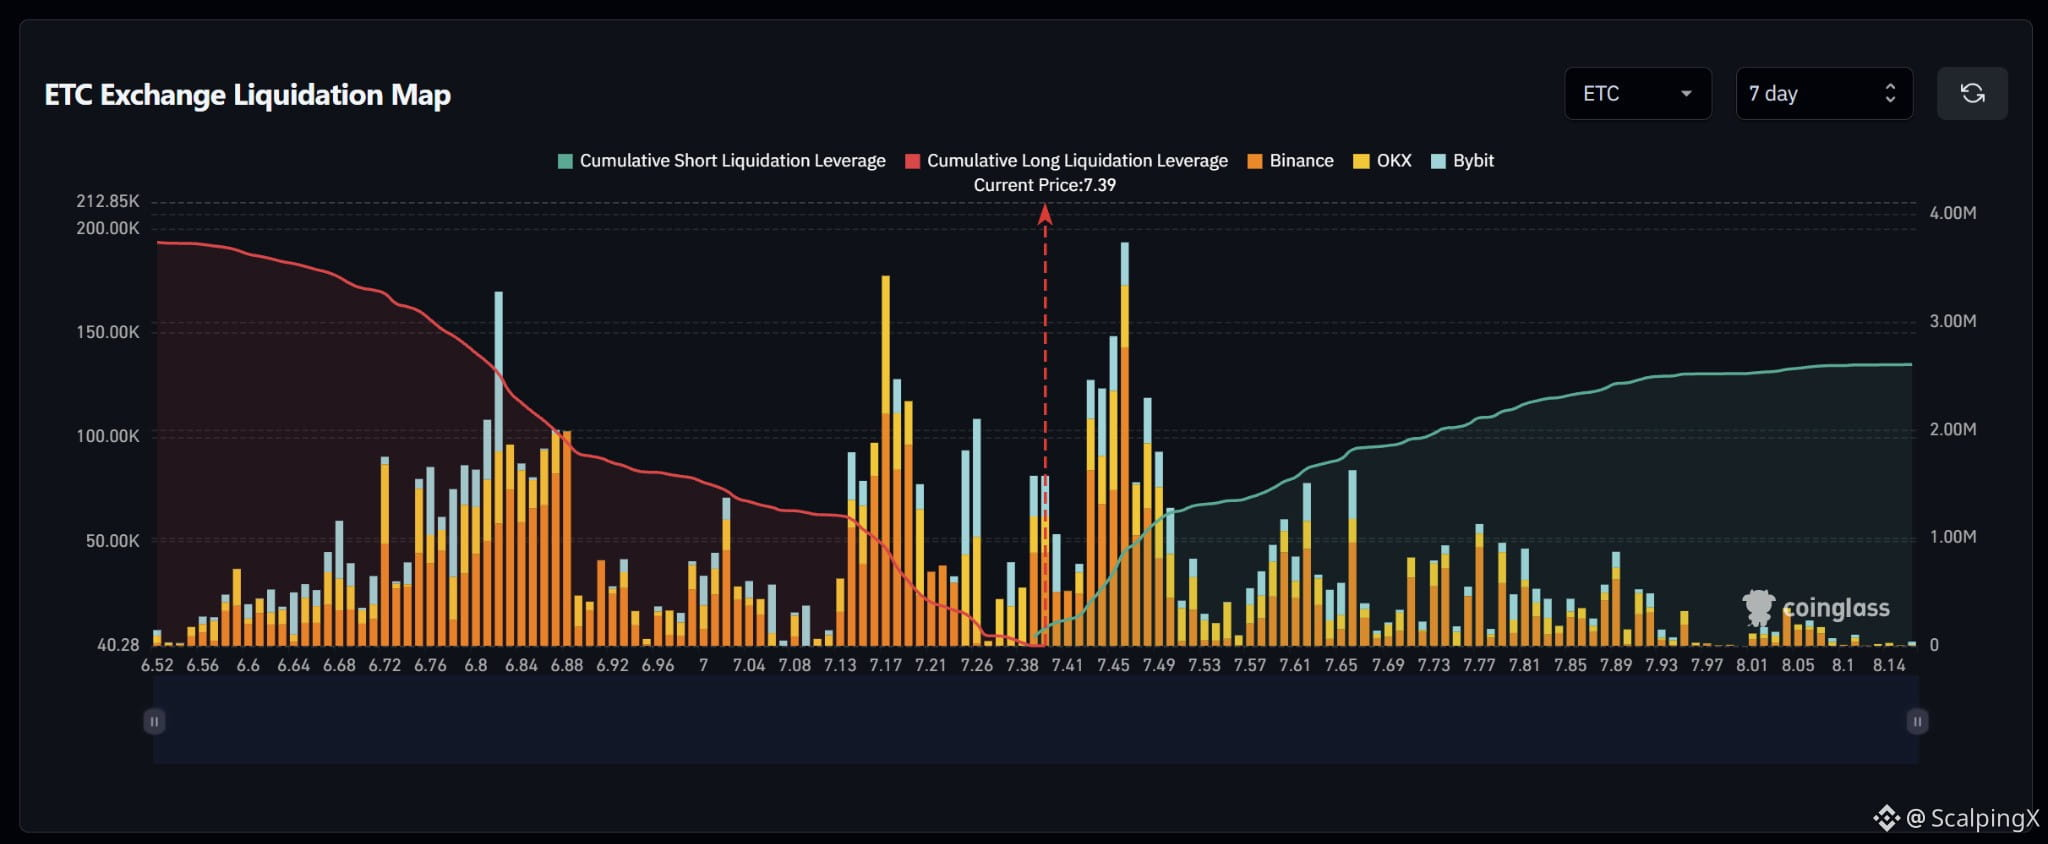
$ETC – Liquidation Map (7 days) – Index ~7.39
🧭 The preferred scenario is a short-liquidation sweep at 7.43–7.49, where bars are densely clustered close to price. Estimated cumulative long exposure exceeds the short side, but the stronger long clusters sit further below.
🔺 Clearing and holding above 7.42 shifts attention to 7.43–7.49, with the largest spike near 7.46. Short liquidations could amplify volatility here; holding the area after the sweep would support continuation.
🎯 Holding above 7.49 brings 7.58–7.66 into focus. Bars around 7.51–7.56 are relatively small and sparse. Further out, scattered clusters sit at 7.72–7.81, while additional liquidation exposure above 8.00 is limited.
⚖️ Losing 7.37 without reclaiming it weakens the upside scenario, shifting attention to 7.25–7.28, then 7.14–7.20, with a large bar near 7.17. A sweep of 7.43–7.49 followed by a quick drop below 7.42 would increase the risk of a failed upside move.
#LiquidationMap
$ETC – Liquidation Map (7 days) – Index ~7.39
🧭 The preferred scenario is a short-liquidation sweep at 7.43–7.49, where bars are densely clustered close to price. Estimated cumulative long exposure exceeds the short side, but the stronger long clusters sit further below.
🔺 Clearing and holding above 7.42 shifts attention to 7.43–7.49, with the largest spike near 7.46. Short liquidations could amplify volatility here; holding the area after the sweep would support continuation.
🎯 Holding above 7.49 brings 7.58–7.66 into focus. Bars around 7.51–7.56 are relatively small and sparse. Further out, scattered clusters sit at 7.72–7.81, while additional liquidation exposure above 8.00 is limited.
⚖️ Losing 7.37 without reclaiming it weakens the upside scenario, shifting attention to 7.25–7.28, then 7.14–7.20, with a large bar near 7.17. A sweep of 7.43–7.49 followed by a quick drop below 7.42 would increase the risk of a failed upside move.
#LiquidationMap
🧭 The preferred scenario is a short-liquidation sweep at 7.43–7.49, where bars are densely clustered close to price. Estimated cumulative long exposure exceeds the short side, but the stronger long clusters sit further below.
🔺 Clearing and holding above 7.42 shifts attention to 7.43–7.49, with the largest spike near 7.46. Short liquidations could amplify volatility here; holding the area after the sweep would support continuation.
🎯 Holding above 7.49 brings 7.58–7.66 into focus. Bars around 7.51–7.56 are relatively small and sparse. Further out, scattered clusters sit at 7.72–7.81, while additional liquidation exposure above 8.00 is limited.
⚖️ Losing 7.37 without reclaiming it weakens the upside scenario, shifting attention to 7.25–7.28, then 7.14–7.20, with a large bar near 7.17. A sweep of 7.43–7.49 followed by a quick drop below 7.42 would increase the risk of a failed upside move.
#LiquidationMap
14
·
--
Bullish
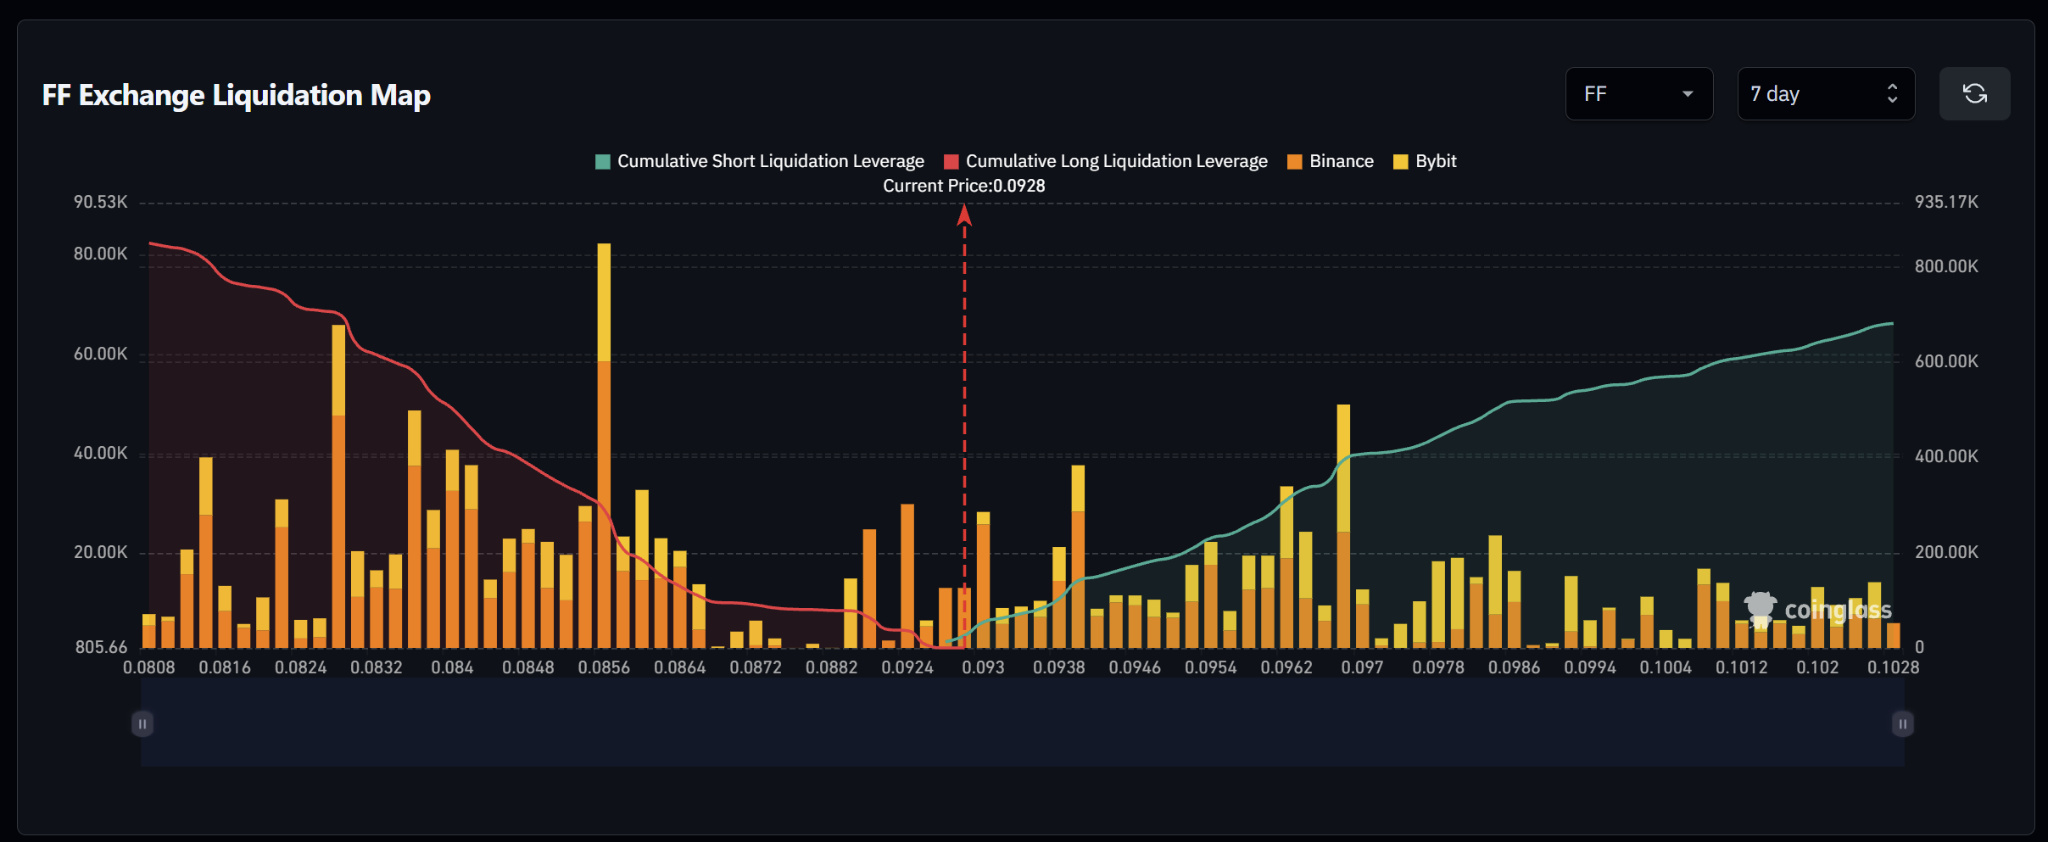
$FF – Liquidation Map (7 days) – Index ~0.0928
🧭 The preferred scenario is a nearby short-liquidation sweep at 0.0930–0.0941. Estimated cumulative long exposure exceeds the short side, but the strongest long cluster sits further away at 0.0835–0.0864.
🔺 Clearing and holding above 0.0930 shifts attention to 0.0938–0.0941, with a notable bar near 0.0940. Bars around 0.0943–0.0950 are relatively small, making sustained momentum after the sweep worth watching.
🎯 Holding above 0.0950 brings 0.0952–0.0963, then 0.0968–0.0970, into focus. The bar near 0.0968 is the largest short-side spike and could amplify volatility if liquidations are triggered. Beyond 0.0970, clusters generally become smaller and more scattered.
⚖️ Losing 0.0924 without reclaiming it weakens the upside scenario, shifting attention to nearby long bars below. The larger 0.0835–0.0864 cluster, particularly near 0.0856, becomes relevant only in a deeper decline. A sweep near 0.0940 followed by a drop below 0.0930 increases the risk of a failed upside move.
#LiquidationMap
$FF – Liquidation Map (7 days) – Index ~0.0928
🧭 The preferred scenario is a nearby short-liquidation sweep at 0.0930–0.0941. Estimated cumulative long exposure exceeds the short side, but the strongest long cluster sits further away at 0.0835–0.0864.
🔺 Clearing and holding above 0.0930 shifts attention to 0.0938–0.0941, with a notable bar near 0.0940. Bars around 0.0943–0.0950 are relatively small, making sustained momentum after the sweep worth watching.
🎯 Holding above 0.0950 brings 0.0952–0.0963, then 0.0968–0.0970, into focus. The bar near 0.0968 is the largest short-side spike and could amplify volatility if liquidations are triggered. Beyond 0.0970, clusters generally become smaller and more scattered.
⚖️ Losing 0.0924 without reclaiming it weakens the upside scenario, shifting attention to nearby long bars below. The larger 0.0835–0.0864 cluster, particularly near 0.0856, becomes relevant only in a deeper decline. A sweep near 0.0940 followed by a drop below 0.0930 increases the risk of a failed upside move.
#LiquidationMap
🧭 The preferred scenario is a nearby short-liquidation sweep at 0.0930–0.0941. Estimated cumulative long exposure exceeds the short side, but the strongest long cluster sits further away at 0.0835–0.0864.
🔺 Clearing and holding above 0.0930 shifts attention to 0.0938–0.0941, with a notable bar near 0.0940. Bars around 0.0943–0.0950 are relatively small, making sustained momentum after the sweep worth watching.
🎯 Holding above 0.0950 brings 0.0952–0.0963, then 0.0968–0.0970, into focus. The bar near 0.0968 is the largest short-side spike and could amplify volatility if liquidations are triggered. Beyond 0.0970, clusters generally become smaller and more scattered.
⚖️ Losing 0.0924 without reclaiming it weakens the upside scenario, shifting attention to nearby long bars below. The larger 0.0835–0.0864 cluster, particularly near 0.0856, becomes relevant only in a deeper decline. A sweep near 0.0940 followed by a drop below 0.0930 increases the risk of a failed upside move.
#LiquidationMap
14
·
--
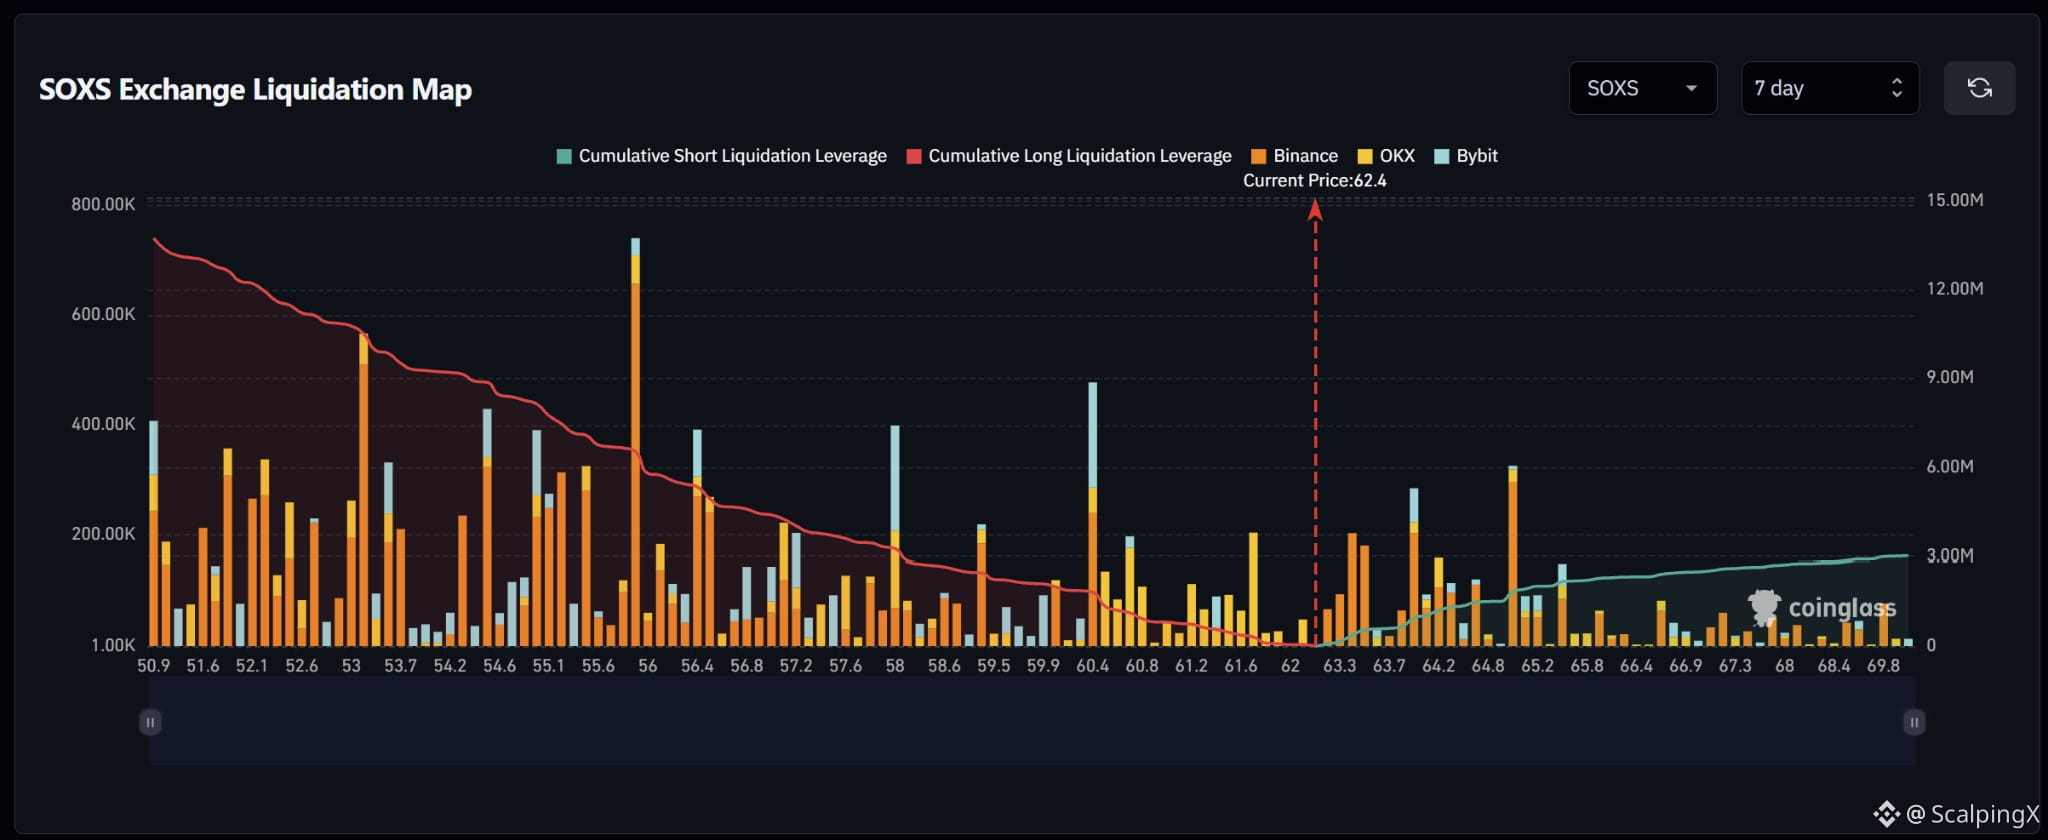
$SOXS – Liquidation Map (7 days) – Index ~62.4
🧭 The preferred scenario is a downside long-liquidation sweep. Estimated cumulative long exposure approaches $14M, versus roughly $3M on the short side within the displayed range. The nearest notable downside cluster sits at 61.5–61.8.
🔻 Losing 62.0 without reclaiming it shifts attention to 61.5–61.8. Holding below 61.5 after the sweep brings 60.3–60.8 into focus, with a prominent large bar near 60.4.
🎯 A further break below 60.3 brings the clusters around 59.3–59.5 and 57.8–58.1 into view. Further down, the bar near 56.0 is the largest downside spike. These areas could amplify volatility if long liquidations are triggered.
⚖️ Clearing and holding above 63.5 weakens the downside scenario, shifting attention to short clusters at 64.0–64.5, then 65.0–65.6. Above 65.8, bars are relatively small and sparse. A sweep of 61.5–61.8 followed by a quick reclaim of 62.0 would increase the risk of a failed downside move.
#LiquidationMap
$SOXS – Liquidation Map (7 days) – Index ~62.4
🧭 The preferred scenario is a downside long-liquidation sweep. Estimated cumulative long exposure approaches $14M, versus roughly $3M on the short side within the displayed range. The nearest notable downside cluster sits at 61.5–61.8.
🔻 Losing 62.0 without reclaiming it shifts attention to 61.5–61.8. Holding below 61.5 after the sweep brings 60.3–60.8 into focus, with a prominent large bar near 60.4.
🎯 A further break below 60.3 brings the clusters around 59.3–59.5 and 57.8–58.1 into view. Further down, the bar near 56.0 is the largest downside spike. These areas could amplify volatility if long liquidations are triggered.
⚖️ Clearing and holding above 63.5 weakens the downside scenario, shifting attention to short clusters at 64.0–64.5, then 65.0–65.6. Above 65.8, bars are relatively small and sparse. A sweep of 61.5–61.8 followed by a quick reclaim of 62.0 would increase the risk of a failed downside move.
#LiquidationMap
🧭 The preferred scenario is a downside long-liquidation sweep. Estimated cumulative long exposure approaches $14M, versus roughly $3M on the short side within the displayed range. The nearest notable downside cluster sits at 61.5–61.8.
🔻 Losing 62.0 without reclaiming it shifts attention to 61.5–61.8. Holding below 61.5 after the sweep brings 60.3–60.8 into focus, with a prominent large bar near 60.4.
🎯 A further break below 60.3 brings the clusters around 59.3–59.5 and 57.8–58.1 into view. Further down, the bar near 56.0 is the largest downside spike. These areas could amplify volatility if long liquidations are triggered.
⚖️ Clearing and holding above 63.5 weakens the downside scenario, shifting attention to short clusters at 64.0–64.5, then 65.0–65.6. Above 65.8, bars are relatively small and sparse. A sweep of 61.5–61.8 followed by a quick reclaim of 62.0 would increase the risk of a failed downside move.
#LiquidationMap
21
·
--
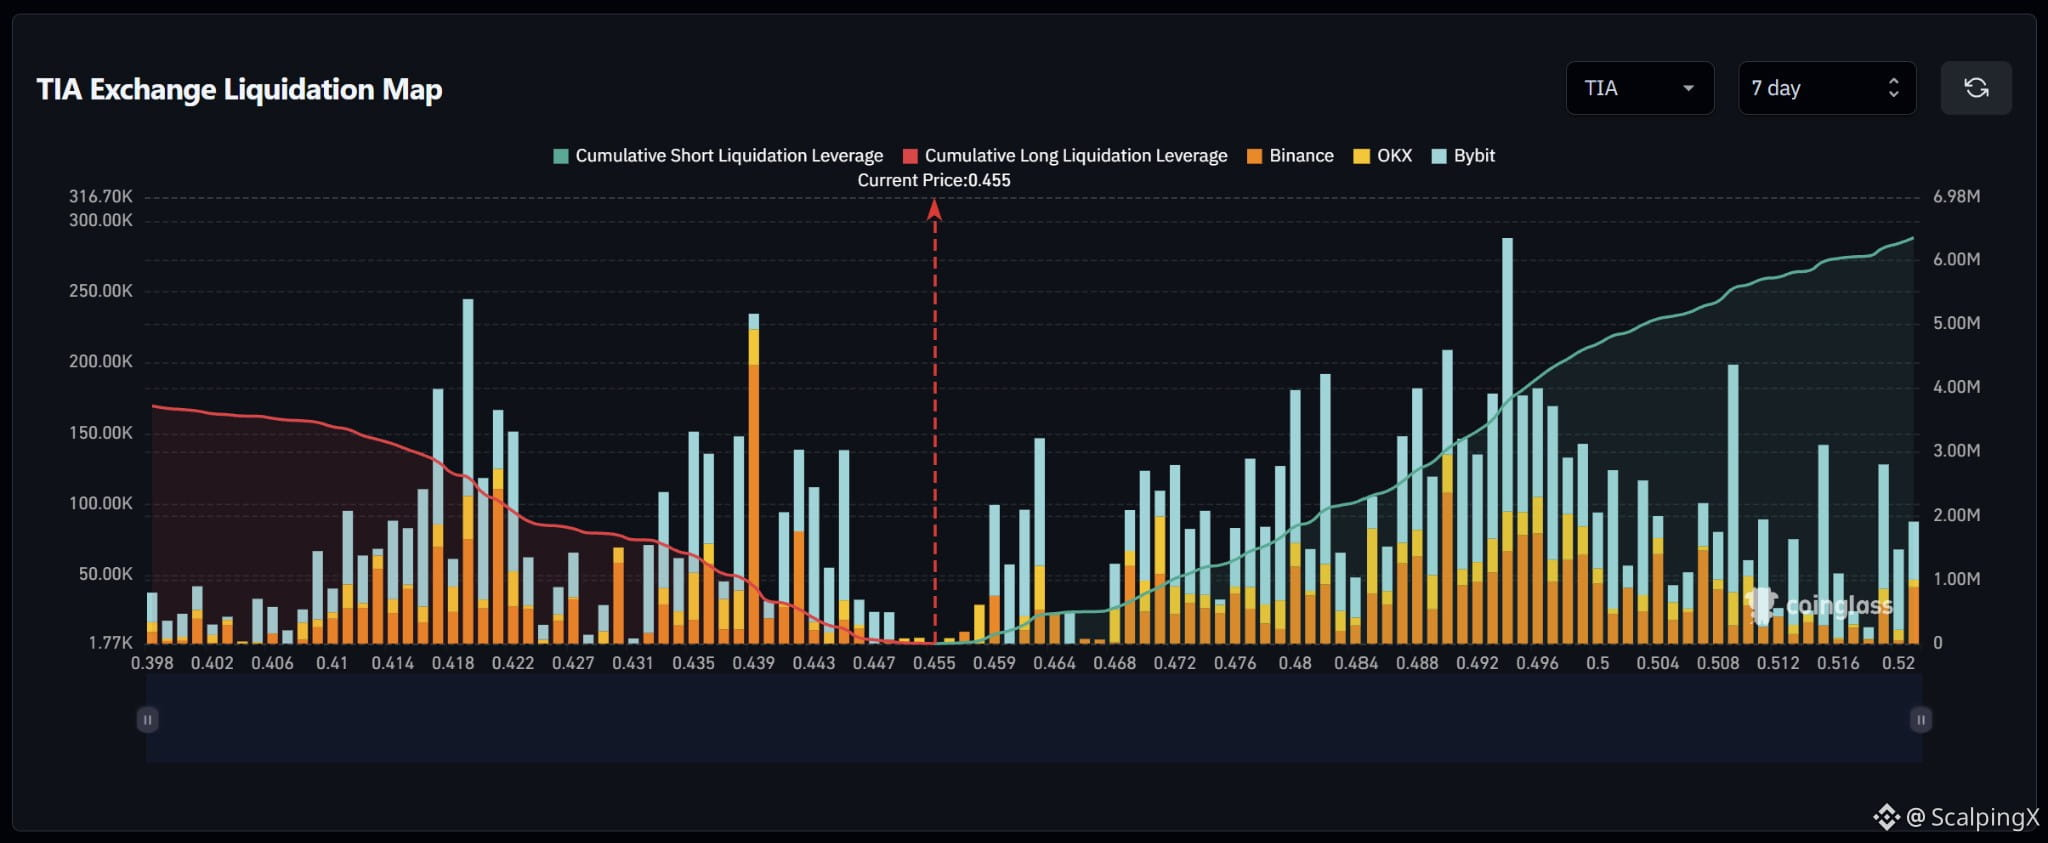
$TIA – Liquidation Map (7 days) – Index ~0.455
🧭 The preferred scenario is an upside short-liquidation sweep, starting at 0.459–0.463. Estimated cumulative short exposure is around $6.3M, versus roughly $3.7M on the long side within the displayed range.
🔺 If price clears and holds above 0.463, attention shifts to 0.469–0.474. Bars around 0.464–0.467 are quite small, making sustained momentum after the initial sweep worth watching.
🎯 Holding above 0.474 brings 0.477–0.483 into focus, followed by the denser cluster at 0.487–0.500. The largest upside bar sits near 0.494, where short liquidations could amplify volatility. Beyond 0.500, bars become more scattered, although a notable spike remains near 0.509.
⚖️ Losing 0.451 without reclaiming it weakens the upside scenario, shifting attention to 0.447–0.450, then 0.442–0.446 and 0.434–0.440. A sweep of 0.459–0.463 followed by a quick drop below 0.459 would increase the risk of a failed upside move.
#LiquidationMap
$TIA – Liquidation Map (7 days) – Index ~0.455
🧭 The preferred scenario is an upside short-liquidation sweep, starting at 0.459–0.463. Estimated cumulative short exposure is around $6.3M, versus roughly $3.7M on the long side within the displayed range.
🔺 If price clears and holds above 0.463, attention shifts to 0.469–0.474. Bars around 0.464–0.467 are quite small, making sustained momentum after the initial sweep worth watching.
🎯 Holding above 0.474 brings 0.477–0.483 into focus, followed by the denser cluster at 0.487–0.500. The largest upside bar sits near 0.494, where short liquidations could amplify volatility. Beyond 0.500, bars become more scattered, although a notable spike remains near 0.509.
⚖️ Losing 0.451 without reclaiming it weakens the upside scenario, shifting attention to 0.447–0.450, then 0.442–0.446 and 0.434–0.440. A sweep of 0.459–0.463 followed by a quick drop below 0.459 would increase the risk of a failed upside move.
#LiquidationMap
🧭 The preferred scenario is an upside short-liquidation sweep, starting at 0.459–0.463. Estimated cumulative short exposure is around $6.3M, versus roughly $3.7M on the long side within the displayed range.
🔺 If price clears and holds above 0.463, attention shifts to 0.469–0.474. Bars around 0.464–0.467 are quite small, making sustained momentum after the initial sweep worth watching.
🎯 Holding above 0.474 brings 0.477–0.483 into focus, followed by the denser cluster at 0.487–0.500. The largest upside bar sits near 0.494, where short liquidations could amplify volatility. Beyond 0.500, bars become more scattered, although a notable spike remains near 0.509.
⚖️ Losing 0.451 without reclaiming it weakens the upside scenario, shifting attention to 0.447–0.450, then 0.442–0.446 and 0.434–0.440. A sweep of 0.459–0.463 followed by a quick drop below 0.459 would increase the risk of a failed upside move.
#LiquidationMap
52
·
--
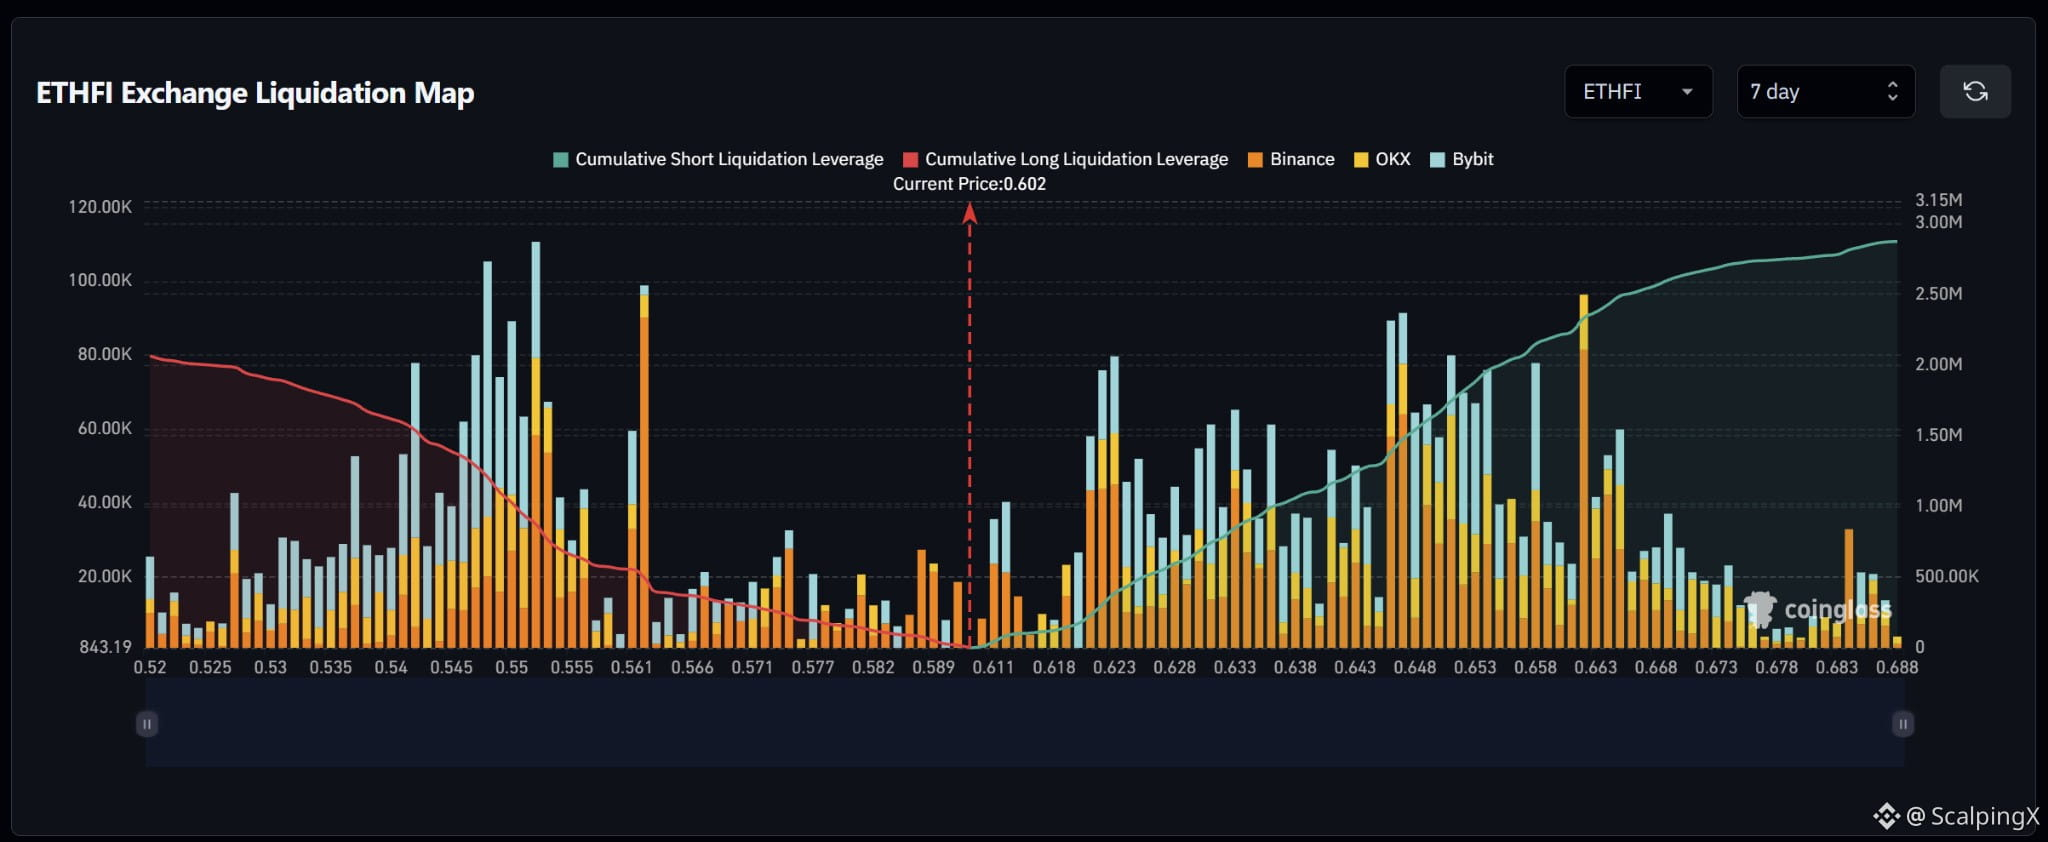
$ETHFI – Liquidation Map (7 days) – Index ~0.602
🧭 The preferred scenario is an upside short-liquidation sweep, starting at 0.610–0.612. Estimated cumulative short exposure approaches $2.9M, versus roughly $2M on the long side within the displayed range.
🔺 If price clears and holds above 0.612, attention shifts to 0.621–0.625. Bars around 0.614–0.618 are relatively small, while the more prominent cluster near 0.622–0.623 could amplify volatility as price approaches.
🎯 Holding above 0.625 after the sweep brings 0.629–0.637 and 0.646–0.655 into focus. A large isolated bar sits near 0.662; beyond 0.666, clusters generally become smaller and more scattered.
⚖️ Losing 0.600 without reclaiming it weakens the upside scenario, shifting attention to 0.588–0.591, then 0.573–0.576. Stronger long clusters sit at 0.545–0.554 and near 0.562. A sweep of 0.610–0.612 followed by a quick drop below 0.610 would increase the risk of a failed upside move.
#LiquidationMap
$ETHFI – Liquidation Map (7 days) – Index ~0.602
🧭 The preferred scenario is an upside short-liquidation sweep, starting at 0.610–0.612. Estimated cumulative short exposure approaches $2.9M, versus roughly $2M on the long side within the displayed range.
🔺 If price clears and holds above 0.612, attention shifts to 0.621–0.625. Bars around 0.614–0.618 are relatively small, while the more prominent cluster near 0.622–0.623 could amplify volatility as price approaches.
🎯 Holding above 0.625 after the sweep brings 0.629–0.637 and 0.646–0.655 into focus. A large isolated bar sits near 0.662; beyond 0.666, clusters generally become smaller and more scattered.
⚖️ Losing 0.600 without reclaiming it weakens the upside scenario, shifting attention to 0.588–0.591, then 0.573–0.576. Stronger long clusters sit at 0.545–0.554 and near 0.562. A sweep of 0.610–0.612 followed by a quick drop below 0.610 would increase the risk of a failed upside move.
#LiquidationMap
🧭 The preferred scenario is an upside short-liquidation sweep, starting at 0.610–0.612. Estimated cumulative short exposure approaches $2.9M, versus roughly $2M on the long side within the displayed range.
🔺 If price clears and holds above 0.612, attention shifts to 0.621–0.625. Bars around 0.614–0.618 are relatively small, while the more prominent cluster near 0.622–0.623 could amplify volatility as price approaches.
🎯 Holding above 0.625 after the sweep brings 0.629–0.637 and 0.646–0.655 into focus. A large isolated bar sits near 0.662; beyond 0.666, clusters generally become smaller and more scattered.
⚖️ Losing 0.600 without reclaiming it weakens the upside scenario, shifting attention to 0.588–0.591, then 0.573–0.576. Stronger long clusters sit at 0.545–0.554 and near 0.562. A sweep of 0.610–0.612 followed by a quick drop below 0.610 would increase the risk of a failed upside move.
#LiquidationMap
5
Log in to explore more content
Join global crypto users on Binance Square
⚡️ Get latest and useful information about crypto.
💬 Trusted by the world’s largest crypto exchange.
👍 Discover real insights from verified creators.
Email / Phone number
Trending Topics
1
#BitcoinFiveWeeklyLosses
41 views
50 Discussing
2
#AIChipSlumpNasdaq
18 views
35 Discussing
3
#BinanceReopensWithdrawalsForHYPE&APT
133,917 views
1,099 Discussing
4
#SouthKoreaDraftLawTargets15To20%ShareholderCap
132,756 views
733 Discussing
5
#TradFiForBeginners
211,241 views
1,964 Discussing
6
#KeplrAdvisesSocialLoginUsersToTransferAssets
63,295 views
560 Discussing
7
#TetherPlans€28.8MForJuventusCapitalIncrease
48,880 views
425 Discussing
8
#JobsReportRaisesHikeOdds
940,648 views
4,513 Discussing
9
#CPITestsDecemberRateOutlook
408,311 views
1,940 Discussing
10
#US Data Center Rules May Constrain AI Expansion
143,633 views
260 Discussing