
#hemiusdc
hemiusdc
751 views
14 Discussing
Hot
Latest

🐂 $HEMI /USDC — Top Bullish Momentum
🚀 $HEMI leads with a strong +39.09% move, trading at $0.01473. 📊 3.06M volume shows notable market activity behind the rally. 🔥 Strong buying momentum puts HEMI among the top bullish movers. 🔎 Verdict: Momentum is strongly bullish, but sharp gains can bring higher volatility.
#HEMI #HEMIUSDC #topgainer #CryptoAnalysis #BinanceSquare
{spot}(HEMIUSDT)
{spot}(BTCUSDT)
🐂 $HEMI /USDC — Top Bullish Momentum
🚀 $HEMI leads with a strong +39.09% move, trading at $0.01473. 📊 3.06M volume shows notable market activity behind the rally. 🔥 Strong buying momentum puts HEMI among the top bullish movers. 🔎 Verdict: Momentum is strongly bullish, but sharp gains can bring higher volatility.
#HEMI #HEMIUSDC #topgainer #CryptoAnalysis #BinanceSquare
🚀 $HEMI leads with a strong +39.09% move, trading at $0.01473. 📊 3.06M volume shows notable market activity behind the rally. 🔥 Strong buying momentum puts HEMI among the top bullish movers. 🔎 Verdict: Momentum is strongly bullish, but sharp gains can bring higher volatility.
#HEMI #HEMIUSDC #topgainer #CryptoAnalysis #BinanceSquare

102

$HEMI
{future}(HEMIUSDT)
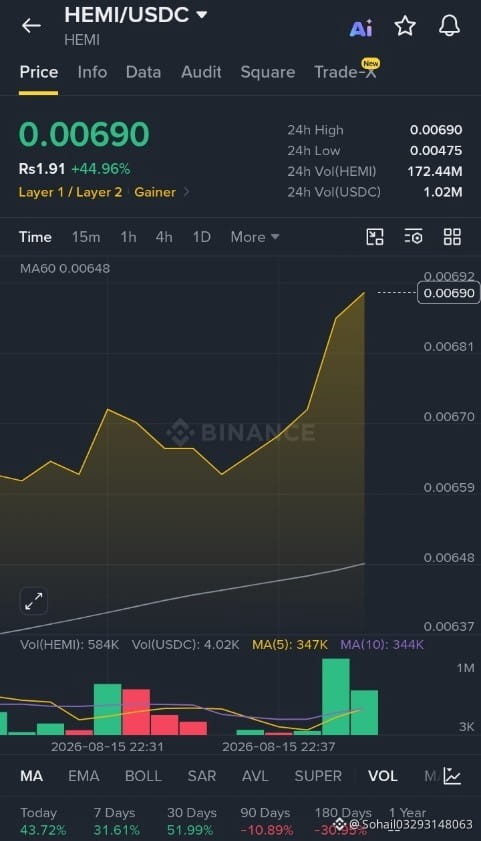
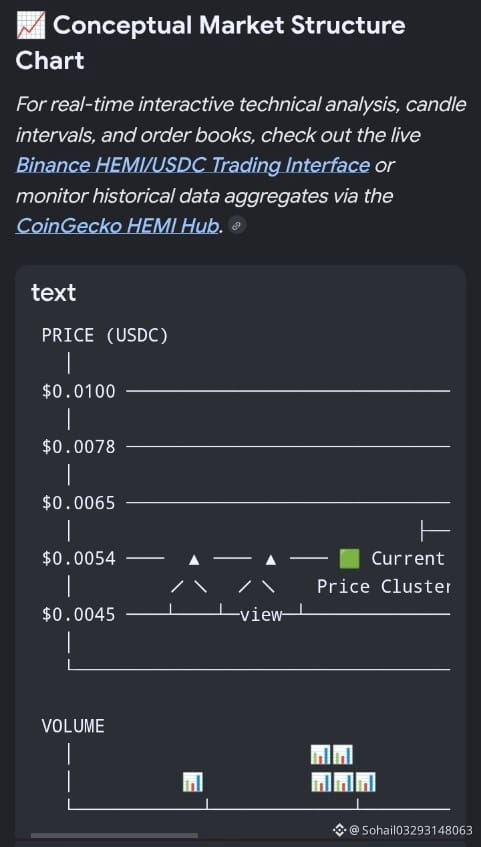
#HEMIUSDC The HEMI/USDC trading pair is currently stabilizing around $0.0054 to $0.0061, showcasing a minor bullish recovery over the last 24 hours amid heavily expanding volumes. Long-term analysis paints a neutral-to-bearish consolidation macro picture following its multi-month retreat from its $0.1925 all-time high, but immediate price action points toward a near-term breakout attempt.
⚠️ High Risk Asset Warning: Small-cap digital assets like HEMI carry extreme volatility and thin liquidity. Unfavorable macroeconomic shifts or protocol bugs can lead to rapid capital depreciation, up to a total loss.
🔎 Fundamental Drivers & Catalysts
👉Ecosystem Milestones: The deployment of the Hemi Arcade (August 2026) is acting as a near-term demand catalyst by boosting active on-chain utility.
👉Institutional Deployments: Recent integrations like BTCS S.A. putting Bitcoin to work via Hemi for yield generation bolster structural trust.
👉Network Stability:
The network continues to slowly repair sentiment following its June mainnet disruption. Continued uptime is crucial for sustainable expansion.
💡 Tactical Guidance for Market Participants
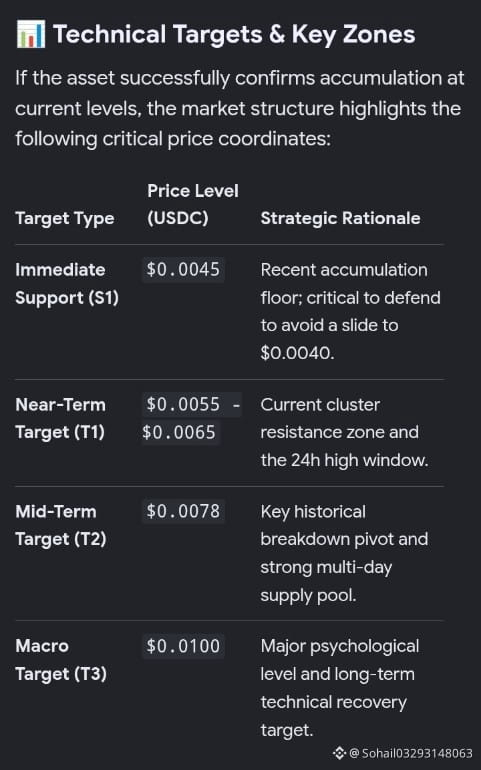
For Buyers/Accumulators: Look for sustained hourly closes above the $0.0055 margin with supporting volume to confirm that the asset has broken its short-term downtrend.For Risk Managers: A daily close below the $0.0045 support invalidates near-term bullish recovery ideas and shifts the macro outlook back toward a structural bearish extension. Maintain a strict risk framework when entering micro-cap liquidity.
#SECCancelsCryptoInvestmentContractRulesMeeting
#WhiteHousePlansAug19MeetingWithCryptoExecs
#CboeSeeks3xBitcoinAndEtherETFs
#SanDiskRises7%OnRevenueGrowthOutlook
$HEMI
#HEMIUSDC The HEMI/USDC trading pair is currently stabilizing around $0.0054 to $0.0061, showcasing a minor bullish recovery over the last 24 hours amid heavily expanding volumes. Long-term analysis paints a neutral-to-bearish consolidation macro picture following its multi-month retreat from its $0.1925 all-time high, but immediate price action points toward a near-term breakout attempt.
⚠️ High Risk Asset Warning: Small-cap digital assets like HEMI carry extreme volatility and thin liquidity. Unfavorable macroeconomic shifts or protocol bugs can lead to rapid capital depreciation, up to a total loss.
🔎 Fundamental Drivers & Catalysts
👉Ecosystem Milestones: The deployment of the Hemi Arcade (August 2026) is acting as a near-term demand catalyst by boosting active on-chain utility.
👉Institutional Deployments: Recent integrations like BTCS S.A. putting Bitcoin to work via Hemi for yield generation bolster structural trust.
👉Network Stability:
The network continues to slowly repair sentiment following its June mainnet disruption. Continued uptime is crucial for sustainable expansion.
💡 Tactical Guidance for Market Participants
For Buyers/Accumulators: Look for sustained hourly closes above the $0.0055 margin with supporting volume to confirm that the asset has broken its short-term downtrend.For Risk Managers: A daily close below the $0.0045 support invalidates near-term bullish recovery ideas and shifts the macro outlook back toward a structural bearish extension. Maintain a strict risk framework when entering micro-cap liquidity.
#SECCancelsCryptoInvestmentContractRulesMeeting
#WhiteHousePlansAug19MeetingWithCryptoExecs
#CboeSeeks3xBitcoinAndEtherETFs
#SanDiskRises7%OnRevenueGrowthOutlook
#HEMIUSDC The HEMI/USDC trading pair is currently stabilizing around $0.0054 to $0.0061, showcasing a minor bullish recovery over the last 24 hours amid heavily expanding volumes. Long-term analysis paints a neutral-to-bearish consolidation macro picture following its multi-month retreat from its $0.1925 all-time high, but immediate price action points toward a near-term breakout attempt.
⚠️ High Risk Asset Warning: Small-cap digital assets like HEMI carry extreme volatility and thin liquidity. Unfavorable macroeconomic shifts or protocol bugs can lead to rapid capital depreciation, up to a total loss.
🔎 Fundamental Drivers & Catalysts
👉Ecosystem Milestones: The deployment of the Hemi Arcade (August 2026) is acting as a near-term demand catalyst by boosting active on-chain utility.
👉Institutional Deployments: Recent integrations like BTCS S.A. putting Bitcoin to work via Hemi for yield generation bolster structural trust.
👉Network Stability:
The network continues to slowly repair sentiment following its June mainnet disruption. Continued uptime is crucial for sustainable expansion.
💡 Tactical Guidance for Market Participants
For Buyers/Accumulators: Look for sustained hourly closes above the $0.0055 margin with supporting volume to confirm that the asset has broken its short-term downtrend.For Risk Managers: A daily close below the $0.0045 support invalidates near-term bullish recovery ideas and shifts the macro outlook back toward a structural bearish extension. Maintain a strict risk framework when entering micro-cap liquidity.
#SECCancelsCryptoInvestmentContractRulesMeeting
#WhiteHousePlansAug19MeetingWithCryptoExecs
#CboeSeeks3xBitcoinAndEtherETFs
#SanDiskRises7%OnRevenueGrowthOutlook
1
86

·
--
Bearish
{future}(HEMIUSDT)
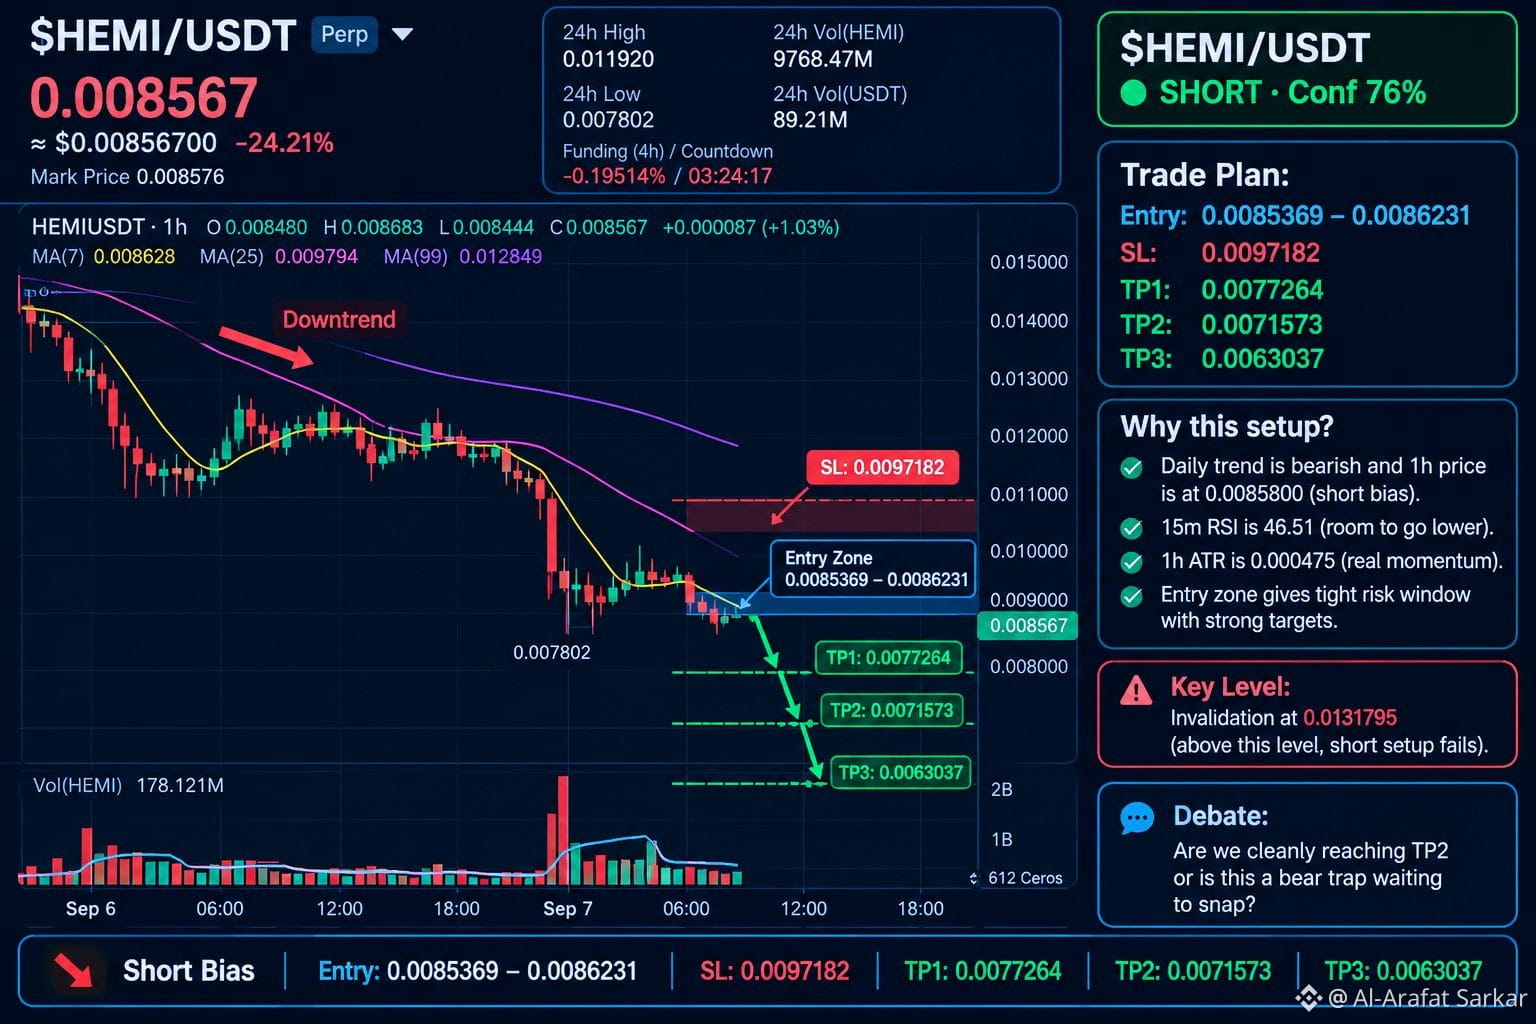
Nobody is talking about this bearish setup on $HEMI 👀📉$HEMI /USDT — 🟢 SHORT | 76% Confidence
📍 Entry: 0.0085369 – 0.0086231
🛑 SL: 0.0097182
🎯 TP1: 0.0077264
🎯 TP2: 0.0071573
🎯 TP3: 0.0063037
Why this setup?
The daily trend remains bearish, while the 1H chart continues to show strong selling pressure. The current price around 0.00858 is aligned with the short bias.
The 15M RSI at 46.51 still has room to move lower before reaching oversold conditions, while the 1H ATR of 0.000475 suggests enough volatility for further downside.
🔥 Key idea: This is a trend-following short, not a counter-trend trade. If bearish momentum continues, TP2 at 0.0071573 becomes the main target.
⚠️ Manage risk carefully and respect the stop loss.
Bear trap or clean move toward TP2? 👇
#HEMI #HEMIUSDC #crypto #BinanceSquare #trading $
Nobody is talking about this bearish setup on $HEMI 👀📉$HEMI /USDT — 🟢 SHORT | 76% Confidence
📍 Entry: 0.0085369 – 0.0086231
🛑 SL: 0.0097182
🎯 TP1: 0.0077264
🎯 TP2: 0.0071573
🎯 TP3: 0.0063037
Why this setup?
The daily trend remains bearish, while the 1H chart continues to show strong selling pressure. The current price around 0.00858 is aligned with the short bias.
The 15M RSI at 46.51 still has room to move lower before reaching oversold conditions, while the 1H ATR of 0.000475 suggests enough volatility for further downside.
🔥 Key idea: This is a trend-following short, not a counter-trend trade. If bearish momentum continues, TP2 at 0.0071573 becomes the main target.
⚠️ Manage risk carefully and respect the stop loss.
Bear trap or clean move toward TP2? 👇
#HEMI #HEMIUSDC #crypto #BinanceSquare #trading $
📍 Entry: 0.0085369 – 0.0086231
🛑 SL: 0.0097182
🎯 TP1: 0.0077264
🎯 TP2: 0.0071573
🎯 TP3: 0.0063037
Why this setup?
The daily trend remains bearish, while the 1H chart continues to show strong selling pressure. The current price around 0.00858 is aligned with the short bias.
The 15M RSI at 46.51 still has room to move lower before reaching oversold conditions, while the 1H ATR of 0.000475 suggests enough volatility for further downside.
🔥 Key idea: This is a trend-following short, not a counter-trend trade. If bearish momentum continues, TP2 at 0.0071573 becomes the main target.
⚠️ Manage risk carefully and respect the stop loss.
Bear trap or clean move toward TP2? 👇
#HEMI #HEMIUSDC #crypto #BinanceSquare #trading $
86

·
--
Bullish
🚀 $HEMI /USDC SIGNAL — LONG 🟢
📈 LONG / BUY
Entry: 0.01150 – 0.01170
🎯 TP1: 0.01230
🎯 TP2: 0.01300
🎯 TP3: 0.01400
🛑 Stop Loss: 0.01035
Analysis:
HEMI is showing a recovery attempt after bouncing strongly from the 0.01044 support. Price is holding around the MA(7), while the recent candles suggest selling pressure is cooling.
A sustained move above 0.01170 could open the way toward 0.01230, followed by 0.01300–0.01400 resistance zones. However, the MA(25) and MA(99) remain above price, so confirmation and proper risk management are important.
⚠️ Risk Management: Avoid over-leverage and manage your position size carefully.
#HEMI #HEMIUSDC #CryptoSignals #longsignal #Binance
🚀 $HEMI /USDC SIGNAL — LONG 🟢
📈 LONG / BUY
Entry: 0.01150 – 0.01170
🎯 TP1: 0.01230
🎯 TP2: 0.01300
🎯 TP3: 0.01400
🛑 Stop Loss: 0.01035
Analysis:
HEMI is showing a recovery attempt after bouncing strongly from the 0.01044 support. Price is holding around the MA(7), while the recent candles suggest selling pressure is cooling.
A sustained move above 0.01170 could open the way toward 0.01230, followed by 0.01300–0.01400 resistance zones. However, the MA(25) and MA(99) remain above price, so confirmation and proper risk management are important.
⚠️ Risk Management: Avoid over-leverage and manage your position size carefully.
#HEMI #HEMIUSDC #CryptoSignals #longsignal #Binance
📈 LONG / BUY
Entry: 0.01150 – 0.01170
🎯 TP1: 0.01230
🎯 TP2: 0.01300
🎯 TP3: 0.01400
🛑 Stop Loss: 0.01035
Analysis:
HEMI is showing a recovery attempt after bouncing strongly from the 0.01044 support. Price is holding around the MA(7), while the recent candles suggest selling pressure is cooling.
A sustained move above 0.01170 could open the way toward 0.01230, followed by 0.01300–0.01400 resistance zones. However, the MA(25) and MA(99) remain above price, so confirmation and proper risk management are important.
⚠️ Risk Management: Avoid over-leverage and manage your position size carefully.
#HEMI #HEMIUSDC #CryptoSignals #longsignal #Binance
177

·
--
Article
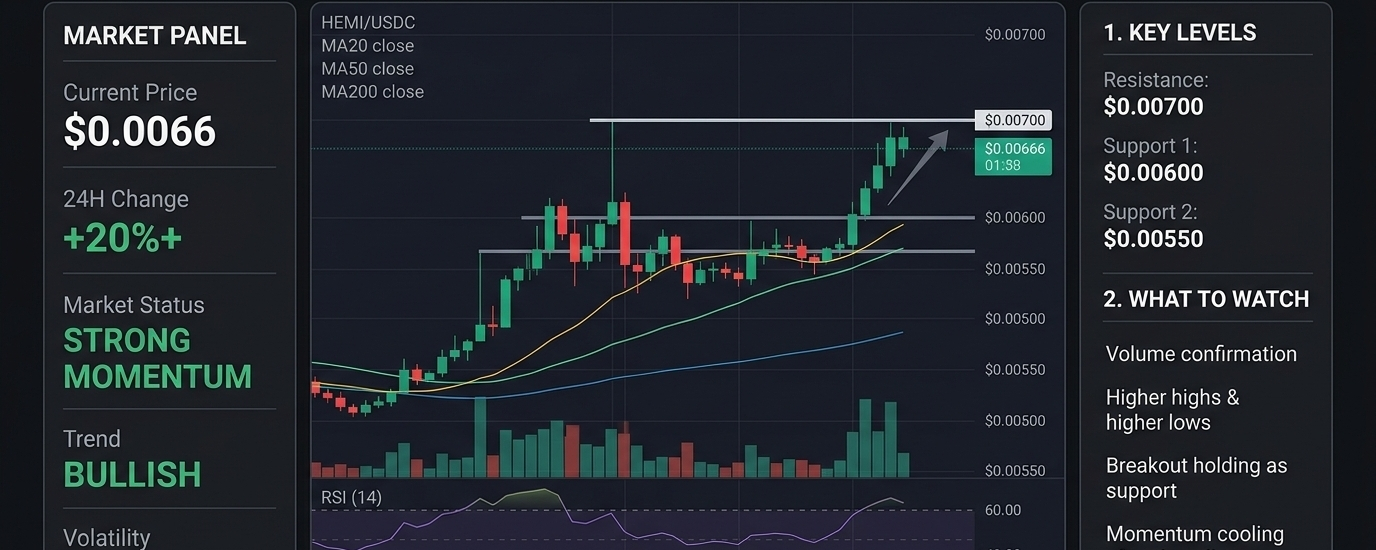
🔥 HEMI/USDC: Strong Momentum Puts Hemi Back in Focus $HEMI (HEMI) is showing a strong short-term momentum move. The latest market data places HEMI around $0.0066, with the token gaining roughly 20%+ over 24 hours.
📊 Why Is HEMI Moving?
The current move is being supported by strong trading activity and renewed interest in Hemi's Bitcoin-Ethereum interoperability narrative.
Hemi is designed as a modular network that combines Bitcoin's security with Ethereum-style programmability. Its architecture includes the Hemi Bitcoin EVM, which brings Bitcoin functionality into an EVM-compatible environment.
📈 Market View
The short-term chart structure is currently momentum-driven and bullish, but a 20%+ daily move also means volatility is elevated.
After a sharp rally, the market can either consolidate and build a new support zone or experience a quick pullback. The next candles, trading volume and ability to hold recently gained levels will be important.
🎯 What to Watch
• Whether buying volume remains elevated
• Whether HEMI can maintain higher highs and higher lows
• Whether the recent breakout zone turns into support
• Whether momentum cools after the sharp daily move
• Wider Bitcoin and Ethereum market direction
🧠 Bigger Picture
HEMI's long-term narrative is centered around connecting Bitcoin and Ethereum ecosystems. According to Hemi's tokenomics, HEMI is used for network transaction fees, staking, security incentives and cross-chain settlement.
That gives the token a utility narrative beyond the current price rally, although continued ecosystem adoption remains important.
⚠️ Final Take
HEMI is currently one of the stronger momentum names on the Binance list, but the size of the recent move means traders should expect significant volatility. The key test now is whether buyers can sustain the momentum instead of allowing the rally to quickly reverse.
#HEMI #HEMIUSDC #CryptoAnalysis #CryptoAnalysisUpdate #cryptoanalysisdaybyda
{spot}(HEMIUSDT)
🔥 HEMI/USDC: Strong Momentum Puts Hemi Back in Focus
$HEMI (HEMI) is showing a strong short-term momentum move. The latest market data places HEMI around $0.0066, with the token gaining roughly 20%+ over 24 hours.
📊 Why Is HEMI Moving?
The current move is being supported by strong trading activity and renewed interest in Hemi's Bitcoin-Ethereum interoperability narrative.
Hemi is designed as a modular network that combines Bitcoin's security with Ethereum-style programmability. Its architecture includes the Hemi Bitcoin EVM, which brings Bitcoin functionality into an EVM-compatible environment.
📈 Market View
The short-term chart structure is currently momentum-driven and bullish, but a 20%+ daily move also means volatility is elevated.
After a sharp rally, the market can either consolidate and build a new support zone or experience a quick pullback. The next candles, trading volume and ability to hold recently gained levels will be important.
🎯 What to Watch
• Whether buying volume remains elevated
• Whether HEMI can maintain higher highs and higher lows
• Whether the recent breakout zone turns into support
• Whether momentum cools after the sharp daily move
• Wider Bitcoin and Ethereum market direction
🧠 Bigger Picture
HEMI's long-term narrative is centered around connecting Bitcoin and Ethereum ecosystems. According to Hemi's tokenomics, HEMI is used for network transaction fees, staking, security incentives and cross-chain settlement.
That gives the token a utility narrative beyond the current price rally, although continued ecosystem adoption remains important.
⚠️ Final Take
HEMI is currently one of the stronger momentum names on the Binance list, but the size of the recent move means traders should expect significant volatility. The key test now is whether buyers can sustain the momentum instead of allowing the rally to quickly reverse.
#HEMI #HEMIUSDC #CryptoAnalysis #CryptoAnalysisUpdate #cryptoanalysisdaybyda
📊 Why Is HEMI Moving?
The current move is being supported by strong trading activity and renewed interest in Hemi's Bitcoin-Ethereum interoperability narrative.
Hemi is designed as a modular network that combines Bitcoin's security with Ethereum-style programmability. Its architecture includes the Hemi Bitcoin EVM, which brings Bitcoin functionality into an EVM-compatible environment.
📈 Market View
The short-term chart structure is currently momentum-driven and bullish, but a 20%+ daily move also means volatility is elevated.
After a sharp rally, the market can either consolidate and build a new support zone or experience a quick pullback. The next candles, trading volume and ability to hold recently gained levels will be important.
🎯 What to Watch
• Whether buying volume remains elevated
• Whether HEMI can maintain higher highs and higher lows
• Whether the recent breakout zone turns into support
• Whether momentum cools after the sharp daily move
• Wider Bitcoin and Ethereum market direction
🧠 Bigger Picture
HEMI's long-term narrative is centered around connecting Bitcoin and Ethereum ecosystems. According to Hemi's tokenomics, HEMI is used for network transaction fees, staking, security incentives and cross-chain settlement.
That gives the token a utility narrative beyond the current price rally, although continued ecosystem adoption remains important.
⚠️ Final Take
HEMI is currently one of the stronger momentum names on the Binance list, but the size of the recent move means traders should expect significant volatility. The key test now is whether buyers can sustain the momentum instead of allowing the rally to quickly reverse.
#HEMI #HEMIUSDC #CryptoAnalysis #CryptoAnalysisUpdate #cryptoanalysisdaybyda
135
Log in to explore more content
Join global crypto users on Binance Square
⚡️ Get latest and useful information about crypto.
💬 Trusted by the world’s largest crypto exchange.
👍 Discover real insights from verified creators.
Email / Phone number
Trending Topics
1
#AIStocksWhatNext
490,879 views
3,628 Discussing
2
#BitcoinTops$87KAtEightMonthHigh
559 views
23 Discussing
3
#ZECBreaksAbove$1600AtRecordHigh
251 views
10 Discussing
4
#BitwiseNEARStakingETPAssetsTop$100M
10,278 views
51 Discussing
5
#BitcoinBreaksAboveMayHighNears$86K
23,045 views
232 Discussing
6
#DogecoinRises15%
74,586 views
1,293 Discussing
7
#$14BBitcoinOptionsExpireFriday
6,622 views
104 Discussing
8
#BNBMarketCapPassesBNYMellon
45,899 views
950 Discussing
9
#CryptoMarketCapReclaims$3Trillion
9,475 views
88 Discussing
10
#MuseOvertakesChatGPTAsTopFreeIOSApp
26,633 views
707 Discussing