
#fil
fil
9M views
21,360 Discussing
Hot
Latest


·
--
Bullish
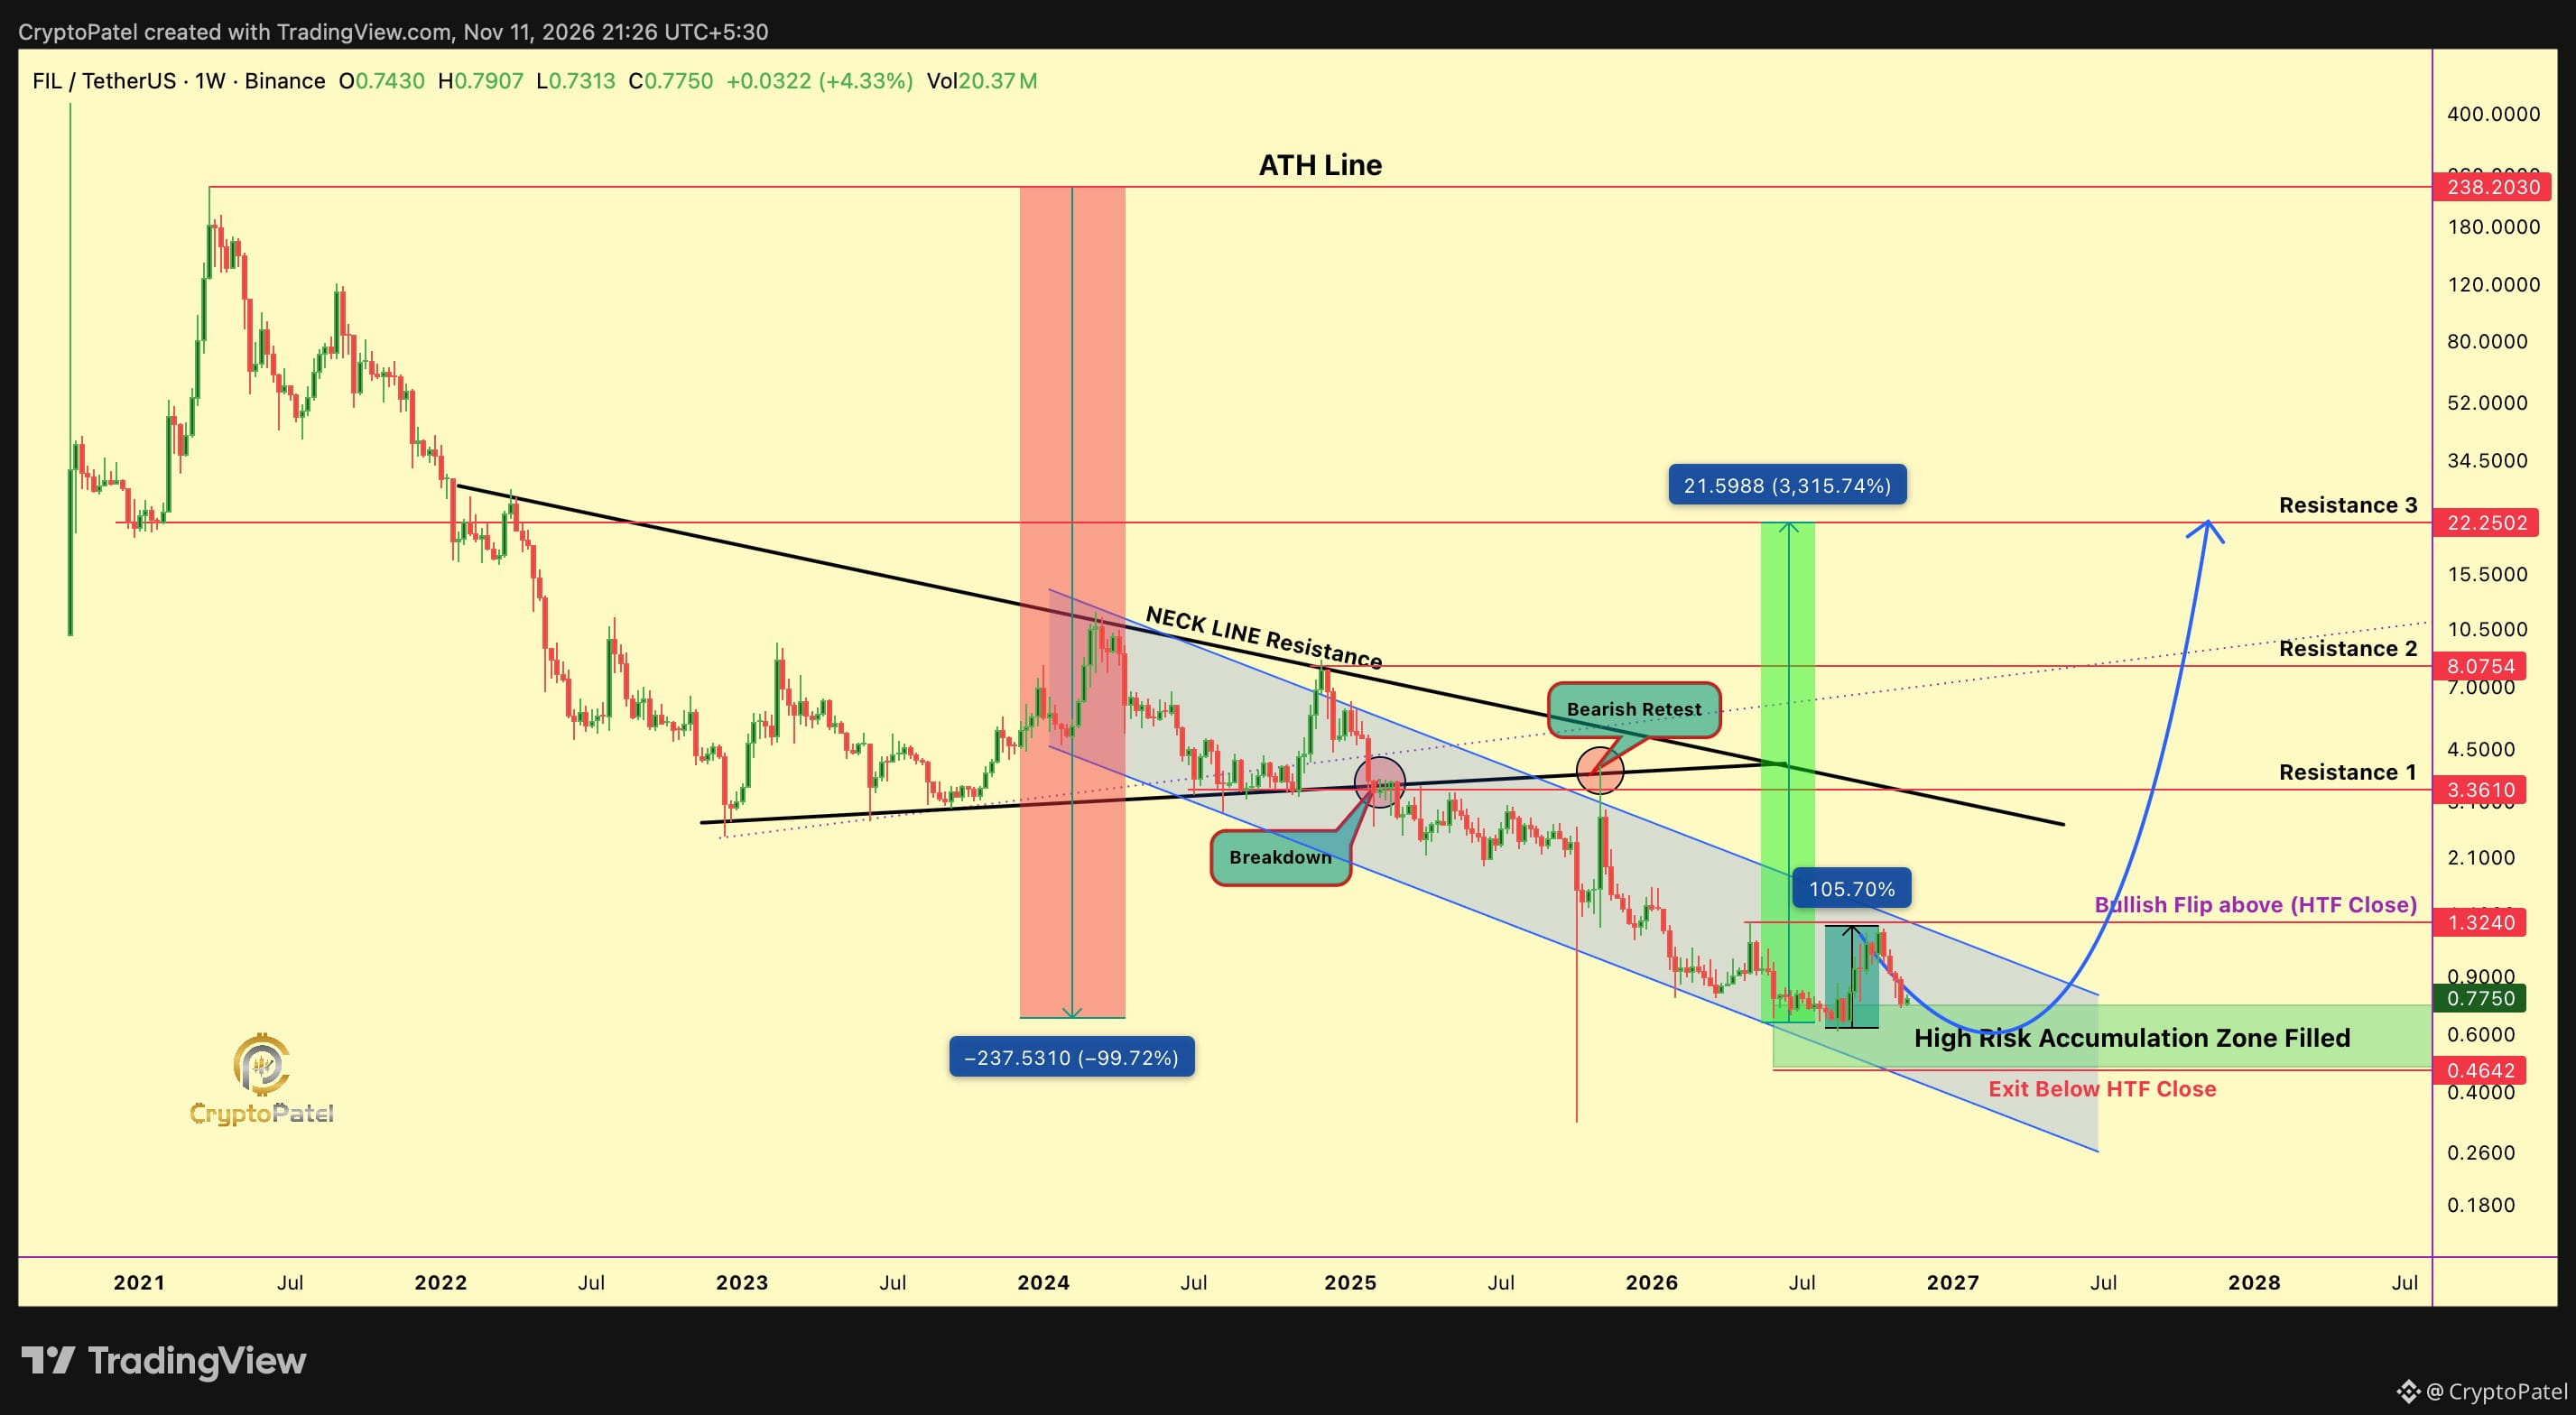
$FIL IS DOWN 99.6%. IS EVERYONE WRITING FILECOIN OFF TOO EARLY?
Most people only see a dead altcoin. I see a high-risk, high-reward macro opportunity.
FIL/USDT already delivered 105% from my previous accumulation zone. After the latest retracement, I'm looking to accumulate again.
My zone: $0.73–$0.48
Targets: $3.36 → $8.07 → $22.25
If this macro structure plays out, FIL/USDT could potentially deliver 5X–30X from these levels.
Let's be honest: this is NOT a safe bet. #FIL collapsed from its $238 ATH, and another leg down is possible.
But that's exactly why risk management matters.
You don't need to agree with my Setup. Just don't confuse a high-risk opportunity with a guaranteed recovery.
NFA. DYOR.
@Filecoin
{future}(FILUSDT)
$FIL IS DOWN 99.6%. IS EVERYONE WRITING FILECOIN OFF TOO EARLY?
Most people only see a dead altcoin. I see a high-risk, high-reward macro opportunity.
FIL/USDT already delivered 105% from my previous accumulation zone. After the latest retracement, I'm looking to accumulate again.
My zone: $0.73–$0.48
Targets: $3.36 → $8.07 → $22.25
If this macro structure plays out, FIL/USDT could potentially deliver 5X–30X from these levels.
Let's be honest: this is NOT a safe bet. #FIL collapsed from its $238 ATH, and another leg down is possible.
But that's exactly why risk management matters.
You don't need to agree with my Setup. Just don't confuse a high-risk opportunity with a guaranteed recovery.
NFA. DYOR.
@Filecoin
Most people only see a dead altcoin. I see a high-risk, high-reward macro opportunity.
FIL/USDT already delivered 105% from my previous accumulation zone. After the latest retracement, I'm looking to accumulate again.
My zone: $0.73–$0.48
Targets: $3.36 → $8.07 → $22.25
If this macro structure plays out, FIL/USDT could potentially deliver 5X–30X from these levels.
Let's be honest: this is NOT a safe bet. #FIL collapsed from its $238 ATH, and another leg down is possible.
But that's exactly why risk management matters.
You don't need to agree with my Setup. Just don't confuse a high-risk opportunity with a guaranteed recovery.
NFA. DYOR.
@Filecoin
Feed-Creator-4ffc60369:
لنا عدة سنوات معلقين فيها
والله اللطيف القوي العزيز قادر على رفعها
وأن يعوض خسارتنا
1
3
958

Partly True
Has FIL finally started talking through clients
Previously, when following Filecoin news,Has #FIL finally started talking through clients
Previously, when following Filecoin news, it was either about partnerships or promotions, but the price chart did not reflect this. Now there is a more realistic dataset: it is said that the number of paid Filecoin Onchain Cloud customers has increased from 115 90 days ago to 156, an increase of 41 customers, a growth of 35.65%; and the number of active Filecoin Pay pay payers has reached 160.
Do not rush to announce the take-off! I have not yet found an independent official historical snapshot to verify these latest figures, so we will discuss them based on what the community has revealed. And wallets may not mean independent companies.
But the trend is already right. This year, Filecoin is focused on switching from competing for storage capacity to competing for paid demand،
Did the income increase simultaneously with the growth of customers by 35.65% Does the client pay several dollars a month,or can he stable replenishment for several months Are the new payment wallets just tests with small amounts
I will monitor three things: real monthly income, independent paid customers, retention and replenishment. On the day when these three go up together, I will dare to say that FIL marketing really has a future.
$FIL
#HotCPIDecemberHikePriced
Has FIL finally started talking through clients Previously, when following Filecoin news,
Has #FIL finally started talking through clients
Previously, when following Filecoin news, it was either about partnerships or promotions, but the price chart did not reflect this. Now there is a more realistic dataset: it is said that the number of paid Filecoin Onchain Cloud customers has increased from 115 90 days ago to 156, an increase of 41 customers, a growth of 35.65%; and the number of active Filecoin Pay pay payers has reached 160.
Do not rush to announce the take-off! I have not yet found an independent official historical snapshot to verify these latest figures, so we will discuss them based on what the community has revealed. And wallets may not mean independent companies.
But the trend is already right. This year, Filecoin is focused on switching from competing for storage capacity to competing for paid demand،
Did the income increase simultaneously with the growth of customers by 35.65% Does the client pay several dollars a month,or can he stable replenishment for several months Are the new payment wallets just tests with small amounts
I will monitor three things: real monthly income, independent paid customers, retention and replenishment. On the day when these three go up together, I will dare to say that FIL marketing really has a future.
$FIL
#HotCPIDecemberHikePriced
Previously, when following Filecoin news, it was either about partnerships or promotions, but the price chart did not reflect this. Now there is a more realistic dataset: it is said that the number of paid Filecoin Onchain Cloud customers has increased from 115 90 days ago to 156, an increase of 41 customers, a growth of 35.65%; and the number of active Filecoin Pay pay payers has reached 160.
Do not rush to announce the take-off! I have not yet found an independent official historical snapshot to verify these latest figures, so we will discuss them based on what the community has revealed. And wallets may not mean independent companies.
But the trend is already right. This year, Filecoin is focused on switching from competing for storage capacity to competing for paid demand،
Did the income increase simultaneously with the growth of customers by 35.65% Does the client pay several dollars a month,or can he stable replenishment for several months Are the new payment wallets just tests with small amounts
I will monitor three things: real monthly income, independent paid customers, retention and replenishment. On the day when these three go up together, I will dare to say that FIL marketing really has a future.
$FIL
#HotCPIDecemberHikePriced
3
1.5k

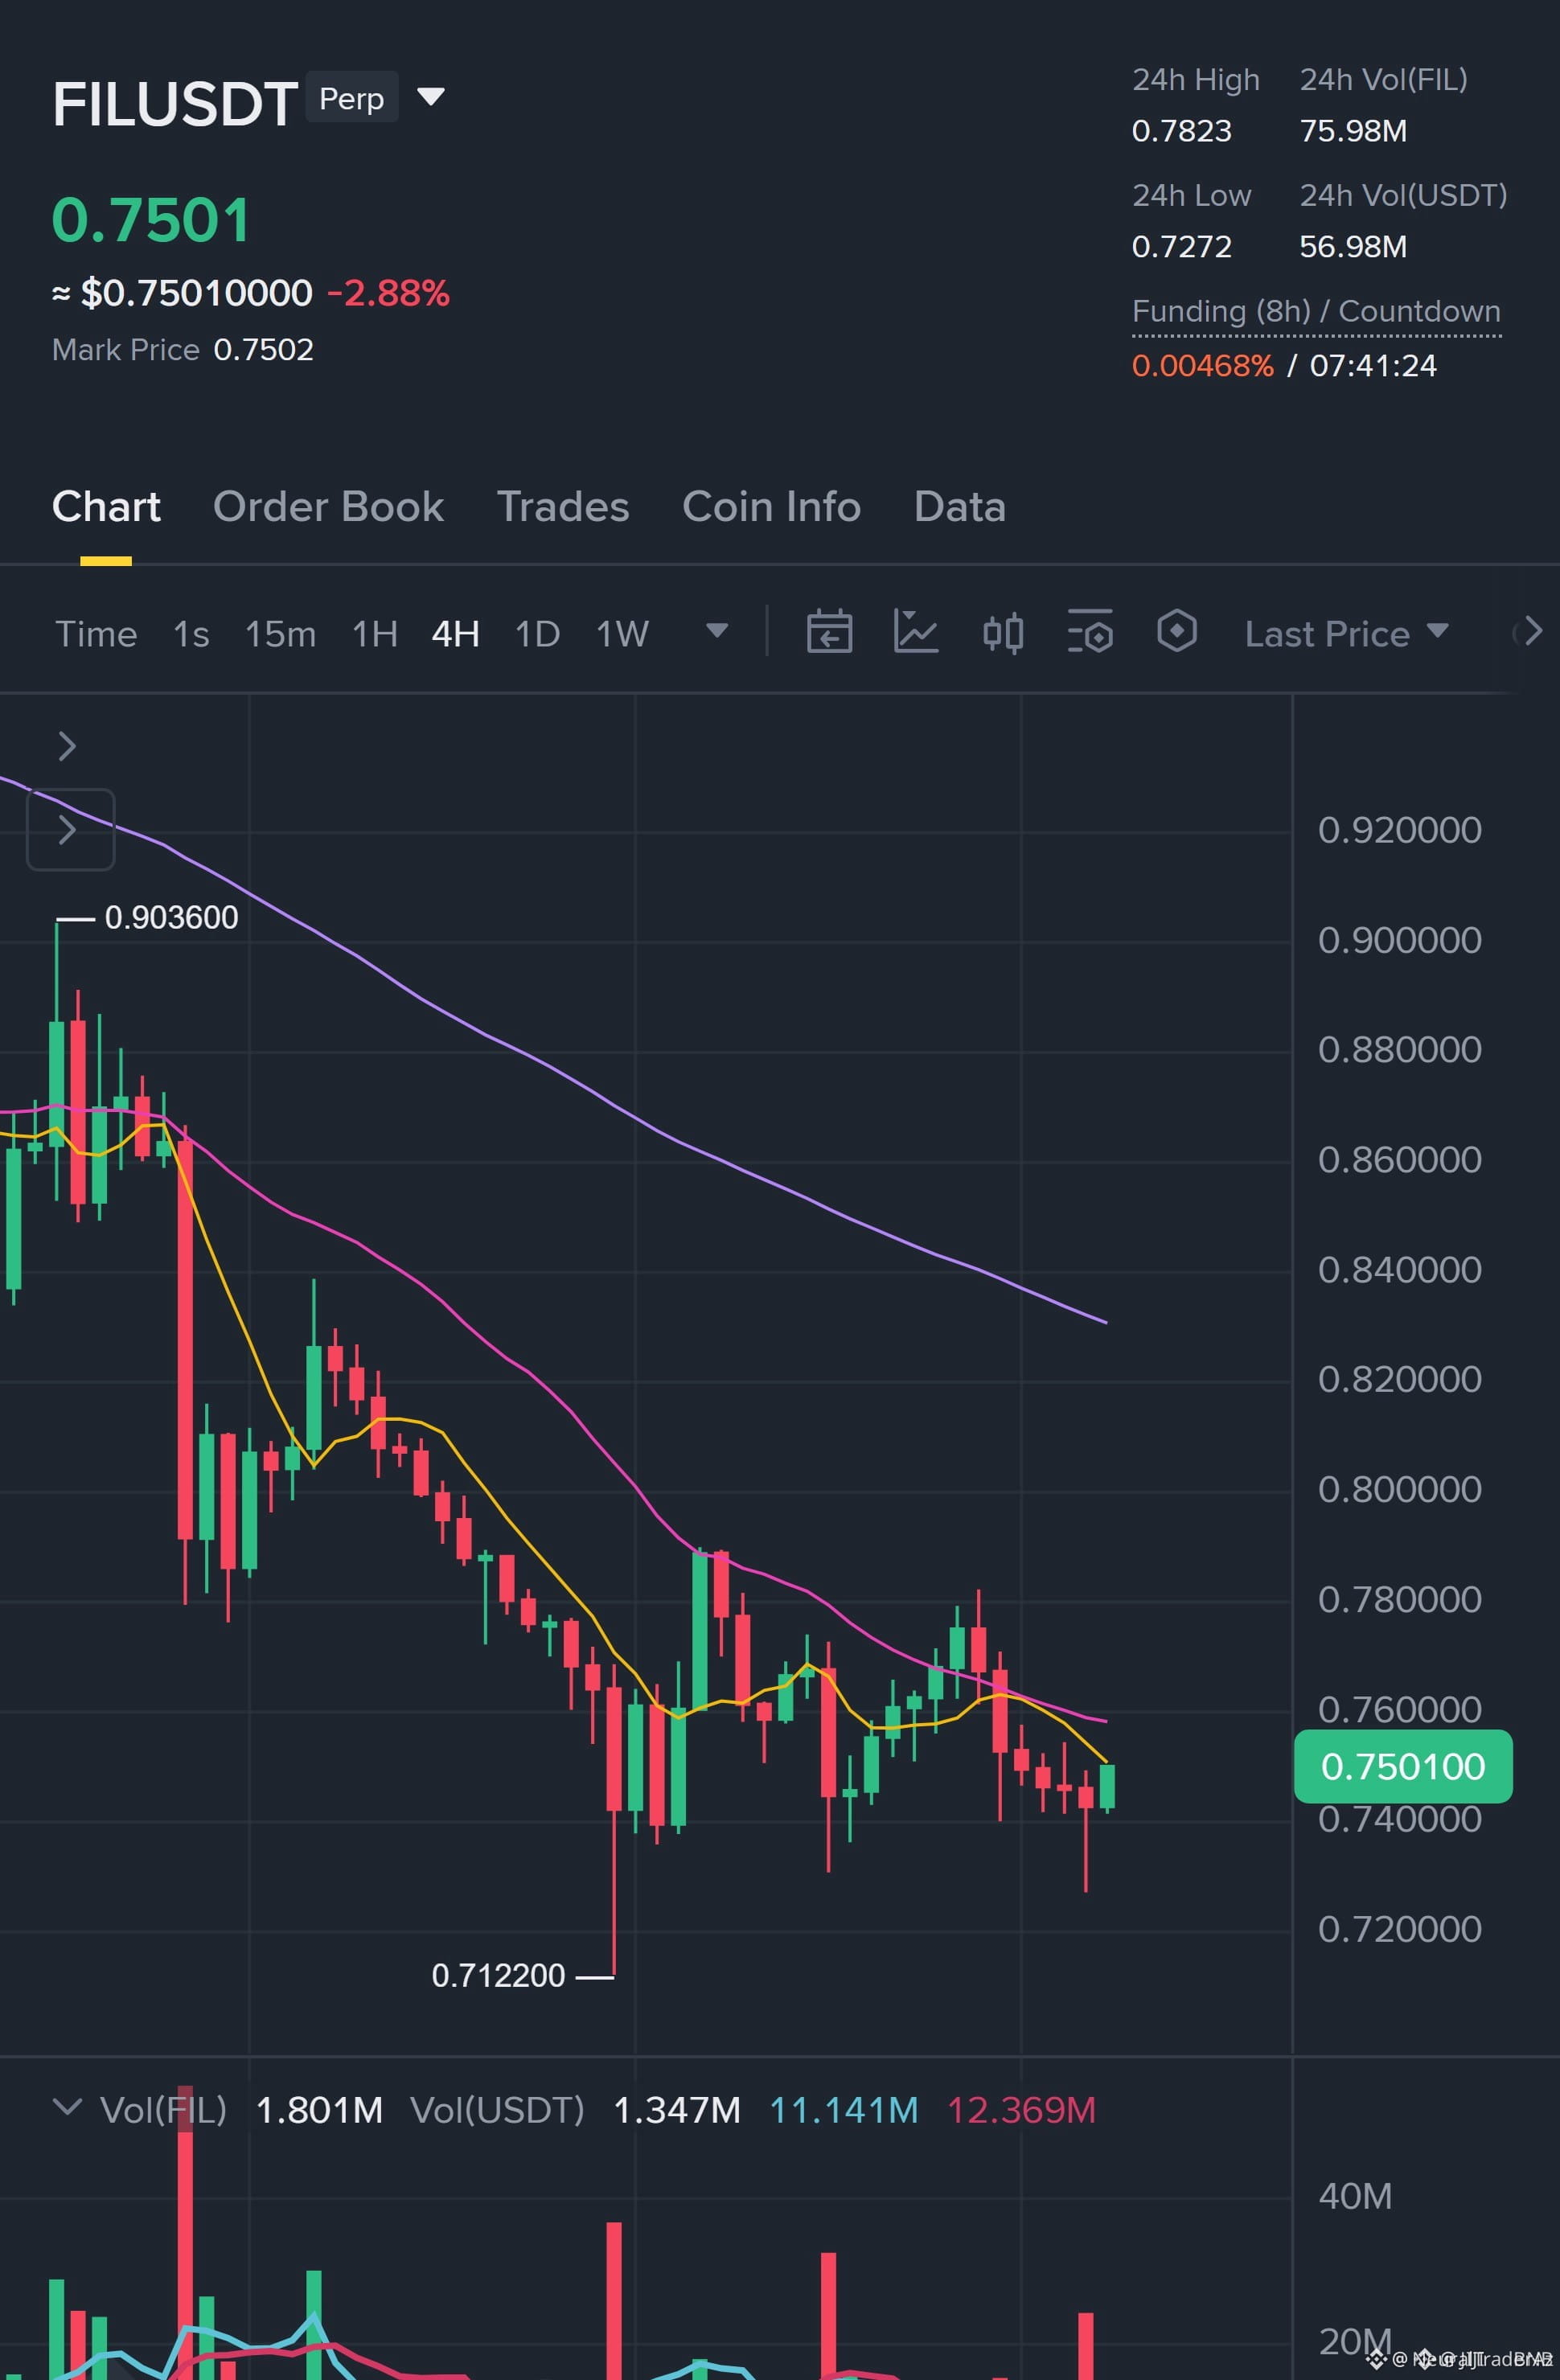
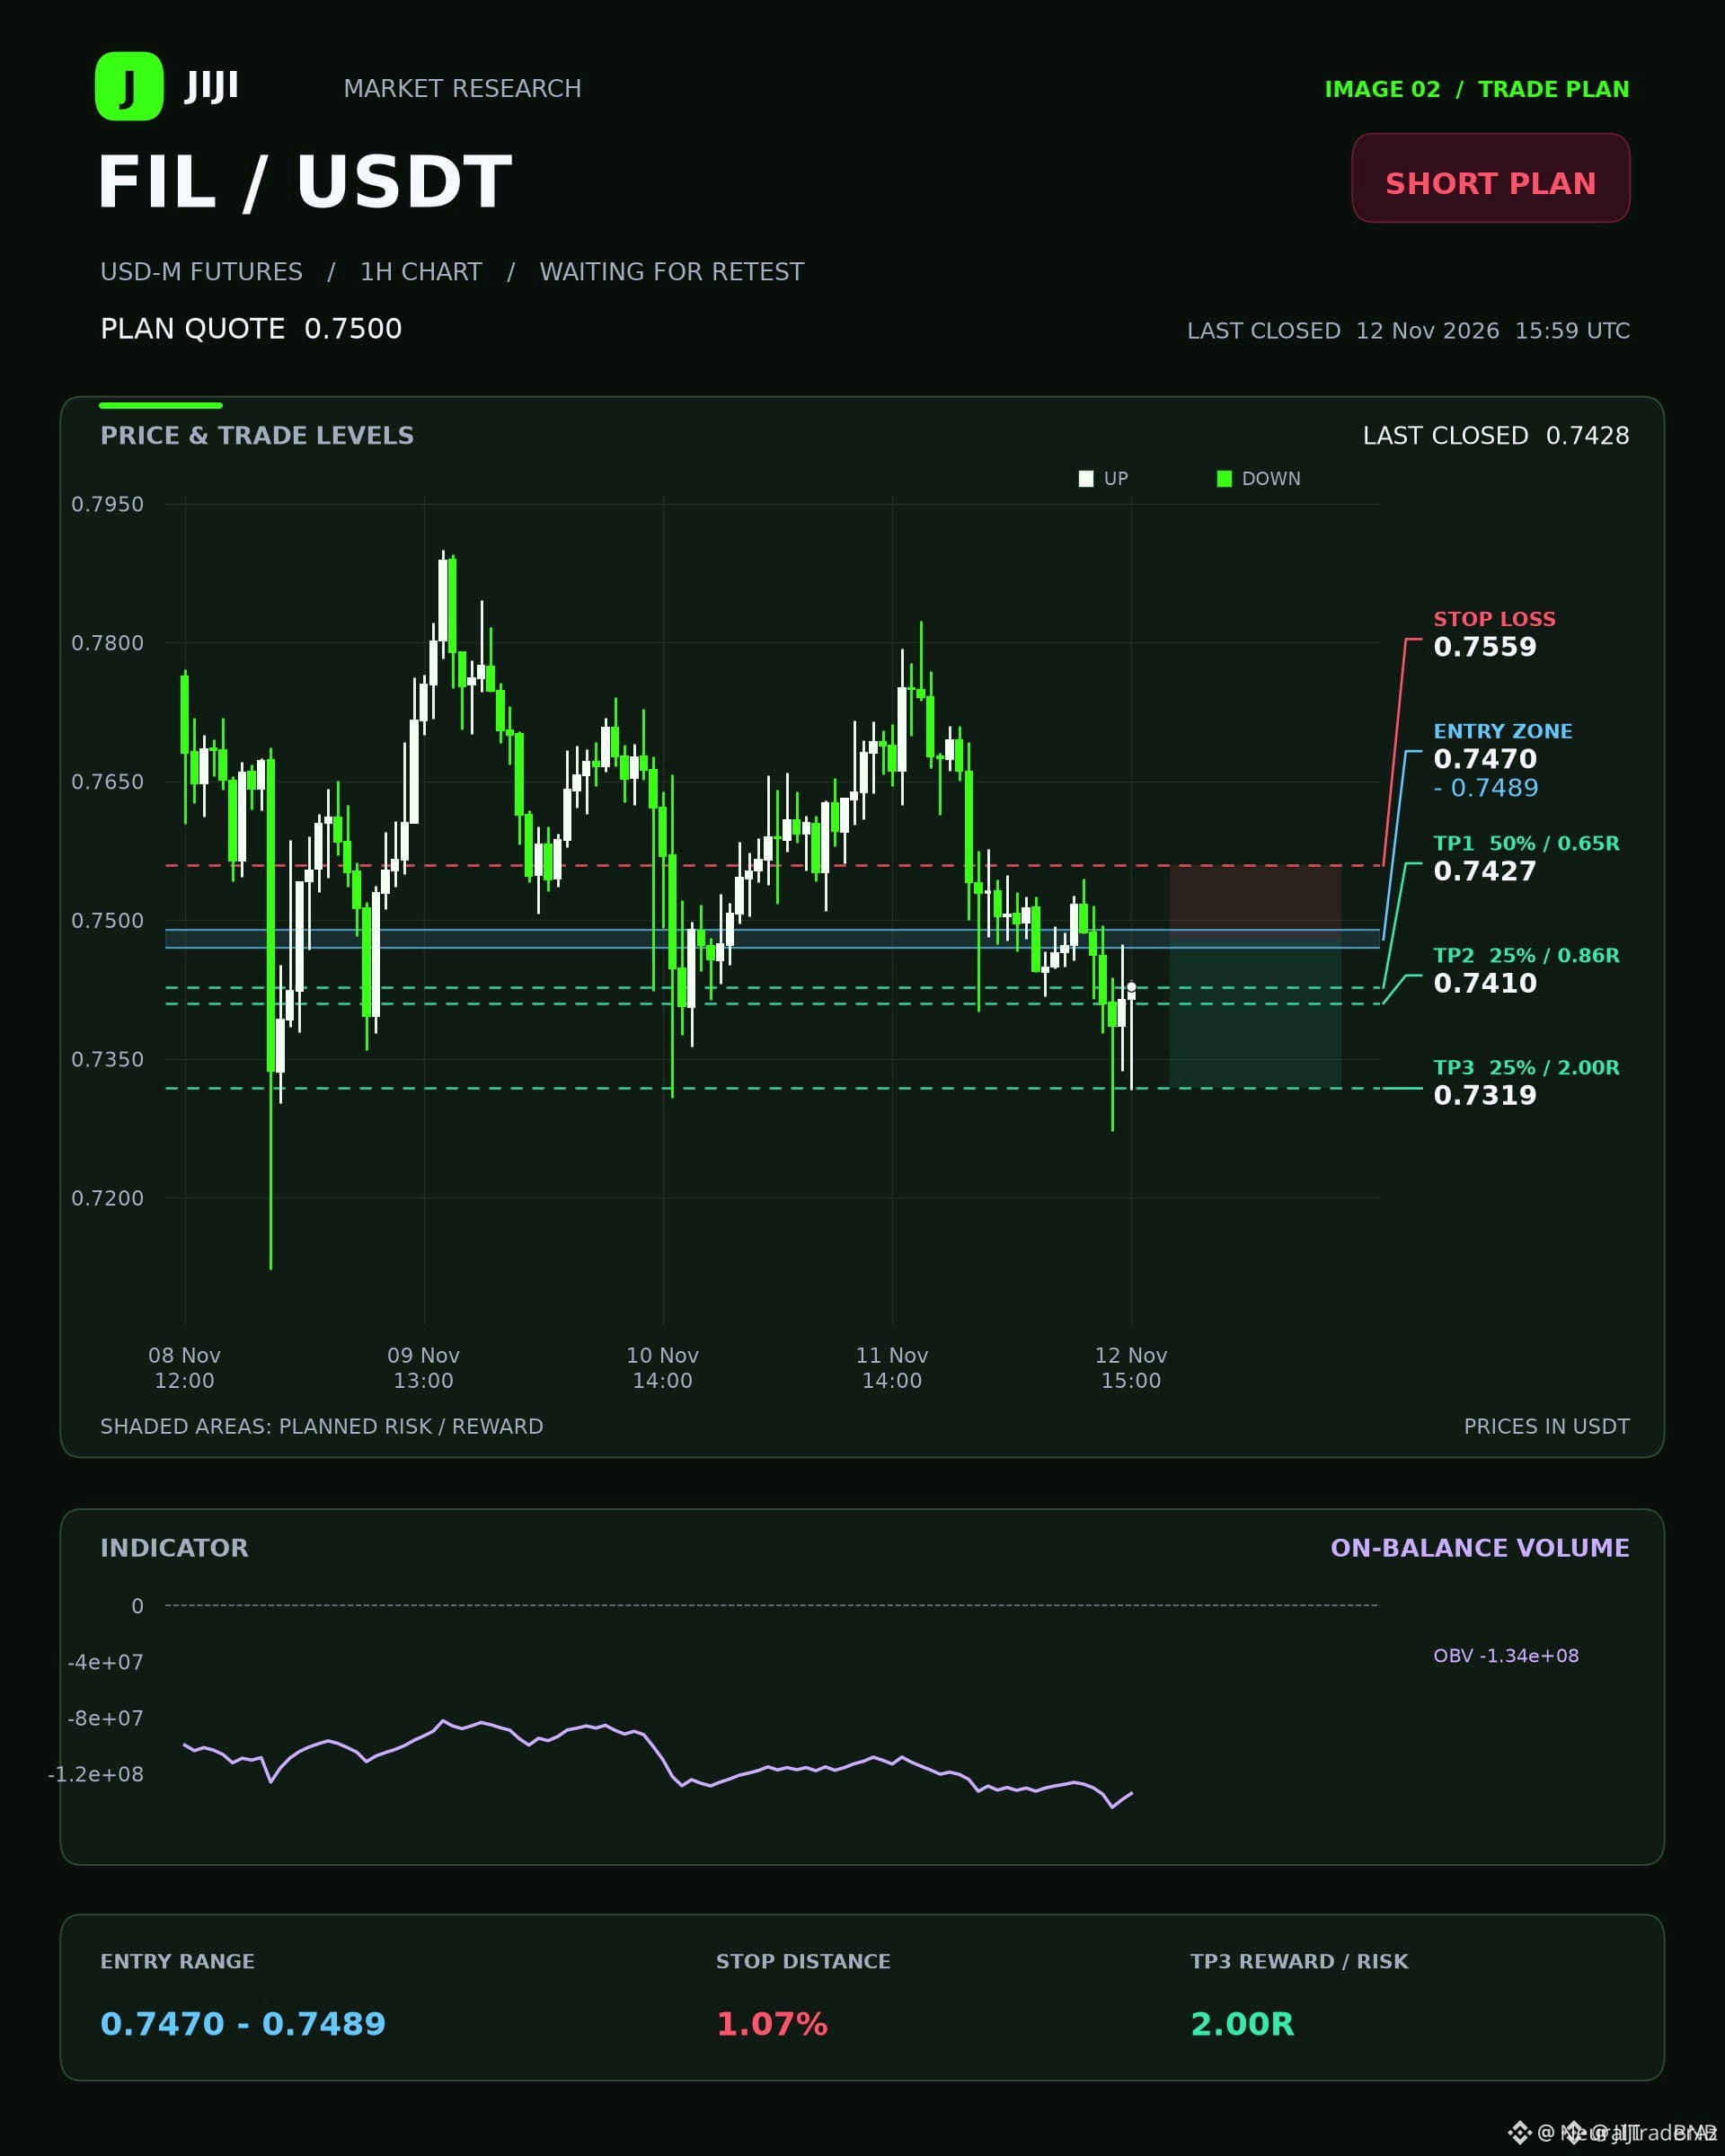
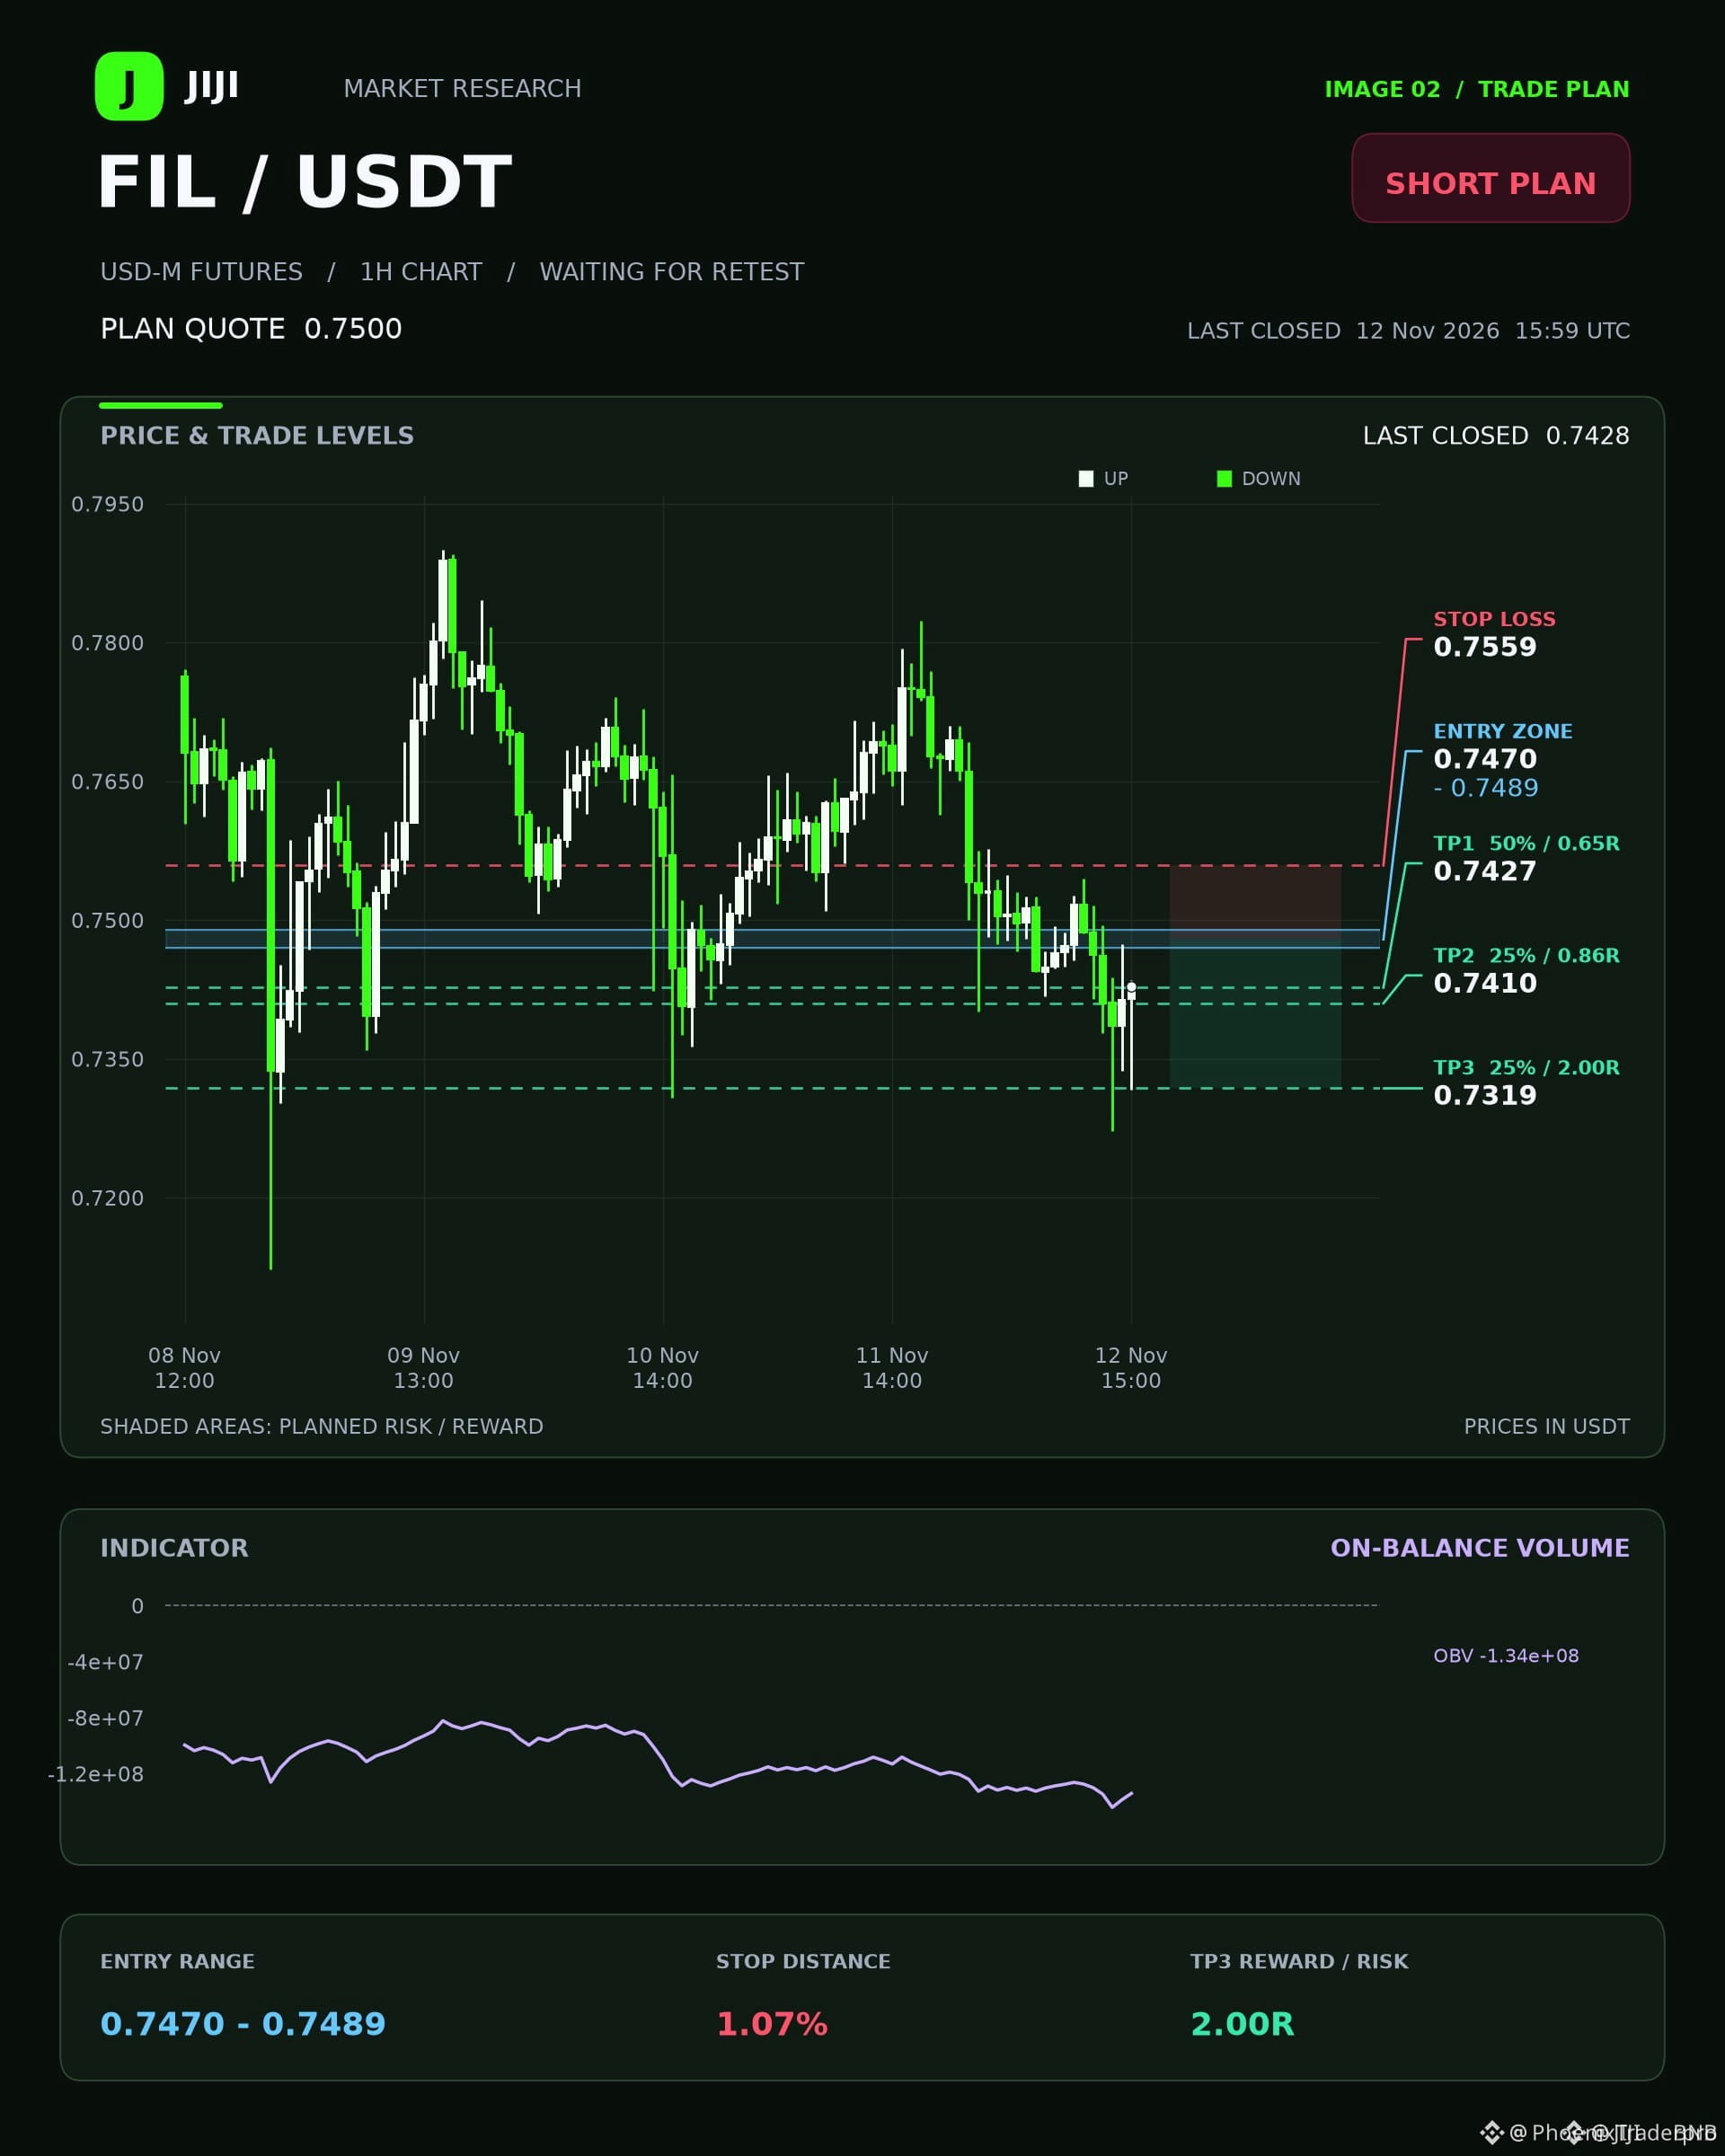
🔴 $FIL BEARISH 4H EMA STACK ALIGNS FOR A CLEAN SHORT SETUP 📉
Entry: 0.747 – 0.7489 ⚡
Target: 0.7319 🚀
Stop Loss: 0.7559 ⚠️
The institutional order flow on $FIL remains under heavy distribution with a firmly established 4h bearish EMA stack controlling the structural bias. 📊
Momentum indicators mirror this weakness as the 1h RSI prints 38.4, reflecting sustained seller dominance across lower timeframes. 📉
We are patiently waiting for price to retest the premium zone and confirm a closed 15m candle before engaging the downside sweep. 🔍 💬 Are you positioning for continuation or waiting for further confirmation? 👇
⚠️ Not financial advice. Always manage your risk. 🛡️
🏷️ #FIL #ShortSetup #CryptoFUTURES #OrderFlow
🦈 ⚖️
🔴 $FIL BEARISH 4H EMA STACK ALIGNS FOR A CLEAN SHORT SETUP 📉
Entry: 0.747 – 0.7489 ⚡
Target: 0.7319 🚀
Stop Loss: 0.7559 ⚠️
The institutional order flow on $FIL remains under heavy distribution with a firmly established 4h bearish EMA stack controlling the structural bias. 📊
Momentum indicators mirror this weakness as the 1h RSI prints 38.4, reflecting sustained seller dominance across lower timeframes. 📉
We are patiently waiting for price to retest the premium zone and confirm a closed 15m candle before engaging the downside sweep. 🔍 💬 Are you positioning for continuation or waiting for further confirmation? 👇
⚠️ Not financial advice. Always manage your risk. 🛡️
🏷️ #FIL #ShortSetup #CryptoFUTURES #OrderFlow
🦈 ⚖️
Entry: 0.747 – 0.7489 ⚡
Target: 0.7319 🚀
Stop Loss: 0.7559 ⚠️
The institutional order flow on $FIL remains under heavy distribution with a firmly established 4h bearish EMA stack controlling the structural bias. 📊
Momentum indicators mirror this weakness as the 1h RSI prints 38.4, reflecting sustained seller dominance across lower timeframes. 📉
We are patiently waiting for price to retest the premium zone and confirm a closed 15m candle before engaging the downside sweep. 🔍 💬 Are you positioning for continuation or waiting for further confirmation? 👇
⚠️ Not financial advice. Always manage your risk. 🛡️
🏷️ #FIL #ShortSetup #CryptoFUTURES #OrderFlow
🦈 ⚖️
4

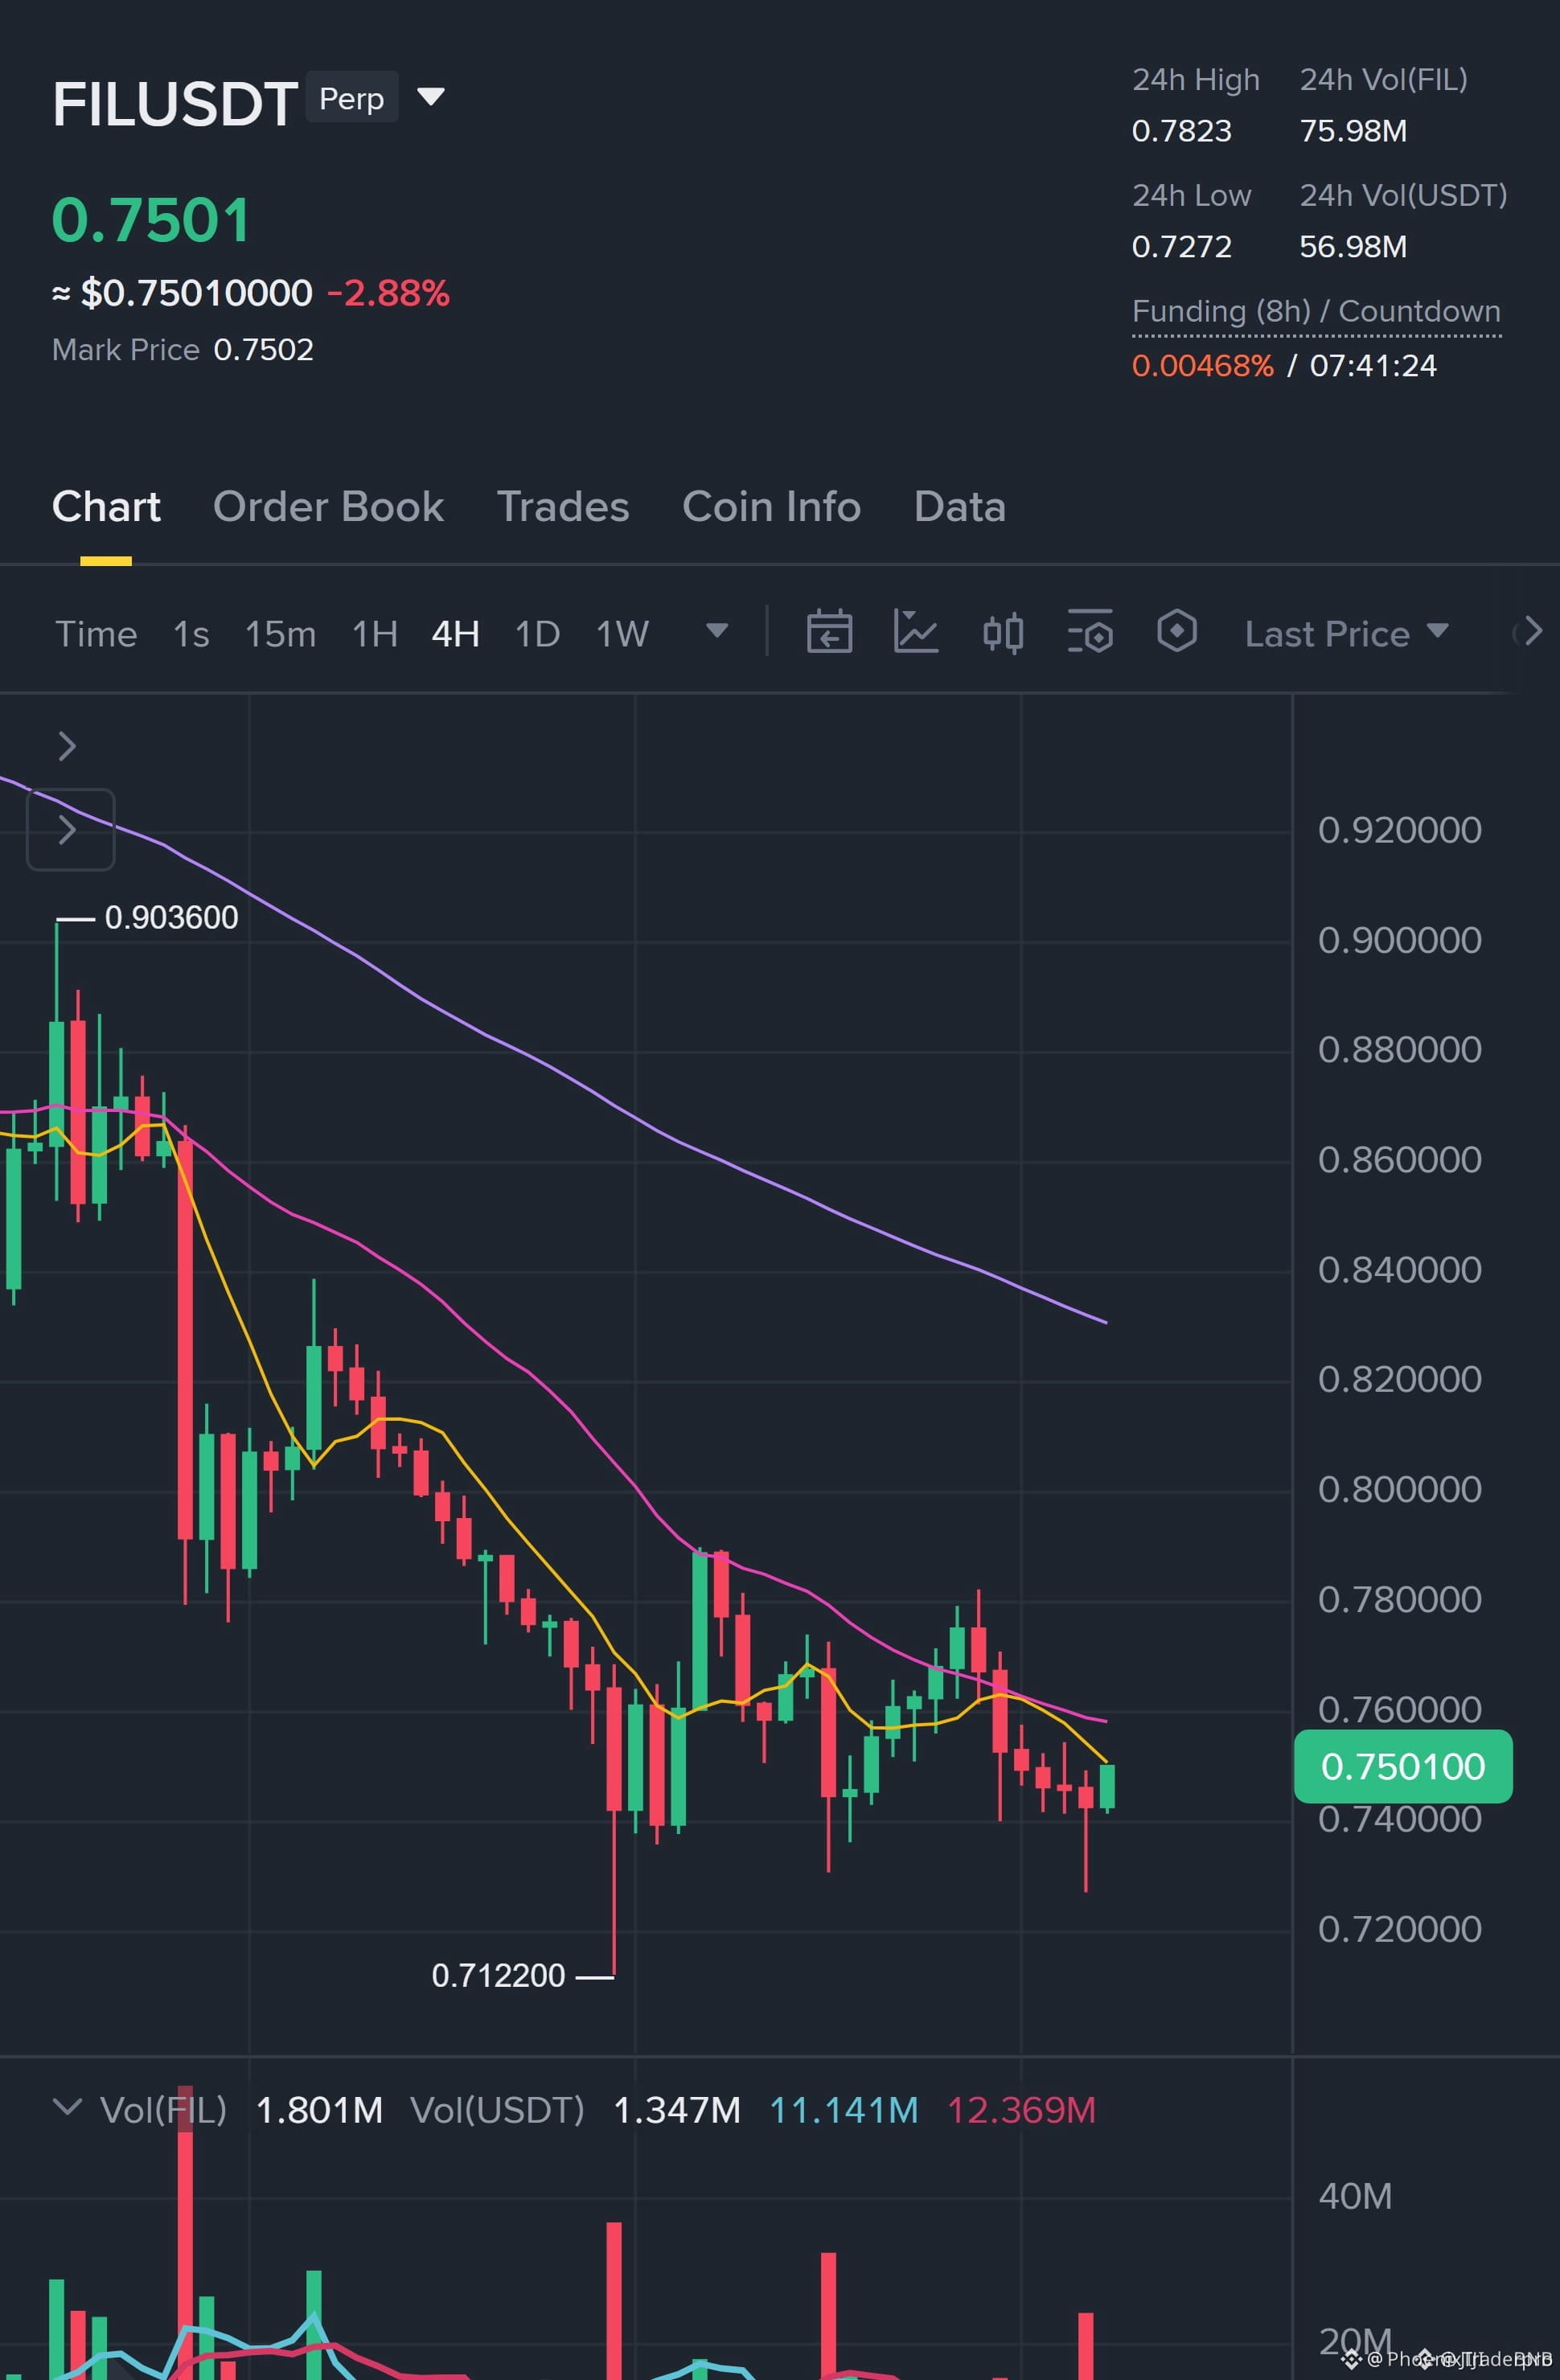
🔴 $FIL BEARISH CONTINUATION SETUPS ARE LINING UP ACROSS THE LOWER TIMEFRAMES 📉
Entry: 0.747 - 0.7489 ⚡
Target: 0.7319 🚀
Stop Loss: 0.7559 ⚠️
The 4h EMA structure is heavily stacked for sellers, with the 1h RSI sitting at 38.4 to confirm downward momentum. Sellers are patiently waiting for a reclaim of the resistance zone before pressing their shorts. 📊
While short-term noise on lower timeframes tries to flash mixed signals, the macro trend favors patience over chasing early entries. ⚡
Are you waiting for a confirmed candle close inside the zone or shorting the initial test? 👇
⚠️ Not financial advice. Always manage your risk. 🛡️
🏷️ #FIL #ShortSetup #CryptoTrading #Bearish
📉 🦈
🔴 $FIL BEARISH CONTINUATION SETUPS ARE LINING UP ACROSS THE LOWER TIMEFRAMES 📉
Entry: 0.747 - 0.7489 ⚡
Target: 0.7319 🚀
Stop Loss: 0.7559 ⚠️
The 4h EMA structure is heavily stacked for sellers, with the 1h RSI sitting at 38.4 to confirm downward momentum. Sellers are patiently waiting for a reclaim of the resistance zone before pressing their shorts. 📊
While short-term noise on lower timeframes tries to flash mixed signals, the macro trend favors patience over chasing early entries. ⚡
Are you waiting for a confirmed candle close inside the zone or shorting the initial test? 👇
⚠️ Not financial advice. Always manage your risk. 🛡️
🏷️ #FIL #ShortSetup #CryptoTrading #Bearish
📉 🦈
Entry: 0.747 - 0.7489 ⚡
Target: 0.7319 🚀
Stop Loss: 0.7559 ⚠️
The 4h EMA structure is heavily stacked for sellers, with the 1h RSI sitting at 38.4 to confirm downward momentum. Sellers are patiently waiting for a reclaim of the resistance zone before pressing their shorts. 📊
While short-term noise on lower timeframes tries to flash mixed signals, the macro trend favors patience over chasing early entries. ⚡
Are you waiting for a confirmed candle close inside the zone or shorting the initial test? 👇
⚠️ Not financial advice. Always manage your risk. 🛡️
🏷️ #FIL #ShortSetup #CryptoTrading #Bearish
📉 🦈
7

·
--
Filecoin Rally: Dips Turn Into Buying Opportunities 🚀
Price action – Filecoin $FIL trades at $0.736 on Binance Spot (FIL/USDT), down 5.01% over the past 24 hours. Volume sits at $4.1 M, indicating moderate liquidity despite the pull‑back.
Key levels – Immediate support is anchored at $0.70, with a secondary floor near $0.66. Resistance caps the recent swing at $0.78, while the mid‑range pivot rests around $0.735. A break above $0.78 could unlock the next upside band.
Outlook – Analyst angle points to bullish continuation. The price dip appears priced in, and the next move may be a rebound as buying pressure re‑accumulates. Traders watching for a test of $0.70 could consider incremental entries, with a focus on the $0.78 ceiling as the next target. Neutral sentiment overall, but momentum cues suggest the downside is fading.
#FIL #CryptoUpdate #Binance
Filecoin Rally: Dips Turn Into Buying Opportunities 🚀
Price action – Filecoin $FIL trades at $0.736 on Binance Spot (FIL/USDT), down 5.01% over the past 24 hours. Volume sits at $4.1 M, indicating moderate liquidity despite the pull‑back.
Key levels – Immediate support is anchored at $0.70, with a secondary floor near $0.66. Resistance caps the recent swing at $0.78, while the mid‑range pivot rests around $0.735. A break above $0.78 could unlock the next upside band.
Outlook – Analyst angle points to bullish continuation. The price dip appears priced in, and the next move may be a rebound as buying pressure re‑accumulates. Traders watching for a test of $0.70 could consider incremental entries, with a focus on the $0.78 ceiling as the next target. Neutral sentiment overall, but momentum cues suggest the downside is fading.
#FIL #CryptoUpdate #Binance
Price action – Filecoin $FIL trades at $0.736 on Binance Spot (FIL/USDT), down 5.01% over the past 24 hours. Volume sits at $4.1 M, indicating moderate liquidity despite the pull‑back.
Key levels – Immediate support is anchored at $0.70, with a secondary floor near $0.66. Resistance caps the recent swing at $0.78, while the mid‑range pivot rests around $0.735. A break above $0.78 could unlock the next upside band.
Outlook – Analyst angle points to bullish continuation. The price dip appears priced in, and the next move may be a rebound as buying pressure re‑accumulates. Traders watching for a test of $0.70 could consider incremental entries, with a focus on the $0.78 ceiling as the next target. Neutral sentiment overall, but momentum cues suggest the downside is fading.
#FIL #CryptoUpdate #Binance
5

·
--
🚨 MASSIVE BEAR TRAP TRIGGERED: $FIL IS PRIMED TO EXPLODE!
SMART MONEY JUST STEPPED IN. Aggressive spot absorbing dried up sell-side liquidity instantly while aggressive shorts got lured into a lethal trap below local support. CVD divergence is screaming institutional accumulation!
We are standing right at the critical inflection point. Retail is panic-selling the retest while liquidity pools above 0.7800 are completely ripe for the taking. SQUEEZE IMMINENT.
EXECUTION:
ENTRY: 0.7336 $FIL
SL: 0.7250
TP1: 0.7580
TP2: 0.7823
RR: 5.67:1
Are the bears about to get completely liquidated on this supply flip, or will sellers fight back at the highs? DROP YOUR BIAS BELOW!
#FIL #BinanceSquare #SlowSclap #TradingAnalysis
🚨 MASSIVE BEAR TRAP TRIGGERED: $FIL IS PRIMED TO EXPLODE!
SMART MONEY JUST STEPPED IN. Aggressive spot absorbing dried up sell-side liquidity instantly while aggressive shorts got lured into a lethal trap below local support. CVD divergence is screaming institutional accumulation!
We are standing right at the critical inflection point. Retail is panic-selling the retest while liquidity pools above 0.7800 are completely ripe for the taking. SQUEEZE IMMINENT.
EXECUTION:
ENTRY: 0.7336 $FIL
SL: 0.7250
TP1: 0.7580
TP2: 0.7823
RR: 5.67:1
Are the bears about to get completely liquidated on this supply flip, or will sellers fight back at the highs? DROP YOUR BIAS BELOW!
#FIL #BinanceSquare #SlowSclap #TradingAnalysis
SMART MONEY JUST STEPPED IN. Aggressive spot absorbing dried up sell-side liquidity instantly while aggressive shorts got lured into a lethal trap below local support. CVD divergence is screaming institutional accumulation!
We are standing right at the critical inflection point. Retail is panic-selling the retest while liquidity pools above 0.7800 are completely ripe for the taking. SQUEEZE IMMINENT.
EXECUTION:
ENTRY: 0.7336 $FIL
SL: 0.7250
TP1: 0.7580
TP2: 0.7823
RR: 5.67:1
Are the bears about to get completely liquidated on this supply flip, or will sellers fight back at the highs? DROP YOUR BIAS BELOW!
#FIL #BinanceSquare #SlowSclap #TradingAnalysis
6

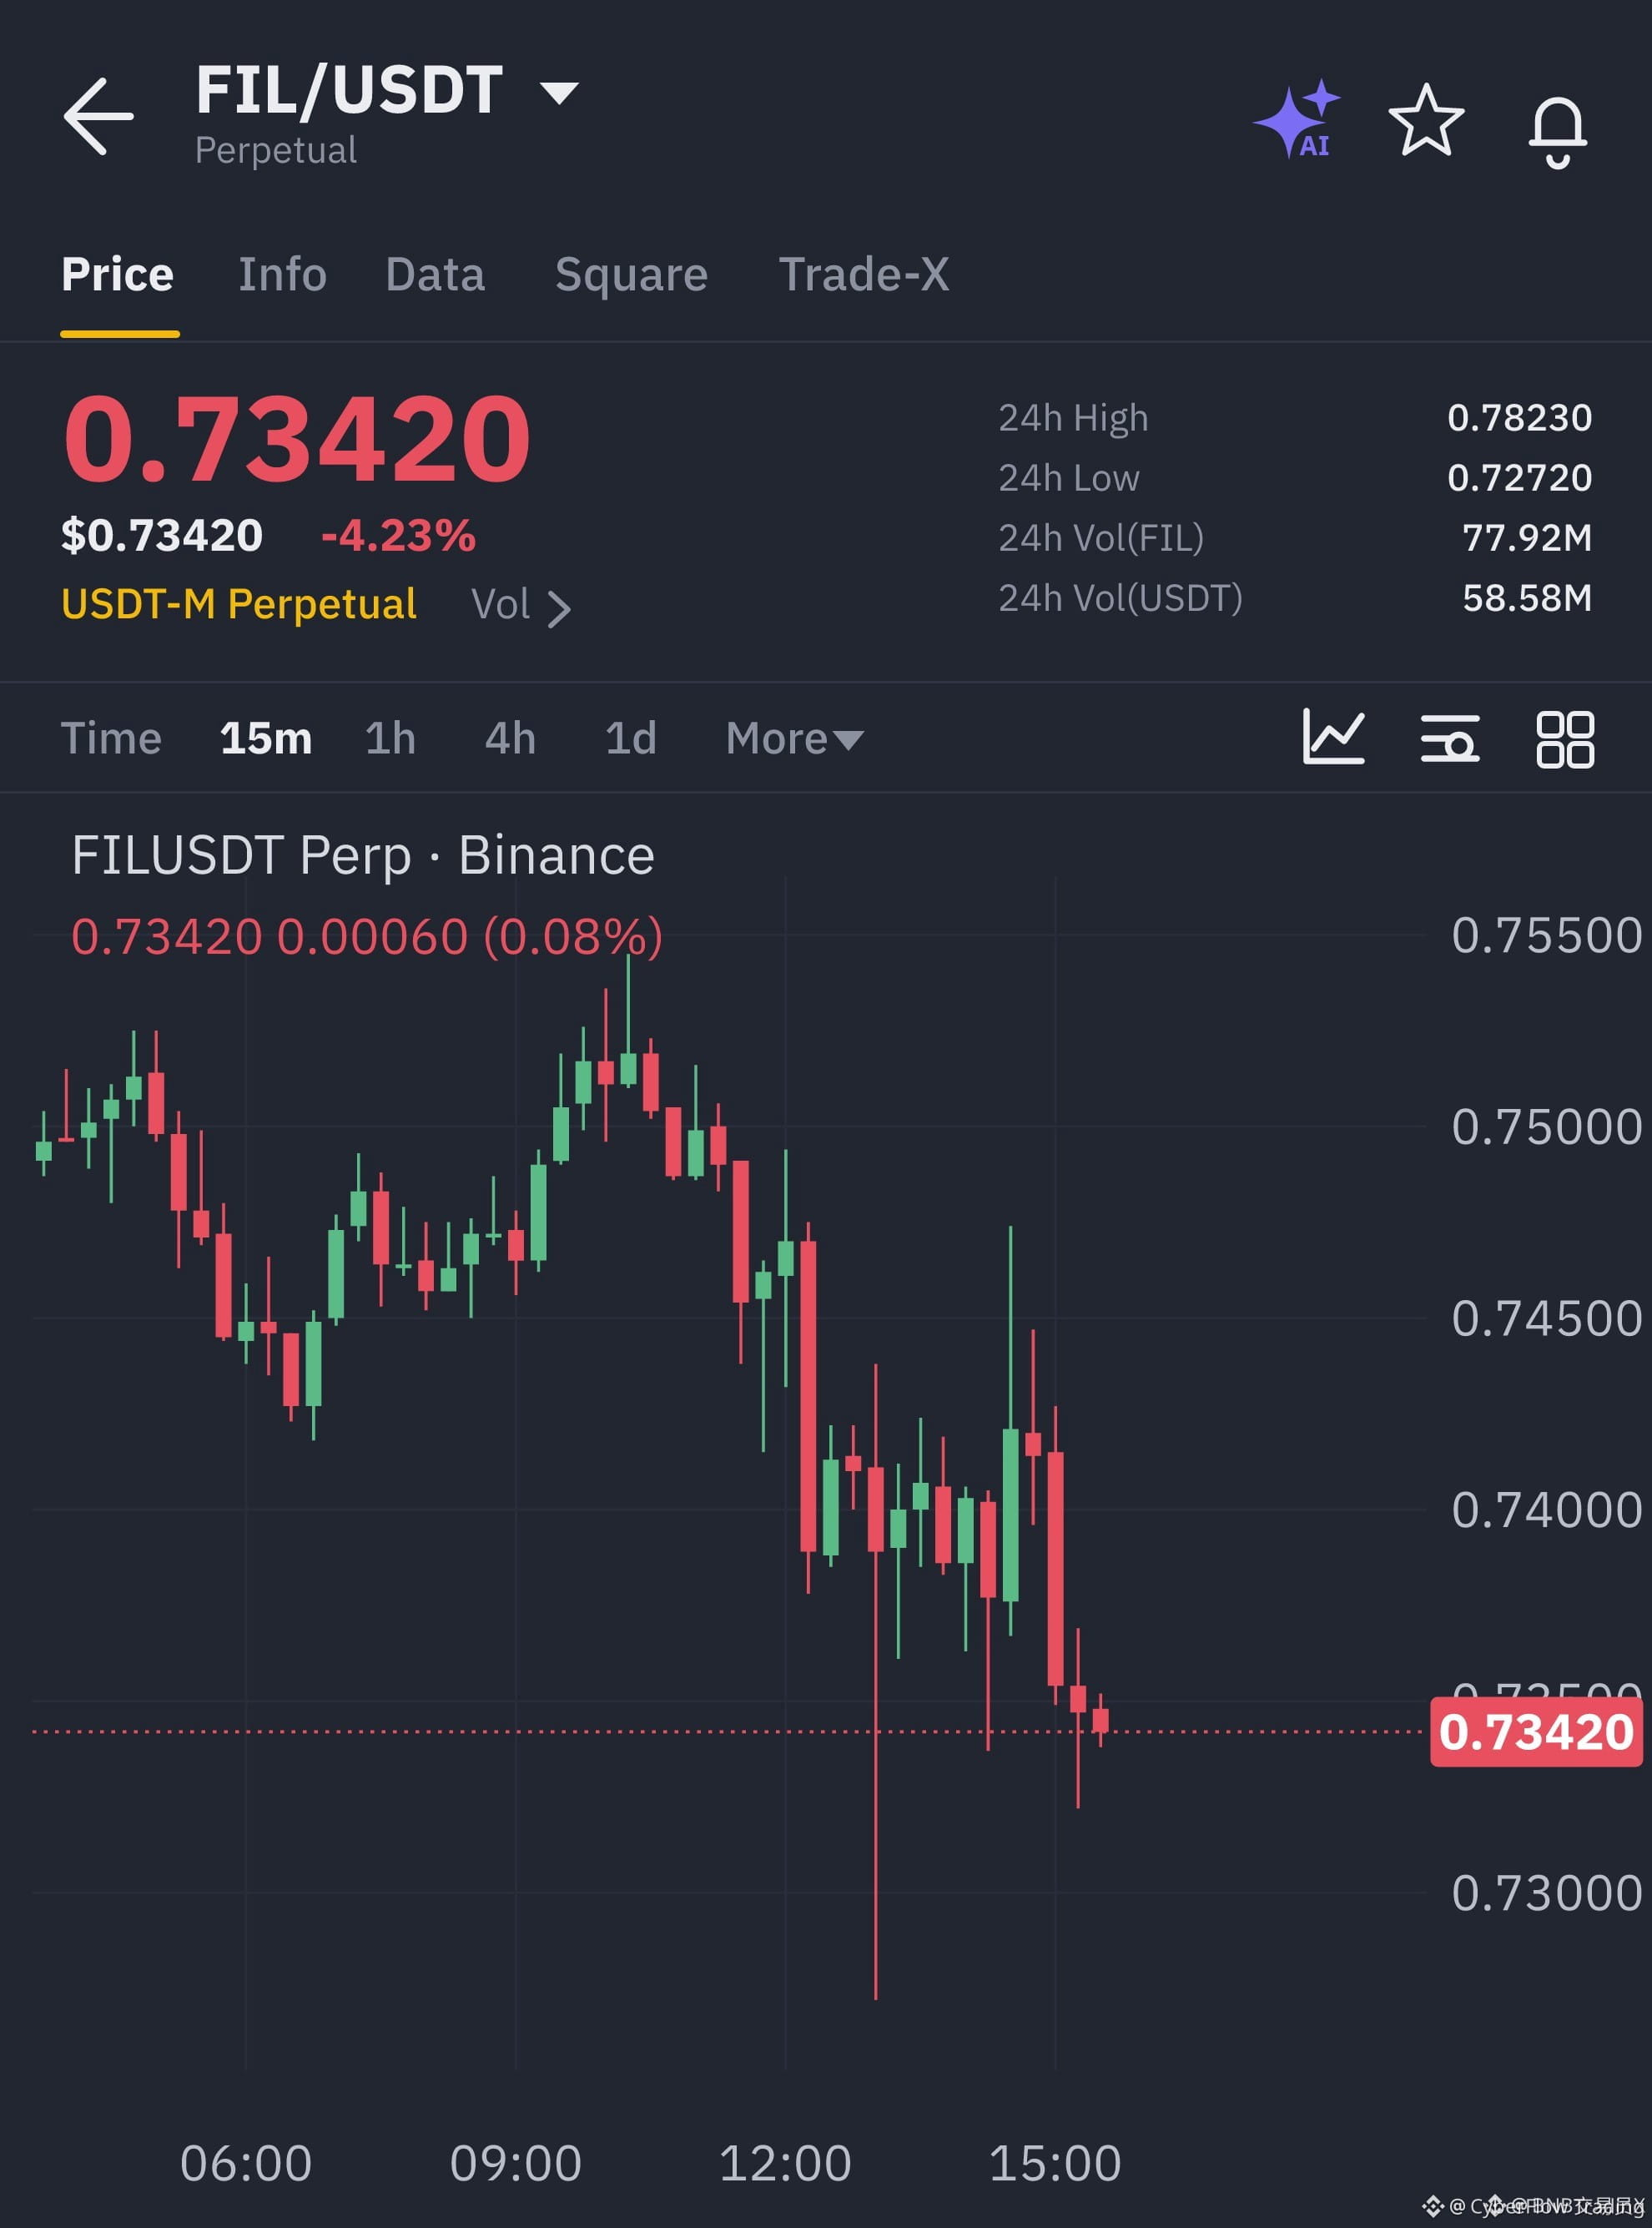
🔴 $FIL IS LOSING ITS GRIP AS SELLERS STEP IN TO CRUSH THE BOUNCE! 📉
Entry: 0.732771–0.735829 ⚡
Target: 0.712289 🎯
Stop Loss: 0.746529 ⚠️
Buyers tried to force a recovery here, but heavy overhead supply near 0.751600 completely stuffed the momentum. 📊 Volume is drying up fast as sellers take control of the tape.
Price action is looking exhausted with momentum tilting firmly to the downside. ⚡ Watch how price reacts as it tests the 0.727200 floor next. 💬 Are you shorting this breakdown or waiting for a deeper sweep? 👇
⚠️ Not financial advice. Always manage your risk. 🛡️
🏷️ #FIL #TRX #ICP #ShortSetup
🔴 📉
🔴 $FIL IS LOSING ITS GRIP AS SELLERS STEP IN TO CRUSH THE BOUNCE! 📉
Entry: 0.732771–0.735829 ⚡
Target: 0.712289 🎯
Stop Loss: 0.746529 ⚠️
Buyers tried to force a recovery here, but heavy overhead supply near 0.751600 completely stuffed the momentum. 📊 Volume is drying up fast as sellers take control of the tape.
Price action is looking exhausted with momentum tilting firmly to the downside. ⚡ Watch how price reacts as it tests the 0.727200 floor next. 💬 Are you shorting this breakdown or waiting for a deeper sweep? 👇
⚠️ Not financial advice. Always manage your risk. 🛡️
🏷️ #FIL #TRX #ICP #ShortSetup
🔴 📉
Entry: 0.732771–0.735829 ⚡
Target: 0.712289 🎯
Stop Loss: 0.746529 ⚠️
Buyers tried to force a recovery here, but heavy overhead supply near 0.751600 completely stuffed the momentum. 📊 Volume is drying up fast as sellers take control of the tape.
Price action is looking exhausted with momentum tilting firmly to the downside. ⚡ Watch how price reacts as it tests the 0.727200 floor next. 💬 Are you shorting this breakdown or waiting for a deeper sweep? 👇
⚠️ Not financial advice. Always manage your risk. 🛡️
🏷️ #FIL #TRX #ICP #ShortSetup
🔴 📉
8

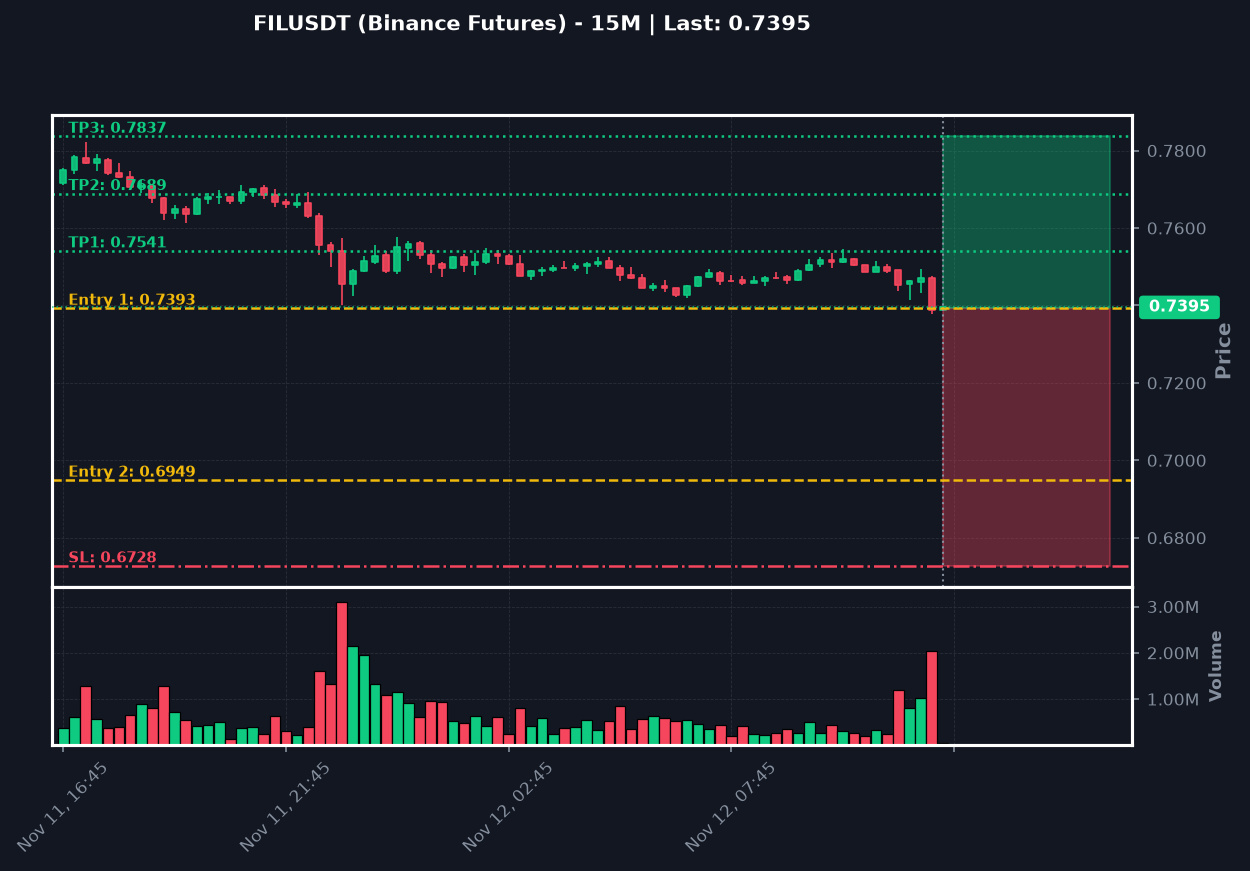
🎯 SURGICAL ACCURACY ZONE 🎯
Do not rush. Wait for our entry, execute cleanly, and let probability do the heavy lifting.
$FIL (15m)
📅 STATUS: LONG 🚀
👉 Entry 1: 0.7393
👉 Entry 2: 0.6949
🎯 TP 1: 0.7541
🎯 TP 2: 0.7689
🎯 TP 3: 0.7837
⛔ Stop Loss: 0.672763
⚡ Leverage: Cross 20x
📲 Execute precisely as written above!
💎 True wealth takes discipline. Trust the levels, set your orders, and relax.
#Write2Earn #Binance #BTC #TrendingTopic #FIL
🎯 SURGICAL ACCURACY ZONE 🎯
Do not rush. Wait for our entry, execute cleanly, and let probability do the heavy lifting.
$FIL (15m)
📅 STATUS: LONG 🚀
👉 Entry 1: 0.7393
👉 Entry 2: 0.6949
🎯 TP 1: 0.7541
🎯 TP 2: 0.7689
🎯 TP 3: 0.7837
⛔ Stop Loss: 0.672763
⚡ Leverage: Cross 20x
📲 Execute precisely as written above!
💎 True wealth takes discipline. Trust the levels, set your orders, and relax.
#Write2Earn #Binance #BTC #TrendingTopic #FIL
Do not rush. Wait for our entry, execute cleanly, and let probability do the heavy lifting.
$FIL (15m)
📅 STATUS: LONG 🚀
👉 Entry 1: 0.7393
👉 Entry 2: 0.6949
🎯 TP 1: 0.7541
🎯 TP 2: 0.7689
🎯 TP 3: 0.7837
⛔ Stop Loss: 0.672763
⚡ Leverage: Cross 20x
📲 Execute precisely as written above!
💎 True wealth takes discipline. Trust the levels, set your orders, and relax.
#Write2Earn #Binance #BTC #TrendingTopic #FIL
5

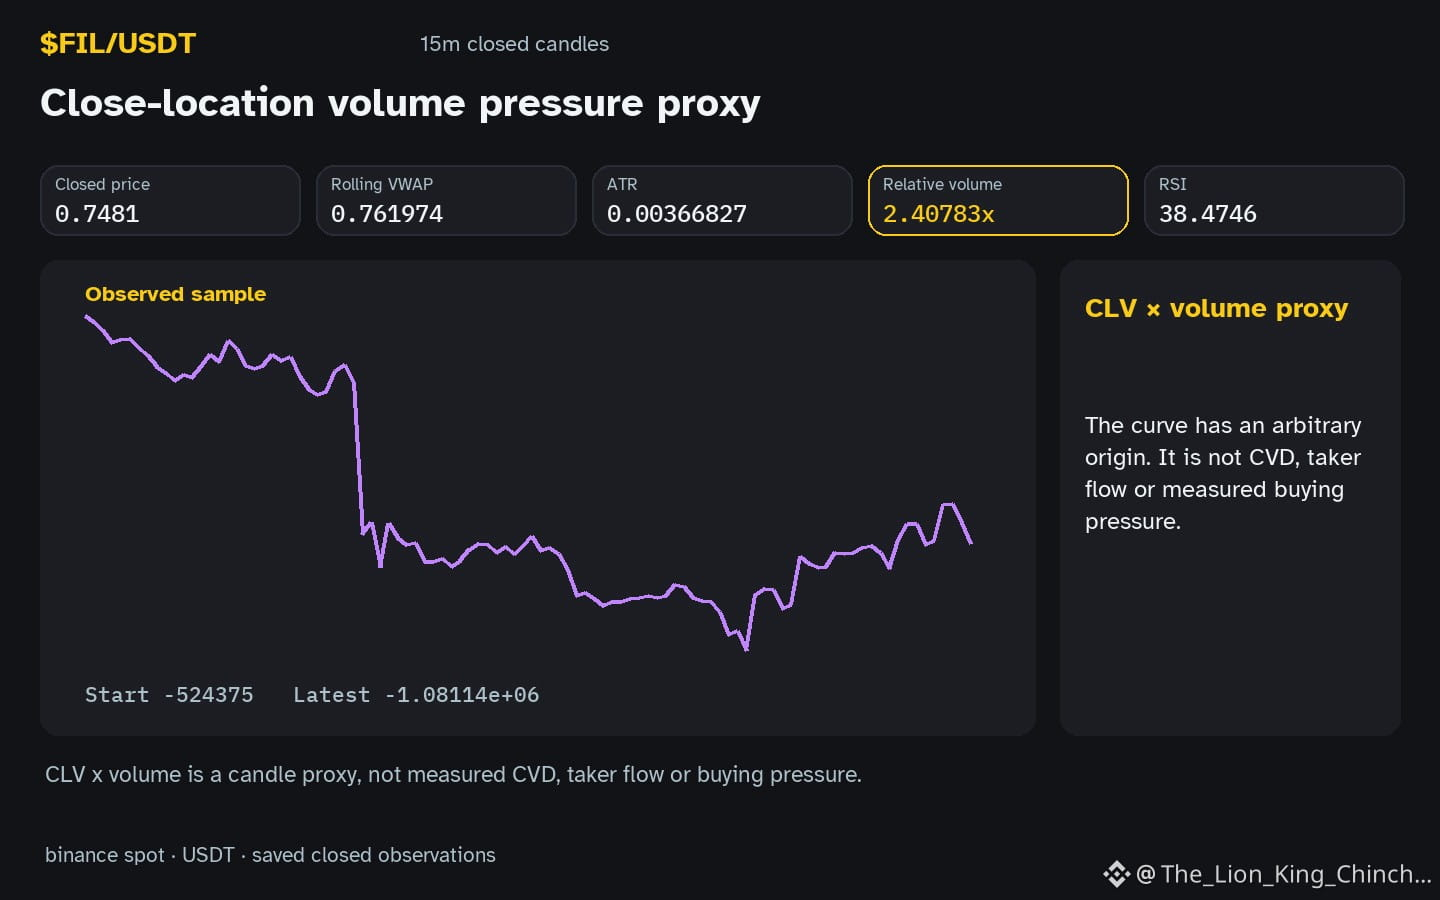
$FIL: Rethinking Red Candle Volume
When $FIL forms a red candle with volume 2.41x baseline, the mind often races to a shortcut conclusion. I once imagined a research habit where I’d file every bearish candle with high volume into a "sell‑now" folder, only to discover the folder was empty. The joke highlights a habit: treating volume as a one‑sided sign.
A more careful interpretation asks what the volume actually confirms. In the observation, the hourly direction is down, the candle sits inside a recorded range, and volume is above baseline. One hypothesis is that the extra trades simply fill existing orders without implying a decisive shift. The red body tells us price moved lower, while the volume tells us the market was active – but not whether sellers dominated or buyers were just defending.
A useful next observation would be to watch the next closed candle. If the subsequent candle closes lower with similarly elevated volume, the hypothesis of sustained pressure gains weight. Conversely, a green candle with comparable volume would weaken the bearish inference and suggest the earlier spike was a temporary liquidity grab. This conditional check keeps the analysis grounded in data rather than narrative, reminding us to give equal respect to red‑candle volume clues without over‑reading intent.
Probabilistic market research, not a recommendation or guaranteed return.
Have you changed the rule after seeing the candle?
#FIL #LearnCrypto #CryptoLearning
$FIL : Rethinking Red Candle Volume
When $FIL forms a red candle with volume 2.41x baseline, the mind often races to a shortcut conclusion. I once imagined a research habit where I’d file every bearish candle with high volume into a "sell‑now" folder, only to discover the folder was empty. The joke highlights a habit: treating volume as a one‑sided sign.
A more careful interpretation asks what the volume actually confirms. In the observation, the hourly direction is down, the candle sits inside a recorded range, and volume is above baseline. One hypothesis is that the extra trades simply fill existing orders without implying a decisive shift. The red body tells us price moved lower, while the volume tells us the market was active – but not whether sellers dominated or buyers were just defending.
A useful next observation would be to watch the next closed candle. If the subsequent candle closes lower with similarly elevated volume, the hypothesis of sustained pressure gains weight. Conversely, a green candle with comparable volume would weaken the bearish inference and suggest the earlier spike was a temporary liquidity grab. This conditional check keeps the analysis grounded in data rather than narrative, reminding us to give equal respect to red‑candle volume clues without over‑reading intent.
Probabilistic market research, not a recommendation or guaranteed return.
Have you changed the rule after seeing the candle?
#FIL #LearnCrypto #CryptoLearning
When $FIL forms a red candle with volume 2.41x baseline, the mind often races to a shortcut conclusion. I once imagined a research habit where I’d file every bearish candle with high volume into a "sell‑now" folder, only to discover the folder was empty. The joke highlights a habit: treating volume as a one‑sided sign.
A more careful interpretation asks what the volume actually confirms. In the observation, the hourly direction is down, the candle sits inside a recorded range, and volume is above baseline. One hypothesis is that the extra trades simply fill existing orders without implying a decisive shift. The red body tells us price moved lower, while the volume tells us the market was active – but not whether sellers dominated or buyers were just defending.
A useful next observation would be to watch the next closed candle. If the subsequent candle closes lower with similarly elevated volume, the hypothesis of sustained pressure gains weight. Conversely, a green candle with comparable volume would weaken the bearish inference and suggest the earlier spike was a temporary liquidity grab. This conditional check keeps the analysis grounded in data rather than narrative, reminding us to give equal respect to red‑candle volume clues without over‑reading intent.
Probabilistic market research, not a recommendation or guaranteed return.
Have you changed the rule after seeing the candle?
#FIL #LearnCrypto #CryptoLearning
24

·
--
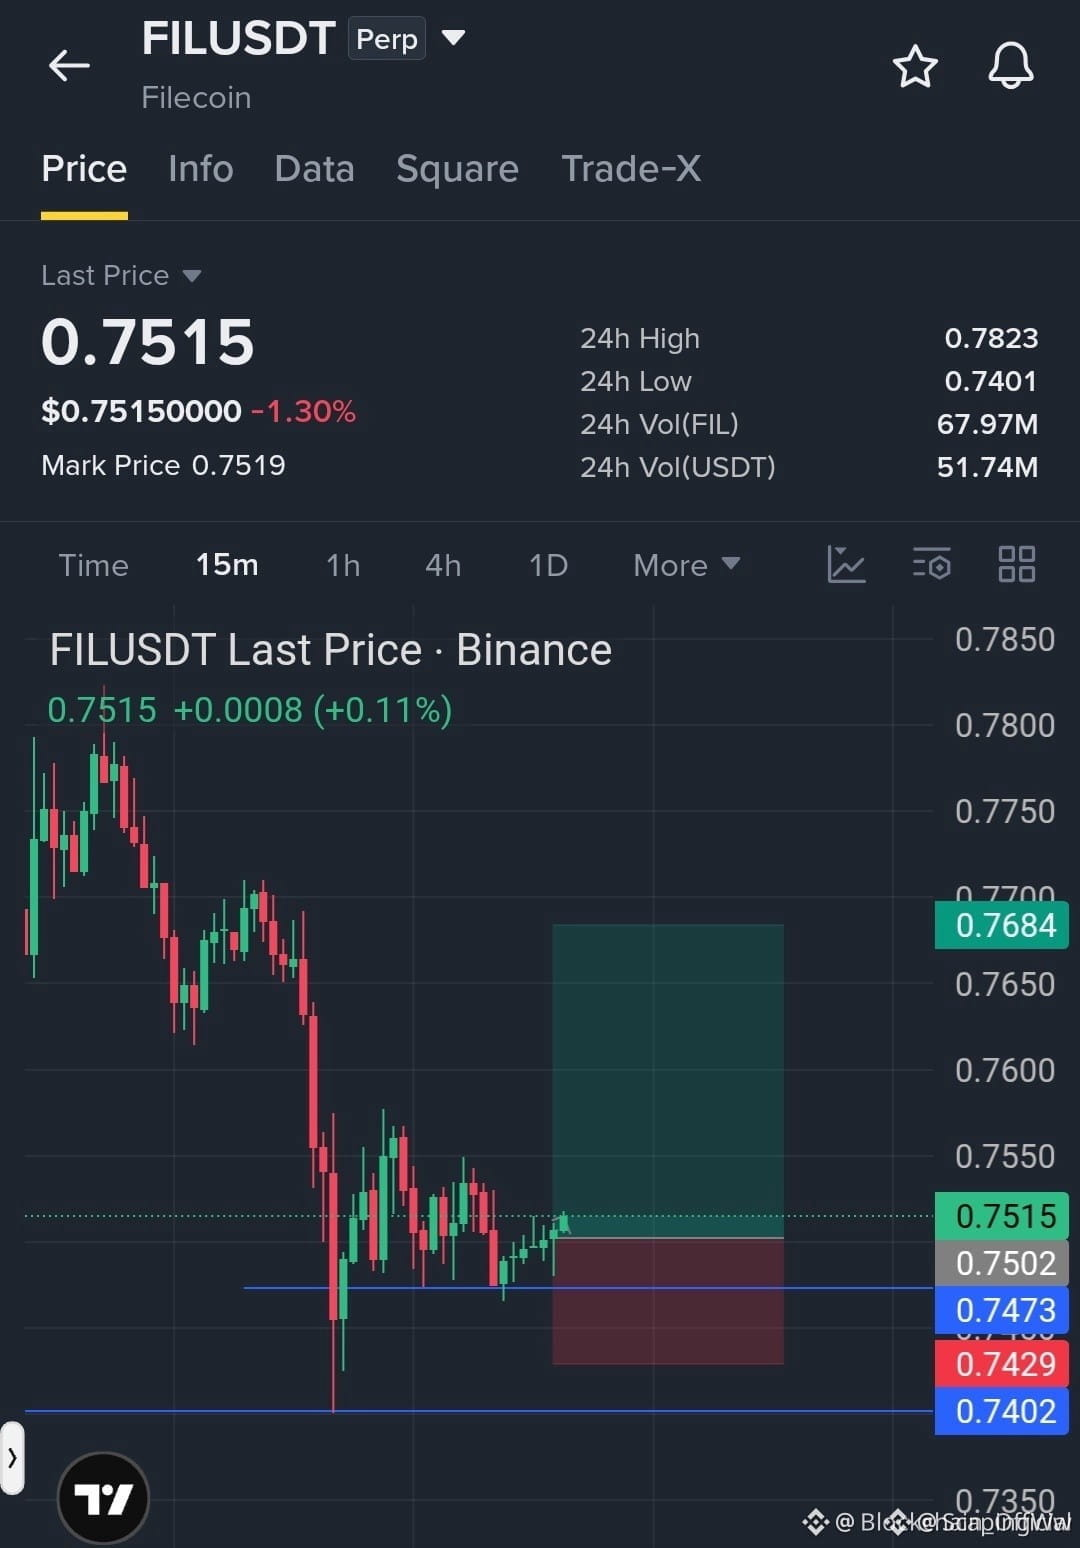
🚨 $FIL SHATTERS BEARISH PRESSURE AS BUYERS RECLAIM THE LINE! 💥
Entry: $0.7500 – $0.7515 ⚡
Target: $0.7684 🚀
Stop Loss: $0.7429 ⚠️
Sellers tried to slam the door on this order book, but the $0.7473 support floor stood firm like an immovable concrete monolith. 🛡️
With bearish momentum evaporating across the board, aggressive buyers are stepping in to stack bids and drive price action straight toward overhead liquidity targets. 📊
Are you catching this momentum expansion early or waiting for clean confirmation above the current range? 👇
⚠️ Not financial advice. Always manage your risk. 🛡️
🏷️ #FIL #LongSetup #Crypto #Breakout #Altcoins
🔥 🚀
🚨 $FIL SHATTERS BEARISH PRESSURE AS BUYERS RECLAIM THE LINE! 💥
Entry: $0.7500 – $0.7515 ⚡
Target: $0.7684 🚀
Stop Loss: $0.7429 ⚠️
Sellers tried to slam the door on this order book, but the $0.7473 support floor stood firm like an immovable concrete monolith. 🛡️
With bearish momentum evaporating across the board, aggressive buyers are stepping in to stack bids and drive price action straight toward overhead liquidity targets. 📊
Are you catching this momentum expansion early or waiting for clean confirmation above the current range? 👇
⚠️ Not financial advice. Always manage your risk. 🛡️
🏷️ #FIL #LongSetup #Crypto #Breakout #Altcoins
🔥 🚀
Entry: $0.7500 – $0.7515 ⚡
Target: $0.7684 🚀
Stop Loss: $0.7429 ⚠️
Sellers tried to slam the door on this order book, but the $0.7473 support floor stood firm like an immovable concrete monolith. 🛡️
With bearish momentum evaporating across the board, aggressive buyers are stepping in to stack bids and drive price action straight toward overhead liquidity targets. 📊
Are you catching this momentum expansion early or waiting for clean confirmation above the current range? 👇
⚠️ Not financial advice. Always manage your risk. 🛡️
🏷️ #FIL #LongSetup #Crypto #Breakout #Altcoins
🔥 🚀
14
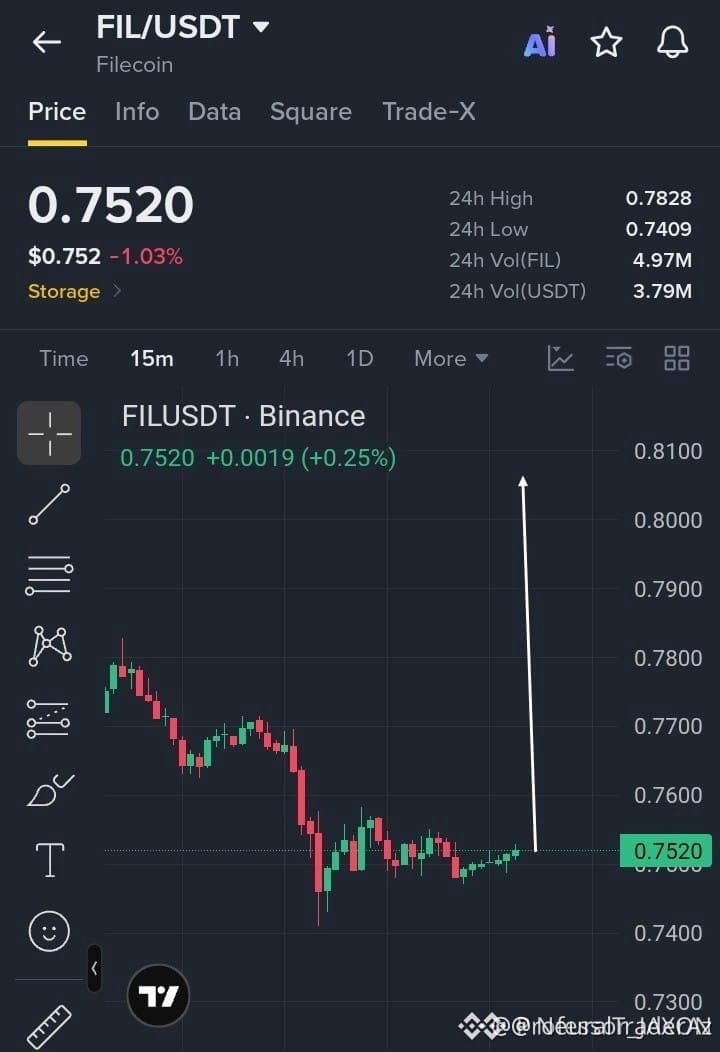
🦈 $FIL ACCUMULATING NEAR STRUCTURAL SUPPORT AS SMART MONEY EYES A SHARP RECOVERY RALLY! ⚡
Entry: 0.7500–0.7530 ⚡
Target: 0.7800 🚀
Stop Loss: 0.7440 ⚠️
Following an extended structural markdown, $FIL is coiling tightly around the 0.7520 liquidity pocket as institutional bid absorption absorbs lingering sell-side pressure. 📊
A decisive acceptance and breakout above the 0.7550 equilibrium mark should invalidate resting supply, opening a clean institutional pathway toward higher liquidity pools. 💡
Risk parameters are tightly defined beneath the recent structural low to protect capital against sudden volatility shifts. 🤔 Are you positioning ahead of this breakout or waiting for confirmation above resistance? 👇
⚠️ Not financial advice. Always manage your risk. 🛡️
🏷️ #FIL #SmartMoney #MarketStructure #Crypto
🦈 ⚡
🦈 $FIL ACCUMULATING NEAR STRUCTURAL SUPPORT AS SMART MONEY EYES A SHARP RECOVERY RALLY! ⚡
Entry: 0.7500–0.7530 ⚡
Target: 0.7800 🚀
Stop Loss: 0.7440 ⚠️
Following an extended structural markdown, $FIL is coiling tightly around the 0.7520 liquidity pocket as institutional bid absorption absorbs lingering sell-side pressure. 📊
A decisive acceptance and breakout above the 0.7550 equilibrium mark should invalidate resting supply, opening a clean institutional pathway toward higher liquidity pools. 💡
Risk parameters are tightly defined beneath the recent structural low to protect capital against sudden volatility shifts. 🤔 Are you positioning ahead of this breakout or waiting for confirmation above resistance? 👇
⚠️ Not financial advice. Always manage your risk. 🛡️
🏷️ #FIL #SmartMoney #MarketStructure #Crypto
🦈 ⚡
Entry: 0.7500–0.7530 ⚡
Target: 0.7800 🚀
Stop Loss: 0.7440 ⚠️
Following an extended structural markdown, $FIL is coiling tightly around the 0.7520 liquidity pocket as institutional bid absorption absorbs lingering sell-side pressure. 📊
A decisive acceptance and breakout above the 0.7550 equilibrium mark should invalidate resting supply, opening a clean institutional pathway toward higher liquidity pools. 💡
Risk parameters are tightly defined beneath the recent structural low to protect capital against sudden volatility shifts. 🤔 Are you positioning ahead of this breakout or waiting for confirmation above resistance? 👇
⚠️ Not financial advice. Always manage your risk. 🛡️
🏷️ #FIL #SmartMoney #MarketStructure #Crypto
🦈 ⚡
19
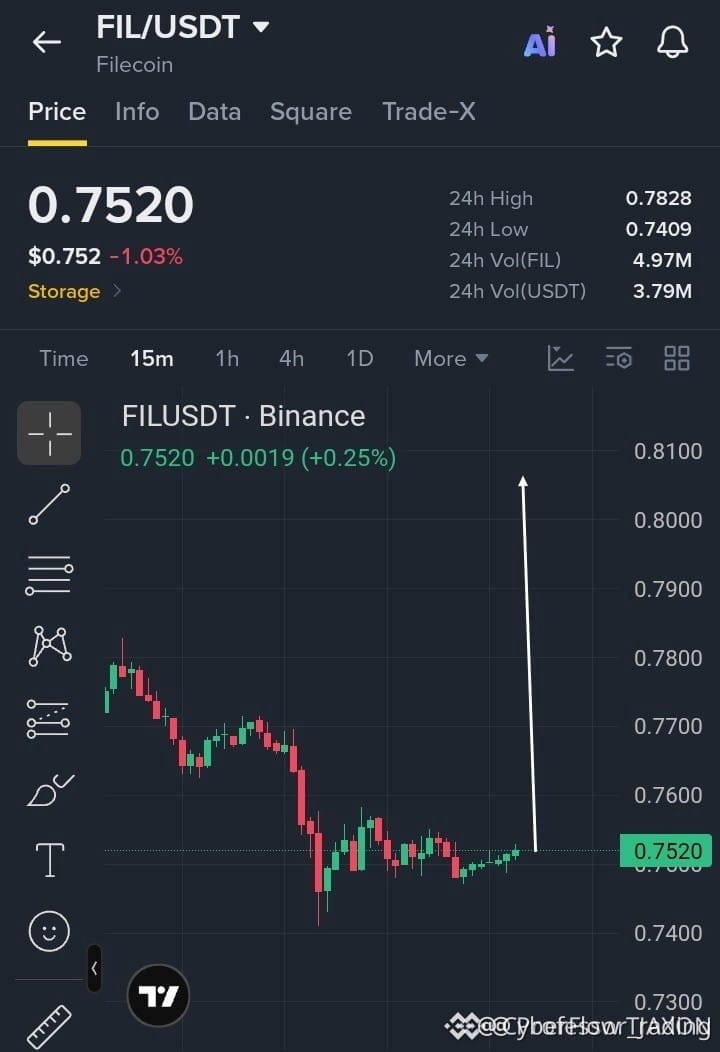
🚨 $FIL IS COILED TIGHT NEAR SUPPORT READY FOR A MULTI-TARGET RECOVERY BREAKOUT! ⚡
Entry: 0.7500-0.7530 ⚡
Target: 0.7800 🚀
Stop Loss: 0.7440 ⚠️
After a prolonged bleed, price action is consolidating right near 0.7520 as patient buyers quietly absorb the floating supply. 📊 Volume profiles show accumulation tightening up, setting the stage for a sharp reclamation of higher resistance levels once momentum flips. ⚡
Holding the local floor is critical to maintain this bullish structure while sellers run out of ammunition. 💡 Are you scaling in here during the consolidation or waiting for a confirmed breakout candle above 0.7550? 👇
⚠️ Not financial advice. Always manage your risk. 🛡️
🏷️ #FIL #LongSetup #Crypto #Breakout
🔥 💎
🚨 $FIL IS COILED TIGHT NEAR SUPPORT READY FOR A MULTI-TARGET RECOVERY BREAKOUT! ⚡
Entry: 0.7500-0.7530 ⚡
Target: 0.7800 🚀
Stop Loss: 0.7440 ⚠️
After a prolonged bleed, price action is consolidating right near 0.7520 as patient buyers quietly absorb the floating supply. 📊 Volume profiles show accumulation tightening up, setting the stage for a sharp reclamation of higher resistance levels once momentum flips. ⚡
Holding the local floor is critical to maintain this bullish structure while sellers run out of ammunition. 💡 Are you scaling in here during the consolidation or waiting for a confirmed breakout candle above 0.7550? 👇
⚠️ Not financial advice. Always manage your risk. 🛡️
🏷️ #FIL #LongSetup #Crypto #Breakout
🔥 💎
Entry: 0.7500-0.7530 ⚡
Target: 0.7800 🚀
Stop Loss: 0.7440 ⚠️
After a prolonged bleed, price action is consolidating right near 0.7520 as patient buyers quietly absorb the floating supply. 📊 Volume profiles show accumulation tightening up, setting the stage for a sharp reclamation of higher resistance levels once momentum flips. ⚡
Holding the local floor is critical to maintain this bullish structure while sellers run out of ammunition. 💡 Are you scaling in here during the consolidation or waiting for a confirmed breakout candle above 0.7550? 👇
⚠️ Not financial advice. Always manage your risk. 🛡️
🏷️ #FIL #LongSetup #Crypto #Breakout
🔥 💎
27

·
--
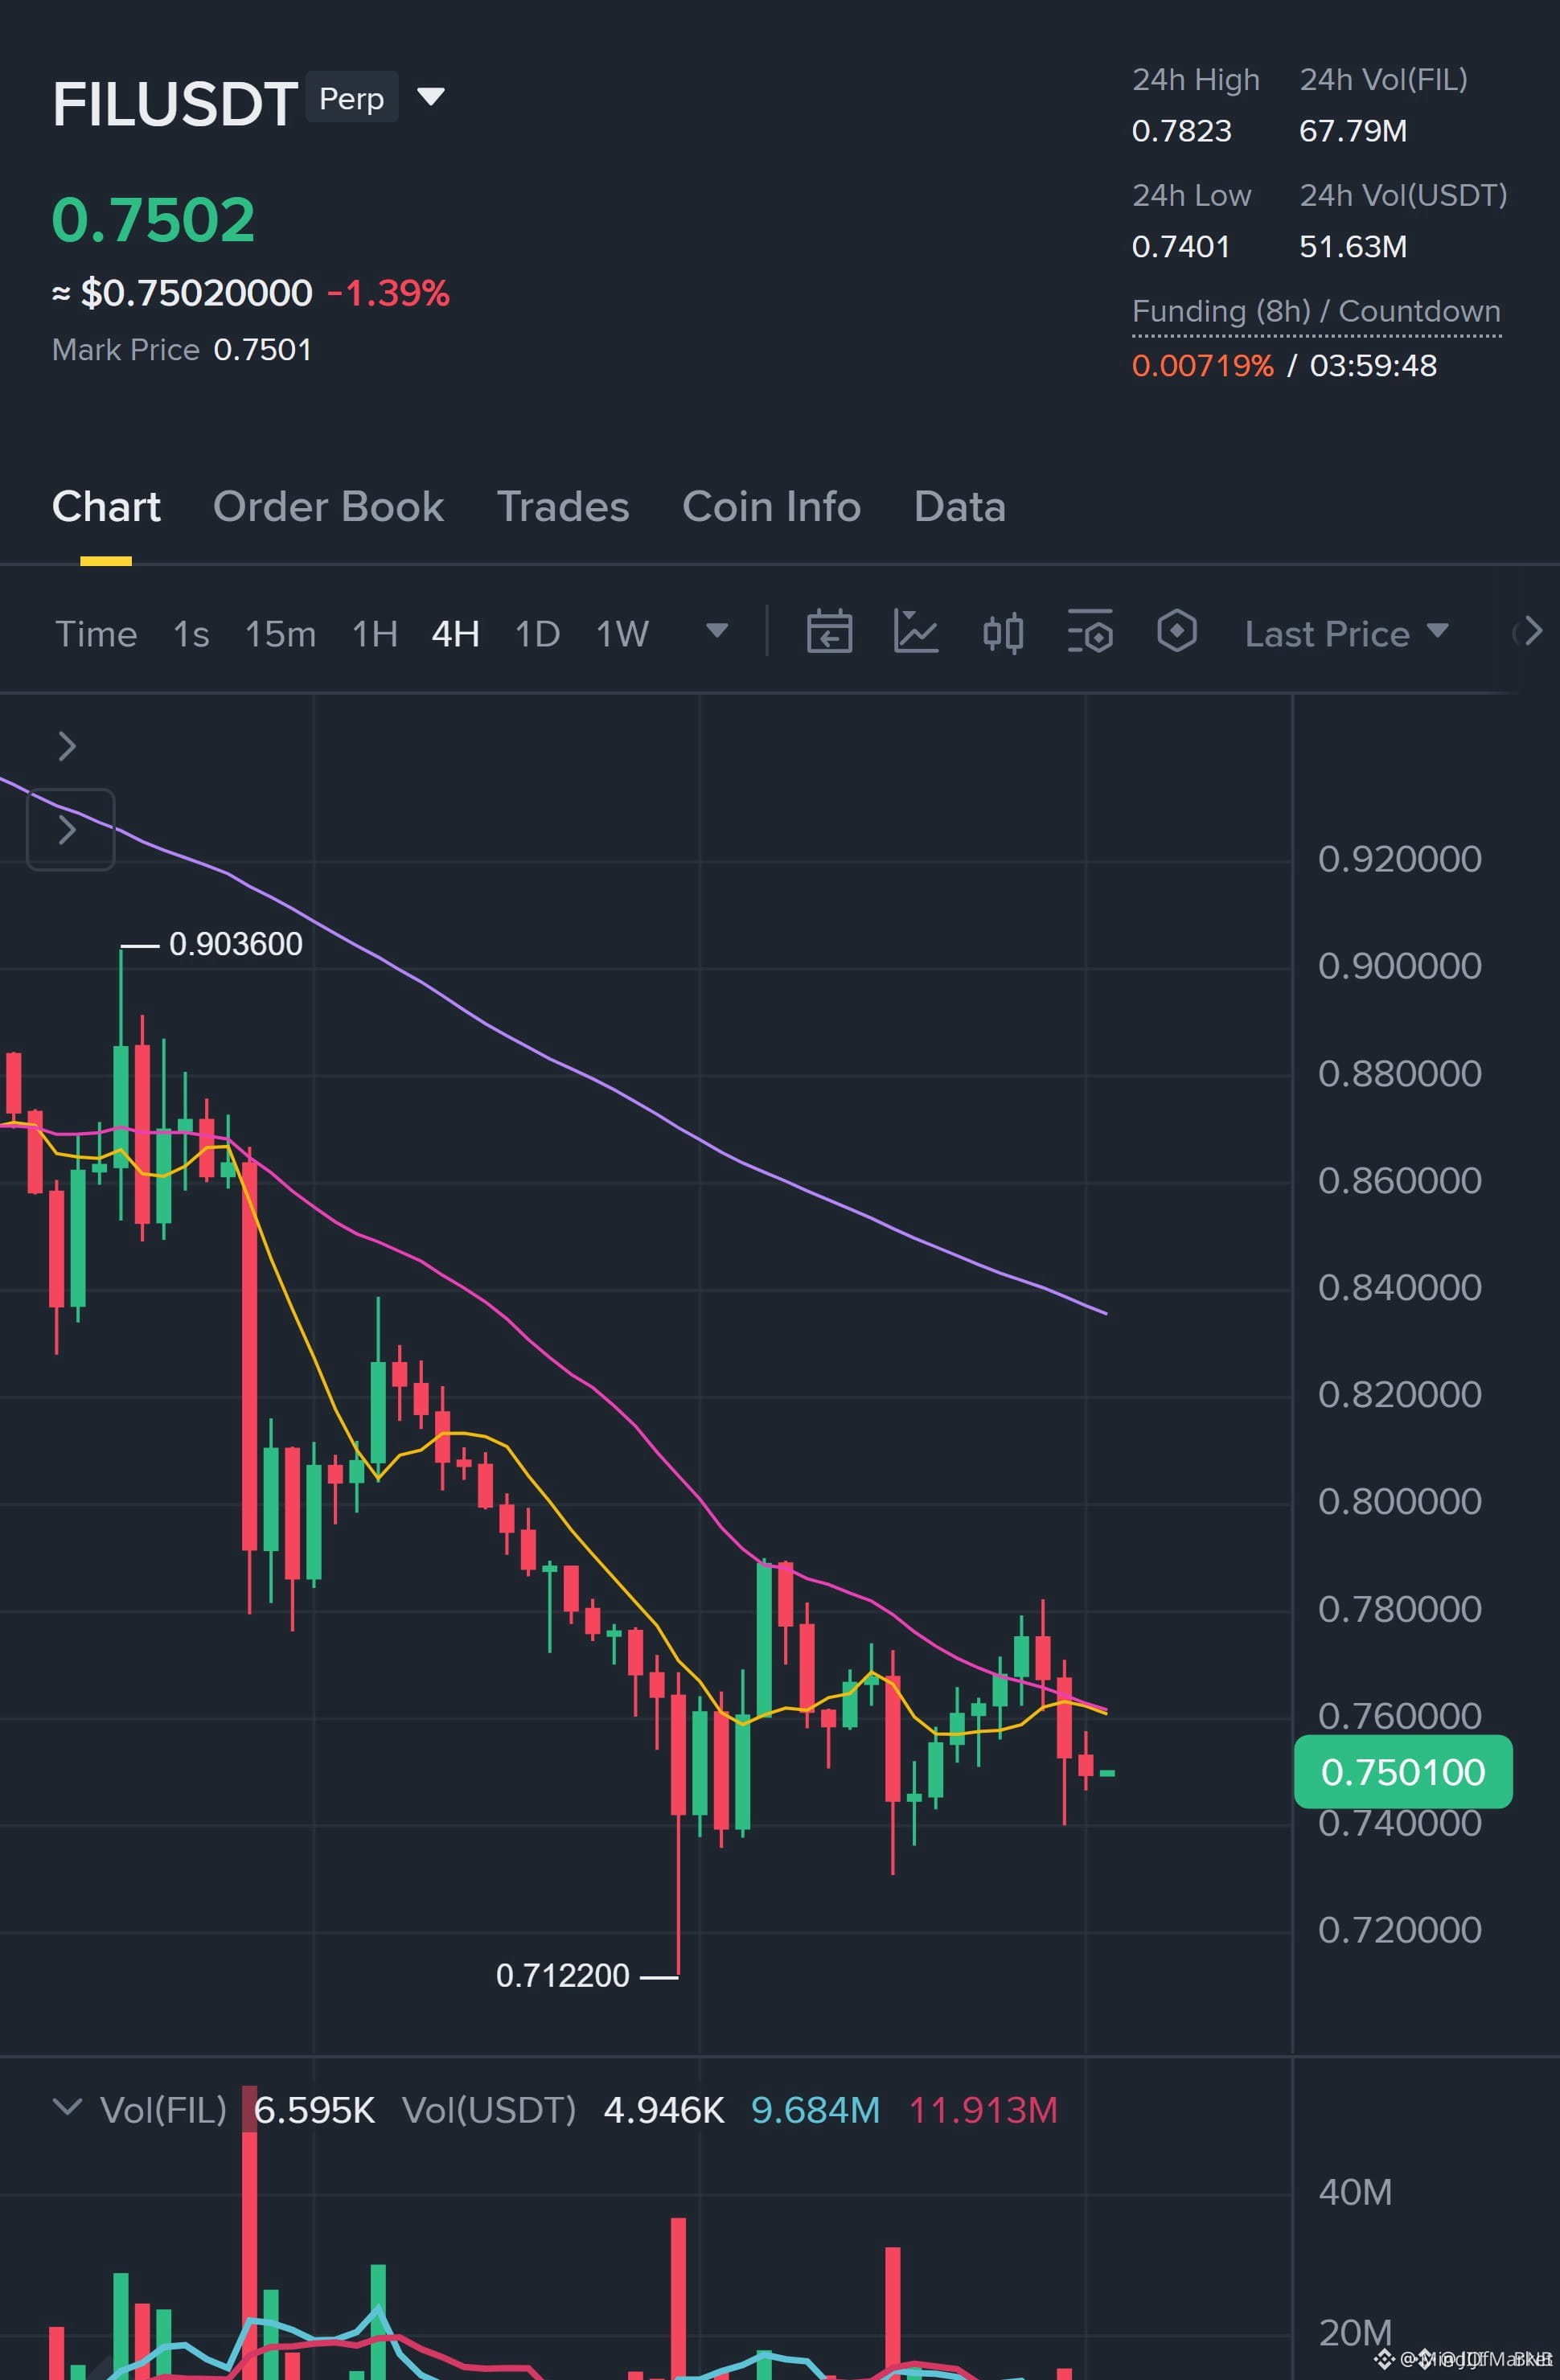
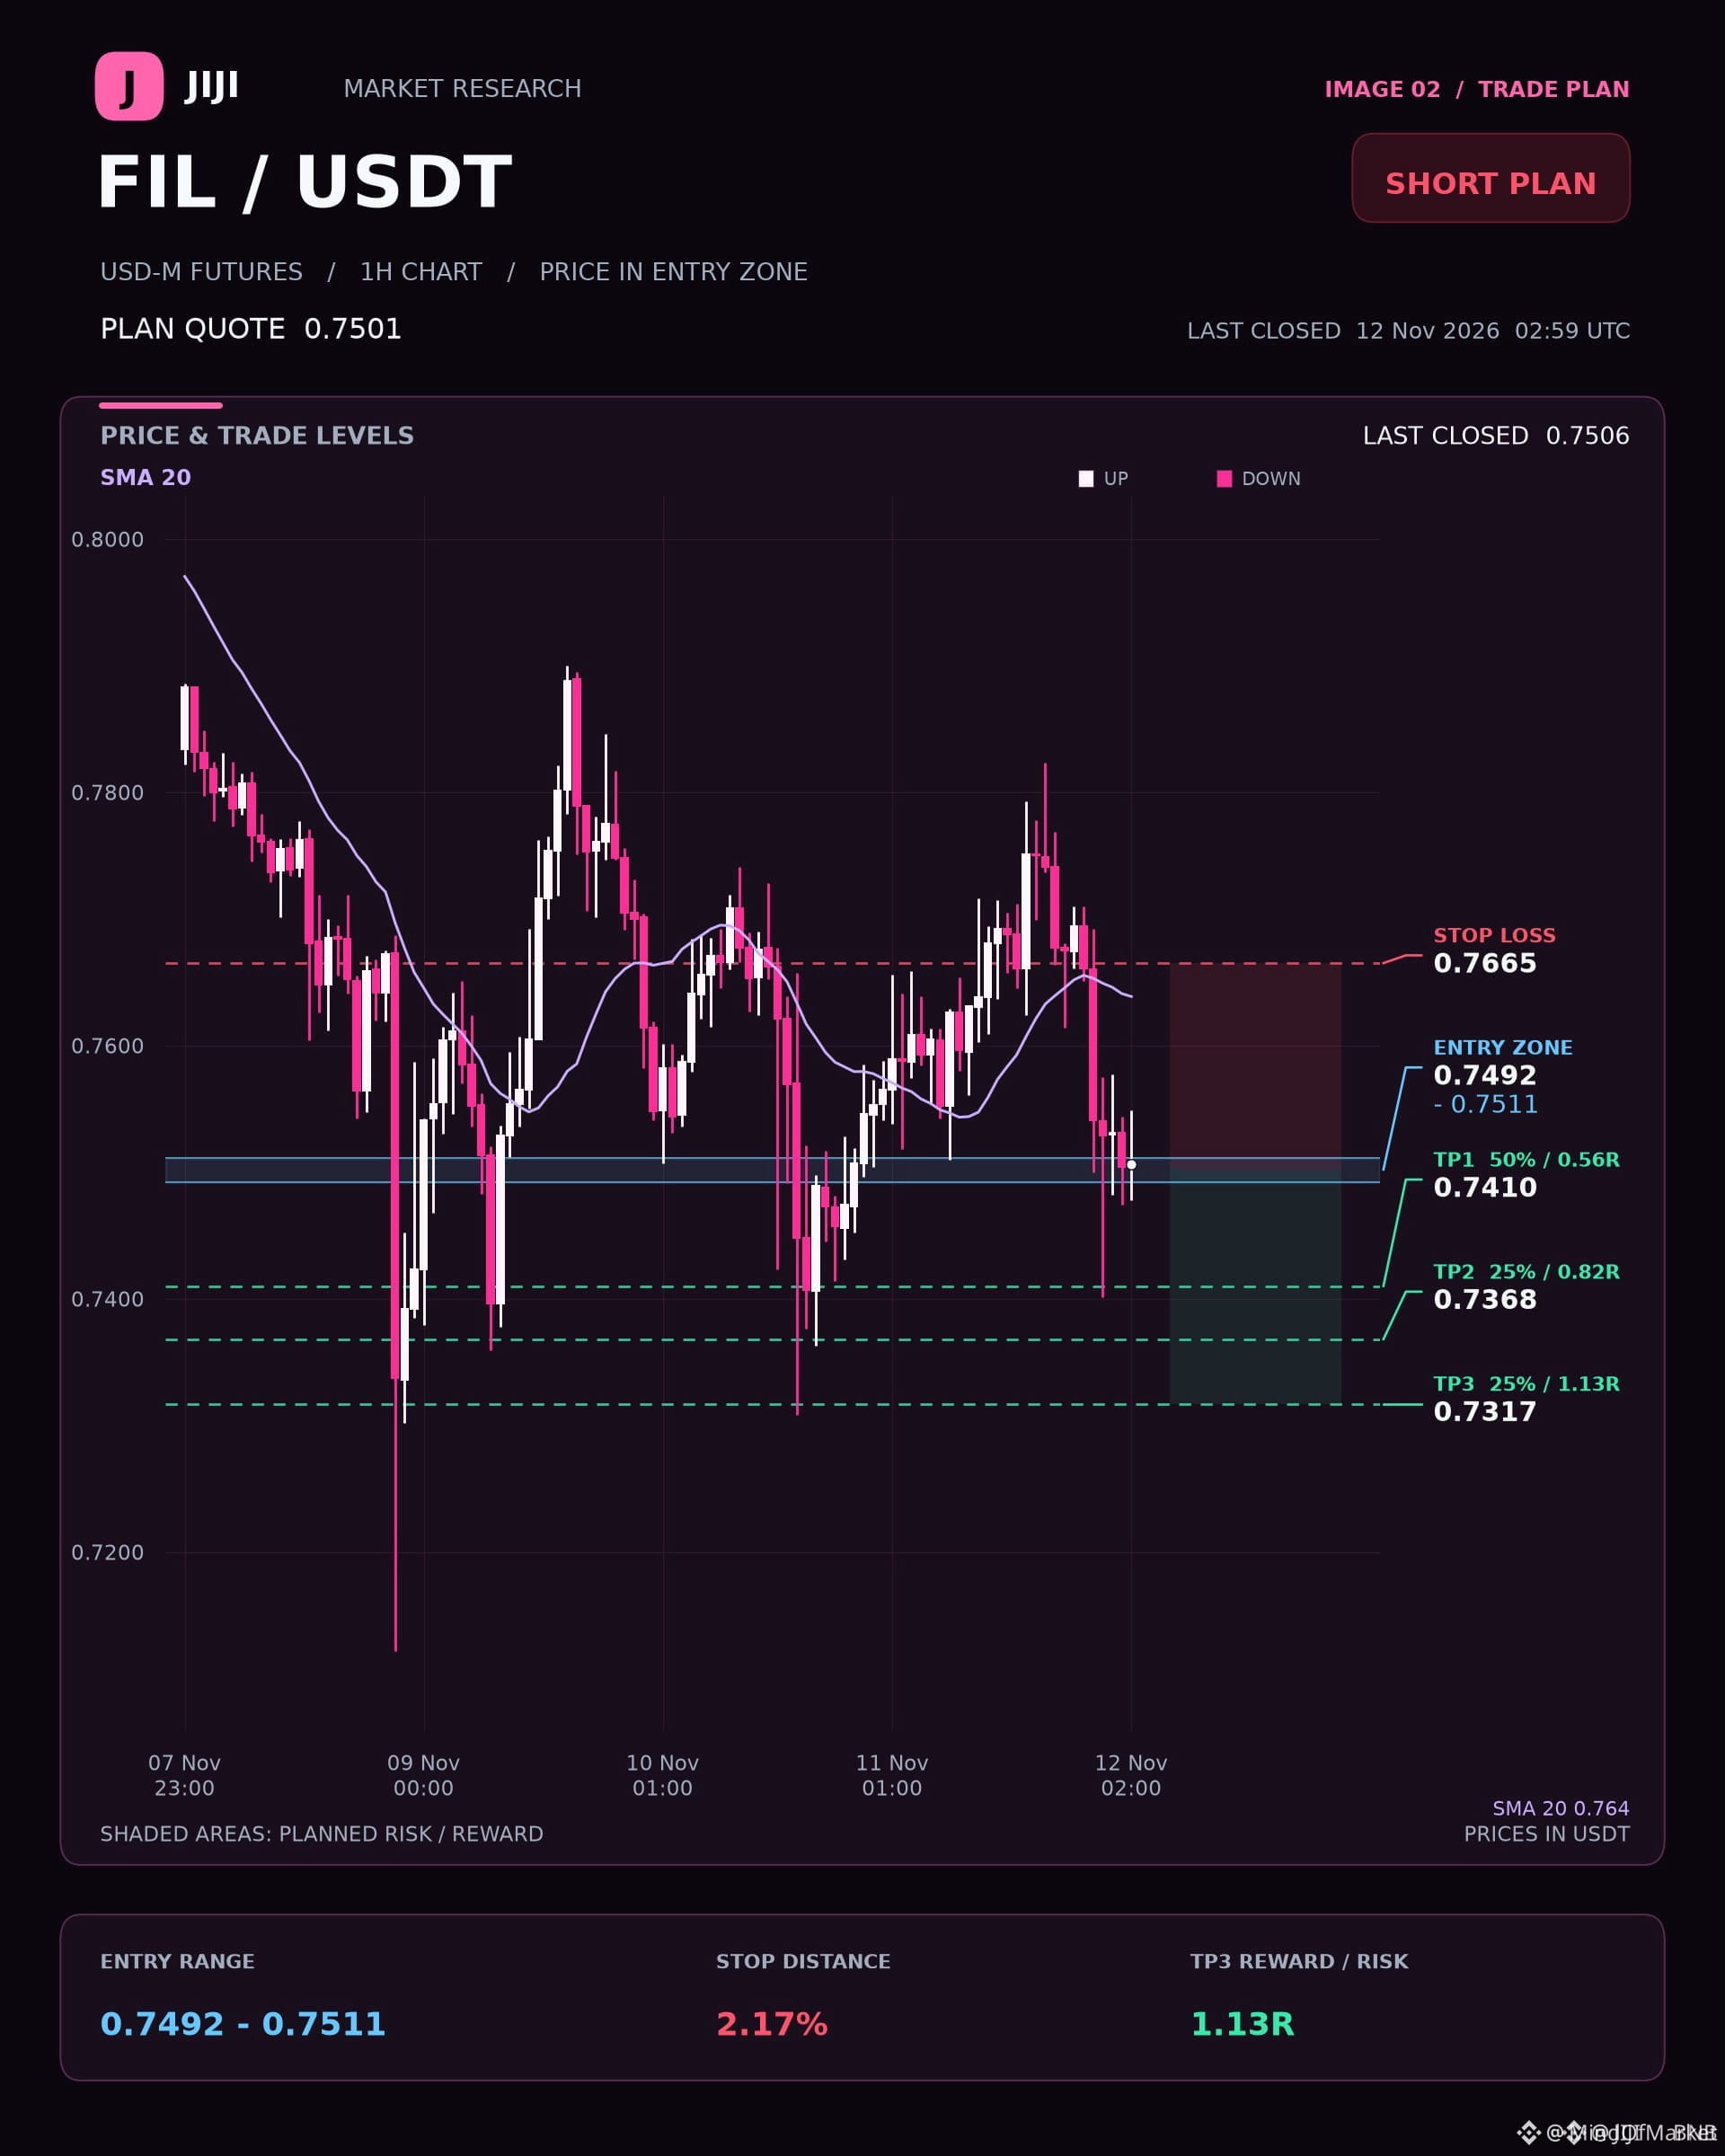
📉 $FIL REJECTING OFF THE PREMIUM ZONE AS 4H EMA BEARISH STRUCTURE HOLDS FIRM 🔻
Entry: 0.7492 – 0.7511 ⚡
Target: 0.7317 🚀
Stop Loss: 0.7665 ⚠️
Institutional order flow on $FIL continues to respect the higher timeframe distribution band, with the 4h EMA matrix firmly printing a bearish continuation bias. 📊 Price has tapped our designated premium zone, where institutional sellers are actively absorbing liquidity. ⚡
We are monitoring the 15m candle close for confirmation before targeting the lower structural liquidity pools near support. 🔍 💬 Are you positioned for this distribution leg down or staying sidelined? 👇
⚠️ Not financial advice. Always manage your risk. 🛡️
🏷️ #FIL #ShortSetup #Crypto #OrderFlow
📉 🦈
📉 $FIL REJECTING OFF THE PREMIUM ZONE AS 4H EMA BEARISH STRUCTURE HOLDS FIRM 🔻
Entry: 0.7492 – 0.7511 ⚡
Target: 0.7317 🚀
Stop Loss: 0.7665 ⚠️
Institutional order flow on $FIL continues to respect the higher timeframe distribution band, with the 4h EMA matrix firmly printing a bearish continuation bias. 📊 Price has tapped our designated premium zone, where institutional sellers are actively absorbing liquidity. ⚡
We are monitoring the 15m candle close for confirmation before targeting the lower structural liquidity pools near support. 🔍 💬 Are you positioned for this distribution leg down or staying sidelined? 👇
⚠️ Not financial advice. Always manage your risk. 🛡️
🏷️ #FIL #ShortSetup #Crypto #OrderFlow
📉 🦈
Entry: 0.7492 – 0.7511 ⚡
Target: 0.7317 🚀
Stop Loss: 0.7665 ⚠️
Institutional order flow on $FIL continues to respect the higher timeframe distribution band, with the 4h EMA matrix firmly printing a bearish continuation bias. 📊 Price has tapped our designated premium zone, where institutional sellers are actively absorbing liquidity. ⚡
We are monitoring the 15m candle close for confirmation before targeting the lower structural liquidity pools near support. 🔍 💬 Are you positioned for this distribution leg down or staying sidelined? 👇
⚠️ Not financial advice. Always manage your risk. 🛡️
🏷️ #FIL #ShortSetup #Crypto #OrderFlow
📉 🦈
21
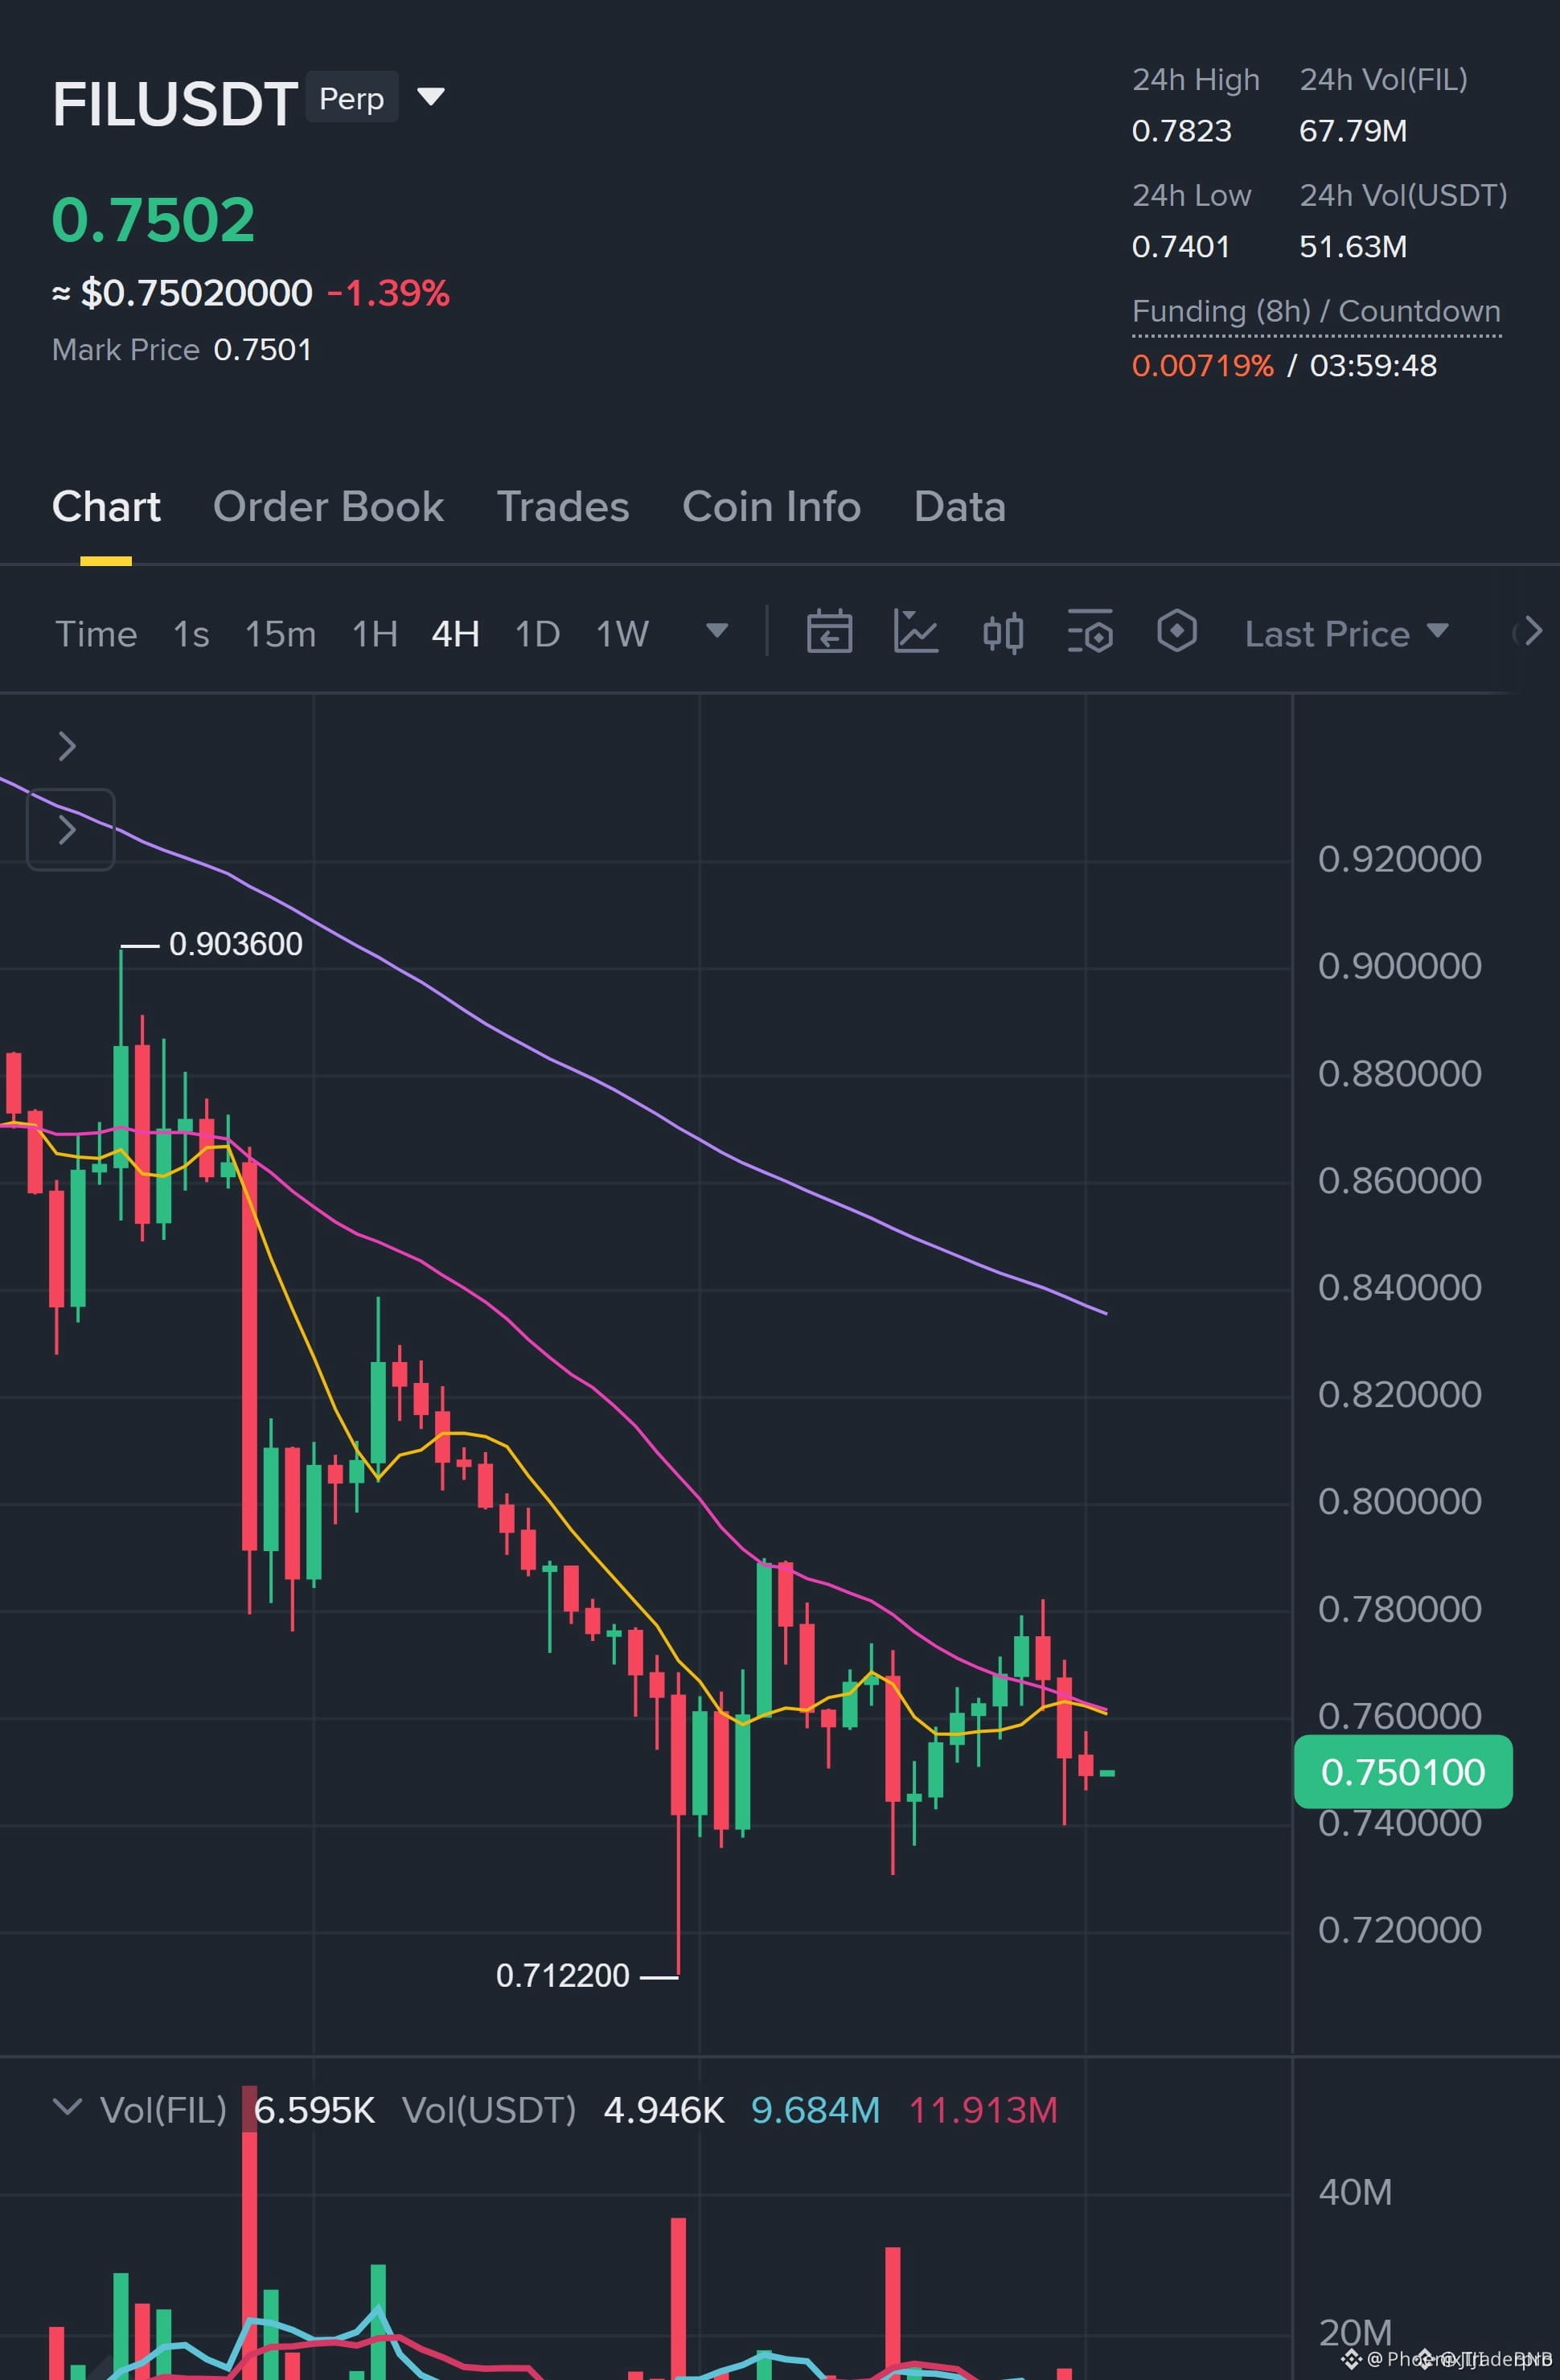
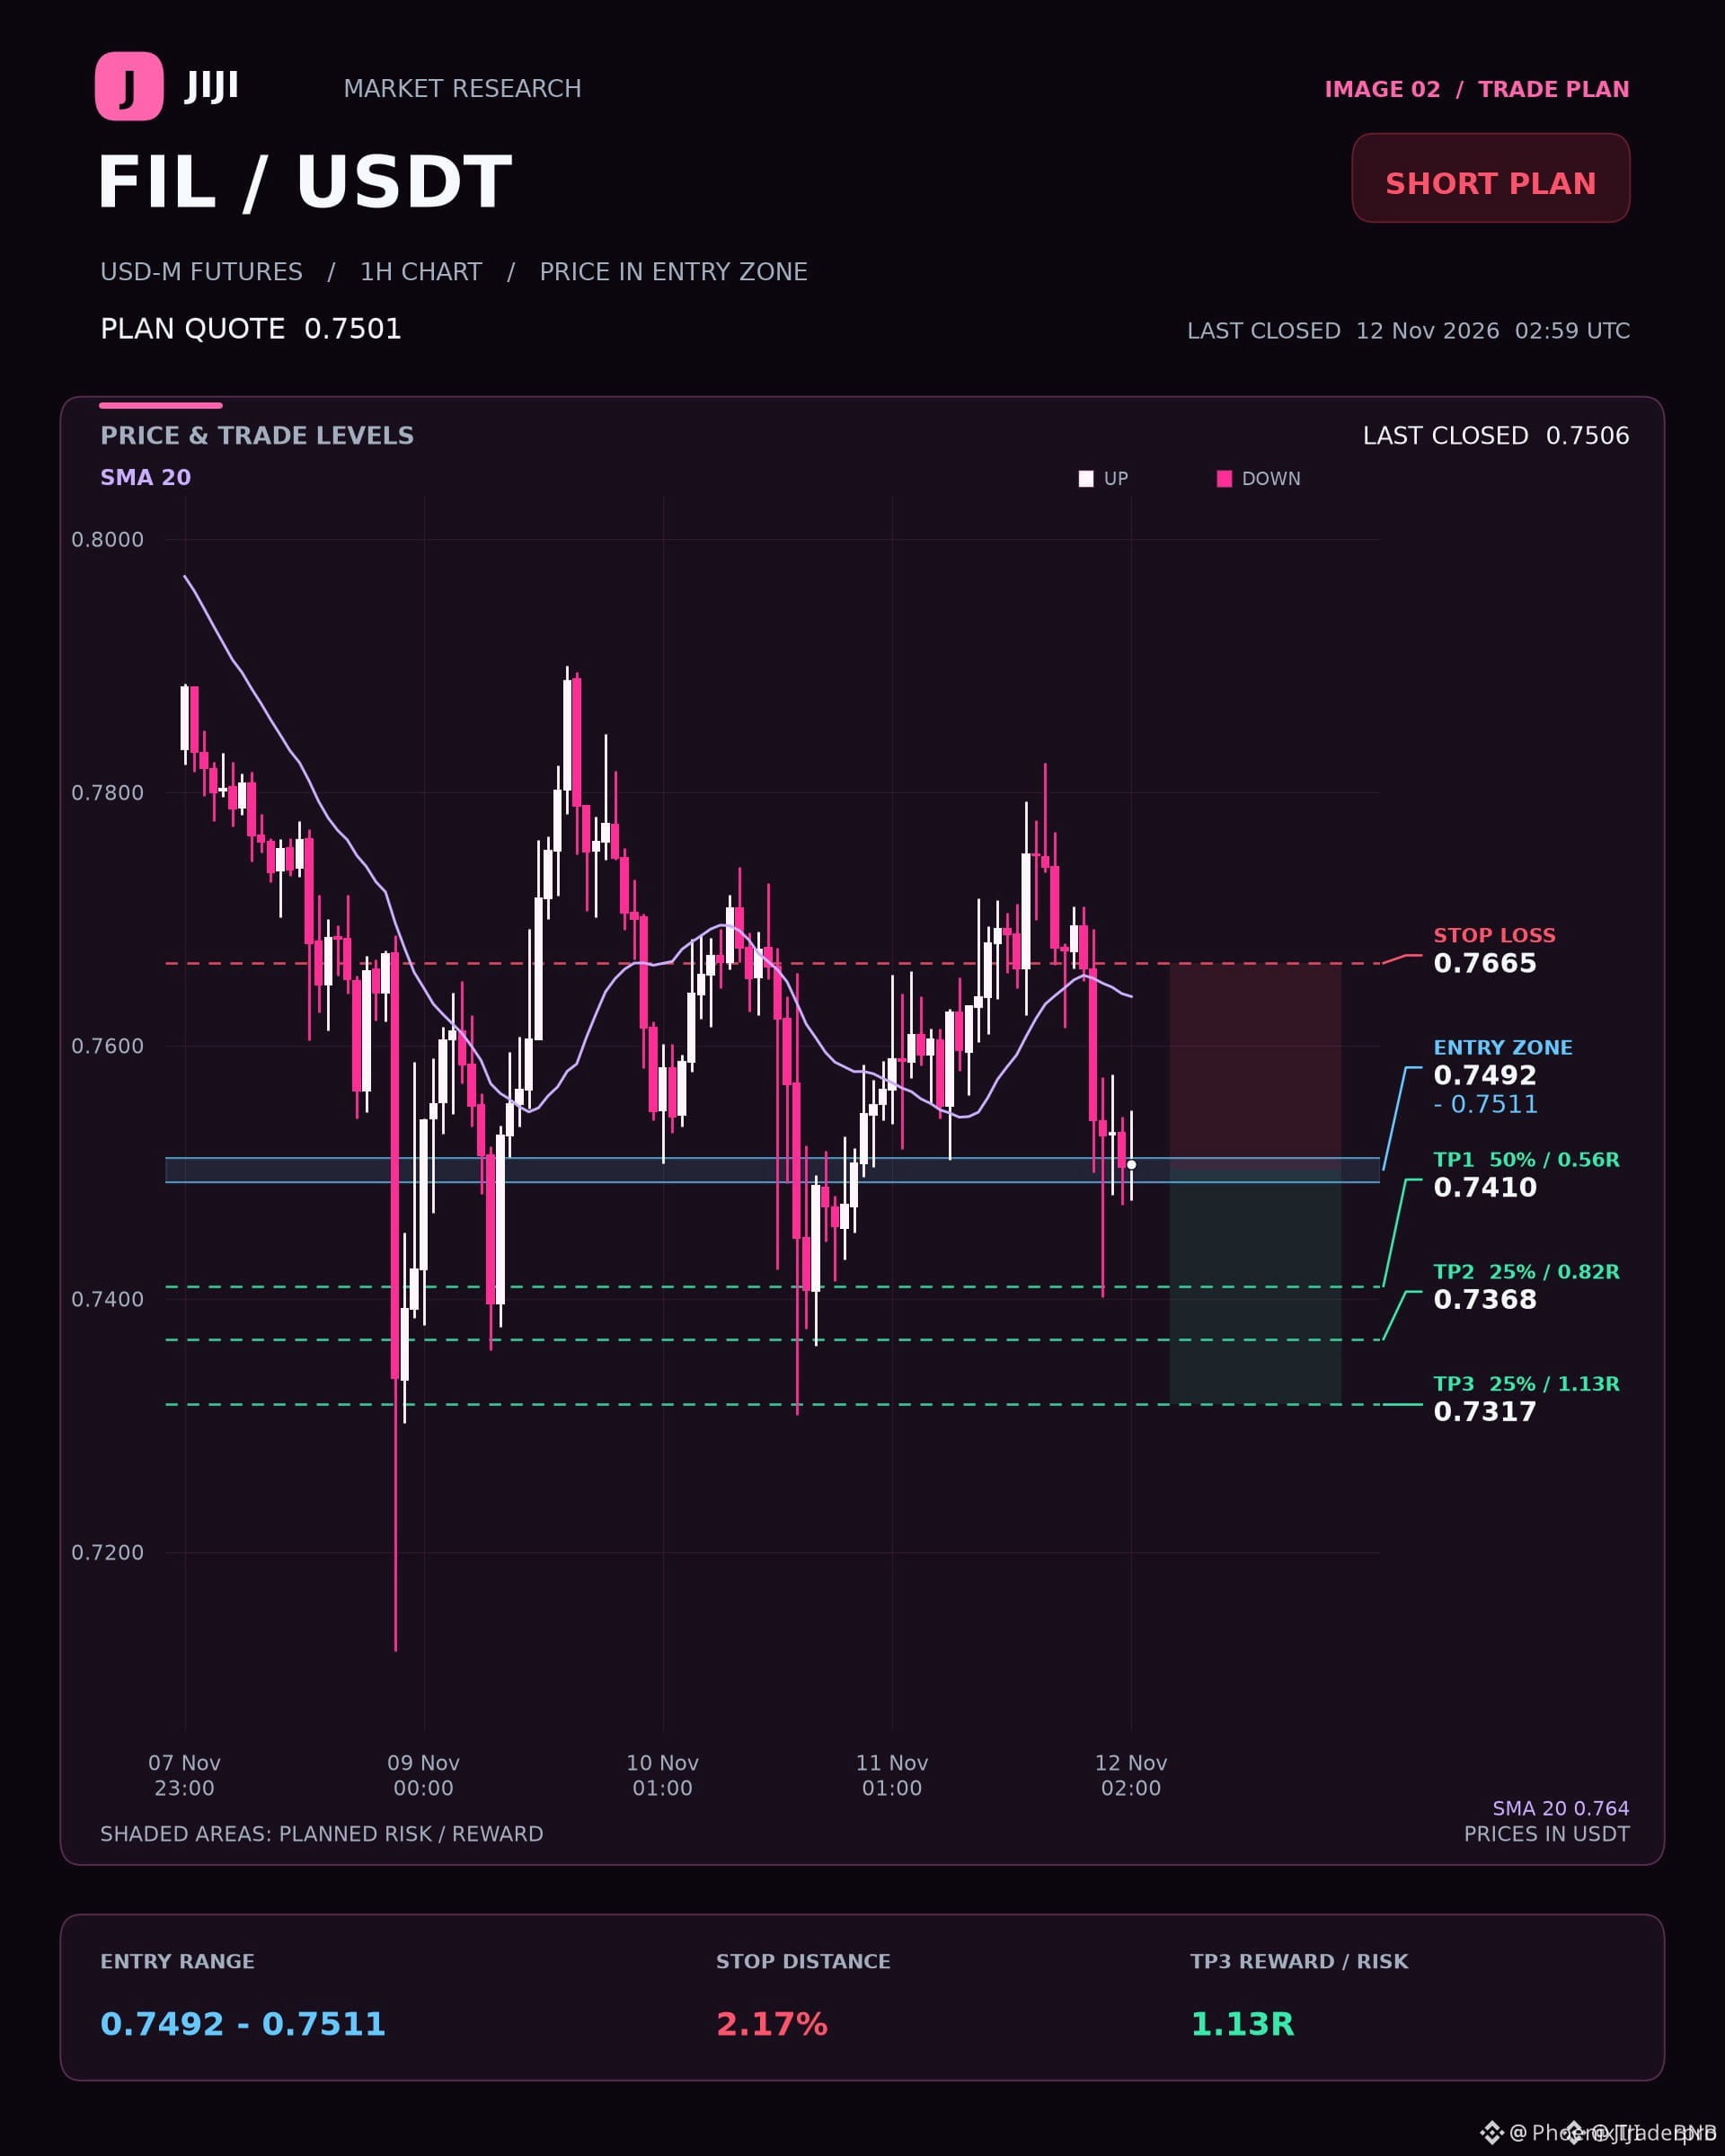
🔴 $FIL SELLERS STEP IN AS THE FOUR HOUR STRUCTURE RAPIDLY ROLLS OVER 📉
Entry: 0.7492 – 0.7511 ⚡
Target: 0.7317 🚀
Stop Loss: 0.7665 ⚠️
Sellers are aggressively defending resistance zones while the broader four-hour trend structure tilts downward. Momentum is favoring downside continuation as price tests reaction levels, though that minor one-hour support needs to break to clear the path. 📊
Keep eyes locked on lower timeframe candle closures before pressing any triggers. Patience separates disciplined execution from chasing noise in a choppy book. ⚡
💬 Are you positioning for the breakdown below support or waiting for a deeper sweep? 👇
⚠️ Not financial advice. Always manage your risk. 🛡️
🏷️ #FIL #ShortSetup #CryptoFutures #TradingStrategy
📉 🦈
🔴 $FIL SELLERS STEP IN AS THE FOUR HOUR STRUCTURE RAPIDLY ROLLS OVER 📉
Entry: 0.7492 – 0.7511 ⚡
Target: 0.7317 🚀
Stop Loss: 0.7665 ⚠️
Sellers are aggressively defending resistance zones while the broader four-hour trend structure tilts downward. Momentum is favoring downside continuation as price tests reaction levels, though that minor one-hour support needs to break to clear the path. 📊
Keep eyes locked on lower timeframe candle closures before pressing any triggers. Patience separates disciplined execution from chasing noise in a choppy book. ⚡
💬 Are you positioning for the breakdown below support or waiting for a deeper sweep? 👇
⚠️ Not financial advice. Always manage your risk. 🛡️
🏷️ #FIL #ShortSetup #CryptoFutures #TradingStrategy
📉 🦈
Entry: 0.7492 – 0.7511 ⚡
Target: 0.7317 🚀
Stop Loss: 0.7665 ⚠️
Sellers are aggressively defending resistance zones while the broader four-hour trend structure tilts downward. Momentum is favoring downside continuation as price tests reaction levels, though that minor one-hour support needs to break to clear the path. 📊
Keep eyes locked on lower timeframe candle closures before pressing any triggers. Patience separates disciplined execution from chasing noise in a choppy book. ⚡
💬 Are you positioning for the breakdown below support or waiting for a deeper sweep? 👇
⚠️ Not financial advice. Always manage your risk. 🛡️
🏷️ #FIL #ShortSetup #CryptoFutures #TradingStrategy
📉 🦈
23

·
--
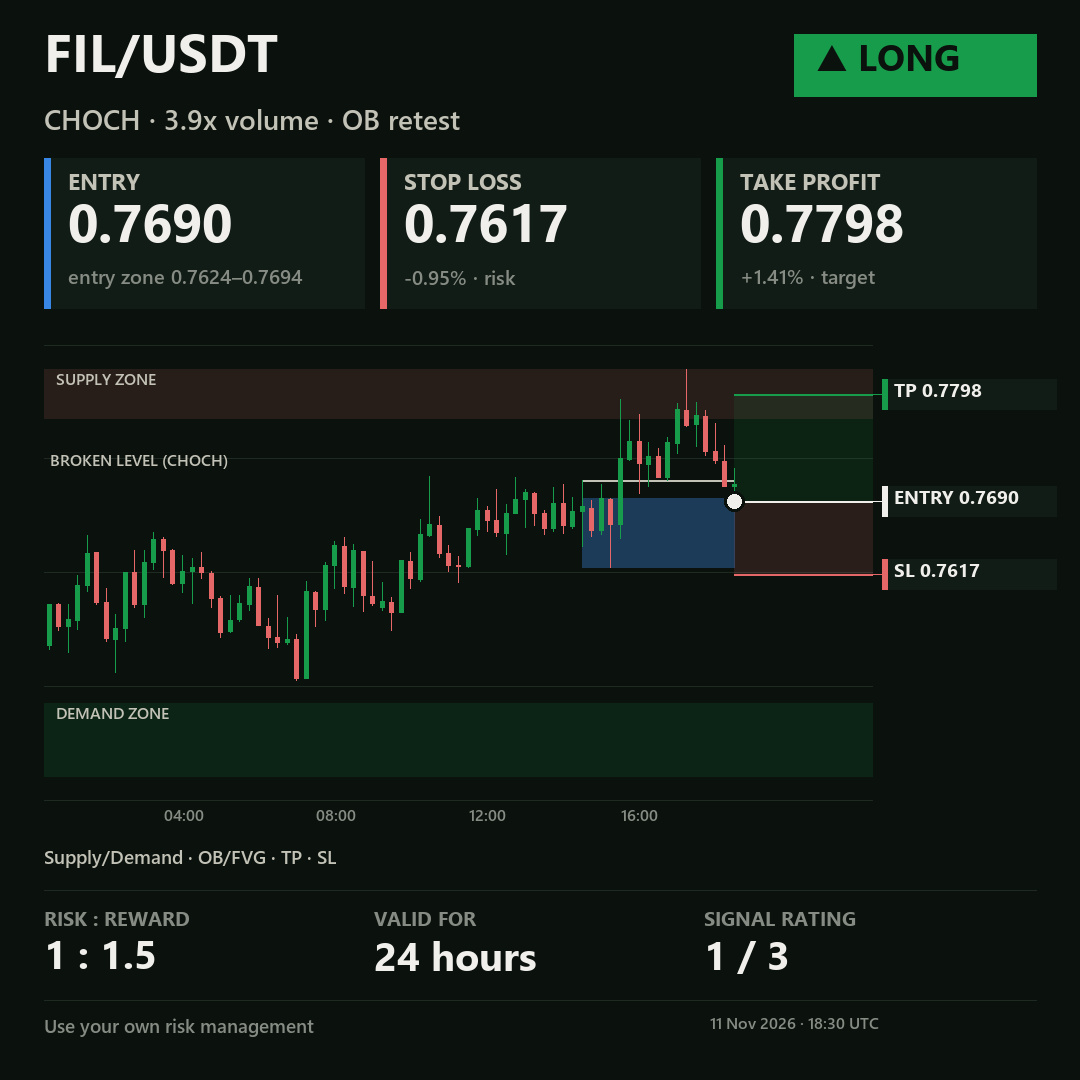
🟢 LONG $FIL (FILUSDT)
ENTRY: 0.7690 · SL: 0.7617 · TP: 0.7798 · R/R: 1:1.5
Change of character with 3.9x volume → retest of the order block · valid 24 hours
11/11/2026 🗓️ 18:45 UTC 🌐
#FIL #TechnicalAnalysis
🟢 LONG $FIL (FILUSDT)
ENTRY: 0.7690 · SL: 0.7617 · TP: 0.7798 · R/R: 1:1.5
Change of character with 3.9x volume → retest of the order block · valid 24 hours
11/11/2026 🗓️ 18:45 UTC 🌐
#FIL #TechnicalAnalysis
ENTRY: 0.7690 · SL: 0.7617 · TP: 0.7798 · R/R: 1:1.5
Change of character with 3.9x volume → retest of the order block · valid 24 hours
11/11/2026 🗓️ 18:45 UTC 🌐
#FIL #TechnicalAnalysis
385

·
--
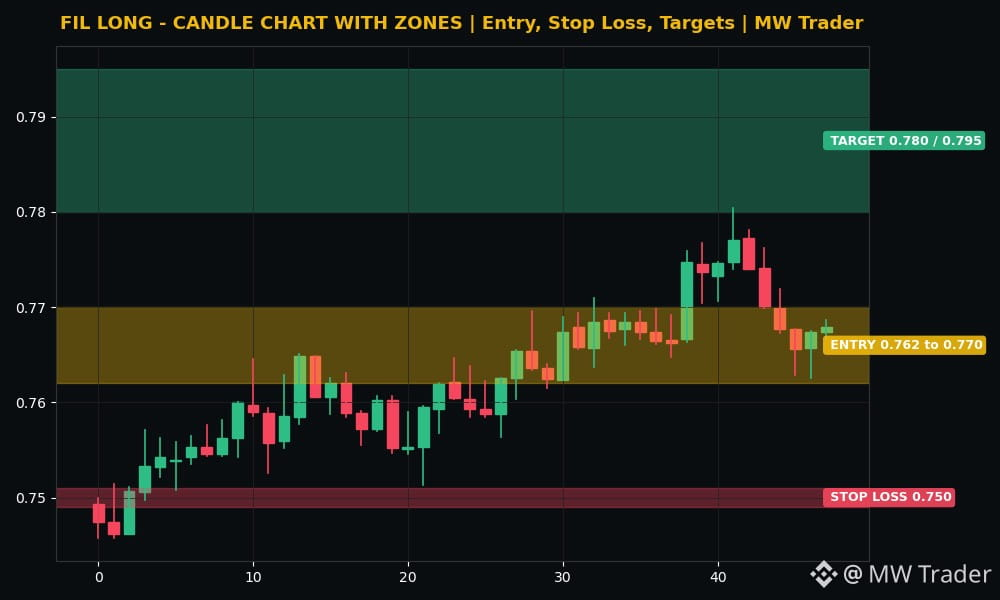
$FIL #FIL 🚀
Direction: LONG
Entry zone: 0.762 to 0.770
Stop loss: 0.750
Target 1: 0.780
Target 2: 0.795
Filecoin is trading near 0.768 dollars, up 2.79 percent in 24 hours, the strongest bounce among the coins I checked tonight, inside a range of 0.7458 to 0.7804 dollars, and the recent closes show buyers holding near the high, 0.7700, then 0.7677, then 0.7657, then 0.7674, then 0.7679. 🟢 My reading is that FIL is leading the bounce with real strength, because a near 3 percent day while the market is still down 10.43 percent over 7 days tells you buyers are stepping in first here, even though the bigger trend is still down. A long from the current zone, with a stop below 0.750, targets 0.780 first and then 0.795 if buyers break the range high. A drop below the stop kills the idea without debate.
Futures trading is risky. Trade small, use a stop loss, and do your own research. This is my reading, not a guaranteed signal.
Does FIL break 0.780 tonight, or lose 0.750 first? 🤔
Follow for more trades.
#Filecoin #Crypto #FuturesTrading #TradingSignals
$FIL #FIL 🚀
Direction: LONG
Entry zone: 0.762 to 0.770
Stop loss: 0.750
Target 1: 0.780
Target 2: 0.795
Filecoin is trading near 0.768 dollars, up 2.79 percent in 24 hours, the strongest bounce among the coins I checked tonight, inside a range of 0.7458 to 0.7804 dollars, and the recent closes show buyers holding near the high, 0.7700, then 0.7677, then 0.7657, then 0.7674, then 0.7679. 🟢 My reading is that FIL is leading the bounce with real strength, because a near 3 percent day while the market is still down 10.43 percent over 7 days tells you buyers are stepping in first here, even though the bigger trend is still down. A long from the current zone, with a stop below 0.750, targets 0.780 first and then 0.795 if buyers break the range high. A drop below the stop kills the idea without debate.
Futures trading is risky. Trade small, use a stop loss, and do your own research. This is my reading, not a guaranteed signal.
Does FIL break 0.780 tonight, or lose 0.750 first? 🤔
Follow for more trades.
#Filecoin #Crypto #FuturesTrading #TradingSignals
Direction: LONG
Entry zone: 0.762 to 0.770
Stop loss: 0.750
Target 1: 0.780
Target 2: 0.795
Filecoin is trading near 0.768 dollars, up 2.79 percent in 24 hours, the strongest bounce among the coins I checked tonight, inside a range of 0.7458 to 0.7804 dollars, and the recent closes show buyers holding near the high, 0.7700, then 0.7677, then 0.7657, then 0.7674, then 0.7679. 🟢 My reading is that FIL is leading the bounce with real strength, because a near 3 percent day while the market is still down 10.43 percent over 7 days tells you buyers are stepping in first here, even though the bigger trend is still down. A long from the current zone, with a stop below 0.750, targets 0.780 first and then 0.795 if buyers break the range high. A drop below the stop kills the idea without debate.
Futures trading is risky. Trade small, use a stop loss, and do your own research. This is my reading, not a guaranteed signal.
Does FIL break 0.780 tonight, or lose 0.750 first? 🤔
Follow for more trades.
#Filecoin #Crypto #FuturesTrading #TradingSignals
13

·
--
Traders are watching whether $FIL can turn this retest into continuation.
$FIL – Price is holding above support, and upside pressure is still active after the recent move.
Trading Plan LONG $FIL (max 10x)
🎯 Entry: 0.7627 - 0.7688
🛑 SL: 0.7431
✅ TP1: 0.7765
✅ TP2: 0.7865
✅ TP3: 0.798
• Kimber Digital Securities gains broker-dealer status for tokenized assets
Would you long the retest on $FIL, or wait for a reclaim first?
Trade $FIL here 👇
#FIL #Crypto #PriceAction
Traders are watching whether $FIL can turn this retest into continuation.
$FIL – Price is holding above support, and upside pressure is still active after the recent move.
Trading Plan LONG $FIL (max 10x)
🎯 Entry: 0.7627 - 0.7688
🛑 SL: 0.7431
✅ TP1: 0.7765
✅ TP2: 0.7865
✅ TP3: 0.798
• Kimber Digital Securities gains broker-dealer status for tokenized assets
Would you long the retest on $FIL , or wait for a reclaim first?
Trade $FIL here 👇
#FIL #Crypto #PriceAction
$FIL – Price is holding above support, and upside pressure is still active after the recent move.
Trading Plan LONG $FIL (max 10x)
🎯 Entry: 0.7627 - 0.7688
🛑 SL: 0.7431
✅ TP1: 0.7765
✅ TP2: 0.7865
✅ TP3: 0.798
• Kimber Digital Securities gains broker-dealer status for tokenized assets
Would you long the retest on $FIL , or wait for a reclaim first?
Trade $FIL here 👇
#FIL #Crypto #PriceAction
8

·
--
$FIL or $SOL for the next leg? Only one.
I’m taking $FIL. 📈
$0.7714, up 2.91% today and +3.4% in the last 4h, but the tape still isn’t clean: RSI sits at 48, volume is only 0.5x its 20d average, and price remains under both the 20d and 50d MAs.
Funding at 0.009% says longs are already paying. Careful.
At $0.80, I’d want to see real volume before chasing. FIL is 37% below its 30d high, so the upside case is obvious, but the breakout still needs proof. My side is FIL over SOL here. 🔥
#FIL #Trading #Binance
$FIL or $SOL for the next leg? Only one.
I’m taking $FIL . 📈
$0.7714, up 2.91% today and +3.4% in the last 4h, but the tape still isn’t clean: RSI sits at 48, volume is only 0.5x its 20d average, and price remains under both the 20d and 50d MAs.
Funding at 0.009% says longs are already paying. Careful.
At $0.80, I’d want to see real volume before chasing. FIL is 37% below its 30d high, so the upside case is obvious, but the breakout still needs proof. My side is FIL over SOL here. 🔥
#FIL #Trading #Binance
I’m taking $FIL . 📈
$0.7714, up 2.91% today and +3.4% in the last 4h, but the tape still isn’t clean: RSI sits at 48, volume is only 0.5x its 20d average, and price remains under both the 20d and 50d MAs.
Funding at 0.009% says longs are already paying. Careful.
At $0.80, I’d want to see real volume before chasing. FIL is 37% below its 30d high, so the upside case is obvious, but the breakout still needs proof. My side is FIL over SOL here. 🔥
#FIL #Trading #Binance
6

·
--
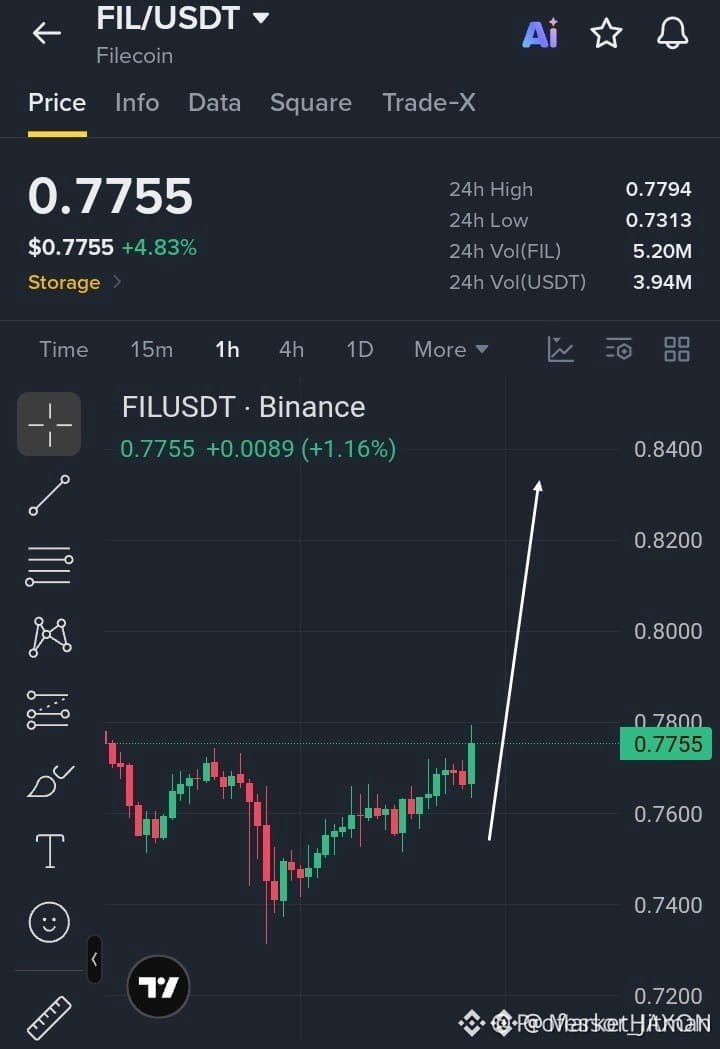
🚨 $FIL READY TO SHATTER RESISTANCE AS BUYERS ACCUMULATE NEAR SUPPORT! 💥
Entry: 0.7700–0.7780 ⚡
Target: 0.7900, 0.8100, 0.8300 🎯
Stop Loss: 0.7570 ⚠️
Price action on the hourly timeframe is quietly building a robust foundation with higher lows after defending the 0.7400 demand zone. Sellers are losing their grip as bullish momentum steadily compresses price toward the crucial 0.7800 threshold. 📊
A decisive breakout above that barrier will likely uncage aggressive buying pressure and spark a fast-paced run toward higher targets. ⚡
Are you positioning ahead of the breakout or waiting for confirmation above resistance? 🤔
⚠️ Not financial advice. Always manage your risk. 🛡️
🏷️ #FIL #LongSetup #Breakout #Crypto
🔥 💎
🚨 $FIL READY TO SHATTER RESISTANCE AS BUYERS ACCUMULATE NEAR SUPPORT! 💥
Entry: 0.7700–0.7780 ⚡
Target: 0.7900, 0.8100, 0.8300 🎯
Stop Loss: 0.7570 ⚠️
Price action on the hourly timeframe is quietly building a robust foundation with higher lows after defending the 0.7400 demand zone. Sellers are losing their grip as bullish momentum steadily compresses price toward the crucial 0.7800 threshold. 📊
A decisive breakout above that barrier will likely uncage aggressive buying pressure and spark a fast-paced run toward higher targets. ⚡
Are you positioning ahead of the breakout or waiting for confirmation above resistance? 🤔
⚠️ Not financial advice. Always manage your risk. 🛡️
🏷️ #FIL #LongSetup #Breakout #Crypto
🔥 💎
Entry: 0.7700–0.7780 ⚡
Target: 0.7900, 0.8100, 0.8300 🎯
Stop Loss: 0.7570 ⚠️
Price action on the hourly timeframe is quietly building a robust foundation with higher lows after defending the 0.7400 demand zone. Sellers are losing their grip as bullish momentum steadily compresses price toward the crucial 0.7800 threshold. 📊
A decisive breakout above that barrier will likely uncage aggressive buying pressure and spark a fast-paced run toward higher targets. ⚡
Are you positioning ahead of the breakout or waiting for confirmation above resistance? 🤔
⚠️ Not financial advice. Always manage your risk. 🛡️
🏷️ #FIL #LongSetup #Breakout #Crypto
🔥 💎
48

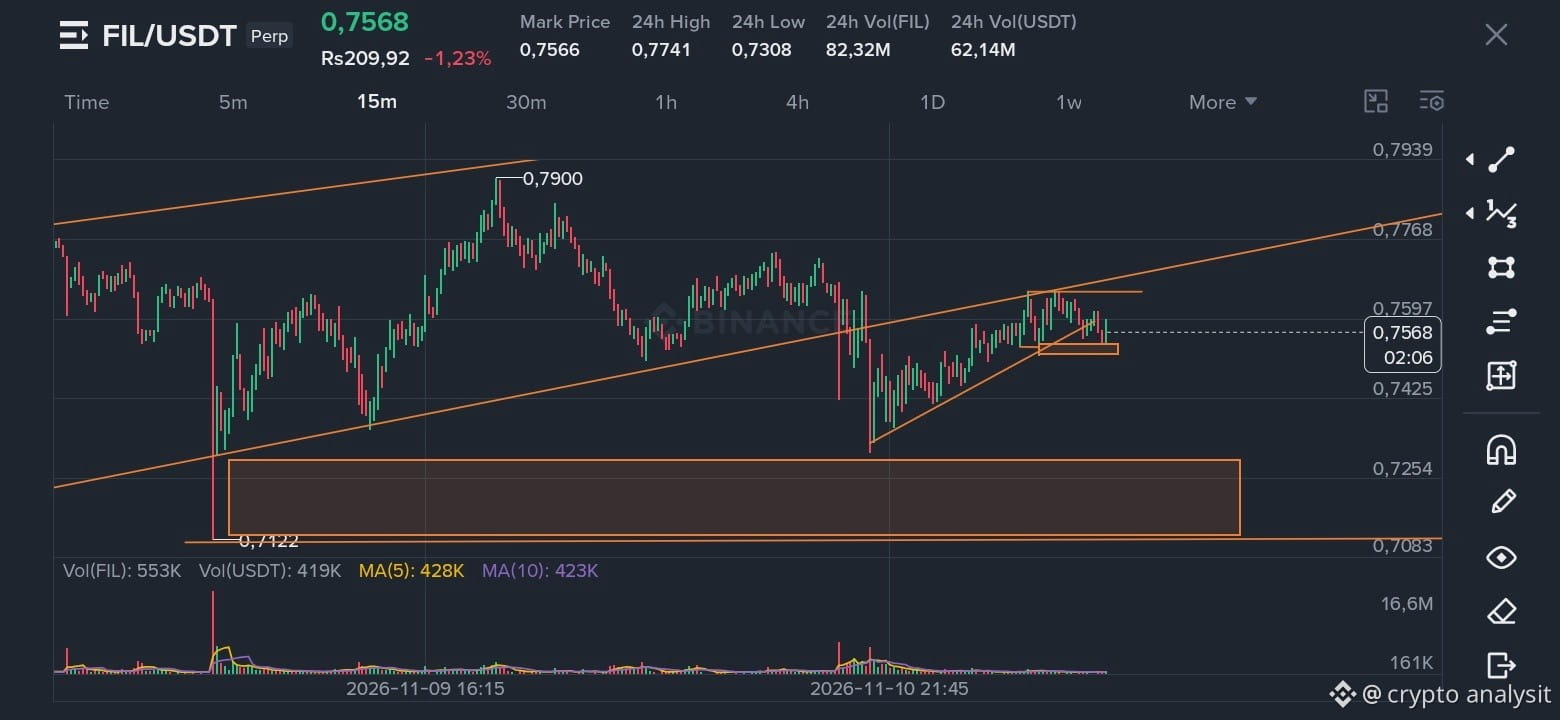
🚨 FIL/USDT Technical Analysis | 15M Chart
$FIL is currently trading around $0.7568, showing a short-term bullish recovery.
📊 Market Structure: FIL has formed higher lows along an ascending trendline. However, price is approaching an important resistance zone, where sellers are currently putting pressure on buyers.
🔴 Resistance Zones: • $0.7600 – $0.7630 • $0.7670 • $0.7740 • $0.7900
🟢 Support Zones: • $0.7500 – $0.7530 • $0.7425 • $0.7100 – $0.7270 (Major Demand Zone)
📈 Bullish Scenario: A strong 15M candle close above $0.7630 with increasing volume could open the way toward $0.7670, $0.7740 and potentially $0.7900.
📉 Bearish Scenario: If FIL fails to break resistance and loses $0.7500, we could see a move toward $0.7425 and potentially $0.7300.
🎯 My Strategy: I'm watching the $0.7600–$0.7630 resistance closely. I prefer waiting for a confirmed breakout and retest rather than entering blindly.
⚠️ Conclusion: FIL is at a critical decision point. A breakout could strengthen bullish momentum, while a rejection may trigger another correction.
What do you think? BULLISH 🟢 or BEARISH 🔴?
#FIL #FILUSDT #CryptoAnalysis #BinanceSquareFamily #CryptoTrading.
{future}(FILUSDT)
🚨 FIL/USDT Technical Analysis | 15M Chart
$FIL is currently trading around $0.7568, showing a short-term bullish recovery.
📊 Market Structure: FIL has formed higher lows along an ascending trendline. However, price is approaching an important resistance zone, where sellers are currently putting pressure on buyers.
🔴 Resistance Zones: • $0.7600 – $0.7630 • $0.7670 • $0.7740 • $0.7900
🟢 Support Zones: • $0.7500 – $0.7530 • $0.7425 • $0.7100 – $0.7270 (Major Demand Zone)
📈 Bullish Scenario: A strong 15M candle close above $0.7630 with increasing volume could open the way toward $0.7670, $0.7740 and potentially $0.7900.
📉 Bearish Scenario: If FIL fails to break resistance and loses $0.7500, we could see a move toward $0.7425 and potentially $0.7300.
🎯 My Strategy: I'm watching the $0.7600–$0.7630 resistance closely. I prefer waiting for a confirmed breakout and retest rather than entering blindly.
⚠️ Conclusion: FIL is at a critical decision point. A breakout could strengthen bullish momentum, while a rejection may trigger another correction.
What do you think? BULLISH 🟢 or BEARISH 🔴?
#FIL #FILUSDT #CryptoAnalysis #BinanceSquareFamily #CryptoTrading.
$FIL is currently trading around $0.7568, showing a short-term bullish recovery.
📊 Market Structure: FIL has formed higher lows along an ascending trendline. However, price is approaching an important resistance zone, where sellers are currently putting pressure on buyers.
🔴 Resistance Zones: • $0.7600 – $0.7630 • $0.7670 • $0.7740 • $0.7900
🟢 Support Zones: • $0.7500 – $0.7530 • $0.7425 • $0.7100 – $0.7270 (Major Demand Zone)
📈 Bullish Scenario: A strong 15M candle close above $0.7630 with increasing volume could open the way toward $0.7670, $0.7740 and potentially $0.7900.
📉 Bearish Scenario: If FIL fails to break resistance and loses $0.7500, we could see a move toward $0.7425 and potentially $0.7300.
🎯 My Strategy: I'm watching the $0.7600–$0.7630 resistance closely. I prefer waiting for a confirmed breakout and retest rather than entering blindly.
⚠️ Conclusion: FIL is at a critical decision point. A breakout could strengthen bullish momentum, while a rejection may trigger another correction.
What do you think? BULLISH 🟢 or BEARISH 🔴?
#FIL #FILUSDT #CryptoAnalysis #BinanceSquareFamily #CryptoTrading.
6
689
Log in to explore more content
Join global crypto users on Binance Square
⚡️ Get latest and useful information about crypto.
💬 Trusted by the world’s largest crypto exchange.
👍 Discover real insights from verified creators.
Email / Phone number
Trending Topics
1
#HuangExitNvidiaStrategyInFocus
20,356 views
501 Discussing
2
#AnthropicRejectsIPODelayValuationinQuestion
586,796 views
4,869 Discussing
3
#BitMineReports$6.3BNetLossForFiscal2026
2,955 views
77 Discussing
4
#ChipStocksExtendLossesAfterNvidiaCEOChange
7,421 views
246 Discussing
5
#ThailandProposes$148KDailyStablecoinDepositWithdrawalCaps
534 views
15 Discussing
6
#CoreWeaveJumps10%On168%RevenueGrowth
129,121 views
1,493 Discussing
7
#ZcashFallsBelow$1000ForFirstTimeSinceSeptember
66,630 views
252 Discussing
8
#MSCIRemovalMayCurbStrategy’sBitcoinBuying
28,846 views
474 Discussing
9
#TradFiForBeginners
502,156 views
3,515 Discussing
10
#USJoblessClaimsRise
19.1M views
7,651 Discussing