

#faisalhasnain
faisalhasnain
119 views
9 Discussing
Hot
Latest

📈 What is Demand Zone? The Area Where Buyers Take Control! 💰
Many beginners get confused about Demand Zone, so let's break it down in a simple way! 👇
💡 1. What is a Demand Zone?
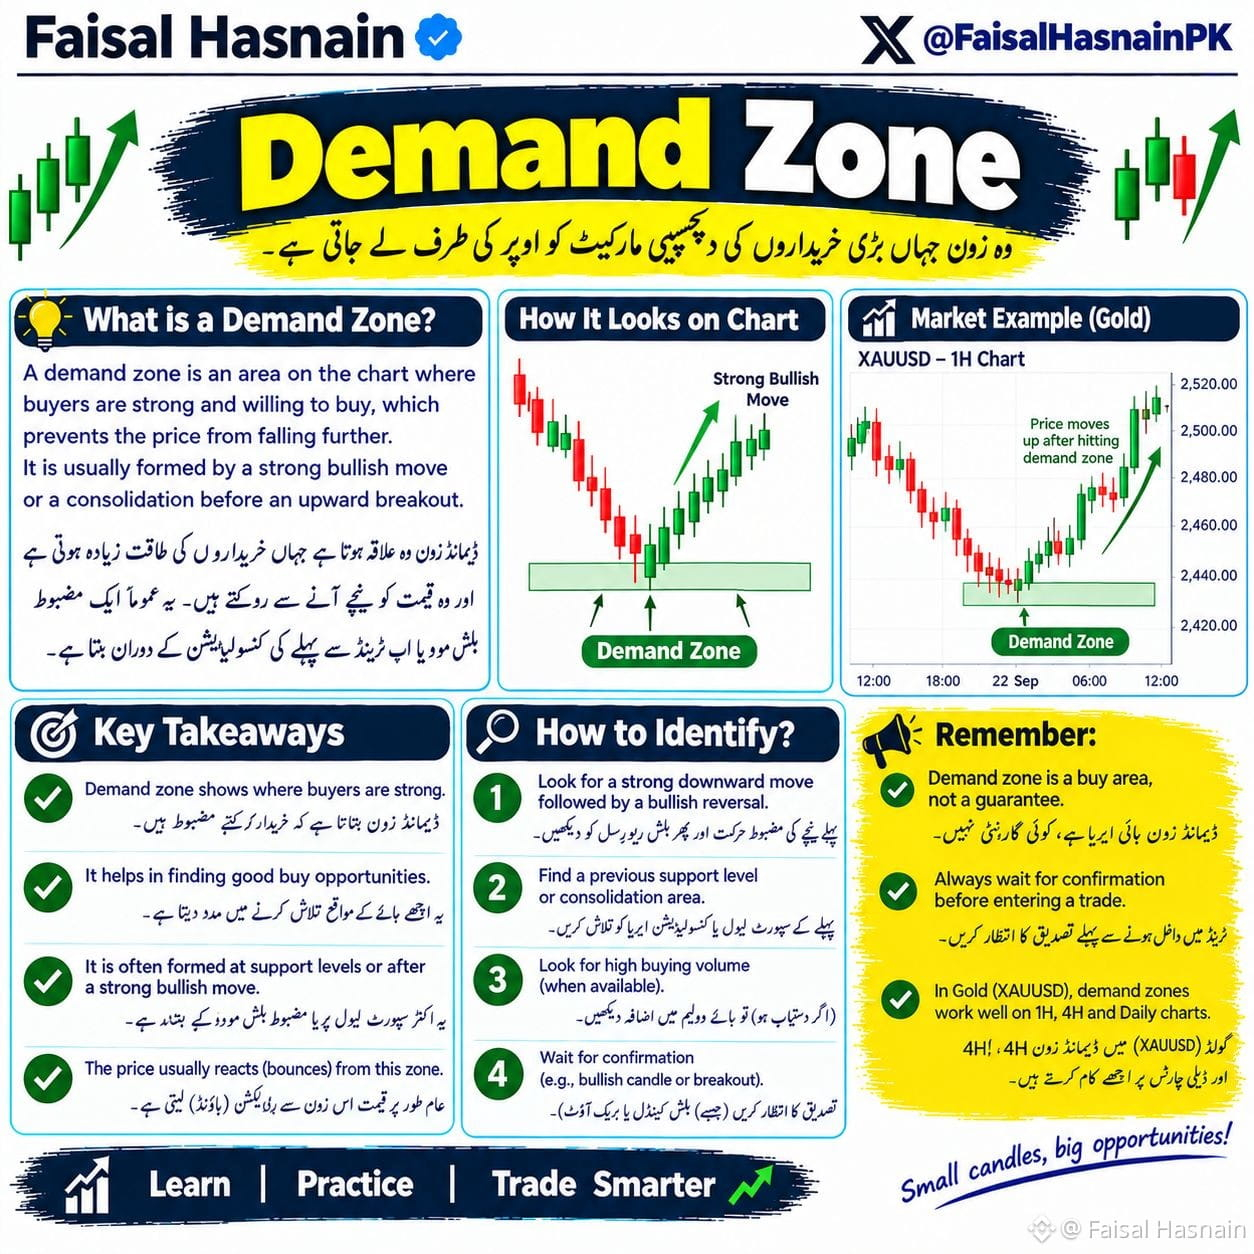
A Demand Zone is a special area on the chart where buyers are very strong. When price comes to this zone, buyers start buying heavily which stops the price from falling further. This zone is usually created before a strong bullish move! 🚀
📊 2. How It Looks on Chart?
On the chart, you will see a strong downtrend, then price stops at a level, makes small candles (consolidation), and then a STRONG bullish move to the upside. That base area is your Demand Zone. ✅
🥇 3. Live Market Example - GOLD (XAUUSD)
Look at the 1H chart of Gold. Price dropped to 2,430, stayed in the demand zone, and then BOOM! Strong bullish reversal to 2,520. This is how demand zones work in real market.
🎯 4. How to Identify a Demand Zone?
1️⃣ Look for a strong downward move followed by a bullish reversal.
2️⃣ Find a previous support level or consolidation area.
3️⃣ Look for high buying volume (if available).
4️⃣ ALWAYS wait for confirmation like a bullish candle or breakout.
🔑 Key Takeaways:
✔️ Demand Zone shows where buyers are strong.
✔️ It helps in finding good BUY opportunities.
✔️ It is often formed at support levels.
✔️ Price usually reacts / bounces from this zone.
⚠️ Remember:
Demand Zone is a BUY AREA, not a guarantee! Never enter without confirmation. In Gold (XAUUSD), demand zones work beautifully on 1H, 4H, and Daily charts.
Learn | Practice | Trade Smarter 📈
Small candles, big opportunities! ✨
#DemandZone #priceaction #smartmoney #tradingeducation #FaisalHasnain
📈 What is Demand Zone? The Area Where Buyers Take Control! 💰
Many beginners get confused about Demand Zone, so let's break it down in a simple way! 👇
💡 1. What is a Demand Zone?
A Demand Zone is a special area on the chart where buyers are very strong. When price comes to this zone, buyers start buying heavily which stops the price from falling further. This zone is usually created before a strong bullish move! 🚀
📊 2. How It Looks on Chart?
On the chart, you will see a strong downtrend, then price stops at a level, makes small candles (consolidation), and then a STRONG bullish move to the upside. That base area is your Demand Zone. ✅
🥇 3. Live Market Example - GOLD (XAUUSD)
Look at the 1H chart of Gold. Price dropped to 2,430, stayed in the demand zone, and then BOOM! Strong bullish reversal to 2,520. This is how demand zones work in real market.
🎯 4. How to Identify a Demand Zone?
1️⃣ Look for a strong downward move followed by a bullish reversal.
2️⃣ Find a previous support level or consolidation area.
3️⃣ Look for high buying volume (if available).
4️⃣ ALWAYS wait for confirmation like a bullish candle or breakout.
🔑 Key Takeaways:
✔️ Demand Zone shows where buyers are strong.
✔️ It helps in finding good BUY opportunities.
✔️ It is often formed at support levels.
✔️ Price usually reacts / bounces from this zone.
⚠️ Remember:
Demand Zone is a BUY AREA, not a guarantee! Never enter without confirmation. In Gold (XAUUSD), demand zones work beautifully on 1H, 4H, and Daily charts.
Learn | Practice | Trade Smarter 📈
Small candles, big opportunities! ✨
#DemandZone #priceaction #smartmoney #tradingeducation #FaisalHasnain
Many beginners get confused about Demand Zone, so let's break it down in a simple way! 👇
💡 1. What is a Demand Zone?
A Demand Zone is a special area on the chart where buyers are very strong. When price comes to this zone, buyers start buying heavily which stops the price from falling further. This zone is usually created before a strong bullish move! 🚀
📊 2. How It Looks on Chart?
On the chart, you will see a strong downtrend, then price stops at a level, makes small candles (consolidation), and then a STRONG bullish move to the upside. That base area is your Demand Zone. ✅
🥇 3. Live Market Example - GOLD (XAUUSD)
Look at the 1H chart of Gold. Price dropped to 2,430, stayed in the demand zone, and then BOOM! Strong bullish reversal to 2,520. This is how demand zones work in real market.
🎯 4. How to Identify a Demand Zone?
1️⃣ Look for a strong downward move followed by a bullish reversal.
2️⃣ Find a previous support level or consolidation area.
3️⃣ Look for high buying volume (if available).
4️⃣ ALWAYS wait for confirmation like a bullish candle or breakout.
🔑 Key Takeaways:
✔️ Demand Zone shows where buyers are strong.
✔️ It helps in finding good BUY opportunities.
✔️ It is often formed at support levels.
✔️ Price usually reacts / bounces from this zone.
⚠️ Remember:
Demand Zone is a BUY AREA, not a guarantee! Never enter without confirmation. In Gold (XAUUSD), demand zones work beautifully on 1H, 4H, and Daily charts.
Learn | Practice | Trade Smarter 📈
Small candles, big opportunities! ✨
#DemandZone #priceaction #smartmoney #tradingeducation #FaisalHasnain
134
📈 What is Demand Zone? The Area Where Buyers Take Control! 💰
Many beginners get confused about Demand Zone, so let's break it down in a simple way! 👇
💡 1. What is a Demand Zone?
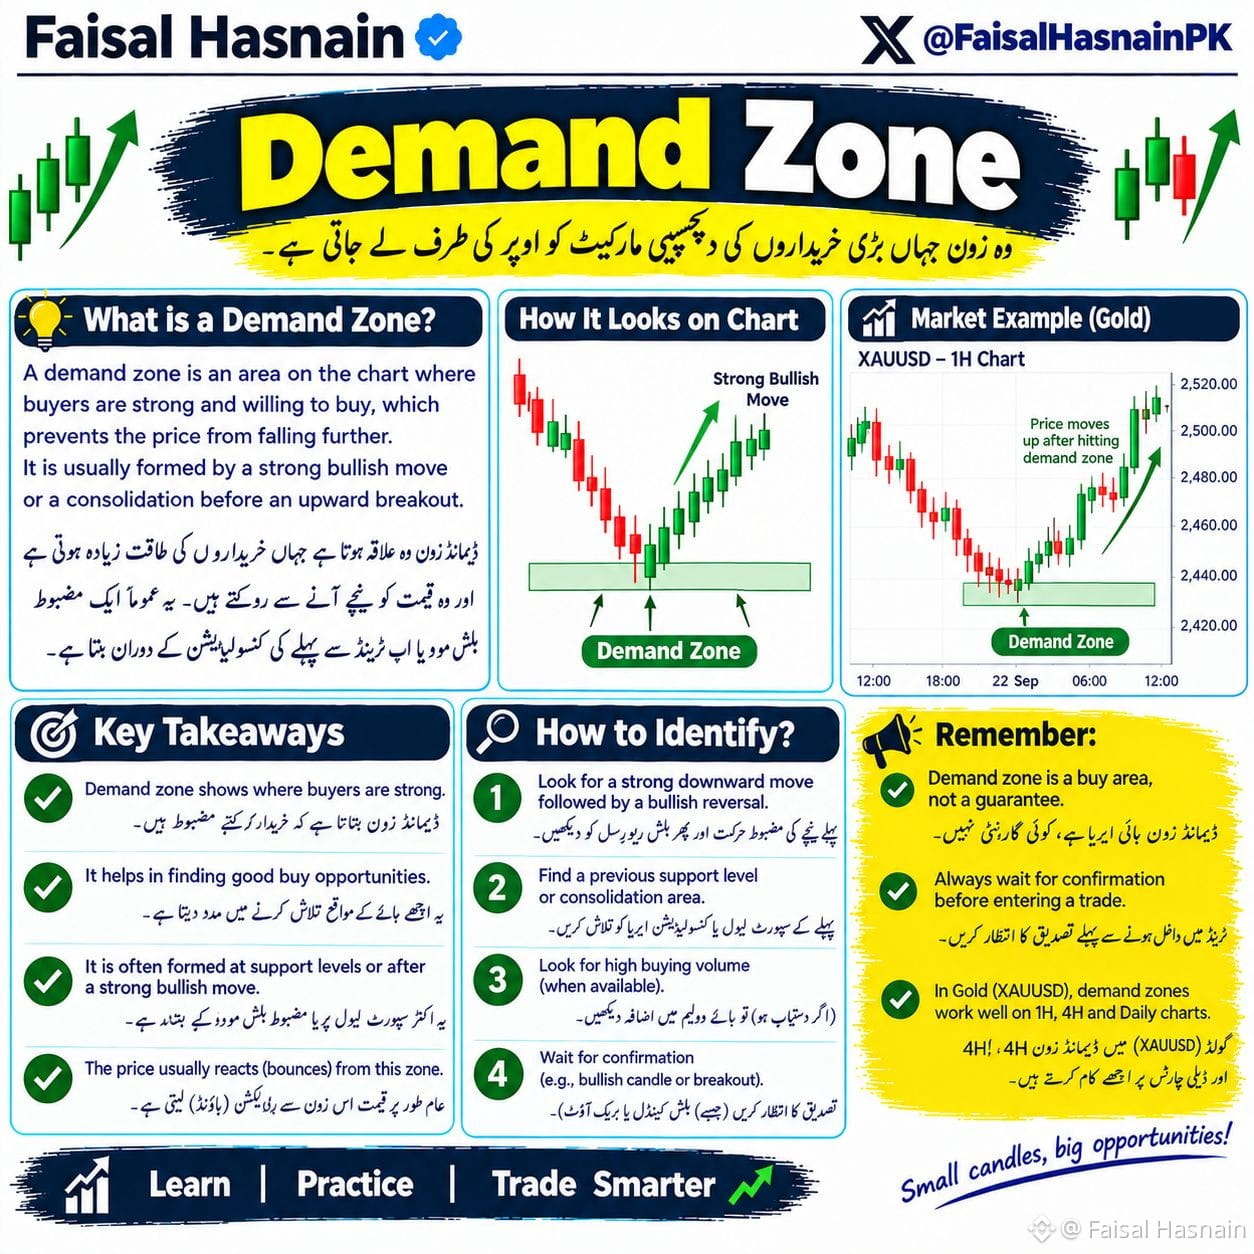
A Demand Zone is a special area on the chart where buyers are very strong. When price comes to this zone, buyers start buying heavily which stops the price from falling further. This zone is usually created before a strong bullish move! 🚀
📊 2. How It Looks on Chart?
On the chart, you will see a strong downtrend, then price stops at a level, makes small candles (consolidation), and then a STRONG bullish move to the upside. That base area is your Demand Zone. ✅
🥇 3. Live Market Example - GOLD (XAUUSD)
Look at the 1H chart of Gold. Price dropped to 2,430, stayed in the demand zone, and then BOOM! Strong bullish reversal to 2,520. This is how demand zones work in real market.
🎯 4. How to Identify a Demand Zone?
1️⃣ Look for a strong downward move followed by a bullish reversal.
2️⃣ Find a previous support level or consolidation area.
3️⃣ Look for high buying volume (if available).
4️⃣ ALWAYS wait for confirmation like a bullish candle or breakout.
🔑 Key Takeaways:
✔️ Demand Zone shows where buyers are strong.
✔️ It helps in finding good BUY opportunities.
✔️ It is often formed at support levels.
✔️ Price usually reacts / bounces from this zone.
⚠️ Remember:
Demand Zone is a BUY AREA, not a guarantee! Never enter without confirmation. In Gold (XAUUSD), demand zones work beautifully on 1H, 4H, and Daily charts.
Learn | Practice | Trade Smarter 📈
Small candles, big opportunities! ✨
#DemandZone #priceaction #smartmoney #tradingeducation #FaisalHasnain
📈 What is Demand Zone? The Area Where Buyers Take Control! 💰
Many beginners get confused about Demand Zone, so let's break it down in a simple way! 👇
💡 1. What is a Demand Zone?
A Demand Zone is a special area on the chart where buyers are very strong. When price comes to this zone, buyers start buying heavily which stops the price from falling further. This zone is usually created before a strong bullish move! 🚀
📊 2. How It Looks on Chart?
On the chart, you will see a strong downtrend, then price stops at a level, makes small candles (consolidation), and then a STRONG bullish move to the upside. That base area is your Demand Zone. ✅
🥇 3. Live Market Example - GOLD (XAUUSD)
Look at the 1H chart of Gold. Price dropped to 2,430, stayed in the demand zone, and then BOOM! Strong bullish reversal to 2,520. This is how demand zones work in real market.
🎯 4. How to Identify a Demand Zone?
1️⃣ Look for a strong downward move followed by a bullish reversal.
2️⃣ Find a previous support level or consolidation area.
3️⃣ Look for high buying volume (if available).
4️⃣ ALWAYS wait for confirmation like a bullish candle or breakout.
🔑 Key Takeaways:
✔️ Demand Zone shows where buyers are strong.
✔️ It helps in finding good BUY opportunities.
✔️ It is often formed at support levels.
✔️ Price usually reacts / bounces from this zone.
⚠️ Remember:
Demand Zone is a BUY AREA, not a guarantee! Never enter without confirmation. In Gold (XAUUSD), demand zones work beautifully on 1H, 4H, and Daily charts.
Learn | Practice | Trade Smarter 📈
Small candles, big opportunities! ✨
#DemandZone #priceaction #smartmoney #tradingeducation #FaisalHasnain
Many beginners get confused about Demand Zone, so let's break it down in a simple way! 👇
💡 1. What is a Demand Zone?
A Demand Zone is a special area on the chart where buyers are very strong. When price comes to this zone, buyers start buying heavily which stops the price from falling further. This zone is usually created before a strong bullish move! 🚀
📊 2. How It Looks on Chart?
On the chart, you will see a strong downtrend, then price stops at a level, makes small candles (consolidation), and then a STRONG bullish move to the upside. That base area is your Demand Zone. ✅
🥇 3. Live Market Example - GOLD (XAUUSD)
Look at the 1H chart of Gold. Price dropped to 2,430, stayed in the demand zone, and then BOOM! Strong bullish reversal to 2,520. This is how demand zones work in real market.
🎯 4. How to Identify a Demand Zone?
1️⃣ Look for a strong downward move followed by a bullish reversal.
2️⃣ Find a previous support level or consolidation area.
3️⃣ Look for high buying volume (if available).
4️⃣ ALWAYS wait for confirmation like a bullish candle or breakout.
🔑 Key Takeaways:
✔️ Demand Zone shows where buyers are strong.
✔️ It helps in finding good BUY opportunities.
✔️ It is often formed at support levels.
✔️ Price usually reacts / bounces from this zone.
⚠️ Remember:
Demand Zone is a BUY AREA, not a guarantee! Never enter without confirmation. In Gold (XAUUSD), demand zones work beautifully on 1H, 4H, and Daily charts.
Learn | Practice | Trade Smarter 📈
Small candles, big opportunities! ✨
#DemandZone #priceaction #smartmoney #tradingeducation #FaisalHasnain
172
🔴 Bearish Engulfed Candle! 📉
This 2-candle pattern at the top = Buyers failed, Sellers took full control! Learn to spot the reversal before the drop 🚨
💡 What is a Bearish Engulfed Candle?
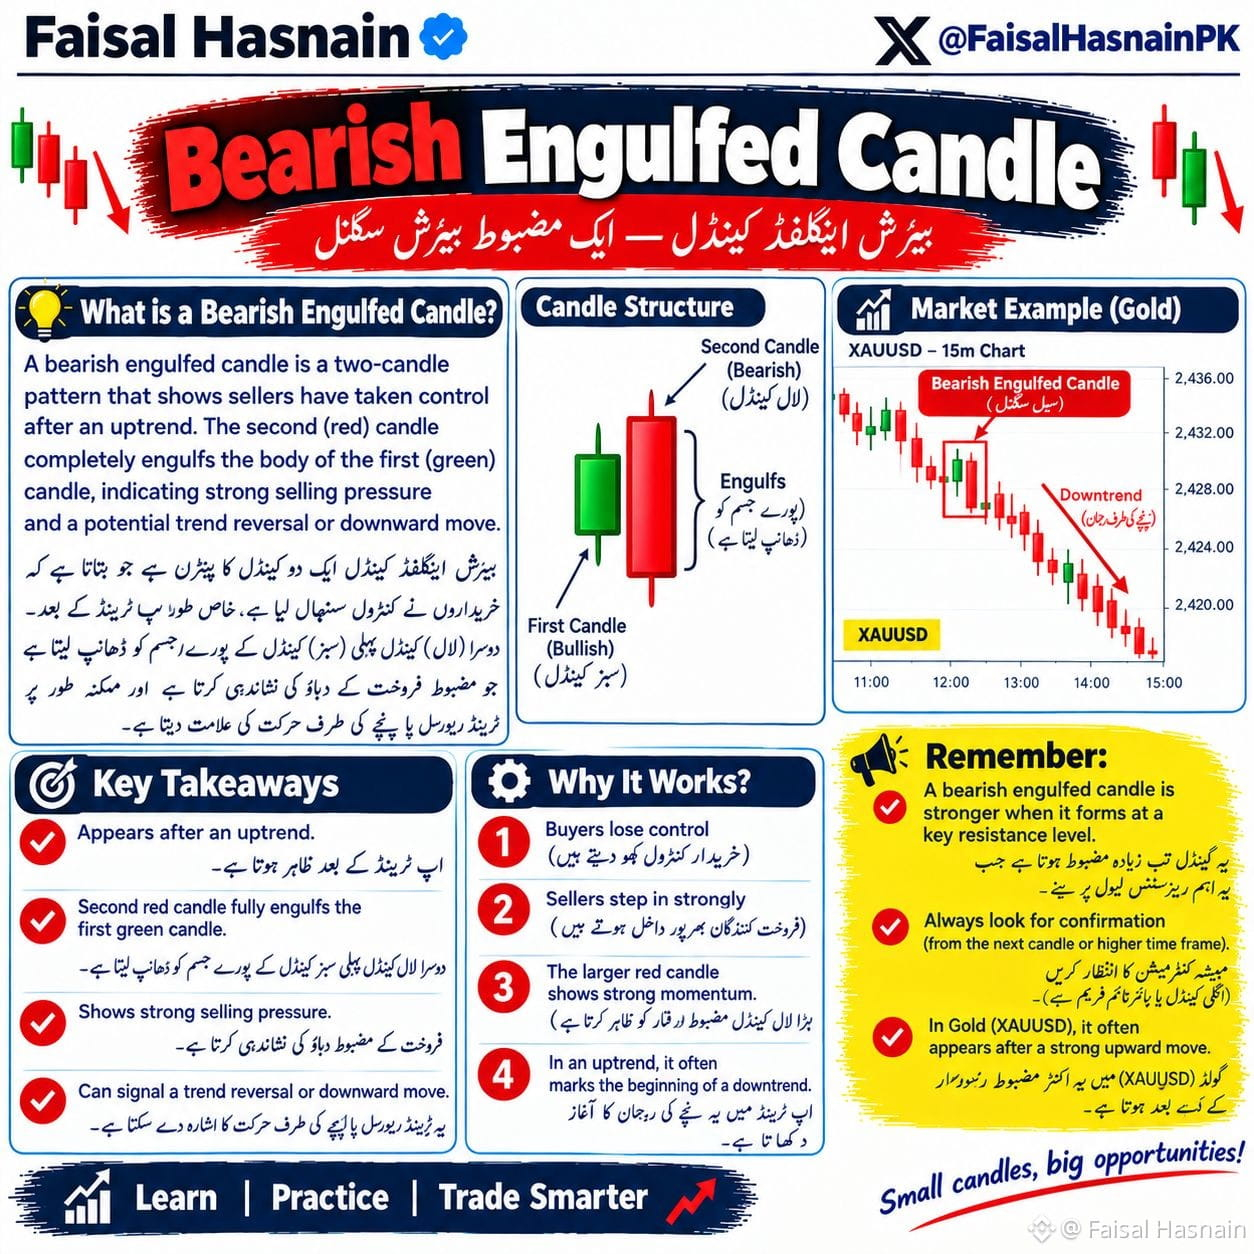
A bearish engulfed candle is a two-candle pattern that shows sellers have taken control after an uptrend. The second (red) candle completely engulfs the body of the first (green) candle, indicating strong selling pressure and a potential trend reversal or downward move.
🕯️ Candle Structure:
First Candle (Bullish) - Small green candle showing buyers are in control
Second Candle (Bearish) - Big red candle that fully engulfs the previous green candle's body - This shows complete seller dominance
📊 Market Example (XAUUSD - Gold 15m Chart):
Uptrend ⬆️ ➡️ Bearish Engulfed Candle forms at top ➡️ Downtrend starts 🔻
Price was rising, then a strong red candle covered the previous green candle completely - this shows sellers stepping in with full power and starting a sell-off.
✅ Key Takeaways:
✔️ Appears after an uptrend
✔️ Second red candle fully engulfs the first green candle
✔️ Shows strong selling pressure
✔️ Can signal a trend reversal or downward move
⚙️ Why It Works?
1️⃣ Buyers lose control
2️⃣ Sellers step in strongly
3️⃣ The larger red candle shows strong momentum
4️⃣ In an uptrend, it often marks the beginning of a downtrend
⚠️ Remember:
✔️ A bearish engulfed candle is stronger when it forms at a key resistance level
✔️ Always look for confirmation from the next candle or higher time frame
✔️ In $XAUT $BTC $ETH , it often appears after a strong upward move
Small candles, big opportunities! 💰
Save this for your next trade 🔖
Learn | Practice | Trade Smarter
#BearishEngulfing #CandlestickPatterns #priceaction #TechnicalAnalysis #FaisalHasnain
🔴 Bearish Engulfed Candle! 📉
This 2-candle pattern at the top = Buyers failed, Sellers took full control! Learn to spot the reversal before the drop 🚨
💡 What is a Bearish Engulfed Candle?
A bearish engulfed candle is a two-candle pattern that shows sellers have taken control after an uptrend. The second (red) candle completely engulfs the body of the first (green) candle, indicating strong selling pressure and a potential trend reversal or downward move.
🕯️ Candle Structure:
First Candle (Bullish) - Small green candle showing buyers are in control
Second Candle (Bearish) - Big red candle that fully engulfs the previous green candle's body - This shows complete seller dominance
📊 Market Example (XAUUSD - Gold 15m Chart):
Uptrend ⬆️ ➡️ Bearish Engulfed Candle forms at top ➡️ Downtrend starts 🔻
Price was rising, then a strong red candle covered the previous green candle completely - this shows sellers stepping in with full power and starting a sell-off.
✅ Key Takeaways:
✔️ Appears after an uptrend
✔️ Second red candle fully engulfs the first green candle
✔️ Shows strong selling pressure
✔️ Can signal a trend reversal or downward move
⚙️ Why It Works?
1️⃣ Buyers lose control
2️⃣ Sellers step in strongly
3️⃣ The larger red candle shows strong momentum
4️⃣ In an uptrend, it often marks the beginning of a downtrend
⚠️ Remember:
✔️ A bearish engulfed candle is stronger when it forms at a key resistance level
✔️ Always look for confirmation from the next candle or higher time frame
✔️ In $XAUT $BTC $ETH , it often appears after a strong upward move
Small candles, big opportunities! 💰
Save this for your next trade 🔖
Learn | Practice | Trade Smarter
#BearishEngulfing #CandlestickPatterns #priceaction #TechnicalAnalysis #FaisalHasnain
This 2-candle pattern at the top = Buyers failed, Sellers took full control! Learn to spot the reversal before the drop 🚨
💡 What is a Bearish Engulfed Candle?
A bearish engulfed candle is a two-candle pattern that shows sellers have taken control after an uptrend. The second (red) candle completely engulfs the body of the first (green) candle, indicating strong selling pressure and a potential trend reversal or downward move.
🕯️ Candle Structure:
First Candle (Bullish) - Small green candle showing buyers are in control
Second Candle (Bearish) - Big red candle that fully engulfs the previous green candle's body - This shows complete seller dominance
📊 Market Example (XAUUSD - Gold 15m Chart):
Uptrend ⬆️ ➡️ Bearish Engulfed Candle forms at top ➡️ Downtrend starts 🔻
Price was rising, then a strong red candle covered the previous green candle completely - this shows sellers stepping in with full power and starting a sell-off.
✅ Key Takeaways:
✔️ Appears after an uptrend
✔️ Second red candle fully engulfs the first green candle
✔️ Shows strong selling pressure
✔️ Can signal a trend reversal or downward move
⚙️ Why It Works?
1️⃣ Buyers lose control
2️⃣ Sellers step in strongly
3️⃣ The larger red candle shows strong momentum
4️⃣ In an uptrend, it often marks the beginning of a downtrend
⚠️ Remember:
✔️ A bearish engulfed candle is stronger when it forms at a key resistance level
✔️ Always look for confirmation from the next candle or higher time frame
✔️ In $XAUT $BTC $ETH , it often appears after a strong upward move
Small candles, big opportunities! 💰
Save this for your next trade 🔖
Learn | Practice | Trade Smarter
#BearishEngulfing #CandlestickPatterns #priceaction #TechnicalAnalysis #FaisalHasnain
81
🟢 Bullish Engulfed Candle! 📈
This 2-candle pattern at the bottom = Sellers failed, Buyers took full control! Learn to spot the reversal 🚀
💡 What is a Bullish Engulfed Candle?
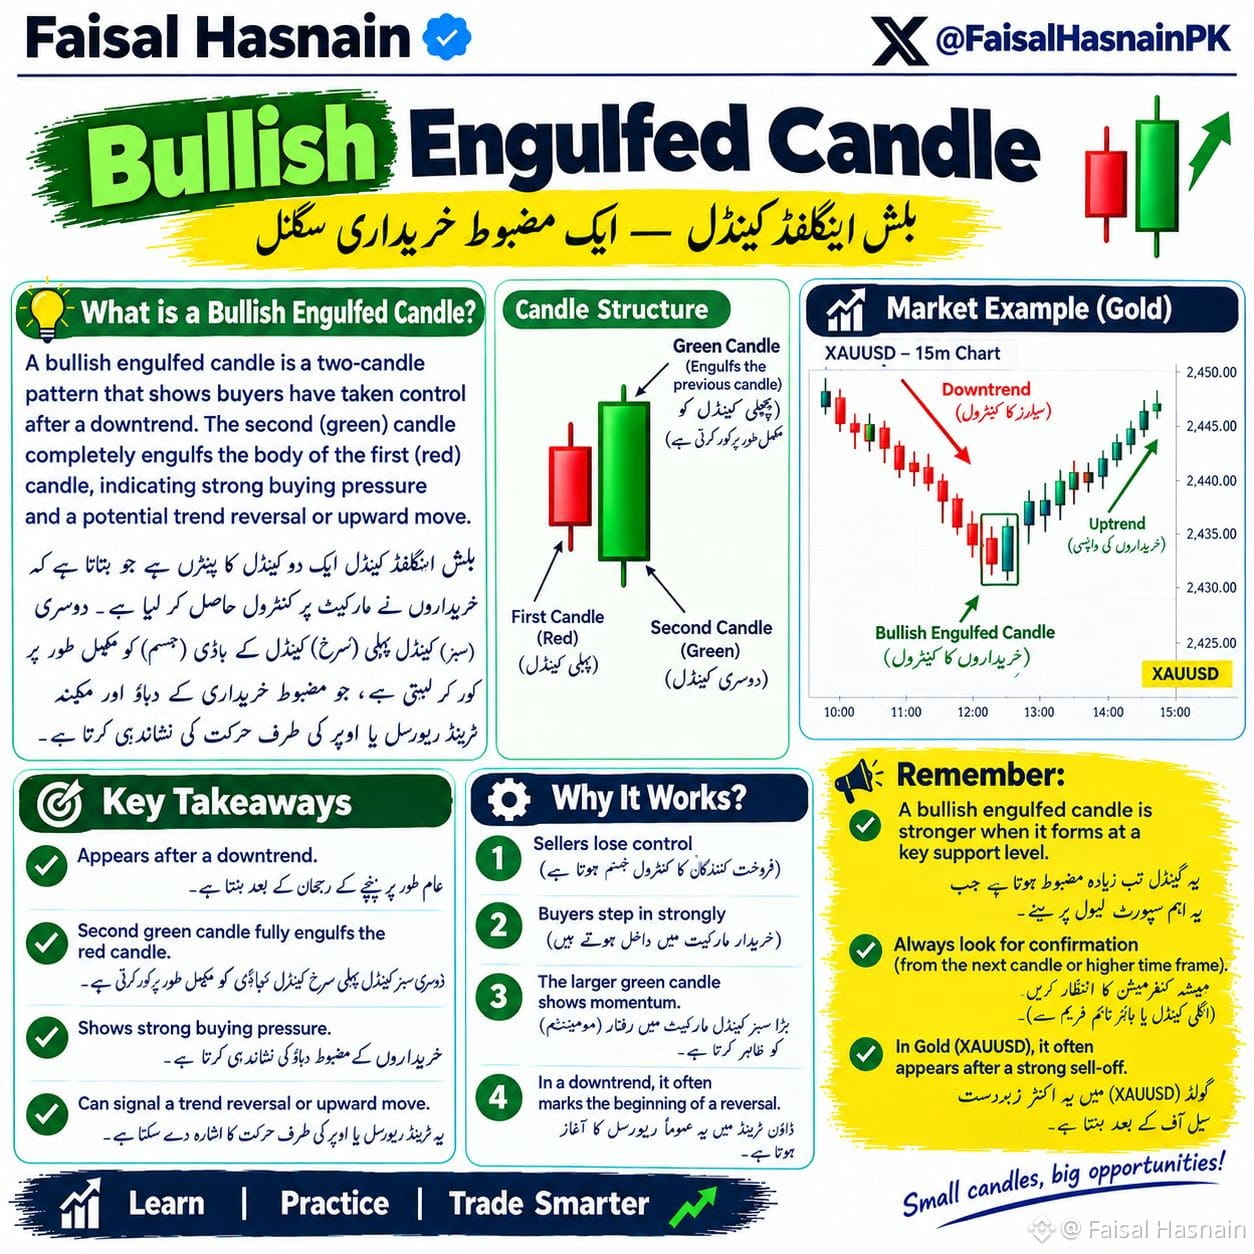
A two-candle pattern that shows buyers have taken control after a downtrend. The second (green) candle completely engulfs the body of the first (red) candle, indicating strong buying pressure and a potential trend reversal or upward move.
🕯️ Candle Structure:
First Candle (Red) - Small bearish candle showing sellers are in control
Second Candle (Green) - Big bullish candle that fully engulfs the previous candle
📊 Market example :
Downtrend 🔻 ➡️ Bullish Engulfed Candle forms at bottom ➡️ Uptrend starts 🟢
Price was falling, then a strong green candle covered the previous red candle completely - this shows buyers stepping in.
✅ Key Takeaways:
✔️ Appears after a downtrend
✔️ Second green candle fully engulfs the red candle
✔️ Shows strong buying pressure
✔️ Can signal a trend reversal or upward move
⚙️ Why It Works?
1️⃣ Sellers lose control
2️⃣ Buyers step in strongly
3️⃣ The larger green candle shows momentum
4️⃣ In a downtrend, it often marks the beginning of a reversal
⚠️ Remember:
✔️ A bullish engulfed candle is stronger when it forms at a key support level
✔️ Always look for confirmation from the next candle or higher time frame
✔️ In Gold (XAUUSD), it often appears after a strong sell-off
Small candles, big opportunities! 💰
Save this for your next trade 🔖
Learn | Practice | Trade Smarter
#BullishEngulfing #CandlestickPatterns #PriceAction #TechnicalAnalysis #FaisalHasnain
🟢 Bullish Engulfed Candle! 📈
This 2-candle pattern at the bottom = Sellers failed, Buyers took full control! Learn to spot the reversal 🚀
💡 What is a Bullish Engulfed Candle?
A two-candle pattern that shows buyers have taken control after a downtrend. The second (green) candle completely engulfs the body of the first (red) candle, indicating strong buying pressure and a potential trend reversal or upward move.
🕯️ Candle Structure:
First Candle (Red) - Small bearish candle showing sellers are in control
Second Candle (Green) - Big bullish candle that fully engulfs the previous candle
📊 Market example :
Downtrend 🔻 ➡️ Bullish Engulfed Candle forms at bottom ➡️ Uptrend starts 🟢
Price was falling, then a strong green candle covered the previous red candle completely - this shows buyers stepping in.
✅ Key Takeaways:
✔️ Appears after a downtrend
✔️ Second green candle fully engulfs the red candle
✔️ Shows strong buying pressure
✔️ Can signal a trend reversal or upward move
⚙️ Why It Works?
1️⃣ Sellers lose control
2️⃣ Buyers step in strongly
3️⃣ The larger green candle shows momentum
4️⃣ In a downtrend, it often marks the beginning of a reversal
⚠️ Remember:
✔️ A bullish engulfed candle is stronger when it forms at a key support level
✔️ Always look for confirmation from the next candle or higher time frame
✔️ In Gold (XAUUSD), it often appears after a strong sell-off
Small candles, big opportunities! 💰
Save this for your next trade 🔖
Learn | Practice | Trade Smarter
#BullishEngulfing #CandlestickPatterns #PriceAction #TechnicalAnalysis #FaisalHasnain
This 2-candle pattern at the bottom = Sellers failed, Buyers took full control! Learn to spot the reversal 🚀
💡 What is a Bullish Engulfed Candle?
A two-candle pattern that shows buyers have taken control after a downtrend. The second (green) candle completely engulfs the body of the first (red) candle, indicating strong buying pressure and a potential trend reversal or upward move.
🕯️ Candle Structure:
First Candle (Red) - Small bearish candle showing sellers are in control
Second Candle (Green) - Big bullish candle that fully engulfs the previous candle
📊 Market example :
Downtrend 🔻 ➡️ Bullish Engulfed Candle forms at bottom ➡️ Uptrend starts 🟢
Price was falling, then a strong green candle covered the previous red candle completely - this shows buyers stepping in.
✅ Key Takeaways:
✔️ Appears after a downtrend
✔️ Second green candle fully engulfs the red candle
✔️ Shows strong buying pressure
✔️ Can signal a trend reversal or upward move
⚙️ Why It Works?
1️⃣ Sellers lose control
2️⃣ Buyers step in strongly
3️⃣ The larger green candle shows momentum
4️⃣ In a downtrend, it often marks the beginning of a reversal
⚠️ Remember:
✔️ A bullish engulfed candle is stronger when it forms at a key support level
✔️ Always look for confirmation from the next candle or higher time frame
✔️ In Gold (XAUUSD), it often appears after a strong sell-off
Small candles, big opportunities! 💰
Save this for your next trade 🔖
Learn | Practice | Trade Smarter
#BullishEngulfing #CandlestickPatterns #PriceAction #TechnicalAnalysis #FaisalHasnain
119
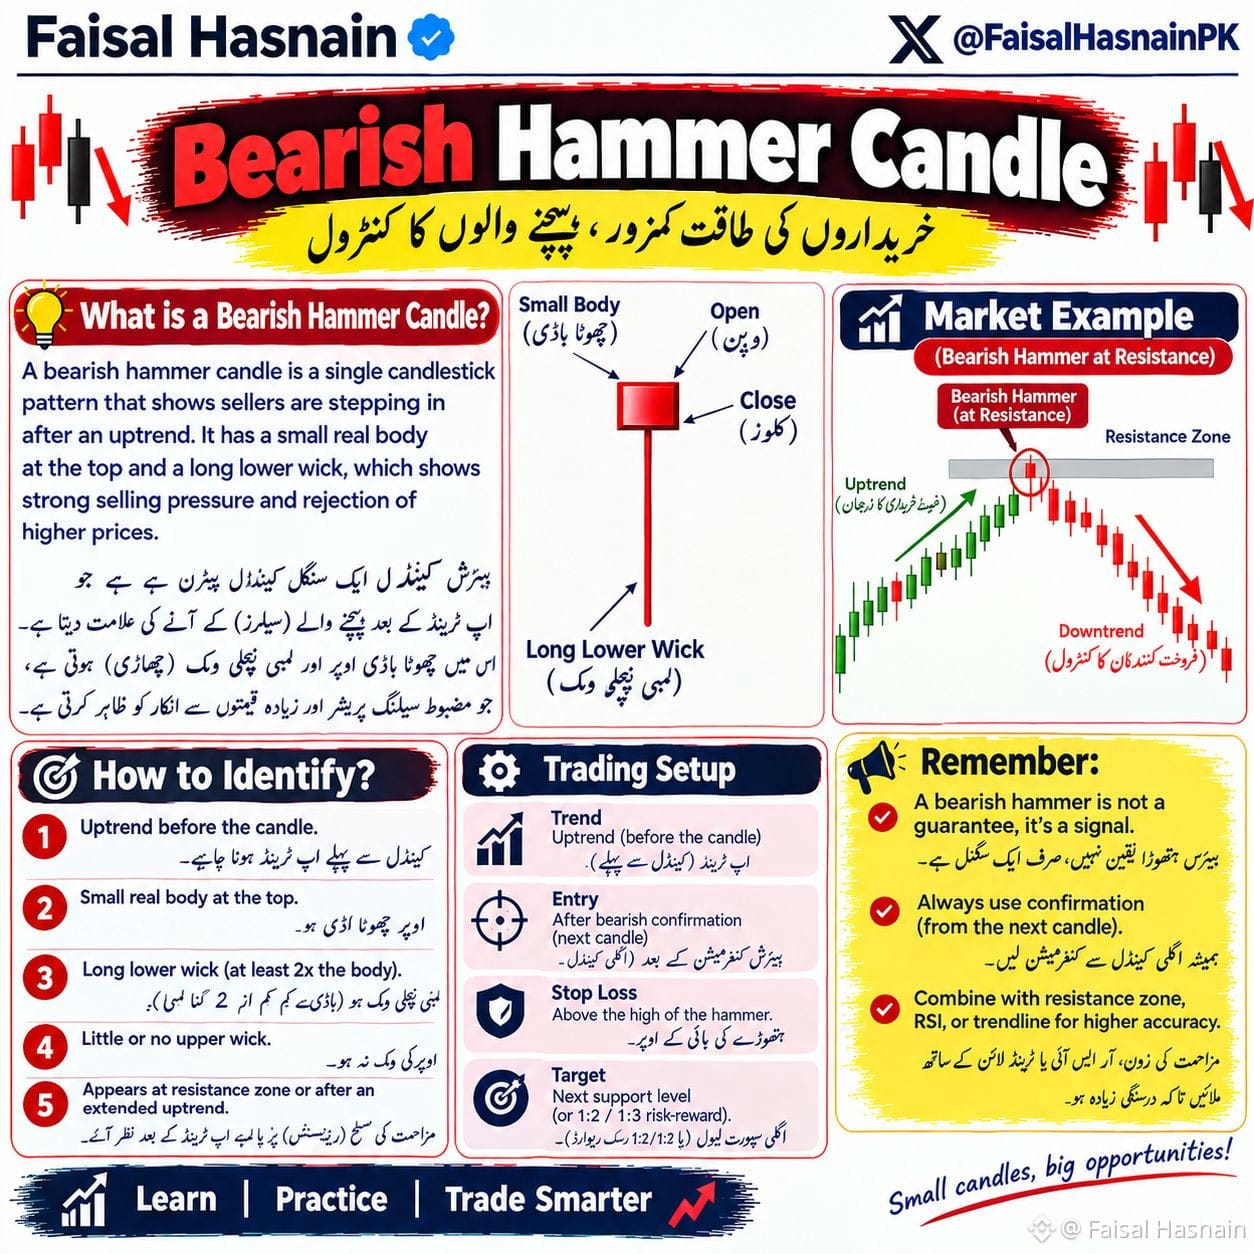
🔨 Bearish Hammer Candle! 🔴
This candle at Resistance = Buyers exhausted, Sellers taking over! Don't ignore this warning ⚠️
💡 What is a Bearish Hammer Candle?
A single candlestick pattern that shows sellers are stepping in after an UPTREND. It has a small real body at the top and a long lower wick, which shows strong selling pressure and rejection of higher prices.
📍 Structure:
Small Body at the top
Long Lower Wick at least 2x of body = Price went down but couldn't sustain
Little to No Upper Wick = Rejection at top
📊 How to Identify?
1️⃣ Must appear after an Uptrend (Buyers were in control) 🟢
2️⃣ Small real body at the top
3️⃣ Long lower wick - at least 2x the body size
4️⃣ Little or no upper wick
5️⃣ Appears at Resistance Zone or after an extended uptrend
📈 Market Example -At Resistance: Uptrend
➡️ Price hits Resistance Zone
➡️ Bearish Hammer at Resistance forms
➡️ Downtrend begins 🔻
🎯 Trading Setup:
Trend: Must be Uptrend before the hammer
Entry: After bearish confirmation (next red candle) 🔴
Stop Loss: Above the high of the hammer 🛑
Target: Next support level or use R:R 1:2 / 1:3 💰
⚠️ Remember:
✅ A bearish hammer is NOT a guarantee, it's a SIGNAL
✅ Always wait for confirmation from the next candle
✅ Combine with Resistance Zone, RSI, or Trendline for higher accuracy 🎯
Small candles, big opportunities!
Save this cheat sheet! 🔖
Learn | Practice | Trade Smarter
#HammerCandle #CandlestickPatterns #priceaction #TechnicalAnalysis #FaisalHasnain
🔨 Bearish Hammer Candle! 🔴
This candle at Resistance = Buyers exhausted, Sellers taking over! Don't ignore this warning ⚠️
💡 What is a Bearish Hammer Candle?
A single candlestick pattern that shows sellers are stepping in after an UPTREND. It has a small real body at the top and a long lower wick, which shows strong selling pressure and rejection of higher prices.
📍 Structure:
Small Body at the top
Long Lower Wick at least 2x of body = Price went down but couldn't sustain
Little to No Upper Wick = Rejection at top
📊 How to Identify?
1️⃣ Must appear after an Uptrend (Buyers were in control) 🟢
2️⃣ Small real body at the top
3️⃣ Long lower wick - at least 2x the body size
4️⃣ Little or no upper wick
5️⃣ Appears at Resistance Zone or after an extended uptrend
📈 Market Example -At Resistance: Uptrend
➡️ Price hits Resistance Zone
➡️ Bearish Hammer at Resistance forms
➡️ Downtrend begins 🔻
🎯 Trading Setup:
Trend: Must be Uptrend before the hammer
Entry: After bearish confirmation (next red candle) 🔴
Stop Loss: Above the high of the hammer 🛑
Target: Next support level or use R:R 1:2 / 1:3 💰
⚠️ Remember:
✅ A bearish hammer is NOT a guarantee, it's a SIGNAL
✅ Always wait for confirmation from the next candle
✅ Combine with Resistance Zone, RSI, or Trendline for higher accuracy 🎯
Small candles, big opportunities!
Save this cheat sheet! 🔖
Learn | Practice | Trade Smarter
#HammerCandle #CandlestickPatterns #priceaction #TechnicalAnalysis #FaisalHasnain
This candle at Resistance = Buyers exhausted, Sellers taking over! Don't ignore this warning ⚠️
💡 What is a Bearish Hammer Candle?
A single candlestick pattern that shows sellers are stepping in after an UPTREND. It has a small real body at the top and a long lower wick, which shows strong selling pressure and rejection of higher prices.
📍 Structure:
Small Body at the top
Long Lower Wick at least 2x of body = Price went down but couldn't sustain
Little to No Upper Wick = Rejection at top
📊 How to Identify?
1️⃣ Must appear after an Uptrend (Buyers were in control) 🟢
2️⃣ Small real body at the top
3️⃣ Long lower wick - at least 2x the body size
4️⃣ Little or no upper wick
5️⃣ Appears at Resistance Zone or after an extended uptrend
📈 Market Example -At Resistance: Uptrend
➡️ Price hits Resistance Zone
➡️ Bearish Hammer at Resistance forms
➡️ Downtrend begins 🔻
🎯 Trading Setup:
Trend: Must be Uptrend before the hammer
Entry: After bearish confirmation (next red candle) 🔴
Stop Loss: Above the high of the hammer 🛑
Target: Next support level or use R:R 1:2 / 1:3 💰
⚠️ Remember:
✅ A bearish hammer is NOT a guarantee, it's a SIGNAL
✅ Always wait for confirmation from the next candle
✅ Combine with Resistance Zone, RSI, or Trendline for higher accuracy 🎯
Small candles, big opportunities!
Save this cheat sheet! 🔖
Learn | Practice | Trade Smarter
#HammerCandle #CandlestickPatterns #priceaction #TechnicalAnalysis #FaisalHasnain
59
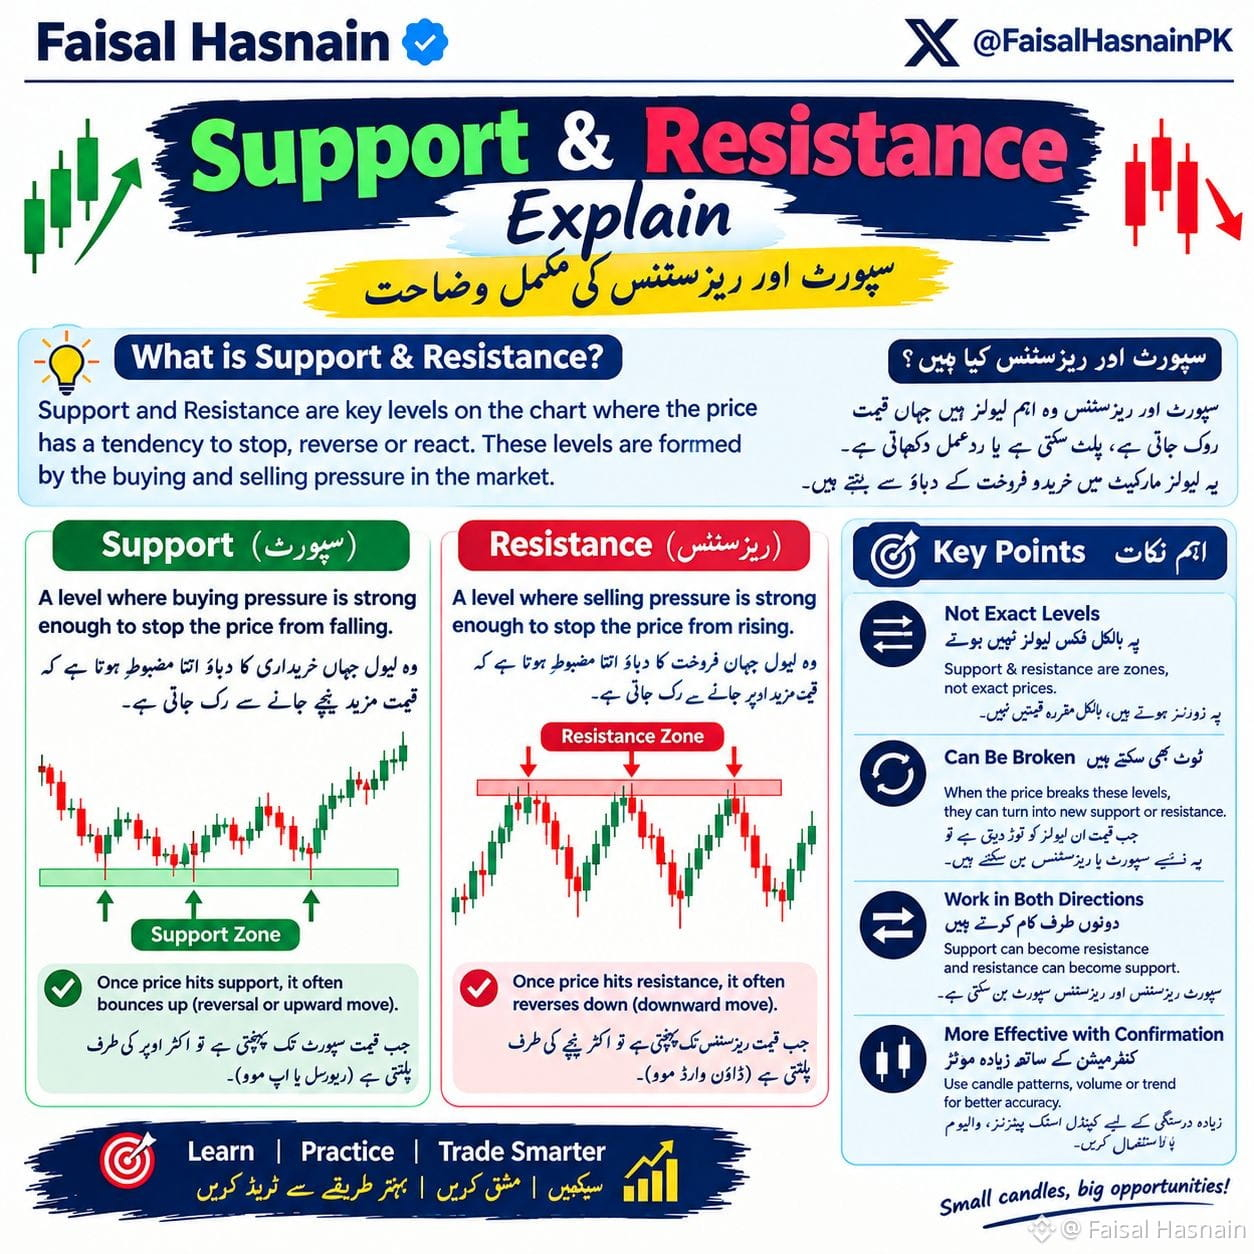
📊 Support & Resistance Explained! 🎯
These are the 2 most important levels every trader must know:
💡 What is it?
Support 🟢 = A level where buying pressure is strong enough to STOP the price from falling. Price often bounces up.
Resistance 🔴 = A level where selling pressure is strong enough to STOP the price from rising. Price often reverses down.
📍 Key Points to Remember:
✅ They are ZONES, not exact prices
✅ Levels CAN be broken. Then Support becomes Resistance & vice versa 🔄
✅ Work in BOTH directions
✅ More effective with candle pattern + volume confirmation
Why it matters: This is where price has a tendency to STOP, REVERSE, or REACT. It's where the battle between buyers & sellers happens ⚔️
Save this cheat sheet! 🔖
Learn | Practice | Trade Smarter
#Trading #Crypto #SupportAndResistance #PriceAction #FaisalHasnain
📊 Support & Resistance Explained! 🎯
These are the 2 most important levels every trader must know:
💡 What is it?
Support 🟢 = A level where buying pressure is strong enough to STOP the price from falling. Price often bounces up.
Resistance 🔴 = A level where selling pressure is strong enough to STOP the price from rising. Price often reverses down.
📍 Key Points to Remember:
✅ They are ZONES, not exact prices
✅ Levels CAN be broken. Then Support becomes Resistance & vice versa 🔄
✅ Work in BOTH directions
✅ More effective with candle pattern + volume confirmation
Why it matters: This is where price has a tendency to STOP, REVERSE, or REACT. It's where the battle between buyers & sellers happens ⚔️
Save this cheat sheet! 🔖
Learn | Practice | Trade Smarter
#Trading #Crypto #SupportAndResistance #PriceAction #FaisalHasnain
These are the 2 most important levels every trader must know:
💡 What is it?
Support 🟢 = A level where buying pressure is strong enough to STOP the price from falling. Price often bounces up.
Resistance 🔴 = A level where selling pressure is strong enough to STOP the price from rising. Price often reverses down.
📍 Key Points to Remember:
✅ They are ZONES, not exact prices
✅ Levels CAN be broken. Then Support becomes Resistance & vice versa 🔄
✅ Work in BOTH directions
✅ More effective with candle pattern + volume confirmation
Why it matters: This is where price has a tendency to STOP, REVERSE, or REACT. It's where the battle between buyers & sellers happens ⚔️
Save this cheat sheet! 🔖
Learn | Practice | Trade Smarter
#Trading #Crypto #SupportAndResistance #PriceAction #FaisalHasnain
78
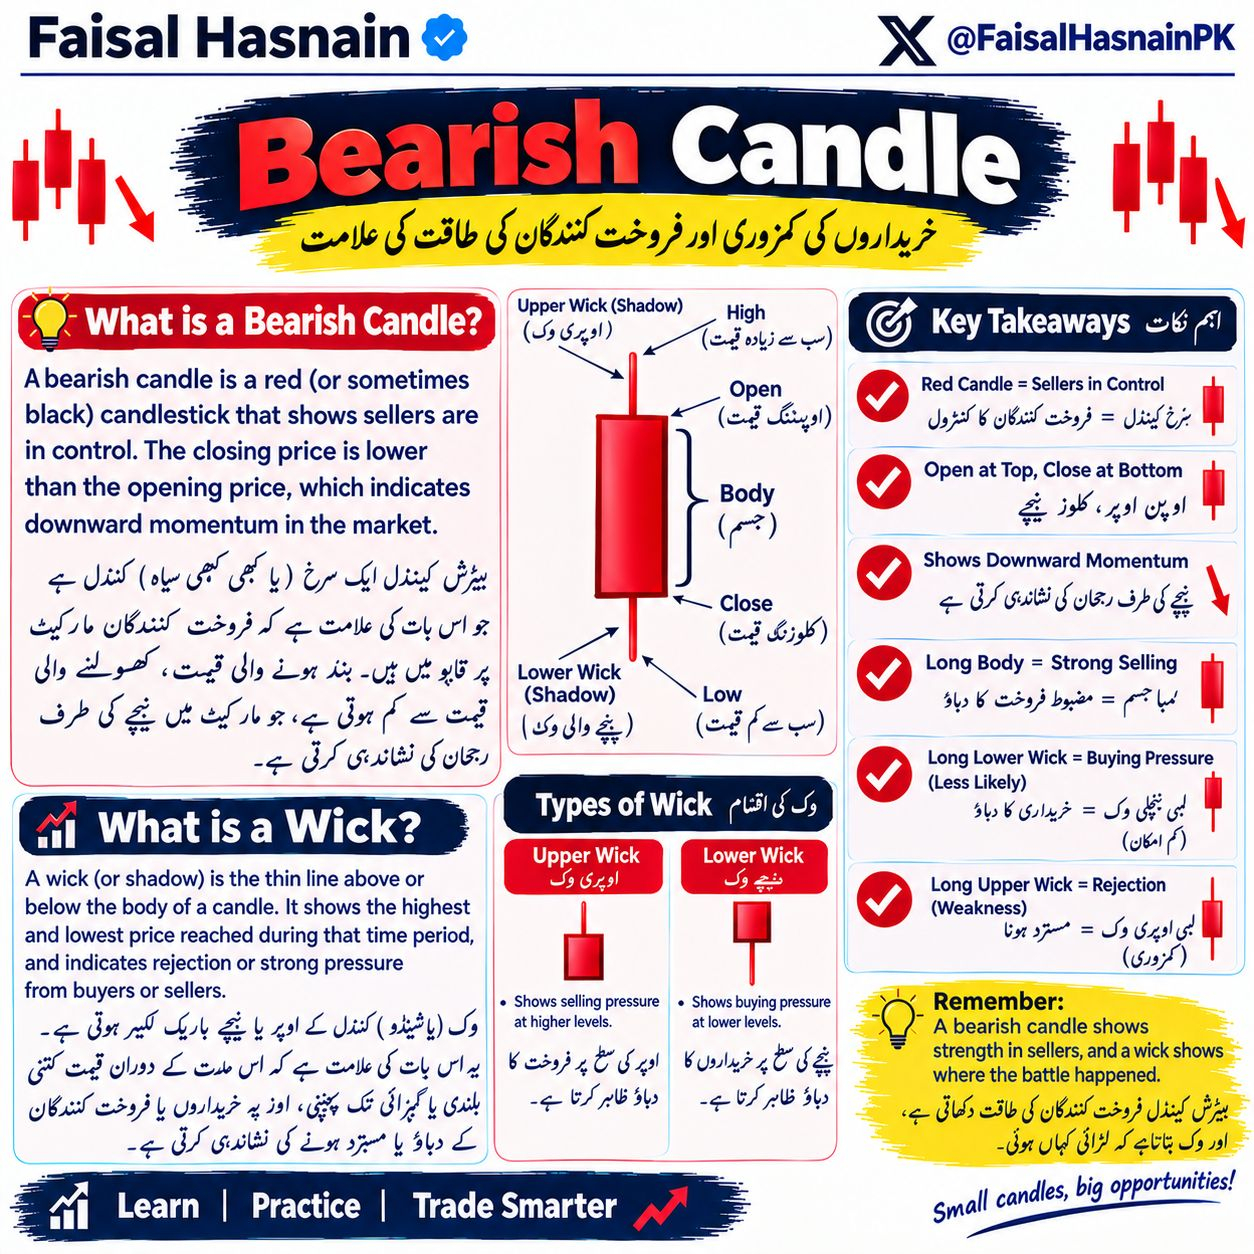
Bearish Candle Explained 🔴
A Bearish Candle means SELLERS ARE IN CONTROL 💪
This chart breaks down:
💡 What is it?
Red Candle = Close price < Open price. Signals DOWNWARD momentum 📉
📍 Parts Explained:
Body = Open to Close
Upper Wick = Selling pressure at highs 🔴
Lower Wick = Buying pressure at lows 🟢
High/Low = The full price range
🎯 Key Takeaways:
✅ Red = Sellers in Control
✅ Open at Top, Close at Bottom
✅ Long Body = Strong Selling
✅ Long Upper Wick = Rejection / Weakness
✅ Shows Downward Momentum
Remember: The candle shows strength. The wick shows where the battle happened ⚔️
Save this for beginners! 🔖
Learn | Practice | Trade Smarter
#Trading #FaisalHasnain #crypto #priceaction #BearishCandle
Bearish Candle Explained 🔴
A Bearish Candle means SELLERS ARE IN CONTROL 💪
This chart breaks down:
💡 What is it?
Red Candle = Close price < Open price. Signals DOWNWARD momentum 📉
📍 Parts Explained:
Body = Open to Close
Upper Wick = Selling pressure at highs 🔴
Lower Wick = Buying pressure at lows 🟢
High/Low = The full price range
🎯 Key Takeaways:
✅ Red = Sellers in Control
✅ Open at Top, Close at Bottom
✅ Long Body = Strong Selling
✅ Long Upper Wick = Rejection / Weakness
✅ Shows Downward Momentum
Remember: The candle shows strength. The wick shows where the battle happened ⚔️
Save this for beginners! 🔖
Learn | Practice | Trade Smarter
#Trading #FaisalHasnain #crypto #priceaction #BearishCandle
A Bearish Candle means SELLERS ARE IN CONTROL 💪
This chart breaks down:
💡 What is it?
Red Candle = Close price < Open price. Signals DOWNWARD momentum 📉
📍 Parts Explained:
Body = Open to Close
Upper Wick = Selling pressure at highs 🔴
Lower Wick = Buying pressure at lows 🟢
High/Low = The full price range
🎯 Key Takeaways:
✅ Red = Sellers in Control
✅ Open at Top, Close at Bottom
✅ Long Body = Strong Selling
✅ Long Upper Wick = Rejection / Weakness
✅ Shows Downward Momentum
Remember: The candle shows strength. The wick shows where the battle happened ⚔️
Save this for beginners! 🔖
Learn | Practice | Trade Smarter
#Trading #FaisalHasnain #crypto #priceaction #BearishCandle
60
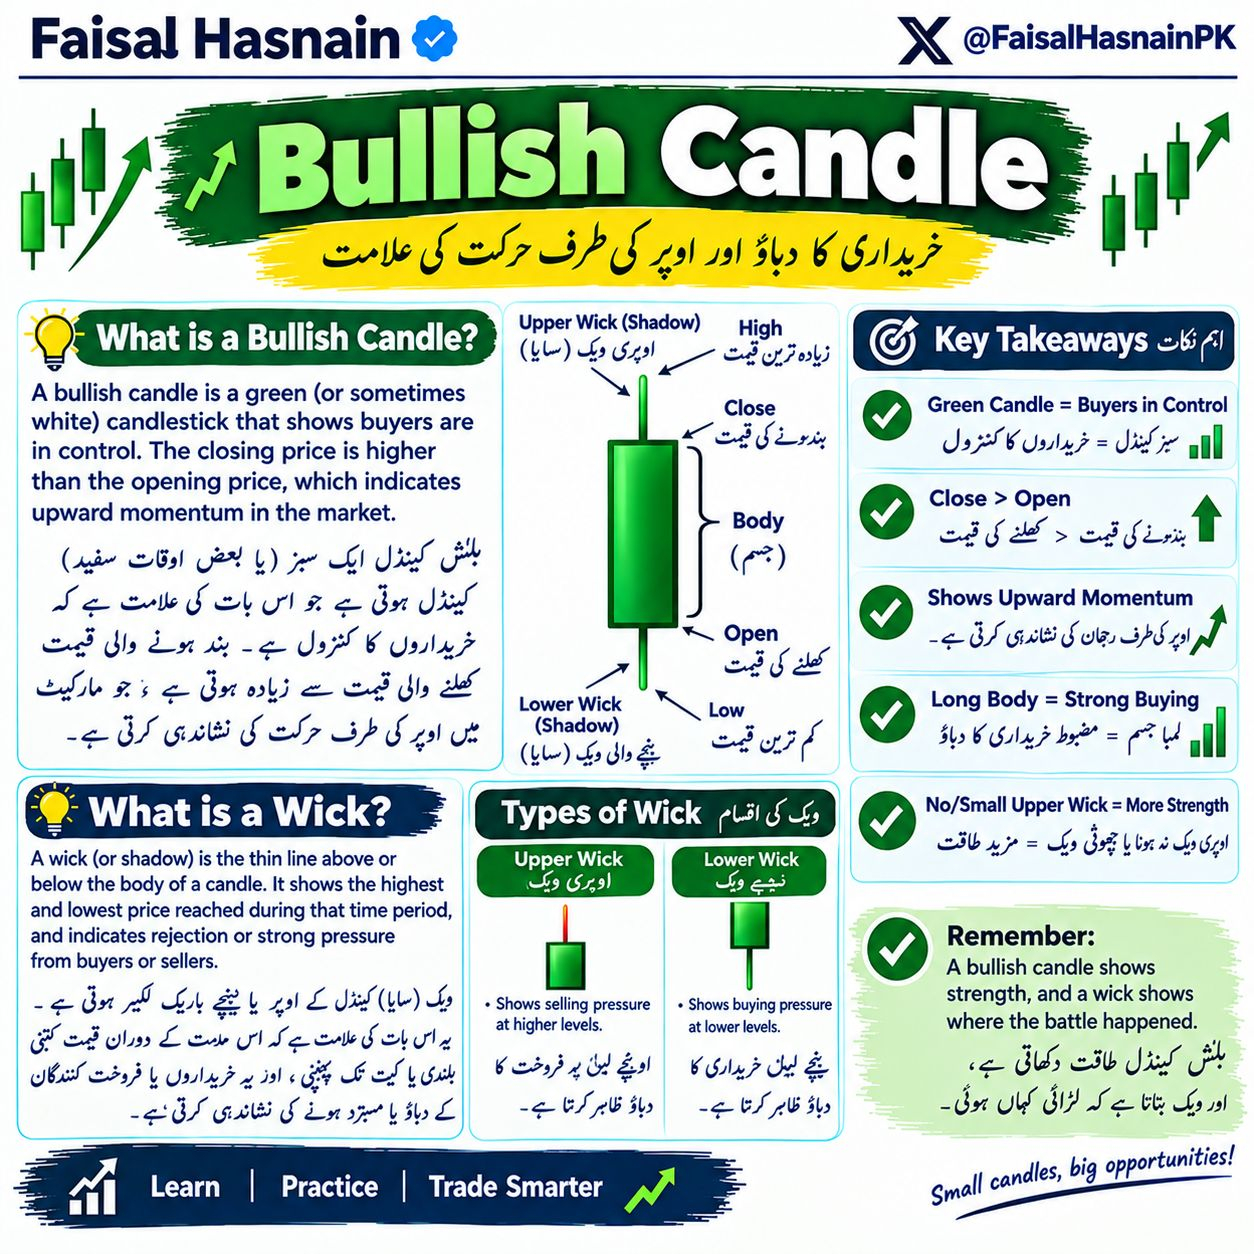
Bullish Candle Explained ! 🟢
A Bullish Candle means BUYERS ARE IN CONTROL💪
This chart breaks down:
💡 What is it?
Green Candle = Close price > Open price. Signals UPWARD momentum 🚀
📍 Parts Explained:
Body = Open to Close
Upper Wick= Selling pressure at highs 🔴
Lower Wick = Buying pressure at lows 🟢
High/Low = The full price range
🎯 Key Takeaways:
✅ Green = Buyers in Control
✅ Long Body = Strong Buying
✅ Small Upper Wick = More Strength
✅ Shows Upward Momentum 📈
Remember: The candle shows strength. The wick shows where the battle happened ⚔️
Master the basics first. Then scale up 🧠
Save this cheat sheet 📌
Want the "Bearish Candle" breakdown next? Comment "BEARISH CANDLE" 👇
#DayTrading #ForexTrader #crypto #FaisalHasnain #BullishCandle
Bullish Candle Explained ! 🟢
A Bullish Candle means BUYERS ARE IN CONTROL💪
This chart breaks down:
💡 What is it?
Green Candle = Close price > Open price. Signals UPWARD momentum 🚀
📍 Parts Explained:
Body = Open to Close
Upper Wick= Selling pressure at highs 🔴
Lower Wick = Buying pressure at lows 🟢
High/Low = The full price range
🎯 Key Takeaways:
✅ Green = Buyers in Control
✅ Long Body = Strong Buying
✅ Small Upper Wick = More Strength
✅ Shows Upward Momentum 📈
Remember: The candle shows strength. The wick shows where the battle happened ⚔️
Master the basics first. Then scale up 🧠
Save this cheat sheet 📌
Want the "Bearish Candle" breakdown next? Comment "BEARISH CANDLE" 👇
#DayTrading #ForexTrader #crypto #FaisalHasnain #BullishCandle
A Bullish Candle means BUYERS ARE IN CONTROL💪
This chart breaks down:
💡 What is it?
Green Candle = Close price > Open price. Signals UPWARD momentum 🚀
📍 Parts Explained:
Body = Open to Close
Upper Wick= Selling pressure at highs 🔴
Lower Wick = Buying pressure at lows 🟢
High/Low = The full price range
🎯 Key Takeaways:
✅ Green = Buyers in Control
✅ Long Body = Strong Buying
✅ Small Upper Wick = More Strength
✅ Shows Upward Momentum 📈
Remember: The candle shows strength. The wick shows where the battle happened ⚔️
Master the basics first. Then scale up 🧠
Save this cheat sheet 📌
Want the "Bearish Candle" breakdown next? Comment "BEARISH CANDLE" 👇
#DayTrading #ForexTrader #crypto #FaisalHasnain #BullishCandle
57
Log in to explore more content
Join global crypto users on Binance Square
⚡️ Get latest and useful information about crypto.
💬 Trusted by the world’s largest crypto exchange.
👍 Discover real insights from verified creators.
Email / Phone number
Trending Topics
1
#AnthropicIPOProspectusCouldValueItOver$2T
56 views
20 Discussing
2
#HackersDrainOver12.4MXRPFromDCENTWallets
1,019 views
48 Discussing
3
#SECSaysDecentralizedTokenBuybacksNotInvestmentContracts
7 views
2 Discussing
4
#UKFCAWinsCourtOrderToRecover851400Pounds
52,470 views
968 Discussing
5
#ChainlinkLaunchesCCIP2WithEnterpriseVerification
62,524 views
1,111 Discussing
6
#GoldFallsTo$4144
21,037 views
175 Discussing
7
#QNTFallsOver40%FromMorningHigh
111,515 views
1,488 Discussing
8
#USDTAdds845900HoldersInPast7Days
30,277 views
542 Discussing
9
#KospiFalls2.7%SamsungSKHynixDropOver5%
41,683 views
664 Discussing
10
#BitgetCEOConfirms$388MStolenInHack
6,053 views
45 Discussing