
#edukasitrading
edukasitrading
1,090 views
7 Discussing
Hot
Latest

3 Trading Foundations You Must Master
If you’re still losing money often, it’s not because you don’t have enough indicators. It’s because you haven’t got these 3 things down:
1. TREND
Price above EMA 50 = Look for BUY opportunities
Price below EMA 50 = Look for SELL opportunities
Price touching EMA 50 = Skip, market is moving sideways
2. ENTRY
Don’t chase a price that’s already surged. Wait for a pullback to Support / EMA 21 / EMA 50. It’s better to miss a trade than to enter at a bad price.
3. MONEY MANAGEMENT
1 trade = Risk only 1–2% of your capital
Risk : Reward = At least 1 : 2
Max 2–3 open positions
A 50% win rate + a 1:2 Risk Reward = Your account is still profitable.
A 90% win rate + No Money Management = Your account can still get margin called.
Which number do you fail at most often? 1, 2, or 3? Comment below. Follow for daily signal analysis and education!!
#BelajarTrading #EdukasiTrading #MoneyManagement #crypto
3 Trading Foundations You Must Master
If you’re still losing money often, it’s not because you don’t have enough indicators. It’s because you haven’t got these 3 things down:
1. TREND
Price above EMA 50 = Look for BUY opportunities
Price below EMA 50 = Look for SELL opportunities
Price touching EMA 50 = Skip, market is moving sideways
2. ENTRY
Don’t chase a price that’s already surged. Wait for a pullback to Support / EMA 21 / EMA 50. It’s better to miss a trade than to enter at a bad price.
3. MONEY MANAGEMENT
1 trade = Risk only 1–2% of your capital
Risk : Reward = At least 1 : 2
Max 2–3 open positions
A 50% win rate + a 1:2 Risk Reward = Your account is still profitable.
A 90% win rate + No Money Management = Your account can still get margin called.
Which number do you fail at most often? 1, 2, or 3? Comment below. Follow for daily signal analysis and education!!
#BelajarTrading #EdukasiTrading #MoneyManagement #crypto
If you’re still losing money often, it’s not because you don’t have enough indicators. It’s because you haven’t got these 3 things down:
1. TREND
Price above EMA 50 = Look for BUY opportunities
Price below EMA 50 = Look for SELL opportunities
Price touching EMA 50 = Skip, market is moving sideways
2. ENTRY
Don’t chase a price that’s already surged. Wait for a pullback to Support / EMA 21 / EMA 50. It’s better to miss a trade than to enter at a bad price.
3. MONEY MANAGEMENT
1 trade = Risk only 1–2% of your capital
Risk : Reward = At least 1 : 2
Max 2–3 open positions
A 50% win rate + a 1:2 Risk Reward = Your account is still profitable.
A 90% win rate + No Money Management = Your account can still get margin called.
Which number do you fail at most often? 1, 2, or 3? Comment below. Follow for daily signal analysis and education!!
#BelajarTrading #EdukasiTrading #MoneyManagement #crypto

130
Article
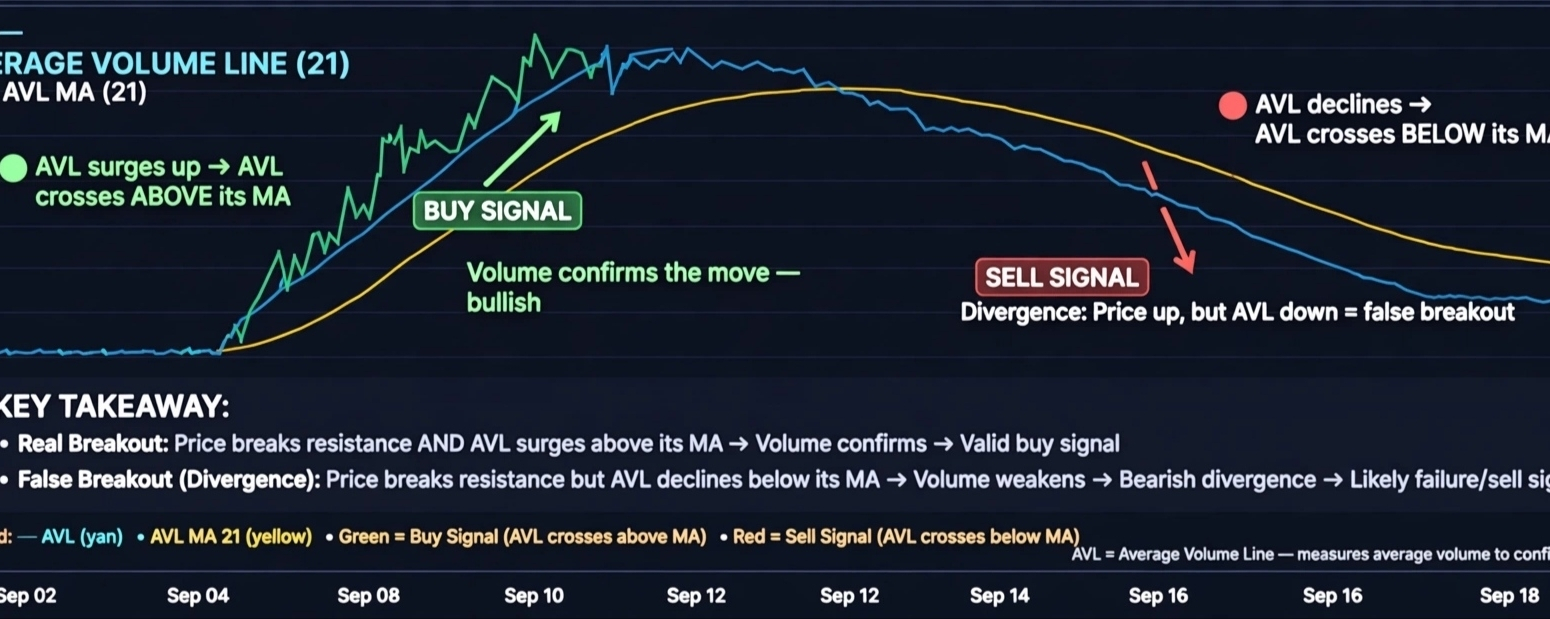
HOW TO READ THE AVL INDICATORAVL = Average Volume Line / Accumulation Volume Line — on some platforms, it’s also called the Advanced Volume Line. It works similarly to OBV, but is smoother because it uses average volume.
There’s one goal: to detect whether money is actually flowing into or out of an asset.
1. WHAT IS AVL?
AVL measures volume accumulation. The logic is simple:
- If the price rises + volume is high = Many are accumulating / buying -> AVL rises
- If the price falls + volume is high = Many are distributing / selling -> AVL falls
If the price rises but AVL is flat/falling = The rise is false and isn’t supported by volume.
HOW TO READ THE AVL INDICATOR
AVL = Average Volume Line / Accumulation Volume Line — on some platforms, it’s also called the Advanced Volume Line. It works similarly to OBV, but is smoother because it uses average volume.
There’s one goal: to detect whether money is actually flowing into or out of an asset.
1. WHAT IS AVL?
AVL measures volume accumulation. The logic is simple:
- If the price rises + volume is high = Many are accumulating / buying -> AVL rises
- If the price falls + volume is high = Many are distributing / selling -> AVL falls
If the price rises but AVL is flat/falling = The rise is false and isn’t supported by volume.
There’s one goal: to detect whether money is actually flowing into or out of an asset.
1. WHAT IS AVL?
AVL measures volume accumulation. The logic is simple:
- If the price rises + volume is high = Many are accumulating / buying -> AVL rises
- If the price falls + volume is high = Many are distributing / selling -> AVL falls
If the price rises but AVL is flat/falling = The rise is false and isn’t supported by volume.
114
Log in to explore more content
Join global crypto users on Binance Square
⚡️ Get latest and useful information about crypto.
💬 Trusted by the world’s largest crypto exchange.
👍 Discover real insights from verified creators.
Email / Phone number
Trending Topics
1
#A Packed Week of Earnings and Data Tests Markets
9,472 views
130 Discussing
2
#AnthropicIPOTestsInvestorAppetiteForAI
6,234 views
237 Discussing
3
#HuangReportedlyConsidersReturnToNvidia
27,670 views
437 Discussing
4
#CryptoSelloffTriggersMultipleWhaleLiquidations
306,522 views
2,479 Discussing
5
#BitcoinSpotETFsPost$1.065BOutflowsForThirdStraightWeek
2,821 views
64 Discussing
6
#About64000BitcoinMiningMachinesReportedlyHijacked
23,786 views
313 Discussing
7
#USSpotXRPETFsSeeLargestWeeklyOutflowIn8Months
236,199 views
1,915 Discussing
8
#WillFOMCMinutesReinforceRateHikeExpectations?
88,795 views
975 Discussing
9
#BitcoinActiveSupplyInProfitDropsBelow45%
311,599 views
2,125 Discussing
10
#KavaSaysAbnormalActivityLimitedToKavaLend
202,066 views
1,194 Discussing