
#ema25
ema25
6,619 views
9 Discussing
Hot
Latest

·
--
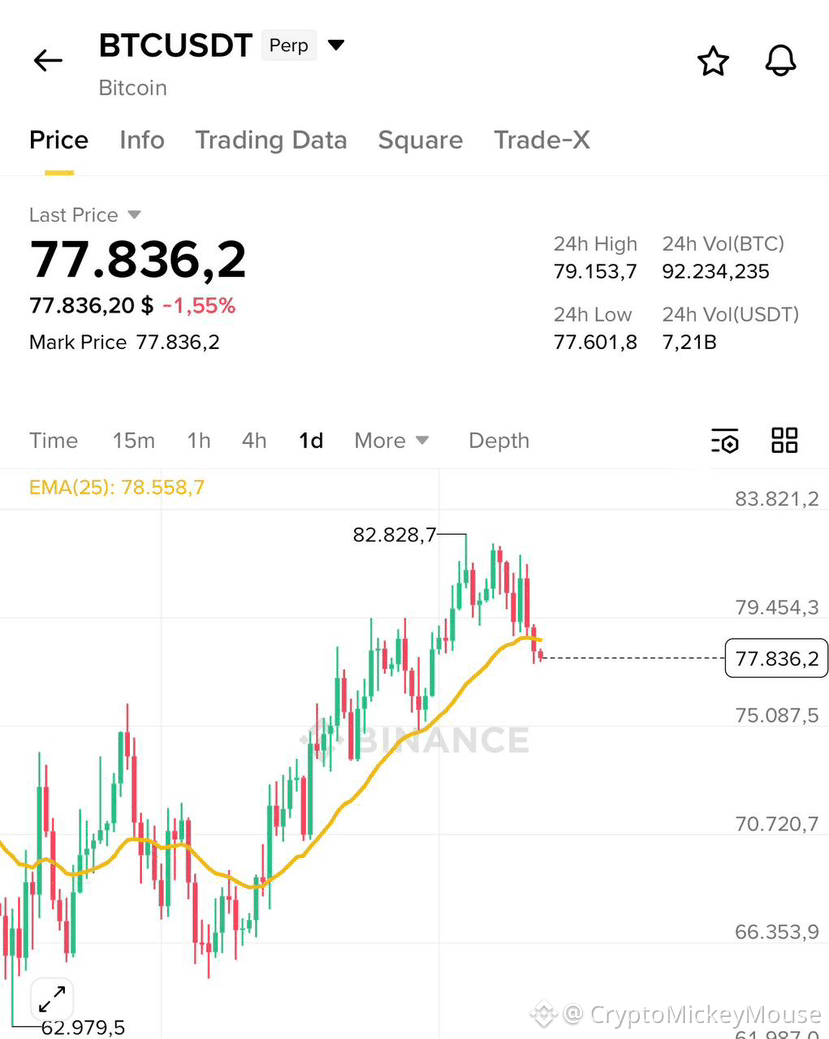
I have conducted studies of minimums and maximums over 24 hours along with the trend whether it is bearish or bullish. I rely on chart #ema25 and I am getting results.
I take small daily profits and they are adding up.
Have you tried this..?
$ADA
Follow me. Like.
I have conducted studies of minimums and maximums over 24 hours along with the trend whether it is bearish or bullish. I rely on chart #ema25 and I am getting results.
I take small daily profits and they are adding up.
Have you tried this..?
$ADA
Follow me. Like.
I take small daily profits and they are adding up.
Have you tried this..?
$ADA
Follow me. Like.
1
89


·
--
📊 A simple… but powerful strategy for reading the market!
If you’re looking for a structured way to analyze trading opportunities without relying on just one indicator, this setup is worth trying:
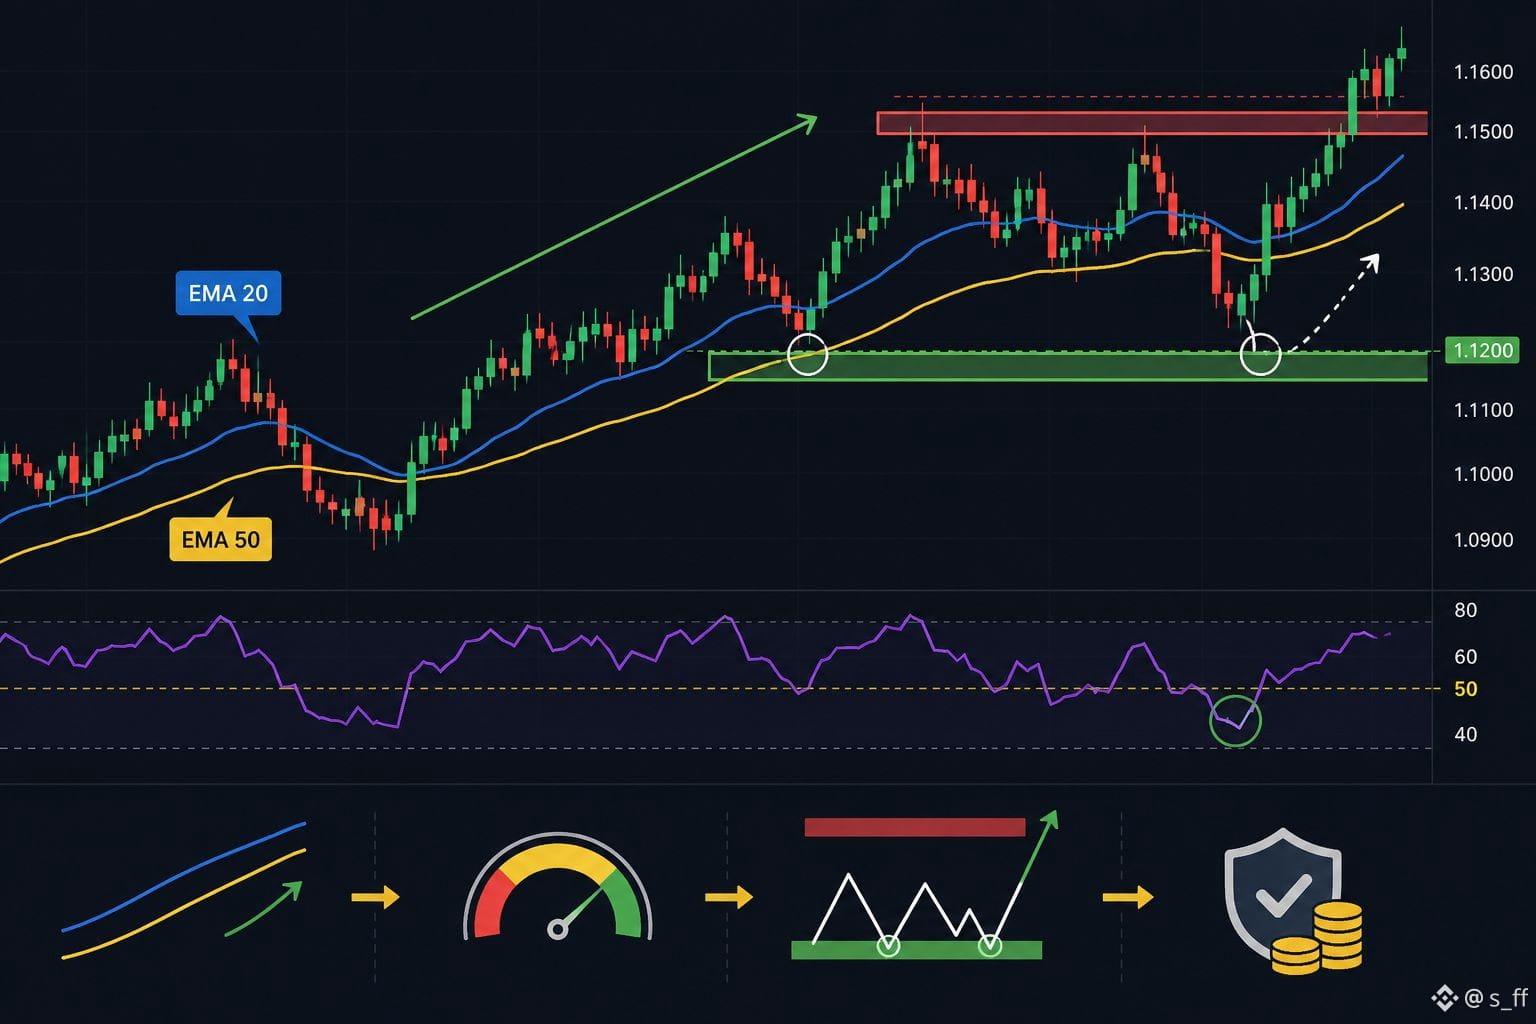
🔹 EMA 20 + EMA 50 to identify the trend
When the price is above both moving averages, and EMA 20 is higher than EMA 50, it generally reflects an upward bias.
🔹 RSI to confirm momentum
Above the 50 level suggests a relative advantage for buyers, while approaching 60 and above may indicate stronger bullish momentum.
🔹 Support and resistance to choose an entry point
Instead of chasing the price after it rises, wait for the price to pull back to a support area or retest it, then look for confirmation from price action and the RSI.
🔹 Risk management first
You can place the stop-loss below the important support zone, and adjust the position size according to the risk percentage you can tolerate.
🎯 Core idea:
It’s not about having many indicators—it’s about alignment between trend + momentum + price action + a key technical level.
⚠️ There is no strategy that guarantees profits. Test the idea historically and first on a demo account, and don’t risk more than you can afford.
Do you use EMA + RSI in your analysis? Share your thoughts 👇
#BTC #ema25 #Write2Earrn #Write2Earn! #Square
$WCT $BNB
📊 A simple… but powerful strategy for reading the market!
If you’re looking for a structured way to analyze trading opportunities without relying on just one indicator, this setup is worth trying:
🔹 EMA 20 + EMA 50 to identify the trend
When the price is above both moving averages, and EMA 20 is higher than EMA 50, it generally reflects an upward bias.
🔹 RSI to confirm momentum
Above the 50 level suggests a relative advantage for buyers, while approaching 60 and above may indicate stronger bullish momentum.
🔹 Support and resistance to choose an entry point
Instead of chasing the price after it rises, wait for the price to pull back to a support area or retest it, then look for confirmation from price action and the RSI.
🔹 Risk management first
You can place the stop-loss below the important support zone, and adjust the position size according to the risk percentage you can tolerate.
🎯 Core idea:
It’s not about having many indicators—it’s about alignment between trend + momentum + price action + a key technical level.
⚠️ There is no strategy that guarantees profits. Test the idea historically and first on a demo account, and don’t risk more than you can afford.
Do you use EMA + RSI in your analysis? Share your thoughts 👇
#BTC #ema25 #Write2Earrn #Write2Earn! #Square
$WCT $BNB
If you’re looking for a structured way to analyze trading opportunities without relying on just one indicator, this setup is worth trying:
🔹 EMA 20 + EMA 50 to identify the trend
When the price is above both moving averages, and EMA 20 is higher than EMA 50, it generally reflects an upward bias.
🔹 RSI to confirm momentum
Above the 50 level suggests a relative advantage for buyers, while approaching 60 and above may indicate stronger bullish momentum.
🔹 Support and resistance to choose an entry point
Instead of chasing the price after it rises, wait for the price to pull back to a support area or retest it, then look for confirmation from price action and the RSI.
🔹 Risk management first
You can place the stop-loss below the important support zone, and adjust the position size according to the risk percentage you can tolerate.
🎯 Core idea:
It’s not about having many indicators—it’s about alignment between trend + momentum + price action + a key technical level.
⚠️ There is no strategy that guarantees profits. Test the idea historically and first on a demo account, and don’t risk more than you can afford.
Do you use EMA + RSI in your analysis? Share your thoughts 👇
#BTC #ema25 #Write2Earrn #Write2Earn! #Square
$WCT $BNB
209
Log in to explore more content
Join global crypto users on Binance Square
⚡️ Get latest and useful information about crypto.
💬 Trusted by the world’s largest crypto exchange.
👍 Discover real insights from verified creators.
Email / Phone number
Trending Topics
1
#AnthropicIPOTestsInvestorAppetiteForAI
394 views
38 Discussing
2
#A Packed Week of Earnings and Data Tests Markets
3,044 views
55 Discussing
3
#HuangReportedlyConsidersReturnToNvidia
17,178 views
272 Discussing
4
#CryptoSelloffTriggersMultipleWhaleLiquidations
275,828 views
2,313 Discussing
5
#BitcoinSpotETFsPost$1.065BOutflowsForThirdStraightWeek
1,299 views
35 Discussing
6
#About64000BitcoinMiningMachinesReportedlyHijacked
15,531 views
207 Discussing
7
#USSpotXRPETFsSeeLargestWeeklyOutflowIn8Months
221,116 views
1,822 Discussing
8
#WillFOMCMinutesReinforceRateHikeExpectations?
83,605 views
931 Discussing
9
#BitcoinActiveSupplyInProfitDropsBelow45%
294,472 views
2,057 Discussing
10
#KavaSaysAbnormalActivityLimitedToKavaLend
193,636 views
1,170 Discussing