
#diausdt
diausdt
677,464 views
1,130 Discussing
Hot
Latest

·
--
$DIA
{future}(DIAUSDT)
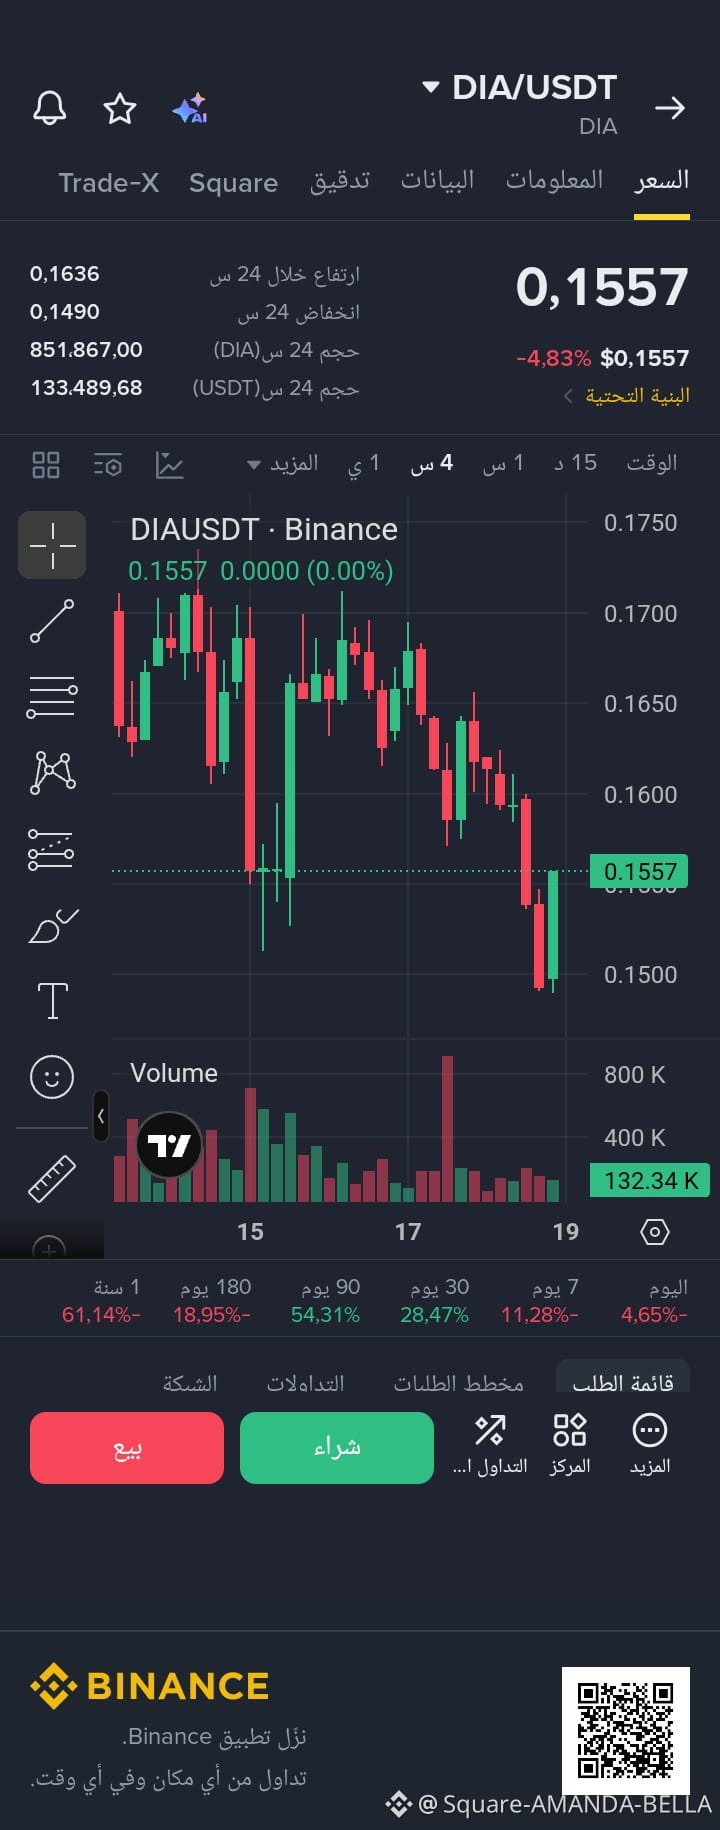
⚠️ DIA on the edge… $0.1490 under the microscope!
Technical analysis:
On the 15th, it fell from $0.1720 to $0.1520 on a frightening 700K in red volume—whale liquidations. It rebounded to $0.1720 on the 16th on weak volume, then moved slowly for 3 days. And today? It broke below $0.1600 with a long red candle and 800K in sell volume, touching the 24-hour low of $0.1490!
The numbers:
Today -4.65% / 7 days -11.28% / 30 days -28.47% / 1 year -61.14%.
Trading plan:
🔴 For short-term traders:
Entry: $0.1550 - $0.1560
Target: $0.1636 (24-hour high) = +5%
Stop: Close below $0.1490
🟢 For the patient (safer option):
Only enter above $0.1636 after a 4-hour close with green volume above 400K. Target: $0.1710.
#DIAUSDT
#AMANDABELLA
#USPPIRises6.3%YearOverYear
#BinanceVietnamSquare
$DIA
⚠️ DIA on the edge… $0.1490 under the microscope!
Technical analysis:
On the 15th, it fell from $0.1720 to $0.1520 on a frightening 700K in red volume—whale liquidations. It rebounded to $0.1720 on the 16th on weak volume, then moved slowly for 3 days. And today? It broke below $0.1600 with a long red candle and 800K in sell volume, touching the 24-hour low of $0.1490!
The numbers:
Today -4.65% / 7 days -11.28% / 30 days -28.47% / 1 year -61.14%.
Trading plan:
🔴 For short-term traders:
Entry: $0.1550 - $0.1560
Target: $0.1636 (24-hour high) = +5%
Stop: Close below $0.1490
🟢 For the patient (safer option):
Only enter above $0.1636 after a 4-hour close with green volume above 400K. Target: $0.1710.
#DIAUSDT
#AMANDABELLA
#USPPIRises6.3%YearOverYear
#BinanceVietnamSquare
⚠️ DIA on the edge… $0.1490 under the microscope!
Technical analysis:
On the 15th, it fell from $0.1720 to $0.1520 on a frightening 700K in red volume—whale liquidations. It rebounded to $0.1720 on the 16th on weak volume, then moved slowly for 3 days. And today? It broke below $0.1600 with a long red candle and 800K in sell volume, touching the 24-hour low of $0.1490!
The numbers:
Today -4.65% / 7 days -11.28% / 30 days -28.47% / 1 year -61.14%.
Trading plan:
🔴 For short-term traders:
Entry: $0.1550 - $0.1560
Target: $0.1636 (24-hour high) = +5%
Stop: Close below $0.1490
🟢 For the patient (safer option):
Only enter above $0.1636 after a 4-hour close with green volume above 400K. Target: $0.1710.
#DIAUSDT
#AMANDABELLA
#USPPIRises6.3%YearOverYear
#BinanceVietnamSquare
2
53
·
--
🕯️ The green candlelight has gone out, giving way to the dark night of a lonely losing streak.
⚡ SHORT $DIA
Entry: 0.175
TP: 0.167 | SL: 0.193
🧼 Stay alert and choose projects that offer real value.
📈 The price is moving into a liquidity vacuum, which could accelerate its rise.
🛡️ Protect your reputation and credibility just as you protect your exchange account.
🌸 May your persistence and hard work bring you a bountiful harvest.
#DIAUSDT $DIAUSDT
🕯️ The green candlelight has gone out, giving way to the dark night of a lonely losing streak.
⚡ SHORT $DIA
Entry: 0.175
TP: 0.167 | SL: 0.193
🧼 Stay alert and choose projects that offer real value.
📈 The price is moving into a liquidity vacuum, which could accelerate its rise.
🛡️ Protect your reputation and credibility just as you protect your exchange account.
🌸 May your persistence and hard work bring you a bountiful harvest.
#DIAUSDT $DIAUSDT
⚡ SHORT $DIA
Entry: 0.175
TP: 0.167 | SL: 0.193
🧼 Stay alert and choose projects that offer real value.
📈 The price is moving into a liquidity vacuum, which could accelerate its rise.
🛡️ Protect your reputation and credibility just as you protect your exchange account.
🌸 May your persistence and hard work bring you a bountiful harvest.
#DIAUSDT $DIAUSDT
46

·
--
Bullish
Ever looked at an oracle price and wondered where it actually came from?
A number appearing onchain is only part of the story. Where the data originated, how it was processed, and how the final value was delivered all matter.
#DIAUSDT makes these steps transparent. Here’s how the process works.
1. Sources: Where the data begins
It starts with market data from exchanges and other sources. DIA collects data at the source level, helping users understand where a reported price originates.
2. Processing: Separating signal from noise
Raw market data can contain outliers, inconsistent prices and unusual trades. Aggregation, filtering and validation methods help turn that raw information into a usable price.
3. Methodology: Understanding the calculation
How is the final price calculated? Which formula and parameters are used? $DIA makes its methodologies inspectable, giving developers and risk teams more visibility into the assumptions behind a feed.
4. Feed: Delivering the result
The processed value is published through an oracle feed with a defined update frequency, allowing smart contracts to access the data they need.
5. Onchain verification: Making the data usable
The feed is delivered to the target blockchain, where applications can read it. Developers can inspect the relevant contracts and trace the data infrastructure behind the feed.
Why does this matter?
Lending protocols use prices to assess collateral. Stablecoin systems may rely on them for collateral checks. Derivatives platforms need reference prices to manage positions and liquidations.
When markets become volatile, the quality and transparency of that data matter even more.
An #Oracle price shouldn’t just be a number you accept. You should be able to understand how it was produced.
Ever looked at an oracle price and wondered where it actually came from?
A number appearing onchain is only part of the story. Where the data originated, how it was processed, and how the final value was delivered all matter.
#DIAUSDT makes these steps transparent. Here’s how the process works.
1. Sources: Where the data begins
It starts with market data from exchanges and other sources. DIA collects data at the source level, helping users understand where a reported price originates.
2. Processing: Separating signal from noise
Raw market data can contain outliers, inconsistent prices and unusual trades. Aggregation, filtering and validation methods help turn that raw information into a usable price.
3. Methodology: Understanding the calculation
How is the final price calculated? Which formula and parameters are used? $DIA makes its methodologies inspectable, giving developers and risk teams more visibility into the assumptions behind a feed.
4. Feed: Delivering the result
The processed value is published through an oracle feed with a defined update frequency, allowing smart contracts to access the data they need.
5. Onchain verification: Making the data usable
The feed is delivered to the target blockchain, where applications can read it. Developers can inspect the relevant contracts and trace the data infrastructure behind the feed.
Why does this matter?
Lending protocols use prices to assess collateral. Stablecoin systems may rely on them for collateral checks. Derivatives platforms need reference prices to manage positions and liquidations.
When markets become volatile, the quality and transparency of that data matter even more.
An #Oracle price shouldn’t just be a number you accept. You should be able to understand how it was produced.
A number appearing onchain is only part of the story. Where the data originated, how it was processed, and how the final value was delivered all matter.
#DIAUSDT makes these steps transparent. Here’s how the process works.
1. Sources: Where the data begins
It starts with market data from exchanges and other sources. DIA collects data at the source level, helping users understand where a reported price originates.
2. Processing: Separating signal from noise
Raw market data can contain outliers, inconsistent prices and unusual trades. Aggregation, filtering and validation methods help turn that raw information into a usable price.
3. Methodology: Understanding the calculation
How is the final price calculated? Which formula and parameters are used? $DIA makes its methodologies inspectable, giving developers and risk teams more visibility into the assumptions behind a feed.
4. Feed: Delivering the result
The processed value is published through an oracle feed with a defined update frequency, allowing smart contracts to access the data they need.
5. Onchain verification: Making the data usable
The feed is delivered to the target blockchain, where applications can read it. Developers can inspect the relevant contracts and trace the data infrastructure behind the feed.
Why does this matter?
Lending protocols use prices to assess collateral. Stablecoin systems may rely on them for collateral checks. Derivatives platforms need reference prices to manage positions and liquidations.
When markets become volatile, the quality and transparency of that data matter even more.
An #Oracle price shouldn’t just be a number you accept. You should be able to understand how it was produced.

1
204

·
--
Bullish
Verified
I've written a lot about DIA's technology, but there's another side I think deserves attention: the people and infrastructure behind the project.
Here's what I've noticed while researching DIA.
The team: $DIA
{future}(DIAUSDT)
contributors publish technical articles about oracle architecture and how onchain finance may converge with traditional financial data.
The feeder network: DIA reported more than 10 independent feeder operators in June 2026, including Stakin, Blockscape, Liquify and Chainbase.
That's important because oracle infrastructure involves more than a smart contract delivering a number. The data-sourcing network matters too.
The integrations: DIA works with DeFi protocols including Euler, Morpho and Silo. These integrations show that its infrastructure is being used, although sustained usage and adoption are what ultimately matter.
The stakers: DIA reported around 4.4M DIA staked in June 2026. The network has also moved beyond its initial Genesis staking incentives toward a variable reward model targeting approximately 5–6% APY at the reported stake level.
None of these points guarantees that DIA will succeed.
A project can have capable contributors and useful technology without achieving widespread adoption. A large staking figure doesn't guarantee token-price appreciation either.
But these are the kinds of indicators I prefer to follow:
→ Who is building?
→ Who is operating the infrastructure?
→ Which protocols are using it?
→ Is participation continuing?
→ Is adoption expanding?
I'm not looking for the loudest crypto community.
I'm looking for evidence that the ecosystem is developing beyond the narrative.
For DIA, the real test is turning that foundation into sustained growth. #DIAUSDT
I've written a lot about DIA's technology, but there's another side I think deserves attention: the people and infrastructure behind the project.
Here's what I've noticed while researching DIA.
The team: $DIA
contributors publish technical articles about oracle architecture and how onchain finance may converge with traditional financial data.
The feeder network: DIA reported more than 10 independent feeder operators in June 2026, including Stakin, Blockscape, Liquify and Chainbase.
That's important because oracle infrastructure involves more than a smart contract delivering a number. The data-sourcing network matters too.
The integrations: DIA works with DeFi protocols including Euler, Morpho and Silo. These integrations show that its infrastructure is being used, although sustained usage and adoption are what ultimately matter.
The stakers: DIA reported around 4.4M DIA staked in June 2026. The network has also moved beyond its initial Genesis staking incentives toward a variable reward model targeting approximately 5–6% APY at the reported stake level.
None of these points guarantees that DIA will succeed.
A project can have capable contributors and useful technology without achieving widespread adoption. A large staking figure doesn't guarantee token-price appreciation either.
But these are the kinds of indicators I prefer to follow:
→ Who is building?
→ Who is operating the infrastructure?
→ Which protocols are using it?
→ Is participation continuing?
→ Is adoption expanding?
I'm not looking for the loudest crypto community.
I'm looking for evidence that the ecosystem is developing beyond the narrative.
For DIA, the real test is turning that foundation into sustained growth. #DIAUSDT
Here's what I've noticed while researching DIA.
The team: $DIA
contributors publish technical articles about oracle architecture and how onchain finance may converge with traditional financial data.
The feeder network: DIA reported more than 10 independent feeder operators in June 2026, including Stakin, Blockscape, Liquify and Chainbase.
That's important because oracle infrastructure involves more than a smart contract delivering a number. The data-sourcing network matters too.
The integrations: DIA works with DeFi protocols including Euler, Morpho and Silo. These integrations show that its infrastructure is being used, although sustained usage and adoption are what ultimately matter.
The stakers: DIA reported around 4.4M DIA staked in June 2026. The network has also moved beyond its initial Genesis staking incentives toward a variable reward model targeting approximately 5–6% APY at the reported stake level.
None of these points guarantees that DIA will succeed.
A project can have capable contributors and useful technology without achieving widespread adoption. A large staking figure doesn't guarantee token-price appreciation either.
But these are the kinds of indicators I prefer to follow:
→ Who is building?
→ Who is operating the infrastructure?
→ Which protocols are using it?
→ Is participation continuing?
→ Is adoption expanding?
I'm not looking for the loudest crypto community.
I'm looking for evidence that the ecosystem is developing beyond the narrative.
For DIA, the real test is turning that foundation into sustained growth. #DIAUSDT

150
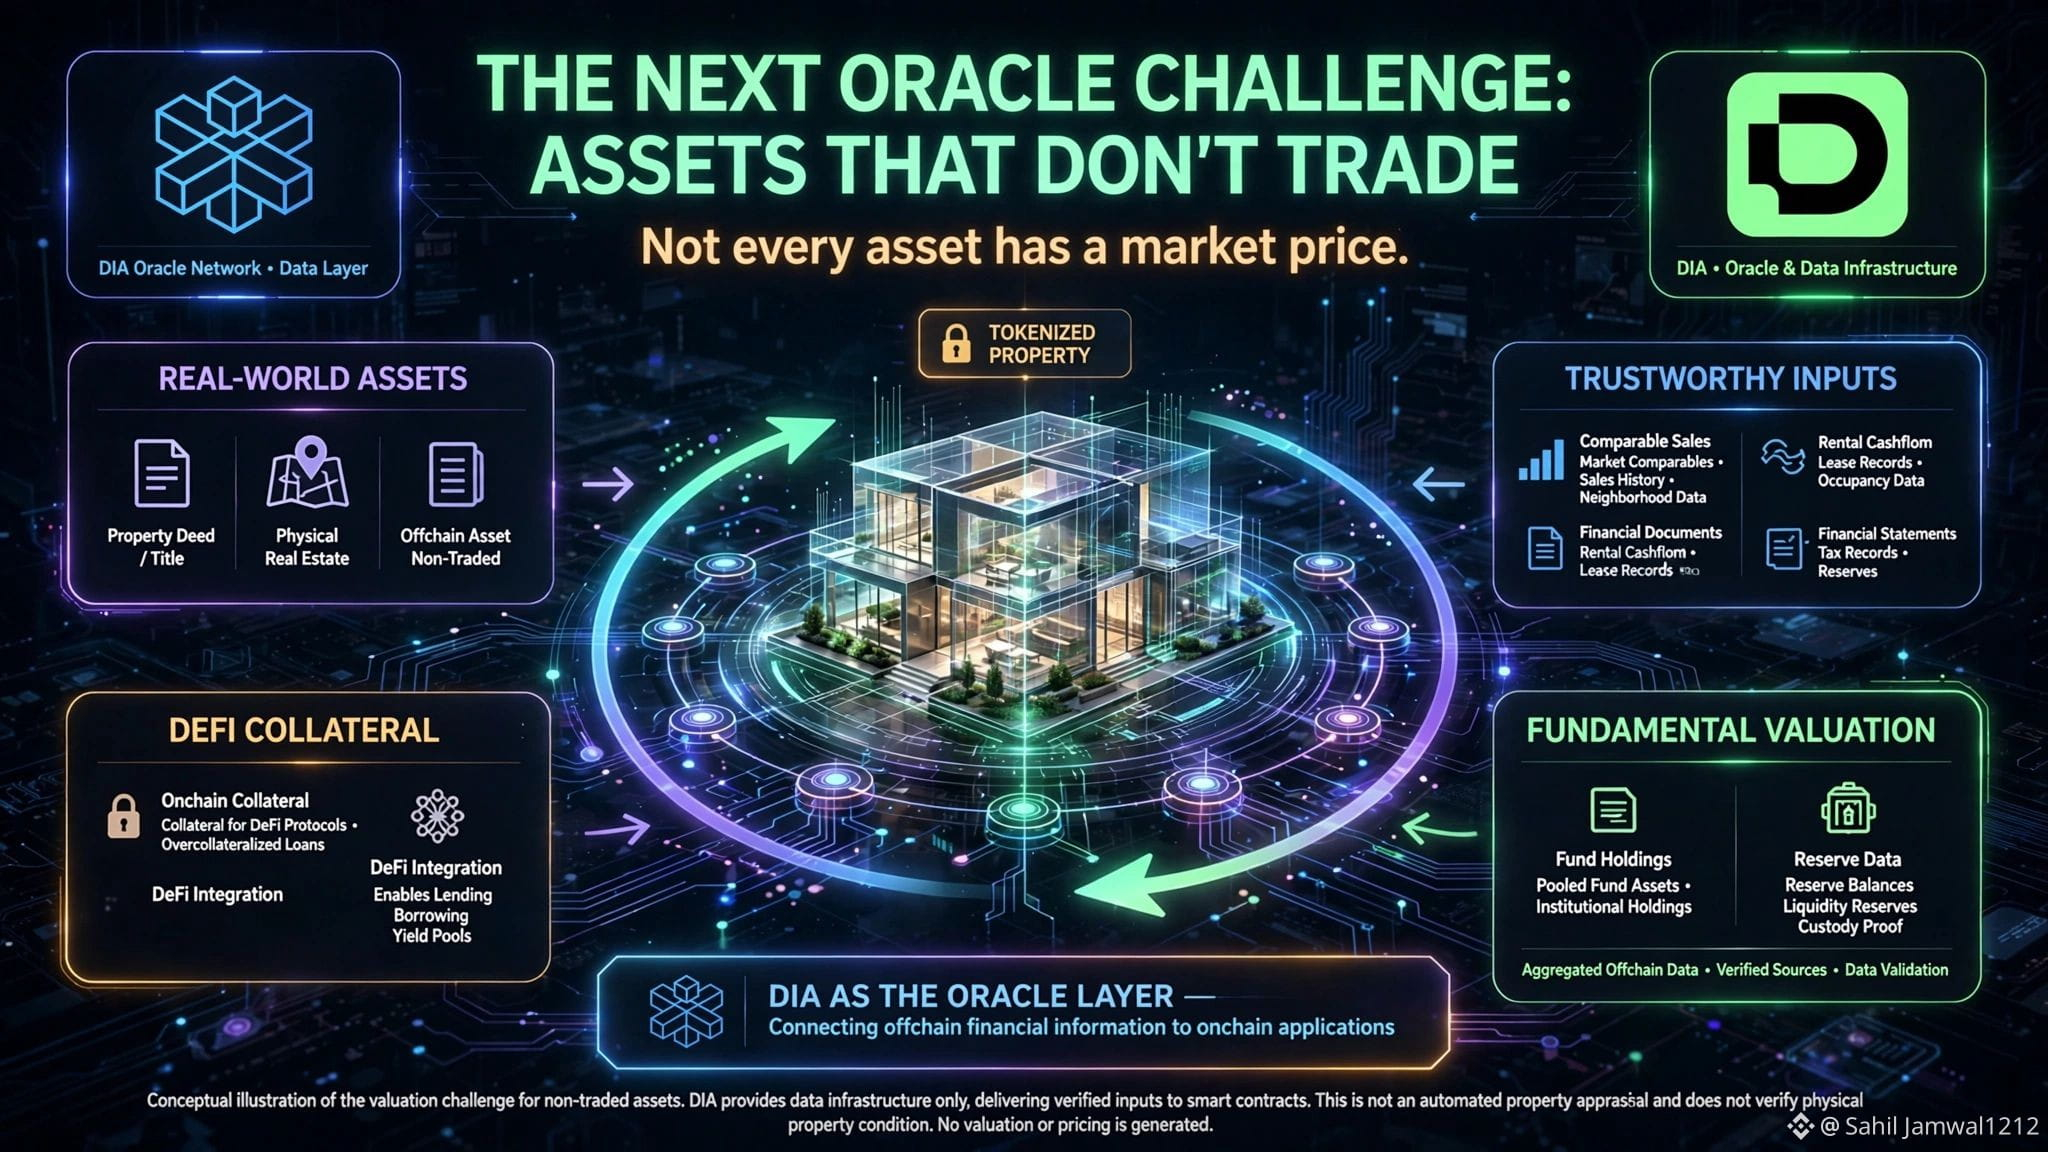
What happens when a DeFi protocol needs to price something that barely trades?
Here's a thought experiment.
A tokenized property is valued at $2M.
It hasn't sold in six months. Comparable properties suggest a value between $1.8M and $2.2M.
Now imagine a lending protocol wants to accept the tokenized property as collateral.
Where does the oracle get its price?
If there's no active market, simply aggregating trades won't solve the problem.
This is why I'm interested in DIA Value.
#DIAUSDT supports fundamental valuation methods such as NAV, redemption value, contract exchange rates and Proof of Reserves.
These approaches can help price assets based on their underlying value or mechanics rather than relying entirely on secondary-market activity.
Of course, real-estate valuation would need credible property data and an appropriate appraisal model. An oracle cannot magically determine the correct value of a building.
But the underlying challenge is important.
As more funds, securities and other real-world assets move onchain, some won't have deep liquidity or continuous trading.
Protocols will still need to assess their value before using them in lending, collateralization or other financial applications.
That's the shift I'm watching: from reporting market prices to supporting fundamental asset valuation.
$DIA
{spot}(DIAUSDT)
{future}(DIAUSDT)
isn't guaranteed to win this market, but I think the problem it's addressing deserves more attention.
DYOR. Not financial advice.
What happens when a DeFi protocol needs to price something that barely trades?
Here's a thought experiment.
A tokenized property is valued at $2M.
It hasn't sold in six months. Comparable properties suggest a value between $1.8M and $2.2M.
Now imagine a lending protocol wants to accept the tokenized property as collateral.
Where does the oracle get its price?
If there's no active market, simply aggregating trades won't solve the problem.
This is why I'm interested in DIA Value.
#DIAUSDT supports fundamental valuation methods such as NAV, redemption value, contract exchange rates and Proof of Reserves.
These approaches can help price assets based on their underlying value or mechanics rather than relying entirely on secondary-market activity.
Of course, real-estate valuation would need credible property data and an appropriate appraisal model. An oracle cannot magically determine the correct value of a building.
But the underlying challenge is important.
As more funds, securities and other real-world assets move onchain, some won't have deep liquidity or continuous trading.
Protocols will still need to assess their value before using them in lending, collateralization or other financial applications.
That's the shift I'm watching: from reporting market prices to supporting fundamental asset valuation.
$DIA
isn't guaranteed to win this market, but I think the problem it's addressing deserves more attention.
DYOR. Not financial advice.
Here's a thought experiment.
A tokenized property is valued at $2M.
It hasn't sold in six months. Comparable properties suggest a value between $1.8M and $2.2M.
Now imagine a lending protocol wants to accept the tokenized property as collateral.
Where does the oracle get its price?
If there's no active market, simply aggregating trades won't solve the problem.
This is why I'm interested in DIA Value.
#DIAUSDT supports fundamental valuation methods such as NAV, redemption value, contract exchange rates and Proof of Reserves.
These approaches can help price assets based on their underlying value or mechanics rather than relying entirely on secondary-market activity.
Of course, real-estate valuation would need credible property data and an appropriate appraisal model. An oracle cannot magically determine the correct value of a building.
But the underlying challenge is important.
As more funds, securities and other real-world assets move onchain, some won't have deep liquidity or continuous trading.
Protocols will still need to assess their value before using them in lending, collateralization or other financial applications.
That's the shift I'm watching: from reporting market prices to supporting fundamental asset valuation.
$DIA
isn't guaranteed to win this market, but I think the problem it's addressing deserves more attention.
DYOR. Not financial advice.
198


·
--
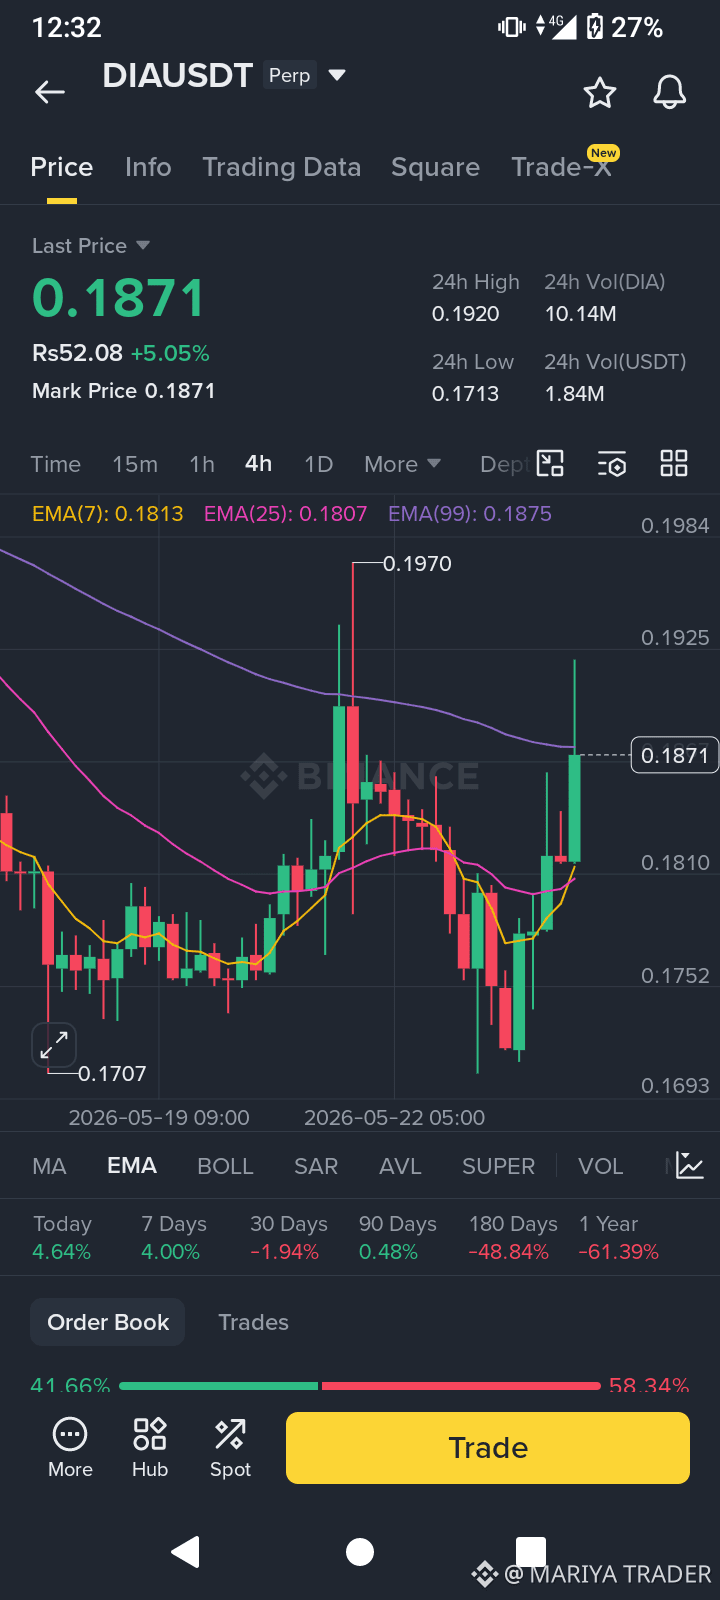
$DIA 24h rose 47.352%, current price 0.1447. Macro liquidity and micro chase-for-rallies are resonating, but the funding rate is -0.00018272 and OI is 26694417; shorts are crowded, so there is still a risk of a two-way liquidation cascade. Political, military, and other global breaking news may amplify volatility—don’t get pulled along by X KOLs or Trump’s remarks. Action: Don’t chase the price up; wait for a pullback to confirm, and use a small position size with strict stop-loss.
Trading tags:#Crypto #合约交易 #DIAUSDT #LINK
DIA What do you think is next?
$DIA 24h rose 47.352%, current price 0.1447. Macro liquidity and micro chase-for-rallies are resonating, but the funding rate is -0.00018272 and OI is 26694417; shorts are crowded, so there is still a risk of a two-way liquidation cascade. Political, military, and other global breaking news may amplify volatility—don’t get pulled along by X KOLs or Trump’s remarks. Action: Don’t chase the price up; wait for a pullback to confirm, and use a small position size with strict stop-loss.
Trading tags:#Crypto #合约交易 #DIAUSDT #LINK
DIA What do you think is next?
Trading tags:#Crypto #合约交易 #DIAUSDT #LINK
DIA What do you think is next?
2
209

·
--
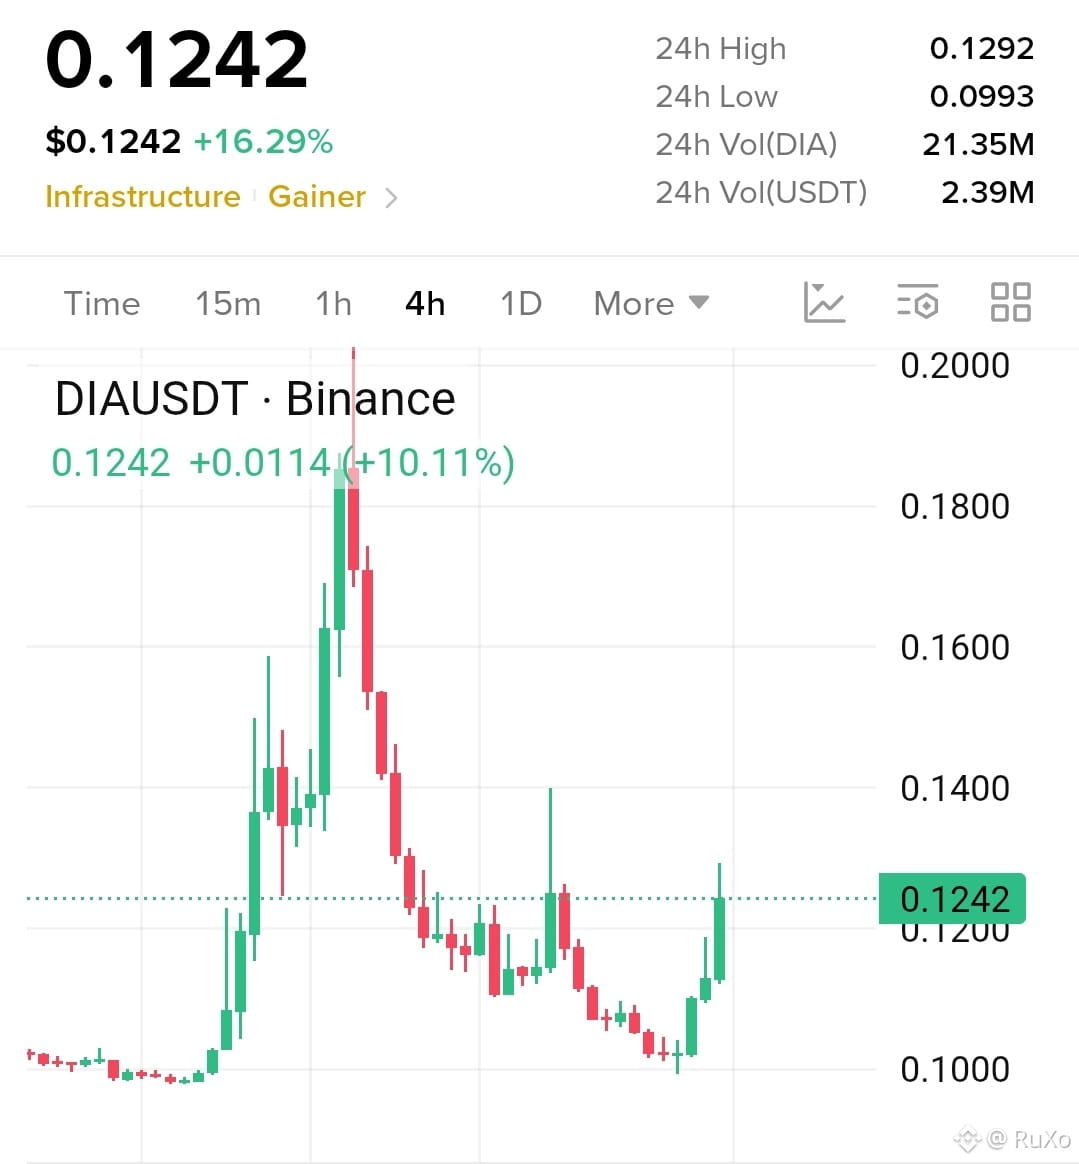
🚀 $DIA up +16.29% & pushing towards $0.1242! 👀🔥
4H chart lowkey pushing back up after bouncing off 24h lows of $0.0993 towards high of $0.1292! Lock in your parameters:
🟢 LONG: Close ABOVE $0.1300 🎯 TP: $0.1450 | $0.1650+ 🚀 🛑 SL: $0.1160
🔴 SHORT: Close BELOW $0.1150 🎯 TP: $0.1040 | $0.0950- 📉 🛑 SL: $0.1260
Manage your risk & DYOR! 📊⚡
{future}(DIAUSDT)
➡️ CLICK $DIA BELOW TO TRADE ⬅️
#DIAUSDT #DIA #BinanceSquare #CryptoTrading #Gainer
🚀 $DIA up +16.29% & pushing towards $0.1242! 👀🔥
4H chart lowkey pushing back up after bouncing off 24h lows of $0.0993 towards high of $0.1292! Lock in your parameters:
🟢 LONG: Close ABOVE $0.1300 🎯 TP: $0.1450 | $0.1650+ 🚀 🛑 SL: $0.1160
🔴 SHORT: Close BELOW $0.1150 🎯 TP: $0.1040 | $0.0950- 📉 🛑 SL: $0.1260
Manage your risk & DYOR! 📊⚡
➡️ CLICK $DIA BELOW TO TRADE ⬅️
#DIAUSDT #DIA #BinanceSquare #CryptoTrading #Gainer
4H chart lowkey pushing back up after bouncing off 24h lows of $0.0993 towards high of $0.1292! Lock in your parameters:
🟢 LONG: Close ABOVE $0.1300 🎯 TP: $0.1450 | $0.1650+ 🚀 🛑 SL: $0.1160
🔴 SHORT: Close BELOW $0.1150 🎯 TP: $0.1040 | $0.0950- 📉 🛑 SL: $0.1260
Manage your risk & DYOR! 📊⚡
➡️ CLICK $DIA BELOW TO TRADE ⬅️
#DIAUSDT #DIA #BinanceSquare #CryptoTrading #Gainer
430

DIA is poised for a downturn after breaking market structure, with key levels now in focus. A short setup is emerging, driven by a confluence of technical signals.
━━━━━━━━━━━━━━━━━━━━━
🔴 $DIA SHORT 📉
━━━━━━━━━━━━━━━━━━━━━
📍 Entry Range: $0.111389 – $0.111611
🛑 Stop Loss: $0.114845 (-3.0%)
🎯 TP1: $0.109827 (+1.5%)
🏆 TP2: $0.105925 (+5.0%)
⚡ R/R Ratio: 1:1.7
📊 Confidence: 91%
━━━━━━━━━━━━━━━━━━━━━
The CHoCH signal fired on the break of market structure, while CVD confirmed the direction with volume. FVG and OB are also in play, with a liquidity sweep and POI confluence adding weight to this zone, making it a high-confidence short setup.
A 3.0% stop loss is relatively tight, suggesting moderate to high leverage may be necessary to maximize returns on this trade.
Consider taking partial profits at the first target to lock in gains, as the price action could become choppy around the next level of support.
Not financial advice — always manage your own risk 🙏
$DIA #DIAUSDT #SMC #TradingSignals #Write2Earn
DIA is poised for a downturn after breaking market structure, with key levels now in focus. A short setup is emerging, driven by a confluence of technical signals.
━━━━━━━━━━━━━━━━━━━━━
🔴 $DIA SHORT 📉
━━━━━━━━━━━━━━━━━━━━━
📍 Entry Range: $0.111389 – $0.111611
🛑 Stop Loss: $0.114845 (-3.0%)
🎯 TP1: $0.109827 (+1.5%)
🏆 TP2: $0.105925 (+5.0%)
⚡ R/R Ratio: 1:1.7
📊 Confidence: 91%
━━━━━━━━━━━━━━━━━━━━━
The CHoCH signal fired on the break of market structure, while CVD confirmed the direction with volume. FVG and OB are also in play, with a liquidity sweep and POI confluence adding weight to this zone, making it a high-confidence short setup.
A 3.0% stop loss is relatively tight, suggesting moderate to high leverage may be necessary to maximize returns on this trade.
Consider taking partial profits at the first target to lock in gains, as the price action could become choppy around the next level of support.
Not financial advice — always manage your own risk 🙏
$DIA #DIAUSDT #SMC #TradingSignals #Write2Earn
━━━━━━━━━━━━━━━━━━━━━
🔴 $DIA SHORT 📉
━━━━━━━━━━━━━━━━━━━━━
📍 Entry Range: $0.111389 – $0.111611
🛑 Stop Loss: $0.114845 (-3.0%)
🎯 TP1: $0.109827 (+1.5%)
🏆 TP2: $0.105925 (+5.0%)
⚡ R/R Ratio: 1:1.7
📊 Confidence: 91%
━━━━━━━━━━━━━━━━━━━━━
The CHoCH signal fired on the break of market structure, while CVD confirmed the direction with volume. FVG and OB are also in play, with a liquidity sweep and POI confluence adding weight to this zone, making it a high-confidence short setup.
A 3.0% stop loss is relatively tight, suggesting moderate to high leverage may be necessary to maximize returns on this trade.
Consider taking partial profits at the first target to lock in gains, as the price action could become choppy around the next level of support.
Not financial advice — always manage your own risk 🙏
$DIA #DIAUSDT #SMC #TradingSignals #Write2Earn
1
61

🚀 DIA/USDT Opportunity Analysis: Is a Rebound Approaching? 📊
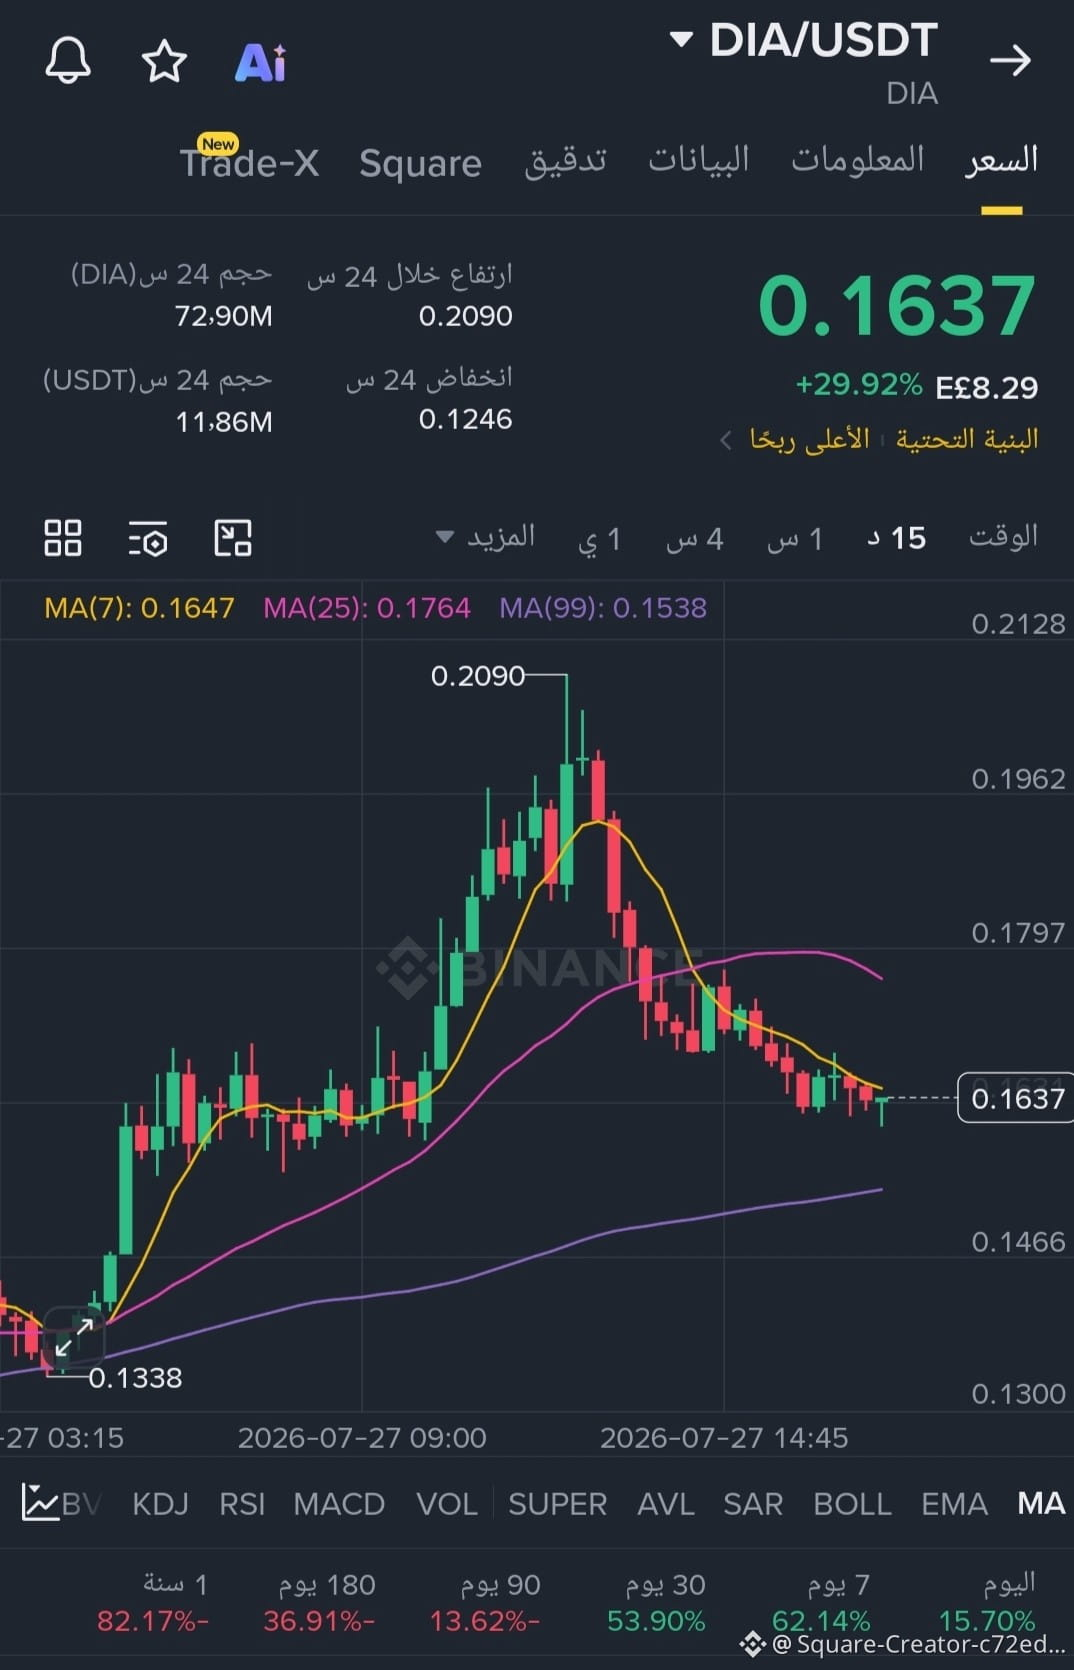
DIA is showing strong positive momentum with a rise of over 29% during the past 24 hours, having hit a peak at $0.2090 before entering a healthy correction phase to reach the current $0.1637 area.
Despite the recent pullback on the 15-minute timeframe, the price is holding near the MA(99) moving average at $0.1538, making this area a key support zone from which the upward trend may resume.
💡 My technical view on entry and exit zones:
🔹 Ideal entry price: seize the opportunity between $0.1550–$0.1600 near strong support levels to reduce risk.
🎯 Take-profit targets:
First target: $0.1800
Second target: $0.2050 (near the recent high).
🛑 Stop loss: a candle close below $0.1450.
⚠️ Note: Trading involves risk—always manage your capital carefully.
👇 Share your opinion in the comments: Do you think the coin will continue rising to break the $0.2090 high, or will the correction continue? And don’t forget to follow the page to get the latest analyses and opportunities as soon as they happen! 🔔📈 #DIAUSDT #Write2Earn #Write2Earn! #WIF $DIA
🚀 DIA/USDT Opportunity Analysis: Is a Rebound Approaching? 📊
DIA is showing strong positive momentum with a rise of over 29% during the past 24 hours, having hit a peak at $0.2090 before entering a healthy correction phase to reach the current $0.1637 area.
Despite the recent pullback on the 15-minute timeframe, the price is holding near the MA(99) moving average at $0.1538, making this area a key support zone from which the upward trend may resume.
💡 My technical view on entry and exit zones:
🔹 Ideal entry price: seize the opportunity between $0.1550–$0.1600 near strong support levels to reduce risk.
🎯 Take-profit targets:
First target: $0.1800
Second target: $0.2050 (near the recent high).
🛑 Stop loss: a candle close below $0.1450.
⚠️ Note: Trading involves risk—always manage your capital carefully.
👇 Share your opinion in the comments: Do you think the coin will continue rising to break the $0.2090 high, or will the correction continue? And don’t forget to follow the page to get the latest analyses and opportunities as soon as they happen! 🔔📈 #DIAUSDT #Write2Earn #Write2Earn! #WIF $DIA
DIA is showing strong positive momentum with a rise of over 29% during the past 24 hours, having hit a peak at $0.2090 before entering a healthy correction phase to reach the current $0.1637 area.
Despite the recent pullback on the 15-minute timeframe, the price is holding near the MA(99) moving average at $0.1538, making this area a key support zone from which the upward trend may resume.
💡 My technical view on entry and exit zones:
🔹 Ideal entry price: seize the opportunity between $0.1550–$0.1600 near strong support levels to reduce risk.
🎯 Take-profit targets:
First target: $0.1800
Second target: $0.2050 (near the recent high).
🛑 Stop loss: a candle close below $0.1450.
⚠️ Note: Trading involves risk—always manage your capital carefully.
👇 Share your opinion in the comments: Do you think the coin will continue rising to break the $0.2090 high, or will the correction continue? And don’t forget to follow the page to get the latest analyses and opportunities as soon as they happen! 🔔📈 #DIAUSDT #Write2Earn #Write2Earn! #WIF $DIA
3
179

·
--
$DIAUSDT Explosive Pump Alert + TRADE FORECAST 🚀
$DIA just ripped +27.89% in 24h, hitting 0.1828 high and currently sitting at 0.1738! Volume exploded (1.08B DIA / 159M USDT) on a massive green daily candle that smashed through every resistance.
Indicators scream momentum but extreme overbought: RSI(6) 94.6 / RSI(14) 84.4, price way above EMA8/13/21 and Bollinger upper band (0.1425). Stochastic J at 90.8 shows stretched conditions.
TRADE FORECAST (Short-term mean-reversion):
Open SHORT near 0.1735–0.1740
🎯 Take Profit: 0.1520
🛑 Stop Loss: 0.1850
Risk managed for potential pullback toward the middle Bollinger / EMA cluster while momentum cools. High volume confirms the move was real — now watch for profit-taking.
Trade $DIA / USDT Now! Follow & turn 🔔 on ✅ Don’t miss the next leg!
#DIA #DIAUSDT #Binance #Crypto #Altcoins #Trading #CryptoTrading #BinanceSquare #TechnicalAnalysis #DeFi
$DIAUSDT Explosive Pump Alert + TRADE FORECAST 🚀
$DIA just ripped +27.89% in 24h, hitting 0.1828 high and currently sitting at 0.1738! Volume exploded (1.08B DIA / 159M USDT) on a massive green daily candle that smashed through every resistance.
Indicators scream momentum but extreme overbought: RSI(6) 94.6 / RSI(14) 84.4, price way above EMA8/13/21 and Bollinger upper band (0.1425). Stochastic J at 90.8 shows stretched conditions.
TRADE FORECAST (Short-term mean-reversion):
Open SHORT near 0.1735–0.1740
🎯 Take Profit: 0.1520
🛑 Stop Loss: 0.1850
Risk managed for potential pullback toward the middle Bollinger / EMA cluster while momentum cools. High volume confirms the move was real — now watch for profit-taking.
Trade $DIA / USDT Now! Follow & turn 🔔 on ✅ Don’t miss the next leg!
#DIA #DIAUSDT #Binance #Crypto #Altcoins #Trading #CryptoTrading #BinanceSquare #TechnicalAnalysis #DeFi
$DIA just ripped +27.89% in 24h, hitting 0.1828 high and currently sitting at 0.1738! Volume exploded (1.08B DIA / 159M USDT) on a massive green daily candle that smashed through every resistance.
Indicators scream momentum but extreme overbought: RSI(6) 94.6 / RSI(14) 84.4, price way above EMA8/13/21 and Bollinger upper band (0.1425). Stochastic J at 90.8 shows stretched conditions.
TRADE FORECAST (Short-term mean-reversion):
Open SHORT near 0.1735–0.1740
🎯 Take Profit: 0.1520
🛑 Stop Loss: 0.1850
Risk managed for potential pullback toward the middle Bollinger / EMA cluster while momentum cools. High volume confirms the move was real — now watch for profit-taking.
Trade $DIA / USDT Now! Follow & turn 🔔 on ✅ Don’t miss the next leg!
#DIA #DIAUSDT #Binance #Crypto #Altcoins #Trading #CryptoTrading #BinanceSquare #TechnicalAnalysis #DeFi

2
286

·
--
Bullish
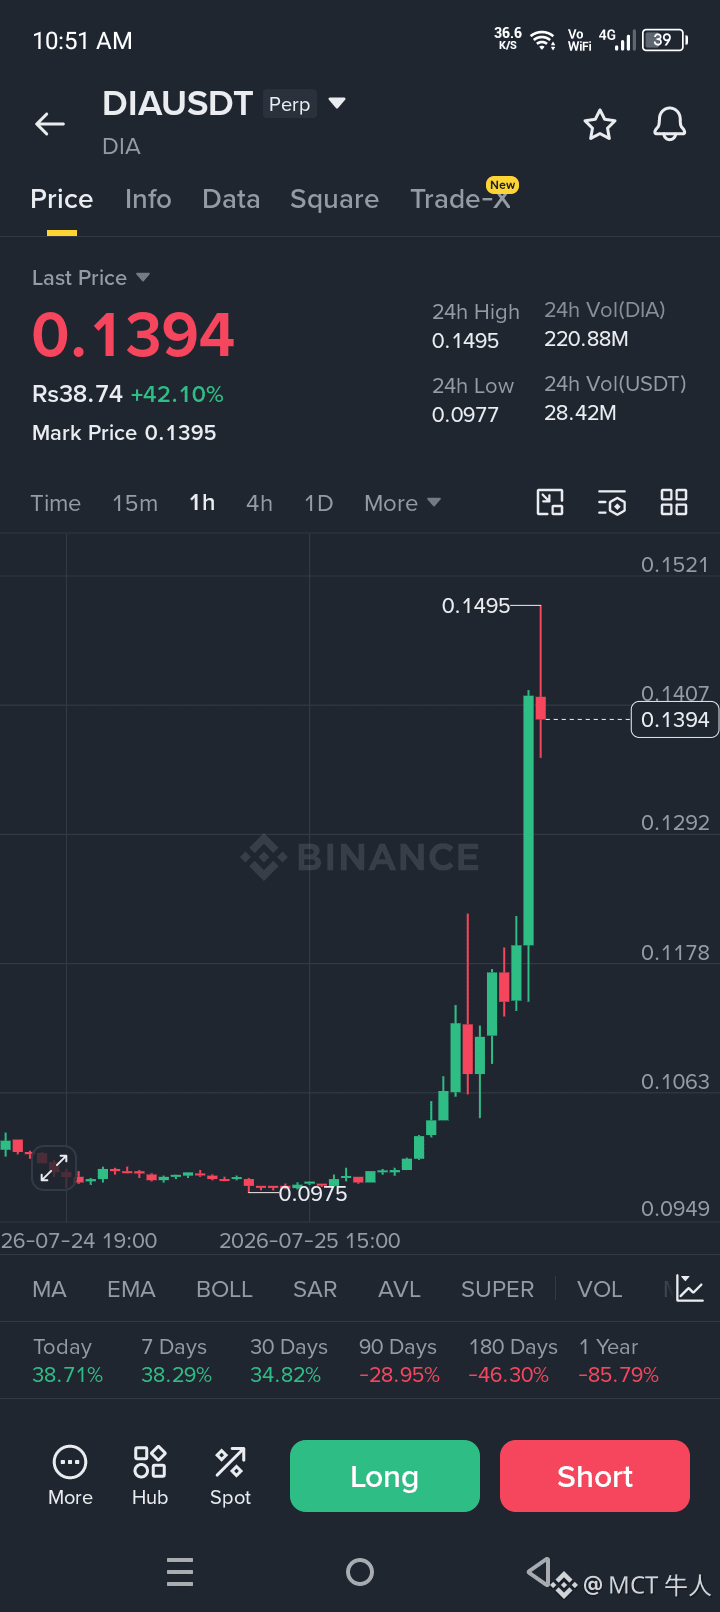
$DIA DIAUSDT — Bullish Momentum, Watch the Retest
Entry: 0.1360–0.1395
Take Profit 1: 0.1450
Take Profit 2: 0.1495
Take Profit 3: 0.1520
Stop Loss: 0.1315
$DIA has broken out with strong buying volume after a sharp impulsive move. The current candle is showing a healthy pullback from the local high, so waiting for confirmation or a successful retest before entering is safer than chasing the pump.
Risk Reminder: Trade with proper risk management and never risk more than you can afford to lose#DIAUSDT .#CryptoTrading. #BinanceSquare #coin #TradingSignals
{future}(DIAUSDT)
$DIA DIAUSDT — Bullish Momentum, Watch the Retest
Entry: 0.1360–0.1395
Take Profit 1: 0.1450
Take Profit 2: 0.1495
Take Profit 3: 0.1520
Stop Loss: 0.1315
$DIA has broken out with strong buying volume after a sharp impulsive move. The current candle is showing a healthy pullback from the local high, so waiting for confirmation or a successful retest before entering is safer than chasing the pump.
Risk Reminder: Trade with proper risk management and never risk more than you can afford to lose#DIAUSDT .#CryptoTrading. #BinanceSquare #coin #TradingSignals
Entry: 0.1360–0.1395
Take Profit 1: 0.1450
Take Profit 2: 0.1495
Take Profit 3: 0.1520
Stop Loss: 0.1315
$DIA has broken out with strong buying volume after a sharp impulsive move. The current candle is showing a healthy pullback from the local high, so waiting for confirmation or a successful retest before entering is safer than chasing the pump.
Risk Reminder: Trade with proper risk management and never risk more than you can afford to lose#DIAUSDT .#CryptoTrading. #BinanceSquare #coin #TradingSignals
1
2
135

·
--
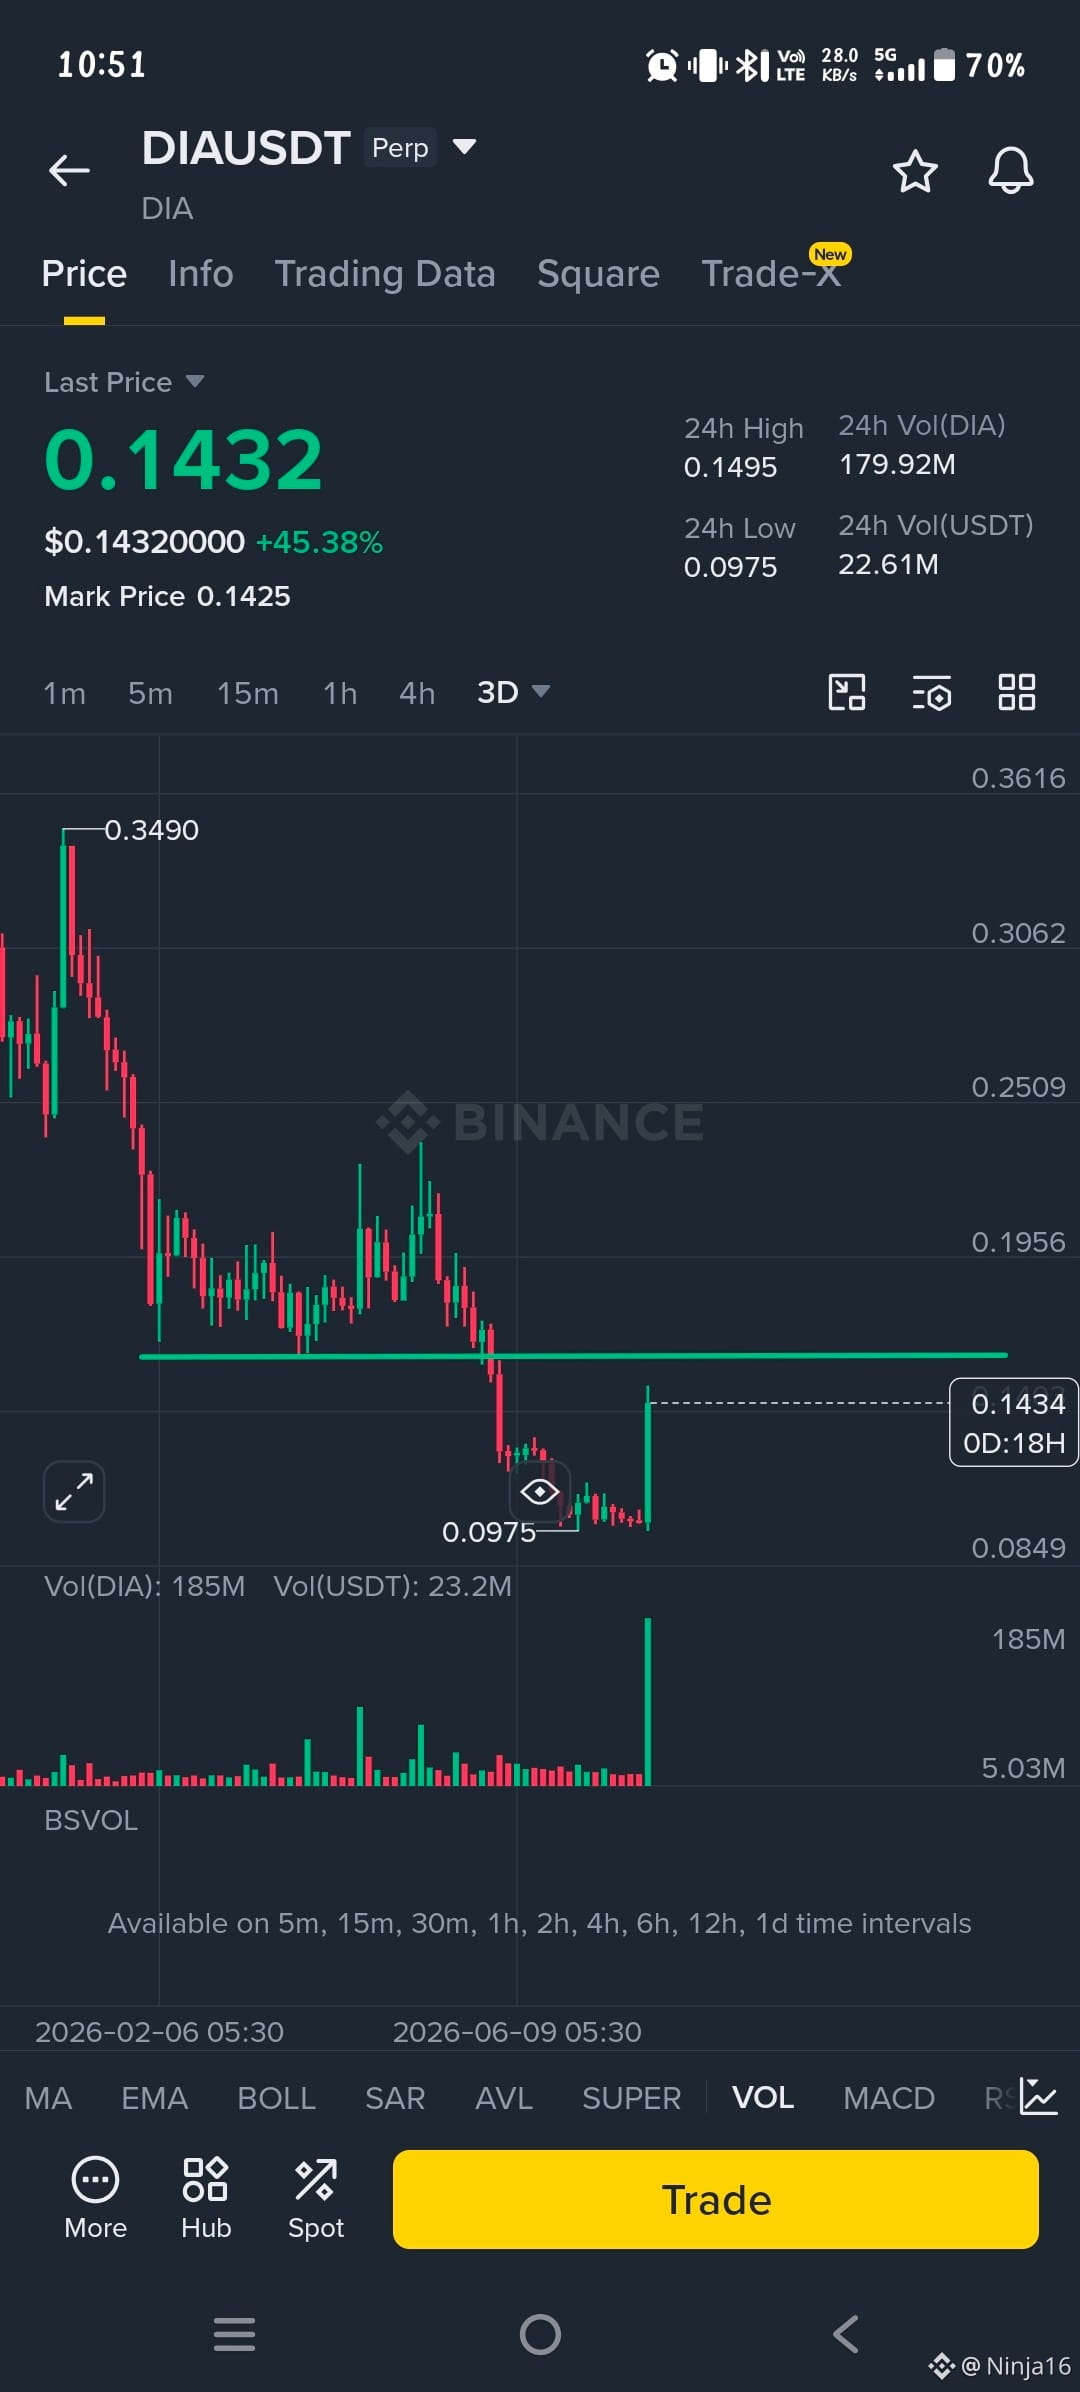
🚀 $DIA Pumping +45%! Bullish Reversal or Trap Before $0.1956? 🛑
DIA ($DIA) just exploded with a massive +45.38% green candle on the 3-Day chart, reaching $0.1432 after touching a low of $0.0975. Volume is surging over 179M DIA ($22.6M USDT)!
But the big question every trader is asking right now: Is this the beginning of a macro bull run, or a liquidity sweep to dump on late buyers? 🤔
🔍 Technical Breakdown & Key Levels
🛡️ The Demand Floor: $0.0975 – $0.1000 (Bouncing strongly off macro support).
🎯 First Major Resistance: $0.1956 (Previous support that will now act as supply).
🚀 Macro Moon Level: $0.2509 – $0.3490.
If $DIA closes above $0.1500 on high volume, it signals buyers are absorbing all sell pressure before testing $0.1956. However, chasing a vertical move without waiting for a retest increases your risk.
Will you buy the breakout now or wait for the dip?
👇 Monitor the live chart in real-time and execute your trades below:
$DIA #DIAUSDT #Dia
{future}(DIAUSDT)
🚀 $DIA Pumping +45%! Bullish Reversal or Trap Before $0.1956? 🛑
DIA ($DIA ) just exploded with a massive +45.38% green candle on the 3-Day chart, reaching $0.1432 after touching a low of $0.0975. Volume is surging over 179M DIA ($22.6M USDT)!
But the big question every trader is asking right now: Is this the beginning of a macro bull run, or a liquidity sweep to dump on late buyers? 🤔
🔍 Technical Breakdown & Key Levels
🛡️ The Demand Floor: $0.0975 – $0.1000 (Bouncing strongly off macro support).
🎯 First Major Resistance: $0.1956 (Previous support that will now act as supply).
🚀 Macro Moon Level: $0.2509 – $0.3490.
If $DIA closes above $0.1500 on high volume, it signals buyers are absorbing all sell pressure before testing $0.1956. However, chasing a vertical move without waiting for a retest increases your risk.
Will you buy the breakout now or wait for the dip?
👇 Monitor the live chart in real-time and execute your trades below:
$DIA #DIAUSDT #Dia
DIA ($DIA ) just exploded with a massive +45.38% green candle on the 3-Day chart, reaching $0.1432 after touching a low of $0.0975. Volume is surging over 179M DIA ($22.6M USDT)!
But the big question every trader is asking right now: Is this the beginning of a macro bull run, or a liquidity sweep to dump on late buyers? 🤔
🔍 Technical Breakdown & Key Levels
🛡️ The Demand Floor: $0.0975 – $0.1000 (Bouncing strongly off macro support).
🎯 First Major Resistance: $0.1956 (Previous support that will now act as supply).
🚀 Macro Moon Level: $0.2509 – $0.3490.
If $DIA closes above $0.1500 on high volume, it signals buyers are absorbing all sell pressure before testing $0.1956. However, chasing a vertical move without waiting for a retest increases your risk.
Will you buy the breakout now or wait for the dip?
👇 Monitor the live chart in real-time and execute your trades below:
$DIA #DIAUSDT #Dia
1
64

·
--
Bullish
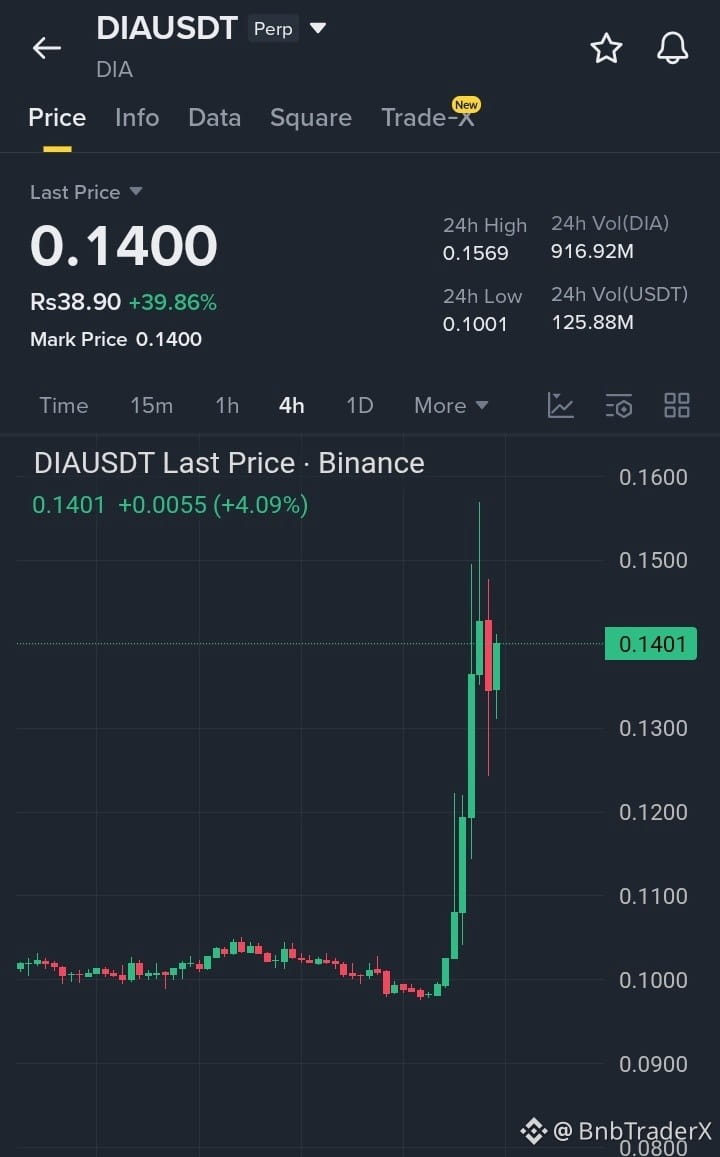
$DIA is showing exceptional bullish strength after a sharp breakout, currently trading around 0.1400. Strong trading volume and sustained buying pressure suggest momentum remains in favor of the bulls. Holding above current support could open the door for another leg higher.
Targets:
1. 0.1500
2. 0.1569
3. 0.1700
#DIA #DIAUSDT #Altcoins
{spot}(DIAUSDT)
$DIA is showing exceptional bullish strength after a sharp breakout, currently trading around 0.1400. Strong trading volume and sustained buying pressure suggest momentum remains in favor of the bulls. Holding above current support could open the door for another leg higher.
Targets:
1. 0.1500
2. 0.1569
3. 0.1700
#DIA #DIAUSDT #Altcoins
Targets:
1. 0.1500
2. 0.1569
3. 0.1700
#DIA #DIAUSDT #Altcoins
2
232


·
--
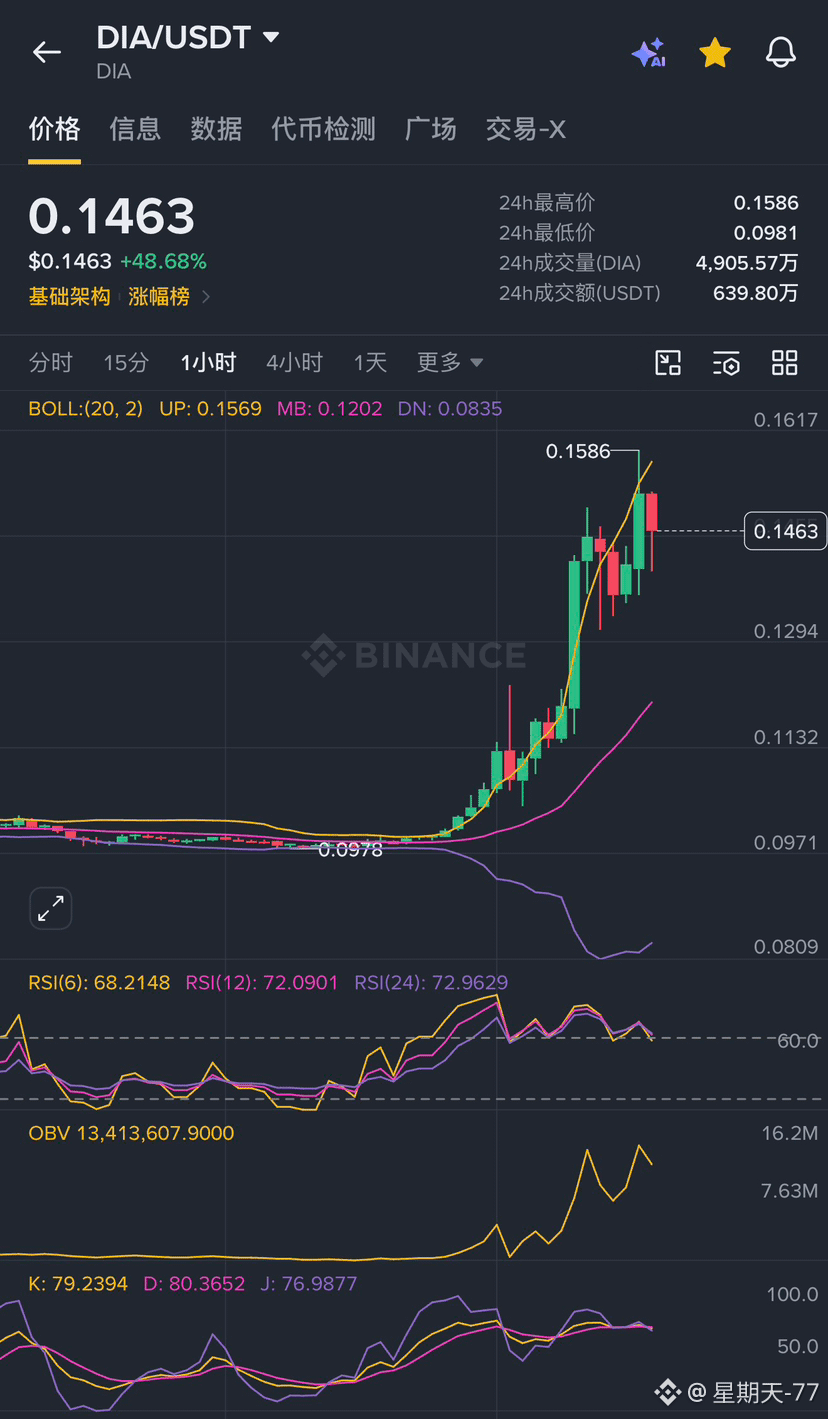
$DIA Current price $0.1463, 24h change +48.68%, 24h trading volume 6.3980 million USDT. It saw a burst of explosive rally from a low level; after pushing to the 0.1586 peak, it began a pullback and consolidation.
Indicator breakdown
• Bollinger Bands: The price surged and touched above the upper band 0.1569, then pulled back. It still holds above the Bollinger mid-band 0.1202, and the upward channel has not been broken.
• RSI: Multi-timeframe RSI is in the 68~73 range, close to the overbought area. Upward momentum is gradually weakening, and there is a short-term need for adjustment.
• OBV: Volume rose in sync and then turned downward, showing signs of high-level capital taking profits.
• KDJ: The three lines, after coming from a high level, gradually converge downward; short-term pullback signals appear.
Market conclusion and trading reference
Resistance above: the stage high 0.1586, the Bollinger upper band 0.1569;
Support below: the Bollinger mid-band 0.1202, the breakout low 0.0978.
No position: Don’t chase. Wait for the price to retrace for digestion and observe opportunities after indicators repair.
In position: Take profit in batches near the high area; set a defensive stop-loss at the Bollinger mid-band 0.1202.
#DIAUSDT #Dia #特斯拉本周跌近20%
⚠️This is only a technical analysis and does not constitute any investment advice
{future}(DIAUSDT)
$DIA Current price $0.1463, 24h change +48.68%, 24h trading volume 6.3980 million USDT. It saw a burst of explosive rally from a low level; after pushing to the 0.1586 peak, it began a pullback and consolidation.
Indicator breakdown
• Bollinger Bands: The price surged and touched above the upper band 0.1569, then pulled back. It still holds above the Bollinger mid-band 0.1202, and the upward channel has not been broken.
• RSI: Multi-timeframe RSI is in the 68~73 range, close to the overbought area. Upward momentum is gradually weakening, and there is a short-term need for adjustment.
• OBV: Volume rose in sync and then turned downward, showing signs of high-level capital taking profits.
• KDJ: The three lines, after coming from a high level, gradually converge downward; short-term pullback signals appear.
Market conclusion and trading reference
Resistance above: the stage high 0.1586, the Bollinger upper band 0.1569;
Support below: the Bollinger mid-band 0.1202, the breakout low 0.0978.
No position: Don’t chase. Wait for the price to retrace for digestion and observe opportunities after indicators repair.
In position: Take profit in batches near the high area; set a defensive stop-loss at the Bollinger mid-band 0.1202.
#DIAUSDT #Dia #特斯拉本周跌近20%
⚠️This is only a technical analysis and does not constitute any investment advice
Indicator breakdown
• Bollinger Bands: The price surged and touched above the upper band 0.1569, then pulled back. It still holds above the Bollinger mid-band 0.1202, and the upward channel has not been broken.
• RSI: Multi-timeframe RSI is in the 68~73 range, close to the overbought area. Upward momentum is gradually weakening, and there is a short-term need for adjustment.
• OBV: Volume rose in sync and then turned downward, showing signs of high-level capital taking profits.
• KDJ: The three lines, after coming from a high level, gradually converge downward; short-term pullback signals appear.
Market conclusion and trading reference
Resistance above: the stage high 0.1586, the Bollinger upper band 0.1569;
Support below: the Bollinger mid-band 0.1202, the breakout low 0.0978.
No position: Don’t chase. Wait for the price to retrace for digestion and observe opportunities after indicators repair.
In position: Take profit in batches near the high area; set a defensive stop-loss at the Bollinger mid-band 0.1202.
#DIAUSDT #Dia #特斯拉本周跌近20%
⚠️This is only a technical analysis and does not constitute any investment advice
4
806
DIA is poised for a significant move upwards, fueled by a potent mix of market structure break and volume confirmation. The current price action is setting the stage for a potential breakout, with key levels of support and resistance in clear view.
━━━━━━━━━━━━━━━━━━━━━
🟢 $DIA LONG 📈
━━━━━━━━━━━━━━━━━━━━━
📍 Entry Range: $0.111988 – $0.112212
🛑 Stop Loss: $0.108737 (-3.0%)
🎯 TP1: $0.113781 (+1.5%)
🏆 TP2: $0.117705 (+5.0%)
⚡ R/R Ratio: 1:1.7
📊 Confidence: 91%
━━━━━━━━━━━━━━━━━━━━━
This DIA long setup is compelling due to the convergence of multiple signals, including the market structure break, volume confirmation, and the presence of a fair value gap, all of which suggest a strong momentum shift. The order block and liquidity sweep further reinforce the bullish narrative, indicating a high likelihood of a sustained move. The overlap of key structures like the order block and fair value gap adds to the setup's credibility.
With a 3.0% stop loss, which is relatively tight, this trade is suited for lower leverage to manage risk effectively, aiming to capitalize on the potential upside while minimizing exposure.
Taking partial profits at the first target point could be a prudent strategy, allowing traders to bank some gains while letting the remaining position ride out the momentum, potentially leading to a more substantial upside.
Not financial advice — always manage your own risk 🙏
$DIA #DIAUSDT #SMC #TradingSignals #Write2Earn
DIA is poised for a significant move upwards, fueled by a potent mix of market structure break and volume confirmation. The current price action is setting the stage for a potential breakout, with key levels of support and resistance in clear view.
━━━━━━━━━━━━━━━━━━━━━
🟢 $DIA LONG 📈
━━━━━━━━━━━━━━━━━━━━━
📍 Entry Range: $0.111988 – $0.112212
🛑 Stop Loss: $0.108737 (-3.0%)
🎯 TP1: $0.113781 (+1.5%)
🏆 TP2: $0.117705 (+5.0%)
⚡ R/R Ratio: 1:1.7
📊 Confidence: 91%
━━━━━━━━━━━━━━━━━━━━━
This DIA long setup is compelling due to the convergence of multiple signals, including the market structure break, volume confirmation, and the presence of a fair value gap, all of which suggest a strong momentum shift. The order block and liquidity sweep further reinforce the bullish narrative, indicating a high likelihood of a sustained move. The overlap of key structures like the order block and fair value gap adds to the setup's credibility.
With a 3.0% stop loss, which is relatively tight, this trade is suited for lower leverage to manage risk effectively, aiming to capitalize on the potential upside while minimizing exposure.
Taking partial profits at the first target point could be a prudent strategy, allowing traders to bank some gains while letting the remaining position ride out the momentum, potentially leading to a more substantial upside.
Not financial advice — always manage your own risk 🙏
$DIA #DIAUSDT #SMC #TradingSignals #Write2Earn
━━━━━━━━━━━━━━━━━━━━━
🟢 $DIA LONG 📈
━━━━━━━━━━━━━━━━━━━━━
📍 Entry Range: $0.111988 – $0.112212
🛑 Stop Loss: $0.108737 (-3.0%)
🎯 TP1: $0.113781 (+1.5%)
🏆 TP2: $0.117705 (+5.0%)
⚡ R/R Ratio: 1:1.7
📊 Confidence: 91%
━━━━━━━━━━━━━━━━━━━━━
This DIA long setup is compelling due to the convergence of multiple signals, including the market structure break, volume confirmation, and the presence of a fair value gap, all of which suggest a strong momentum shift. The order block and liquidity sweep further reinforce the bullish narrative, indicating a high likelihood of a sustained move. The overlap of key structures like the order block and fair value gap adds to the setup's credibility.
With a 3.0% stop loss, which is relatively tight, this trade is suited for lower leverage to manage risk effectively, aiming to capitalize on the potential upside while minimizing exposure.
Taking partial profits at the first target point could be a prudent strategy, allowing traders to bank some gains while letting the remaining position ride out the momentum, potentially leading to a more substantial upside.
Not financial advice — always manage your own risk 🙏
$DIA #DIAUSDT #SMC #TradingSignals #Write2Earn
1
230

·
--
$DIA
#DIAUSDT — 1D
Pattern: Oversold bounce after a long bearish trend ⚠️
Entry: 0.1380–0.1420
Stoploss: 0.1250
Take Profit:
0.1600
0.1800
0.2000
Strong support: 0.1300
Major resistance: 0.1600
A daily close above 0.1600 could confirm a stronger reversal.
Thank me later ❤️
$DIA
#DIAUSDT — 1D
Pattern: Oversold bounce after a long bearish trend ⚠️
Entry: 0.1380–0.1420
Stoploss: 0.1250
Take Profit:
0.1600
0.1800
0.2000
Strong support: 0.1300
Major resistance: 0.1600
A daily close above 0.1600 could confirm a stronger reversal.
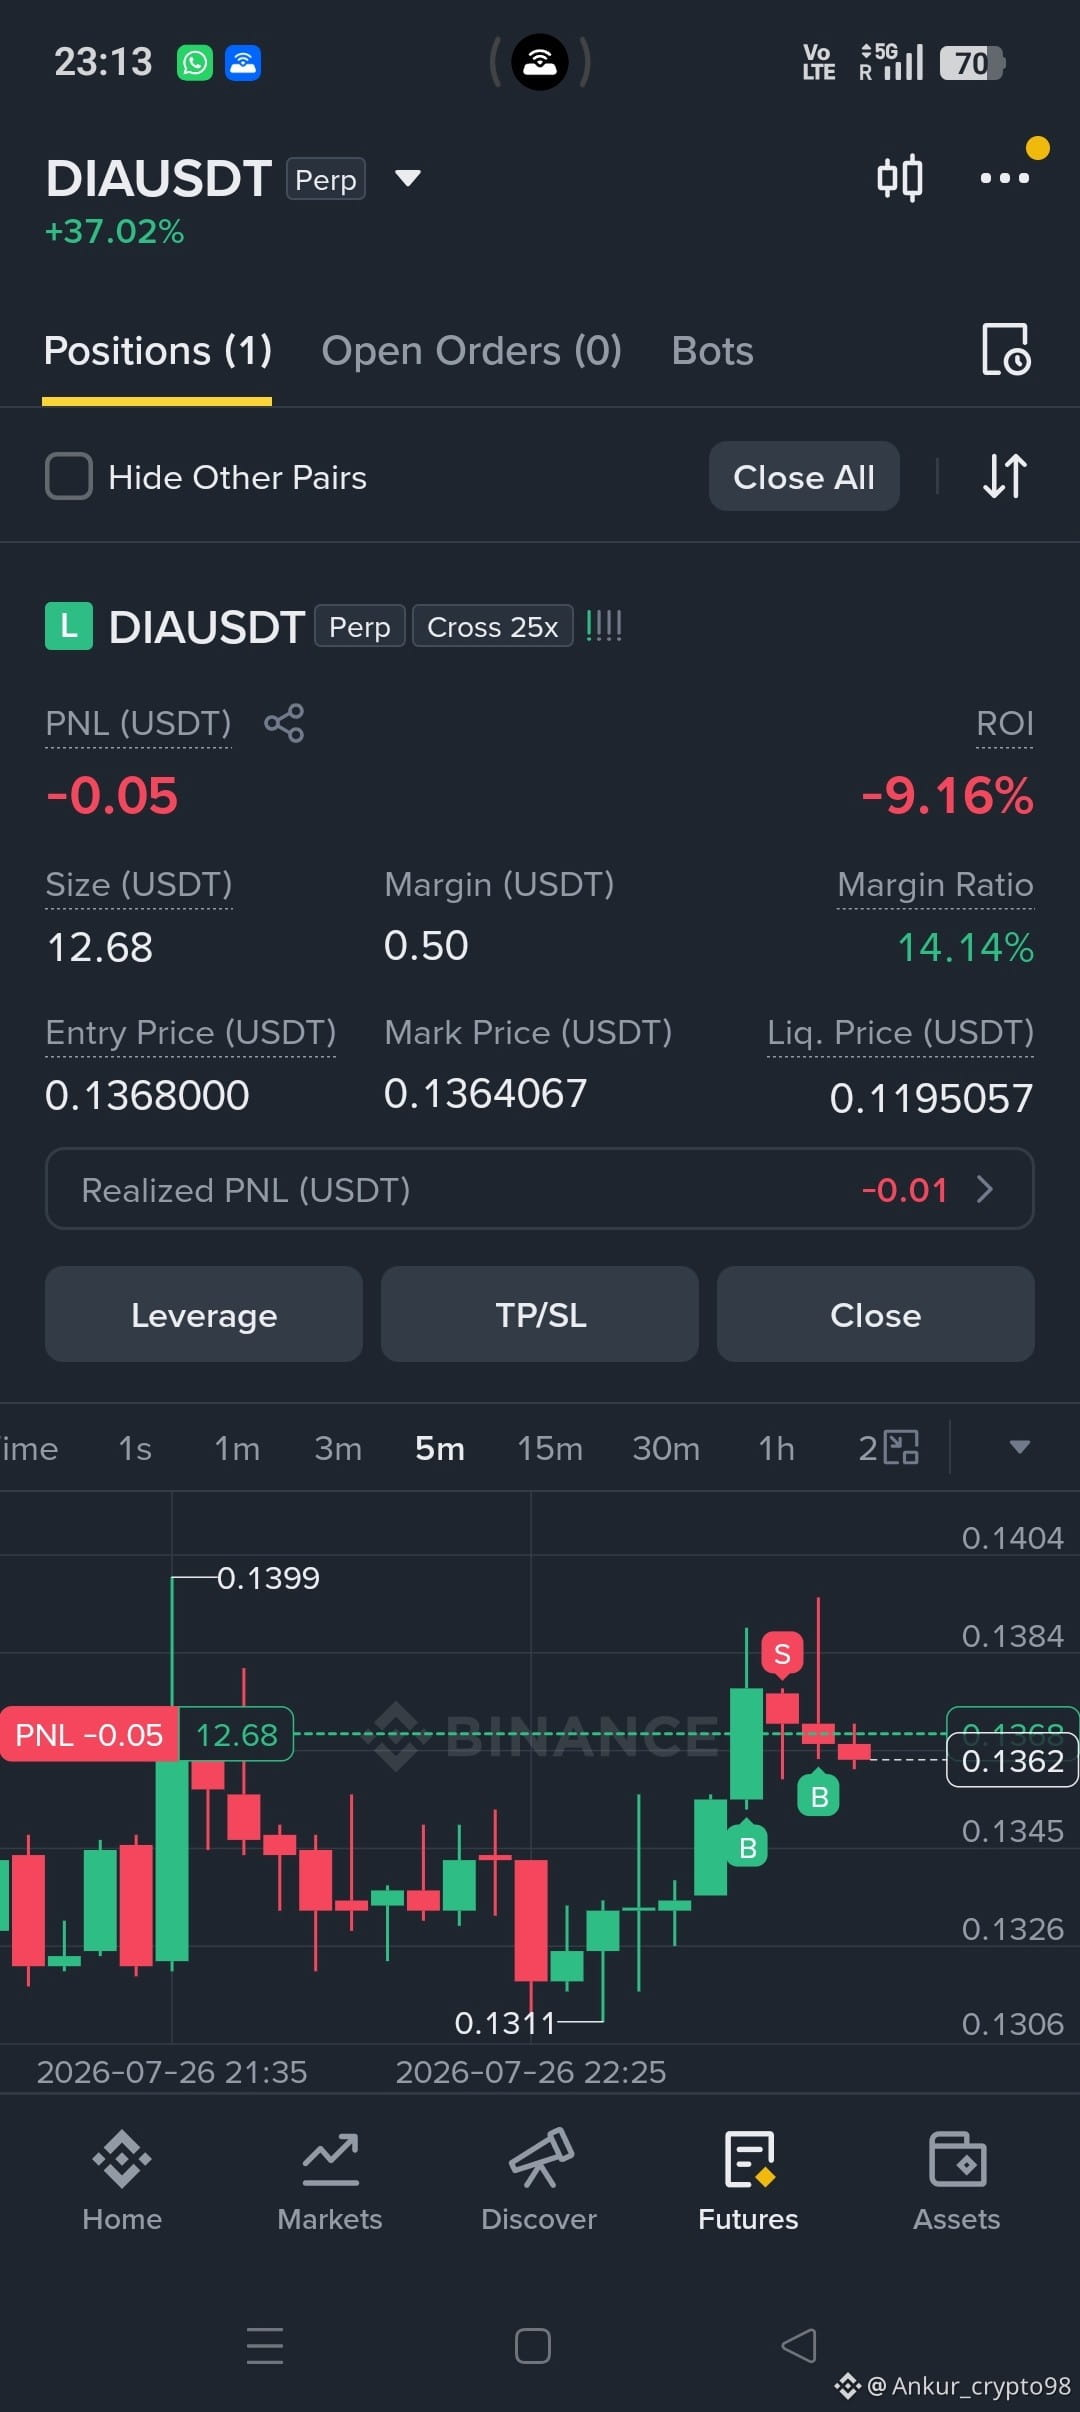
Thank me later ❤️
#DIAUSDT — 1D
Pattern: Oversold bounce after a long bearish trend ⚠️
Entry: 0.1380–0.1420
Stoploss: 0.1250
Take Profit:
0.1600
0.1800
0.2000
Strong support: 0.1300
Major resistance: 0.1600
A daily close above 0.1600 could confirm a stronger reversal.
Thank me later ❤️
2
120


·
--
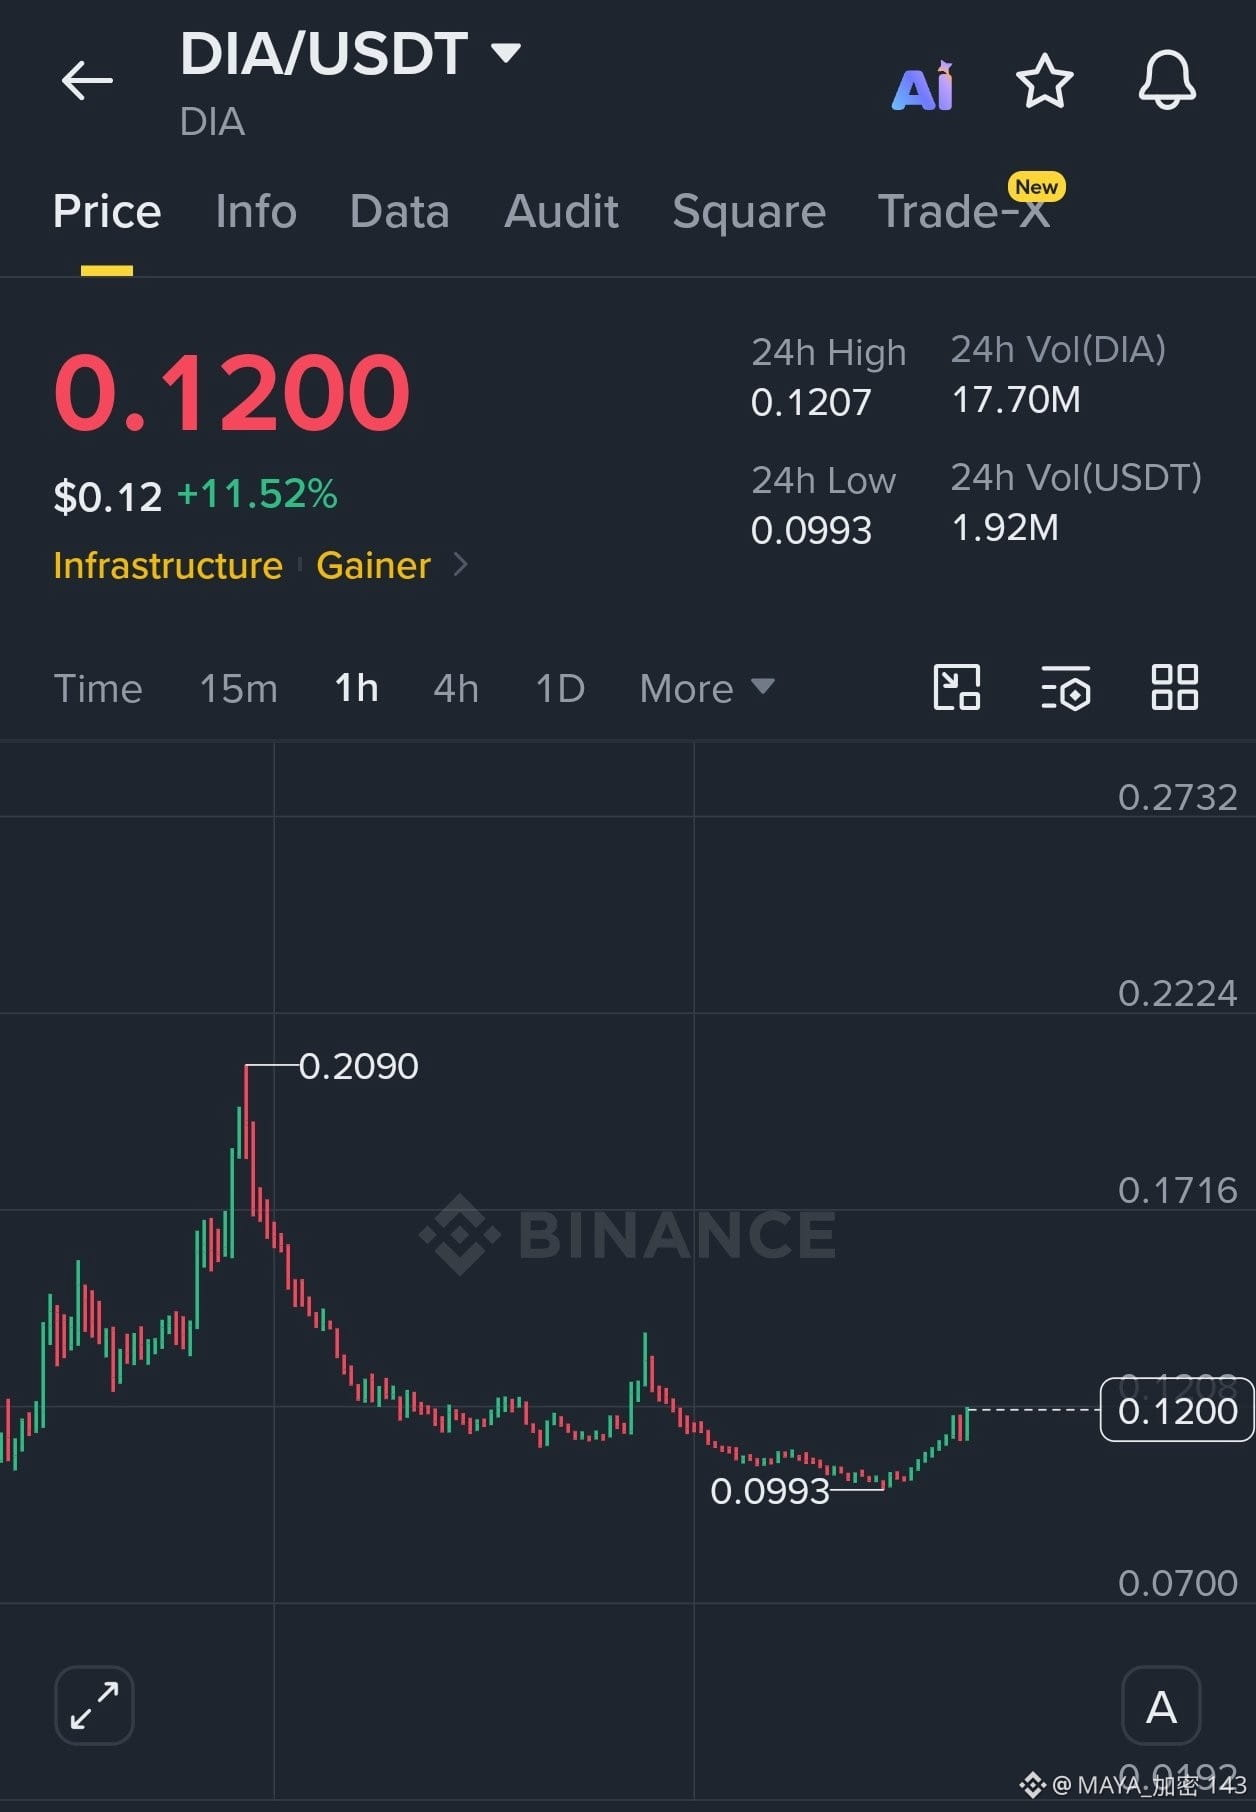
Been watching $DIA for a while, and it's finally showing signs of life.
The bounce from the recent low looks solid, but I'm not interested in chasing candles. I'd rather wait for confirmation than buy into FOMO.
If buyers keep defending this area, I'm staying bullish.
📍 Entry: $0.1170 – $0.1205
🛑 Stop Loss: $0.1115
🎯 TP1: $0.1280
🎯 TP2: $0.1365
🎯 TP3: $0.1480
The market always gives another opportunity. Missing one pump is better than getting trapped in a bad trade.
{spot}(DIAUSDT)
#DIAUSDT #SaudiOilTankersRerouteAroundAfrica
Been watching $DIA for a while, and it's finally showing signs of life.
The bounce from the recent low looks solid, but I'm not interested in chasing candles. I'd rather wait for confirmation than buy into FOMO.
If buyers keep defending this area, I'm staying bullish.
📍 Entry: $0.1170 – $0.1205
🛑 Stop Loss: $0.1115
🎯 TP1: $0.1280
🎯 TP2: $0.1365
🎯 TP3: $0.1480
The market always gives another opportunity. Missing one pump is better than getting trapped in a bad trade.
#DIAUSDT #SaudiOilTankersRerouteAroundAfrica
The bounce from the recent low looks solid, but I'm not interested in chasing candles. I'd rather wait for confirmation than buy into FOMO.
If buyers keep defending this area, I'm staying bullish.
📍 Entry: $0.1170 – $0.1205
🛑 Stop Loss: $0.1115
🎯 TP1: $0.1280
🎯 TP2: $0.1365
🎯 TP3: $0.1480
The market always gives another opportunity. Missing one pump is better than getting trapped in a bad trade.
#DIAUSDT #SaudiOilTankersRerouteAroundAfrica
7
242

·
--
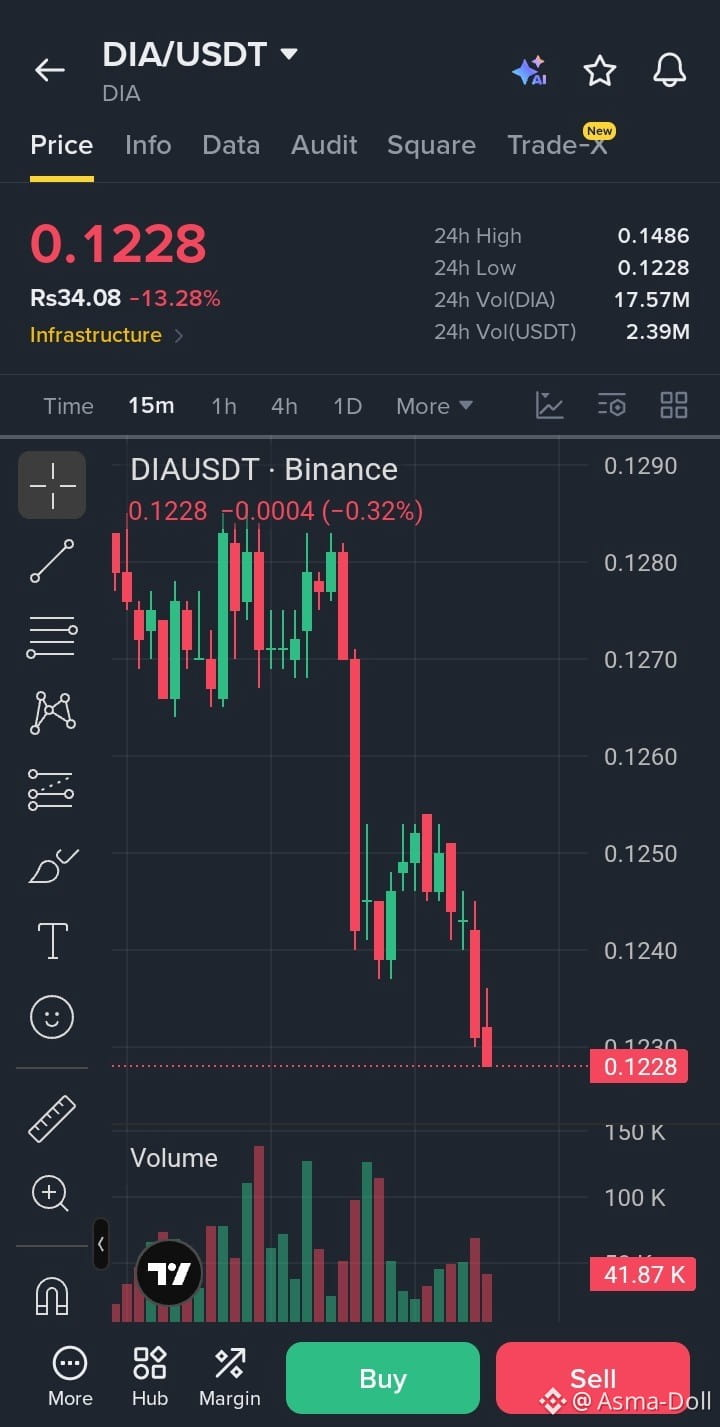
$DIA /USDT — SHORT SIGNAL
Entry: $0.1228 – $0.1240
Stop Loss: $0.1280
TP1: $0.1200
TP2: $0.1160
TP3: $0.1120
Trade here $DIA
{future}(DIAUSDT)
Analysis:
Strong bearish momentum after -13%+ daily drop.
Price is sitting at the 24h low ($0.1228) → breakdown risk is high.
Weak bounce structure suggests sellers remain in control.
Break below $0.1228 can accelerate the next leg down.
Prefer confirmation before entering because 24h-low support can trigger a bounce.
⚠️ Confirmation: Clean 15m candle close below $0.1228 = stronger short confirmation.
#DIA #DIAUSDT #SHORT #CryptoTrading #Binance
$DIA /USDT — SHORT SIGNAL
Entry: $0.1228 – $0.1240
Stop Loss: $0.1280
TP1: $0.1200
TP2: $0.1160
TP3: $0.1120
Trade here $DIA
Analysis:
Strong bearish momentum after -13%+ daily drop.
Price is sitting at the 24h low ($0.1228) → breakdown risk is high.
Weak bounce structure suggests sellers remain in control.
Break below $0.1228 can accelerate the next leg down.
Prefer confirmation before entering because 24h-low support can trigger a bounce.
⚠️ Confirmation: Clean 15m candle close below $0.1228 = stronger short confirmation.
#DIA #DIAUSDT #SHORT #CryptoTrading #Binance
Entry: $0.1228 – $0.1240
Stop Loss: $0.1280
TP1: $0.1200
TP2: $0.1160
TP3: $0.1120
Trade here $DIA
Analysis:
Strong bearish momentum after -13%+ daily drop.
Price is sitting at the 24h low ($0.1228) → breakdown risk is high.
Weak bounce structure suggests sellers remain in control.
Break below $0.1228 can accelerate the next leg down.
Prefer confirmation before entering because 24h-low support can trigger a bounce.
⚠️ Confirmation: Clean 15m candle close below $0.1228 = stronger short confirmation.
#DIA #DIAUSDT #SHORT #CryptoTrading #Binance
1
25
Log in to explore more content
Join global crypto users on Binance Square
⚡️ Get latest and useful information about crypto.
💬 Trusted by the world’s largest crypto exchange.
👍 Discover real insights from verified creators.
Email / Phone number
Trending Topics
1
#CPITestsDecemberRateOutlook
776,021 views
3,877 Discussing
2
#AnthropicRejectsIPODelayValuationinQuestion
96,934 views
889 Discussing
3
#NvidiaInvestigatesAfterHuang’sAffairApology
329,430 views
2,421 Discussing
4
#CanNvidiaEarningsEaseMarketConcerns?
2,962 views
89 Discussing
5
#US-IranTalksFuelStrongStockMarketRebound
35,098 views
317 Discussing
6
#BitcoinFiveWeeklyLosses
351,823 views
2,759 Discussing
7
#AIChipSlumpNasdaq
199,655 views
1,629 Discussing
8
#BitcoinSpotETFsPost$201MNetOutflowForThirdStraightDay
743 views
11 Discussing
9
#CryptoLiquidationsReach$1.16BIn24Hours
39,615 views
67 Discussing
10
#TradFiForBeginners
404,527 views
2,748 Discussing