
#cycleanalysis
cycleanalysis
41,234 views
129 Discussing
Hot
Latest

·
--
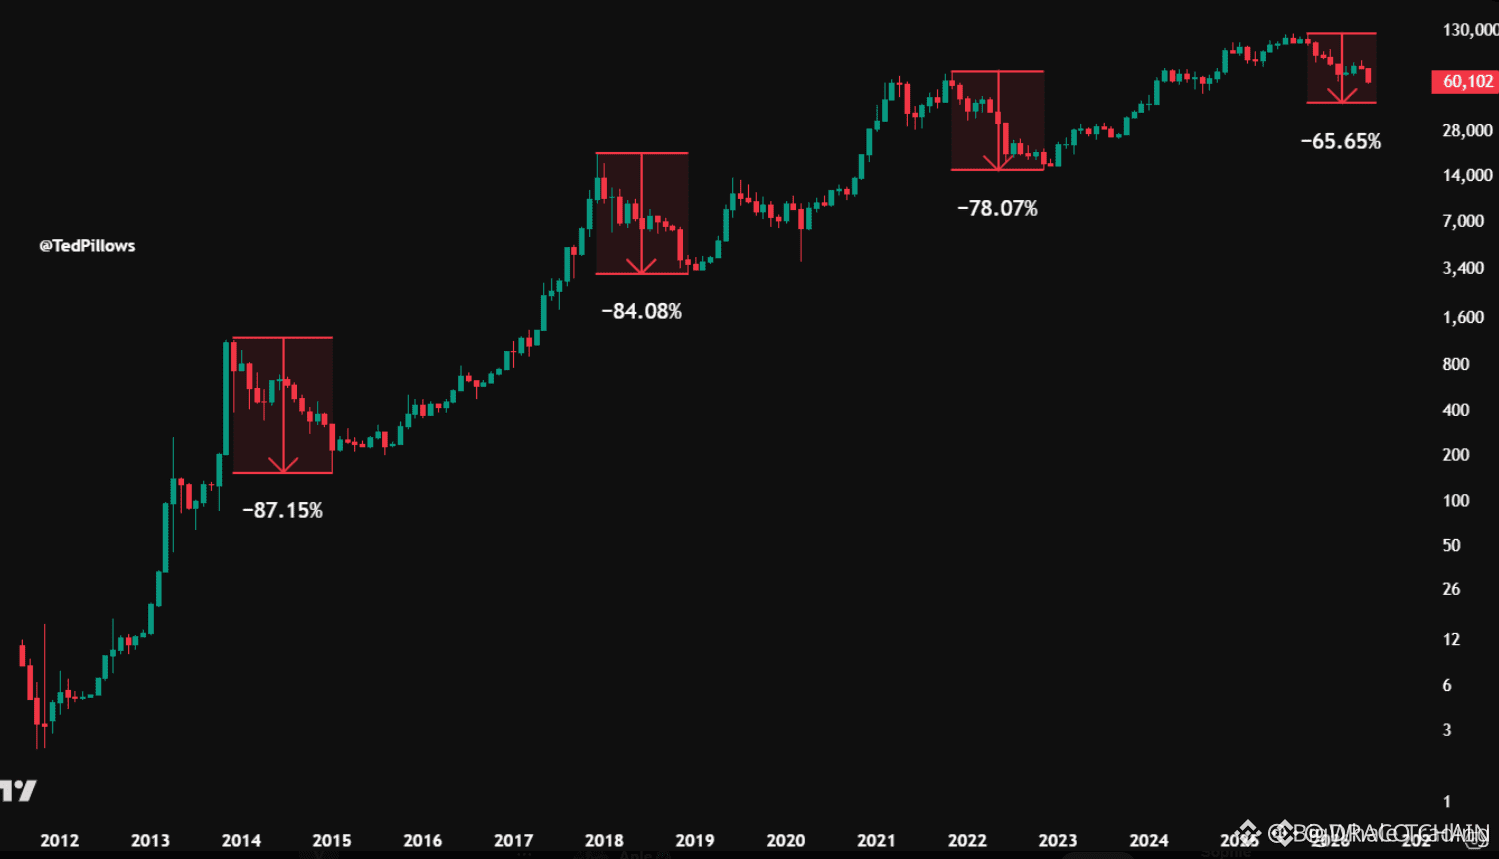
Every crypto cycle, the drawdown gets shallower and the recovery gets faster. That is not luck — it is structural.
The 2018 bear market wiped out 84% of BTC value. The 2022 drawdown was 77%. This cycle worst dip barely touched 65%. The pattern is clear: each cycle compresses.
Why? Three structural shifts.
First, the buyer base has changed permanently. ETFs, sovereign treasuries, and corporate allocations create a floor of demand that did not exist before. These are not leveraged traders who panic-sell at the first sign of red — they are mandated buyers with multi-year horizons.
Second, the supply overhang is smaller. Better tokenomics, fewer vaporware unlocks, and actual revenue-generating protocols mean less dilution pressure on the market.
Third, the infrastructure has matured. Custody, lending, derivatives — the plumbing is institutional-grade now. The cascading liquidation spirals that amplified past drawdowns are structurally dampened.
What this means: waiting for an 80% drawdown to buy the dip is a strategy built on a world that no longer exists. The risk-reward of dollar-cost averaging through volatility is significantly better than trying to time a generational bottom that may never come.
The cycle is not dead. But its amplitude is fading. Position accordingly.
$BTC $ETH $SOL
#CryptoMarkets #CycleAnalysis #Bitcoin #InvestingStrategy #Ethereum
Every crypto cycle, the drawdown gets shallower and the recovery gets faster. That is not luck — it is structural.
The 2018 bear market wiped out 84% of BTC value. The 2022 drawdown was 77%. This cycle worst dip barely touched 65%. The pattern is clear: each cycle compresses.
Why? Three structural shifts.
First, the buyer base has changed permanently. ETFs, sovereign treasuries, and corporate allocations create a floor of demand that did not exist before. These are not leveraged traders who panic-sell at the first sign of red — they are mandated buyers with multi-year horizons.
Second, the supply overhang is smaller. Better tokenomics, fewer vaporware unlocks, and actual revenue-generating protocols mean less dilution pressure on the market.
Third, the infrastructure has matured. Custody, lending, derivatives — the plumbing is institutional-grade now. The cascading liquidation spirals that amplified past drawdowns are structurally dampened.
What this means: waiting for an 80% drawdown to buy the dip is a strategy built on a world that no longer exists. The risk-reward of dollar-cost averaging through volatility is significantly better than trying to time a generational bottom that may never come.
The cycle is not dead. But its amplitude is fading. Position accordingly.
$BTC $ETH $SOL
#CryptoMarkets #CycleAnalysis #Bitcoin #InvestingStrategy #Ethereum
The 2018 bear market wiped out 84% of BTC value. The 2022 drawdown was 77%. This cycle worst dip barely touched 65%. The pattern is clear: each cycle compresses.
Why? Three structural shifts.
First, the buyer base has changed permanently. ETFs, sovereign treasuries, and corporate allocations create a floor of demand that did not exist before. These are not leveraged traders who panic-sell at the first sign of red — they are mandated buyers with multi-year horizons.
Second, the supply overhang is smaller. Better tokenomics, fewer vaporware unlocks, and actual revenue-generating protocols mean less dilution pressure on the market.
Third, the infrastructure has matured. Custody, lending, derivatives — the plumbing is institutional-grade now. The cascading liquidation spirals that amplified past drawdowns are structurally dampened.
What this means: waiting for an 80% drawdown to buy the dip is a strategy built on a world that no longer exists. The risk-reward of dollar-cost averaging through volatility is significantly better than trying to time a generational bottom that may never come.
The cycle is not dead. But its amplitude is fading. Position accordingly.
$BTC $ETH $SOL
#CryptoMarkets #CycleAnalysis #Bitcoin #InvestingStrategy #Ethereum
73

·
--
$BTC | Rainbow Chart band right now: HODL.
The Rainbow Chart is a logarithmic regression with nine colour-banded zones from "Maximum Bubble" (red, top) down to "Basically a Fire Sale" (deep blue, bottom). It is the most-shared cycle visual on crypto Twitter and the one I get asked about the most - so worth being precise about what it does and does not tell you.
What it does: gives a visual quick-read on where price sits versus the long-term log-regression base. The HODL band (green, where we are now) historically covers the largest portion of cycle time - roughly 35-40% of trading days since 2013. The two upper bands (FOMO + Maximum Bubble) cover roughly 8-12% of days, clustered at cycle tops.
What it does not do: forecast anything. Rainbow Chart has been used to justify every wrong prediction since 2013 because the bands are a visual, not a probabilistic model.
I ran this on real capital from the 2018 bear market through the 2025 cycle top. Rainbow is useful as a sentiment-anchor (when crypto Twitter is screaming "we are in Maximum Bubble" and the chart shows HODL, that is the alpha signal). It is not useful as a tactical-timing tool.
https://satoshimacro.com/tools/crypto/cycle-indicators/bitcoin-rainbow-chart/
#BitcoinRainbowChart #CycleAnalysis #SatoshiMacro
$BTC | Rainbow Chart band right now: HODL.
The Rainbow Chart is a logarithmic regression with nine colour-banded zones from "Maximum Bubble" (red, top) down to "Basically a Fire Sale" (deep blue, bottom). It is the most-shared cycle visual on crypto Twitter and the one I get asked about the most - so worth being precise about what it does and does not tell you.
What it does: gives a visual quick-read on where price sits versus the long-term log-regression base. The HODL band (green, where we are now) historically covers the largest portion of cycle time - roughly 35-40% of trading days since 2013. The two upper bands (FOMO + Maximum Bubble) cover roughly 8-12% of days, clustered at cycle tops.
What it does not do: forecast anything. Rainbow Chart has been used to justify every wrong prediction since 2013 because the bands are a visual, not a probabilistic model.
I ran this on real capital from the 2018 bear market through the 2025 cycle top. Rainbow is useful as a sentiment-anchor (when crypto Twitter is screaming "we are in Maximum Bubble" and the chart shows HODL, that is the alpha signal). It is not useful as a tactical-timing tool.
https://satoshimacro.com/tools/crypto/cycle-indicators/bitcoin-rainbow-chart/
#BitcoinRainbowChart #CycleAnalysis #SatoshiMacro
The Rainbow Chart is a logarithmic regression with nine colour-banded zones from "Maximum Bubble" (red, top) down to "Basically a Fire Sale" (deep blue, bottom). It is the most-shared cycle visual on crypto Twitter and the one I get asked about the most - so worth being precise about what it does and does not tell you.
What it does: gives a visual quick-read on where price sits versus the long-term log-regression base. The HODL band (green, where we are now) historically covers the largest portion of cycle time - roughly 35-40% of trading days since 2013. The two upper bands (FOMO + Maximum Bubble) cover roughly 8-12% of days, clustered at cycle tops.
What it does not do: forecast anything. Rainbow Chart has been used to justify every wrong prediction since 2013 because the bands are a visual, not a probabilistic model.
I ran this on real capital from the 2018 bear market through the 2025 cycle top. Rainbow is useful as a sentiment-anchor (when crypto Twitter is screaming "we are in Maximum Bubble" and the chart shows HODL, that is the alpha signal). It is not useful as a tactical-timing tool.
https://satoshimacro.com/tools/crypto/cycle-indicators/bitcoin-rainbow-chart/
#BitcoinRainbowChart #CycleAnalysis #SatoshiMacro
1
1
166

$BTC IS REPEATING THE 2022 PATTERN THAT LED TO A 42% RALLY 🚀
Entry: 61,000 🔥
Target: 80,000 🚀
Centralized exchanges just saw $850M in net withdrawals over 24 hours, with $352M of that in BTC alone. That's a massive reduction in available supply. Meanwhile, the current structure mirrors summer 2022 almost perfectly — same accumulation zone, same squeeze setup above $65k-$67k resistance.
If history holds, we could see a move toward $80k before the next major low. The question is whether this time is different or if the market really does rhyme that closely.
Not financial advice. Always manage your risk.
#BTC #Bitcoin #CycleAnalysis #LongSetup
🔥
$BTC IS REPEATING THE 2022 PATTERN THAT LED TO A 42% RALLY 🚀
Entry: 61,000 🔥
Target: 80,000 🚀
Centralized exchanges just saw $850M in net withdrawals over 24 hours, with $352M of that in BTC alone. That's a massive reduction in available supply. Meanwhile, the current structure mirrors summer 2022 almost perfectly — same accumulation zone, same squeeze setup above $65k-$67k resistance.
If history holds, we could see a move toward $80k before the next major low. The question is whether this time is different or if the market really does rhyme that closely.
Not financial advice. Always manage your risk.
#BTC #Bitcoin #CycleAnalysis #LongSetup
🔥
Entry: 61,000 🔥
Target: 80,000 🚀
Centralized exchanges just saw $850M in net withdrawals over 24 hours, with $352M of that in BTC alone. That's a massive reduction in available supply. Meanwhile, the current structure mirrors summer 2022 almost perfectly — same accumulation zone, same squeeze setup above $65k-$67k resistance.
If history holds, we could see a move toward $80k before the next major low. The question is whether this time is different or if the market really does rhyme that closely.
Not financial advice. Always manage your risk.
#BTC #Bitcoin #CycleAnalysis #LongSetup
🔥
21

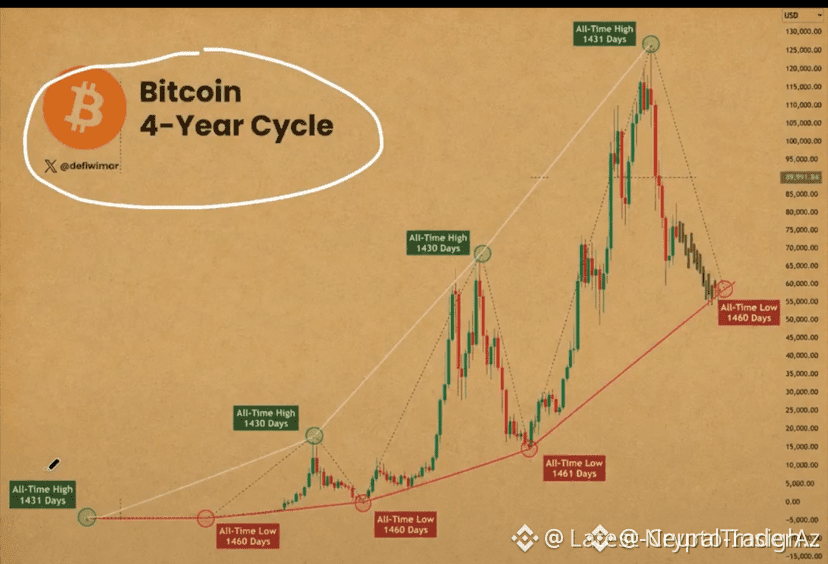
$BTC THE CYCLE CLOCK POINTS TO OCTOBER 9, 2026 🔥
The data is undeniable — 1,064 days up, 364 days down, repeated four times without a single failure. We are currently 264 days into the 364-day bear leg. If the pattern holds, the next cycle bottom is October 9.
This is not opinion. This is decade-long structure repeating with surgical precision. The question is not if, but whether you are positioned before the next 1,064-day expansion begins. What is your take on cycle clock forecasting?
Not financial advice. Always manage your risk.
#BTC #CycleAnalysis #BottomSignal #Crypto
💎
$BTC THE CYCLE CLOCK POINTS TO OCTOBER 9, 2026 🔥
The data is undeniable — 1,064 days up, 364 days down, repeated four times without a single failure. We are currently 264 days into the 364-day bear leg. If the pattern holds, the next cycle bottom is October 9.
This is not opinion. This is decade-long structure repeating with surgical precision. The question is not if, but whether you are positioned before the next 1,064-day expansion begins. What is your take on cycle clock forecasting?
Not financial advice. Always manage your risk.
#BTC #CycleAnalysis #BottomSignal #Crypto
💎
The data is undeniable — 1,064 days up, 364 days down, repeated four times without a single failure. We are currently 264 days into the 364-day bear leg. If the pattern holds, the next cycle bottom is October 9.
This is not opinion. This is decade-long structure repeating with surgical precision. The question is not if, but whether you are positioned before the next 1,064-day expansion begins. What is your take on cycle clock forecasting?
Not financial advice. Always manage your risk.
#BTC #CycleAnalysis #BottomSignal #Crypto
💎
1
33

·
--
$BTC HISTORY REPEATS — THE NEXT BOTTOM REQUIRES A 60-65% DUMP 🔥
Each prior cycle demanded a 78%+ drawdown before the real bottom formed. The current 50% drop is not enough based on liquidity sweeps and distribution phase structure. Historical patterns are consistent: the market clears weak hands through deeper capitulation before the next parabolic leg.
Volume profiles show no accumulation at current levels, and the daily structure still points lower. Are you positioning for a deeper correction or betting on a V-shaped recovery?
Not financial advice. Always manage your risk.
#BTC #BearMarket #CycleAnalysis #Crypto
⚡
$BTC HISTORY REPEATS — THE NEXT BOTTOM REQUIRES A 60-65% DUMP 🔥
Each prior cycle demanded a 78%+ drawdown before the real bottom formed. The current 50% drop is not enough based on liquidity sweeps and distribution phase structure. Historical patterns are consistent: the market clears weak hands through deeper capitulation before the next parabolic leg.
Volume profiles show no accumulation at current levels, and the daily structure still points lower. Are you positioning for a deeper correction or betting on a V-shaped recovery?
Not financial advice. Always manage your risk.
#BTC #BearMarket #CycleAnalysis #Crypto
⚡
Each prior cycle demanded a 78%+ drawdown before the real bottom formed. The current 50% drop is not enough based on liquidity sweeps and distribution phase structure. Historical patterns are consistent: the market clears weak hands through deeper capitulation before the next parabolic leg.
Volume profiles show no accumulation at current levels, and the daily structure still points lower. Are you positioning for a deeper correction or betting on a V-shaped recovery?
Not financial advice. Always manage your risk.
#BTC #BearMarket #CycleAnalysis #Crypto
⚡
75

·
--
History doesn't repeat. But in crypto, it rhymes LOUDLY. 👇
Historically, the strongest altcoin rallies have developed 18 to 30 months after a Bitcoin market bottom, often following a halving event. Since the latest Bitcoin halving took place in April 2024, many analysts believe the 2026-2027 period could still provide favorable conditions if liquidity continues improving.
April 2024 + 18 months = October 2025 ✅ (BTC ATH)
April 2024 + 30 months = October 2026 👀 (alt season target?)
Three technical signals — a monthly death cross on the dominance chart, a January 2026 OTHERS index trendline break, and historical pre-breakout geometry — point to May–July 2026 as the highest-probability altseason onset window.
May-July. We're in June right now. 🗓️
The window is OPEN. Whether we walk through it depends on BTC stabilizing. 🔑
$BTC #altcoinseason #CycleAnalysis
$BABY $NEAR
History doesn't repeat. But in crypto, it rhymes LOUDLY. 👇
Historically, the strongest altcoin rallies have developed 18 to 30 months after a Bitcoin market bottom, often following a halving event. Since the latest Bitcoin halving took place in April 2024, many analysts believe the 2026-2027 period could still provide favorable conditions if liquidity continues improving.
April 2024 + 18 months = October 2025 ✅ (BTC ATH)
April 2024 + 30 months = October 2026 👀 (alt season target?)
Three technical signals — a monthly death cross on the dominance chart, a January 2026 OTHERS index trendline break, and historical pre-breakout geometry — point to May–July 2026 as the highest-probability altseason onset window.
May-July. We're in June right now. 🗓️
The window is OPEN. Whether we walk through it depends on BTC stabilizing. 🔑
$BTC #altcoinseason #CycleAnalysis
$BABY $NEAR
Historically, the strongest altcoin rallies have developed 18 to 30 months after a Bitcoin market bottom, often following a halving event. Since the latest Bitcoin halving took place in April 2024, many analysts believe the 2026-2027 period could still provide favorable conditions if liquidity continues improving.
April 2024 + 18 months = October 2025 ✅ (BTC ATH)
April 2024 + 30 months = October 2026 👀 (alt season target?)
Three technical signals — a monthly death cross on the dominance chart, a January 2026 OTHERS index trendline break, and historical pre-breakout geometry — point to May–July 2026 as the highest-probability altseason onset window.
May-July. We're in June right now. 🗓️
The window is OPEN. Whether we walk through it depends on BTC stabilizing. 🔑
$BTC #altcoinseason #CycleAnalysis
$BABY $NEAR
142
·
--
$BTC | Introducing the SatoshiMacro Model (SMM)
A quantitative Bitcoin cycle confluence model. 48 signals across 6 weighted tiers, distilled into a single 0-100 cycle position score.
The 6 tiers:
- Cycle Timing & Mass Psychology (30%): halving cycle position, power law deviation
- Valuation (25%): Mayer Multiple, MVRV Z-Score, Pi Cycle Top, NUPL
- Sentiment (20%): Fear & Greed, funding rates, open interest, Coinbase premium
- Rotation (10%): BTC dominance, altseason index
- Miner (10%): Puell Multiple, hash ribbons, hashrate vs peak
- Macro (5%): DXY, M2, yield curve, VIX
Lookahead-free expanding-window percentile rank. USD/AUD currency toggle. Calibrated 7-of-7 in-zone across BTC cycle inflections from 2013 through 2022.
Built by a former institutional trader who traded allocated capital at a Sydney prop firm.
100% free. No paywall, no email gate.
Full methodology + interactive gauge + 48-signal panel:
https://satoshimacro.com/tools/crypto/satoshimacro-model/
#Bitcoin #CycleAnalysis #OnChain #SatoshiMacro #SMM
$BTC | Introducing the SatoshiMacro Model (SMM)
A quantitative Bitcoin cycle confluence model. 48 signals across 6 weighted tiers, distilled into a single 0-100 cycle position score.
The 6 tiers:
- Cycle Timing & Mass Psychology (30%): halving cycle position, power law deviation
- Valuation (25%): Mayer Multiple, MVRV Z-Score, Pi Cycle Top, NUPL
- Sentiment (20%): Fear & Greed, funding rates, open interest, Coinbase premium
- Rotation (10%): BTC dominance, altseason index
- Miner (10%): Puell Multiple, hash ribbons, hashrate vs peak
- Macro (5%): DXY, M2, yield curve, VIX
Lookahead-free expanding-window percentile rank. USD/AUD currency toggle. Calibrated 7-of-7 in-zone across BTC cycle inflections from 2013 through 2022.
Built by a former institutional trader who traded allocated capital at a Sydney prop firm.
100% free. No paywall, no email gate.
Full methodology + interactive gauge + 48-signal panel:
https://satoshimacro.com/tools/crypto/satoshimacro-model/
#Bitcoin #CycleAnalysis #OnChain #SatoshiMacro #SMM
A quantitative Bitcoin cycle confluence model. 48 signals across 6 weighted tiers, distilled into a single 0-100 cycle position score.
The 6 tiers:
- Cycle Timing & Mass Psychology (30%): halving cycle position, power law deviation
- Valuation (25%): Mayer Multiple, MVRV Z-Score, Pi Cycle Top, NUPL
- Sentiment (20%): Fear & Greed, funding rates, open interest, Coinbase premium
- Rotation (10%): BTC dominance, altseason index
- Miner (10%): Puell Multiple, hash ribbons, hashrate vs peak
- Macro (5%): DXY, M2, yield curve, VIX
Lookahead-free expanding-window percentile rank. USD/AUD currency toggle. Calibrated 7-of-7 in-zone across BTC cycle inflections from 2013 through 2022.
Built by a former institutional trader who traded allocated capital at a Sydney prop firm.
100% free. No paywall, no email gate.
Full methodology + interactive gauge + 48-signal panel:
https://satoshimacro.com/tools/crypto/satoshimacro-model/
#Bitcoin #CycleAnalysis #OnChain #SatoshiMacro #SMM
1
91

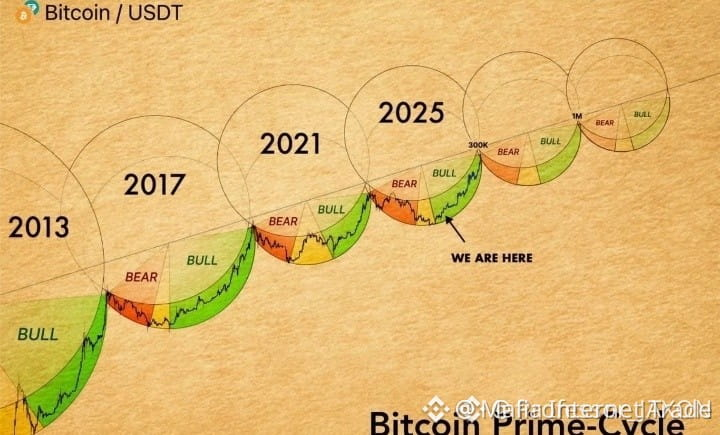
$BTC 2025 CYCLE PATTERN MIRRORING PAST TOPS? ⚡
History doesn’t repeat, but it often rhymes. The chart is showing that 2025 aligns with the timeline of previous Bitcoin prime-cycle tops — 2017 and 2021 both saw major peaks before bear markets settled in. We’re in similar late-stage territory right now.
Volatility tends to spike near these zones. Institutional flows, ETF activity, and global rates all add fuel, but the pattern itself has held twice already. Are you scaling out on strength or holding through the next phase?
Not financial advice. Always manage your risk.
#BTC #CycleAnalysis #Bitcoin2025 #Crypto
⚡
$BTC 2025 CYCLE PATTERN MIRRORING PAST TOPS? ⚡
History doesn’t repeat, but it often rhymes. The chart is showing that 2025 aligns with the timeline of previous Bitcoin prime-cycle tops — 2017 and 2021 both saw major peaks before bear markets settled in. We’re in similar late-stage territory right now.
Volatility tends to spike near these zones. Institutional flows, ETF activity, and global rates all add fuel, but the pattern itself has held twice already. Are you scaling out on strength or holding through the next phase?
Not financial advice. Always manage your risk.
#BTC #CycleAnalysis #Bitcoin2025 #Crypto
⚡
History doesn’t repeat, but it often rhymes. The chart is showing that 2025 aligns with the timeline of previous Bitcoin prime-cycle tops — 2017 and 2021 both saw major peaks before bear markets settled in. We’re in similar late-stage territory right now.
Volatility tends to spike near these zones. Institutional flows, ETF activity, and global rates all add fuel, but the pattern itself has held twice already. Are you scaling out on strength or holding through the next phase?
Not financial advice. Always manage your risk.
#BTC #CycleAnalysis #Bitcoin2025 #Crypto
⚡
77

ETH AND MAJOR ALTS TARGETING CYCLE HIGHS IN 6-12 MONTHS 🔥
The price targets outlined for $ETH , $SOL , and $XRP ($4200, $450, $10 respectively) reflect a recurring pattern during mid-cycle expansions. Each level sits at or near previous resistance turned support zones. When multiple assets target similar percentage gains within the same timeframe, liquidity tends to concentrate around these zones. Tick data shows increasing bid depth on the order books for all three.
Are you scaling into positions early or waiting for confirmation on these levels?
Not financial advice. Always manage your risk.
#ETH #Altcoins #CryptoTargets #CycleAnalysis
🔥
ETH AND MAJOR ALTS TARGETING CYCLE HIGHS IN 6-12 MONTHS 🔥
The price targets outlined for $ETH , $SOL , and $XRP ($4200, $450, $10 respectively) reflect a recurring pattern during mid-cycle expansions. Each level sits at or near previous resistance turned support zones. When multiple assets target similar percentage gains within the same timeframe, liquidity tends to concentrate around these zones. Tick data shows increasing bid depth on the order books for all three.
Are you scaling into positions early or waiting for confirmation on these levels?
Not financial advice. Always manage your risk.
#ETH #Altcoins #CryptoTargets #CycleAnalysis
🔥
The price targets outlined for $ETH , $SOL , and $XRP ($4200, $450, $10 respectively) reflect a recurring pattern during mid-cycle expansions. Each level sits at or near previous resistance turned support zones. When multiple assets target similar percentage gains within the same timeframe, liquidity tends to concentrate around these zones. Tick data shows increasing bid depth on the order books for all three.
Are you scaling into positions early or waiting for confirmation on these levels?
Not financial advice. Always manage your risk.
#ETH #Altcoins #CryptoTargets #CycleAnalysis
🔥

55
$BTC LAST DROP BEFORE THE REAL BOTTOM? DON’T FALL FOR THE TRAP! 🚨
Body:
📌 Market optimism is building, but historical Bitcoin cycles show something critical: a strong relief rally often suckers in late buyers right before the final washout. The structure we’re tracking mirrors previous cycle bottoms perfectly—a fake breakout, then a deep sweep into liquidity. 🌊
💡 The path from 83K to 58K, a bounce to 68K, then a final leg down to 38K–45K around October—that’s the blueprint for a genuine cycle low. Once that base sets, the next run to 70K and eventually 109K by early 2027 becomes viable. ⏱️
💬 The real edge right now isn’t buying the hype—it’s patience. Are you waiting for that high-probability entry zone or chasing green candles? 👇
⚠️ Not financial advice. Always manage your risk. 🛡️
🏷️ #BTC #BearishSetup #CycleAnalysis #CryptoStrategy
🦈 🛡️
$BTC LAST DROP BEFORE THE REAL BOTTOM? DON’T FALL FOR THE TRAP! 🚨
Body:
📌 Market optimism is building, but historical Bitcoin cycles show something critical: a strong relief rally often suckers in late buyers right before the final washout. The structure we’re tracking mirrors previous cycle bottoms perfectly—a fake breakout, then a deep sweep into liquidity. 🌊
💡 The path from 83K to 58K, a bounce to 68K, then a final leg down to 38K–45K around October—that’s the blueprint for a genuine cycle low. Once that base sets, the next run to 70K and eventually 109K by early 2027 becomes viable. ⏱️
💬 The real edge right now isn’t buying the hype—it’s patience. Are you waiting for that high-probability entry zone or chasing green candles? 👇
⚠️ Not financial advice. Always manage your risk. 🛡️
🏷️ #BTC #BearishSetup #CycleAnalysis #CryptoStrategy
🦈 🛡️
Body:
📌 Market optimism is building, but historical Bitcoin cycles show something critical: a strong relief rally often suckers in late buyers right before the final washout. The structure we’re tracking mirrors previous cycle bottoms perfectly—a fake breakout, then a deep sweep into liquidity. 🌊
💡 The path from 83K to 58K, a bounce to 68K, then a final leg down to 38K–45K around October—that’s the blueprint for a genuine cycle low. Once that base sets, the next run to 70K and eventually 109K by early 2027 becomes viable. ⏱️
💬 The real edge right now isn’t buying the hype—it’s patience. Are you waiting for that high-probability entry zone or chasing green candles? 👇
⚠️ Not financial advice. Always manage your risk. 🛡️
🏷️ #BTC #BearishSetup #CycleAnalysis #CryptoStrategy
🦈 🛡️
26

·
--
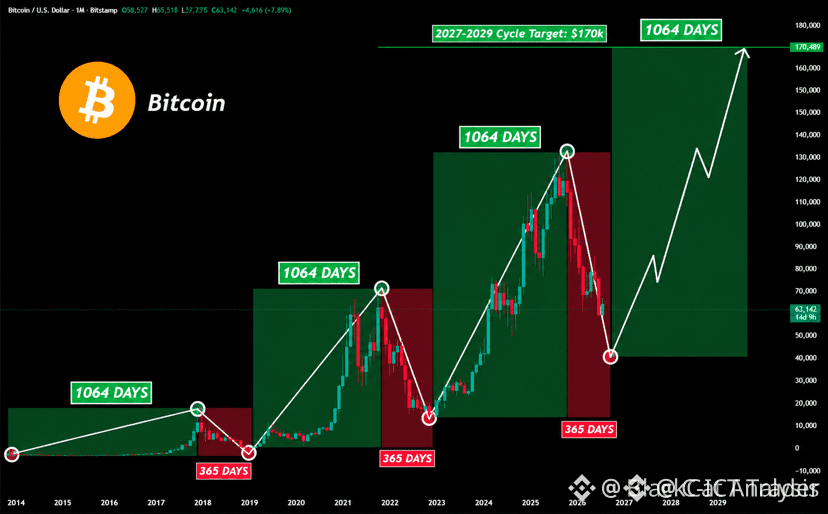
$BTC 'S HISTORICAL CYCLE POINTS TO OCTOBER 2026 AS A KEY BOTTOM WINDOW 🔥
Bitcoin has followed a recurring rhythm for over a decade: roughly 1,064 days of expansion followed by 365 days of contraction. This pattern played out in 2015–2017 (up), 2017–2018 (down), 2018–2021 (up), 2021–2022 (down), and now 2022–2025 (up) with 2025–2026 potentially marking the next contraction.
If history rhymes, October 2026 could be an important window for a long-term bottom — repeatable structure that aligns with prior cycle lows. Do you think the next major $BTC bottom will form around October?
Not financial advice. Always manage your risk.
#BTC #CycleAnalysis #BitcoinBottom #HistoricalPattern
🔥
$BTC 'S HISTORICAL CYCLE POINTS TO OCTOBER 2026 AS A KEY BOTTOM WINDOW 🔥
Bitcoin has followed a recurring rhythm for over a decade: roughly 1,064 days of expansion followed by 365 days of contraction. This pattern played out in 2015–2017 (up), 2017–2018 (down), 2018–2021 (up), 2021–2022 (down), and now 2022–2025 (up) with 2025–2026 potentially marking the next contraction.
If history rhymes, October 2026 could be an important window for a long-term bottom — repeatable structure that aligns with prior cycle lows. Do you think the next major $BTC bottom will form around October?
Not financial advice. Always manage your risk.
#BTC #CycleAnalysis #BitcoinBottom #HistoricalPattern
🔥
Bitcoin has followed a recurring rhythm for over a decade: roughly 1,064 days of expansion followed by 365 days of contraction. This pattern played out in 2015–2017 (up), 2017–2018 (down), 2018–2021 (up), 2021–2022 (down), and now 2022–2025 (up) with 2025–2026 potentially marking the next contraction.
If history rhymes, October 2026 could be an important window for a long-term bottom — repeatable structure that aligns with prior cycle lows. Do you think the next major $BTC bottom will form around October?
Not financial advice. Always manage your risk.
#BTC #CycleAnalysis #BitcoinBottom #HistoricalPattern
🔥
12

·
--
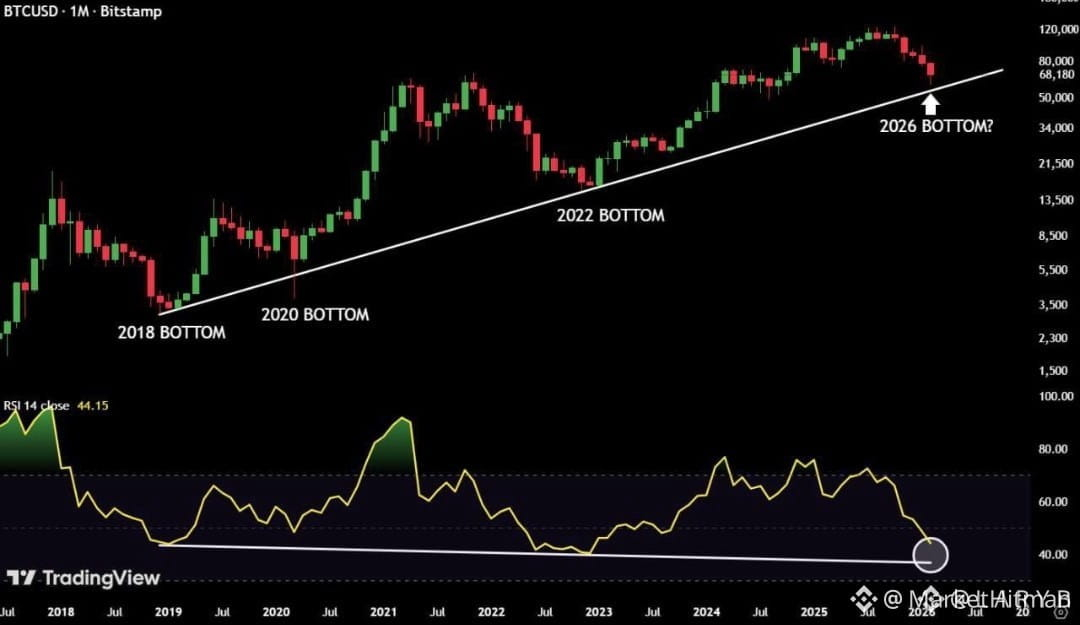
$BTC MONTHLY RSI COULD SIGNAL A 2026 MACRO BOTTOM 👀
Historical data shows that when the monthly RSI drops below 40, Bitcoin has entered deep cycle weakness. According to the 4-year cycle theory, that zone aligns with a potential 2026 macro bottom. Capitulation typically precedes accumulation and the next expansion.
The current monthly RSI is testing this critical threshold. If history repeats, this pain is the foundation for the next bull run. Are you watching the monthly close or already positioning?
Not financial advice. Always manage your risk.
#BTC #CycleAnalysis #RSI #CryptoBottom
🔥
$BTC MONTHLY RSI COULD SIGNAL A 2026 MACRO BOTTOM 👀
Historical data shows that when the monthly RSI drops below 40, Bitcoin has entered deep cycle weakness. According to the 4-year cycle theory, that zone aligns with a potential 2026 macro bottom. Capitulation typically precedes accumulation and the next expansion.
The current monthly RSI is testing this critical threshold. If history repeats, this pain is the foundation for the next bull run. Are you watching the monthly close or already positioning?
Not financial advice. Always manage your risk.
#BTC #CycleAnalysis #RSI #CryptoBottom
🔥
Historical data shows that when the monthly RSI drops below 40, Bitcoin has entered deep cycle weakness. According to the 4-year cycle theory, that zone aligns with a potential 2026 macro bottom. Capitulation typically precedes accumulation and the next expansion.
The current monthly RSI is testing this critical threshold. If history repeats, this pain is the foundation for the next bull run. Are you watching the monthly close or already positioning?
Not financial advice. Always manage your risk.
#BTC #CycleAnalysis #RSI #CryptoBottom
🔥
15
·
--
$BTC | Bitcoin Risk Metric is Benjamin Cowens 0-to-1 normalised cycle-position scale. The qualitative output: near 0 at deep cycle bottoms, near 1 at cycle euphoria peaks, graduates through the middle. The publicly disclosed methodology has held up through both 2021 and 2025 cycles without major formula revision.
Historical Risk Metric anchors at documented cycle inflections:
- 2017-12 cycle top: 0.90
- 2021-03 cycle top: 0.78
- 2015-09 cycle bottom: 0.00
- 2022-12 cycle bottom (FTX collapse): 0.06
Pattern: peaks consistently print Risk above 0.78, bottoms below 0.10. The middle 0.10 to 0.78 band is mid-cycle and does not generate tactical signal by itself.
Where Risk Metric differs from binary indicators like Pi Cycle: continuous and graduated, natively suited to position-sizing functions like "if Risk less than 0.20 size 100 percent; if 0.20 to 0.40 size 70; if 0.40 to 0.60 size 40; if 0.60 to 0.80 size 15; if above 0.80 sale-only stance".
For Australian residents the position-sizing function above needs to be wrapped in 12-month CGT-discount-eligibility logic before becoming real-capital actionable. A Risk reading of 0.85 with a parcel at month 10 of its 12-month hold is almost always better held for the 2-month eligibility crossing than sold immediately. The 47% top-marginal-to-23.5% discounted-rate asymmetry exceeds the tactical-alpha from selling 2 months early.
https://satoshimacro.com/tools/crypto/cycle-indicators/bitcoin-risk-metric/
#SatoshiMacro #BitcoinRiskMetric #CycleAnalysis #Bitcoin
$BTC | Bitcoin Risk Metric is Benjamin Cowens 0-to-1 normalised cycle-position scale. The qualitative output: near 0 at deep cycle bottoms, near 1 at cycle euphoria peaks, graduates through the middle. The publicly disclosed methodology has held up through both 2021 and 2025 cycles without major formula revision.
Historical Risk Metric anchors at documented cycle inflections:
- 2017-12 cycle top: 0.90
- 2021-03 cycle top: 0.78
- 2015-09 cycle bottom: 0.00
- 2022-12 cycle bottom (FTX collapse): 0.06
Pattern: peaks consistently print Risk above 0.78, bottoms below 0.10. The middle 0.10 to 0.78 band is mid-cycle and does not generate tactical signal by itself.
Where Risk Metric differs from binary indicators like Pi Cycle: continuous and graduated, natively suited to position-sizing functions like "if Risk less than 0.20 size 100 percent; if 0.20 to 0.40 size 70; if 0.40 to 0.60 size 40; if 0.60 to 0.80 size 15; if above 0.80 sale-only stance".
For Australian residents the position-sizing function above needs to be wrapped in 12-month CGT-discount-eligibility logic before becoming real-capital actionable. A Risk reading of 0.85 with a parcel at month 10 of its 12-month hold is almost always better held for the 2-month eligibility crossing than sold immediately. The 47% top-marginal-to-23.5% discounted-rate asymmetry exceeds the tactical-alpha from selling 2 months early.
https://satoshimacro.com/tools/crypto/cycle-indicators/bitcoin-risk-metric/
#SatoshiMacro #BitcoinRiskMetric #CycleAnalysis #Bitcoin
Historical Risk Metric anchors at documented cycle inflections:
- 2017-12 cycle top: 0.90
- 2021-03 cycle top: 0.78
- 2015-09 cycle bottom: 0.00
- 2022-12 cycle bottom (FTX collapse): 0.06
Pattern: peaks consistently print Risk above 0.78, bottoms below 0.10. The middle 0.10 to 0.78 band is mid-cycle and does not generate tactical signal by itself.
Where Risk Metric differs from binary indicators like Pi Cycle: continuous and graduated, natively suited to position-sizing functions like "if Risk less than 0.20 size 100 percent; if 0.20 to 0.40 size 70; if 0.40 to 0.60 size 40; if 0.60 to 0.80 size 15; if above 0.80 sale-only stance".
For Australian residents the position-sizing function above needs to be wrapped in 12-month CGT-discount-eligibility logic before becoming real-capital actionable. A Risk reading of 0.85 with a parcel at month 10 of its 12-month hold is almost always better held for the 2-month eligibility crossing than sold immediately. The 47% top-marginal-to-23.5% discounted-rate asymmetry exceeds the tactical-alpha from selling 2 months early.
https://satoshimacro.com/tools/crypto/cycle-indicators/bitcoin-risk-metric/
#SatoshiMacro #BitcoinRiskMetric #CycleAnalysis #Bitcoin
1
156

·
--
Bullish
🚨 BITCOIN SENTIMENT SHIFT WATCH 🚨
$BTC is under pressure again… and the market narrative is flipping fast.
📉 Some analysts warn: a deeper sweep toward $17K zone could be needed to reset sentiment and bring sidelined investors back in.
💬 Reality check:
At $60K, demand is fading…
At lower levels, liquidity usually returns.
This is how cycles work: 🔻 High prices test conviction
🔺 Low prices test patience
Right now = uncertainty phase, not final clarity.
The real question: Will BTC find demand before panic… or after it?
EP: Current Market Price
🎯 TP1: $42K rebound zone
🎯 TP2: $50K recovery extension
🛑 SL: $17K breakdown invalidation scenario depends on structure (macro support failure)
#BTC #Bitcoin #CryptoMarket #CycleAnalysis #liquidity
$BTC
{spot}(BTCUSDT)
🚨 BITCOIN SENTIMENT SHIFT WATCH 🚨
$BTC is under pressure again… and the market narrative is flipping fast.
📉 Some analysts warn: a deeper sweep toward $17K zone could be needed to reset sentiment and bring sidelined investors back in.
💬 Reality check:
At $60K, demand is fading…
At lower levels, liquidity usually returns.
This is how cycles work: 🔻 High prices test conviction
🔺 Low prices test patience
Right now = uncertainty phase, not final clarity.
The real question: Will BTC find demand before panic… or after it?
EP: Current Market Price
🎯 TP1: $42K rebound zone
🎯 TP2: $50K recovery extension
🛑 SL: $17K breakdown invalidation scenario depends on structure (macro support failure)
#BTC #Bitcoin #CryptoMarket #CycleAnalysis #liquidity
$BTC
$BTC is under pressure again… and the market narrative is flipping fast.
📉 Some analysts warn: a deeper sweep toward $17K zone could be needed to reset sentiment and bring sidelined investors back in.
💬 Reality check:
At $60K, demand is fading…
At lower levels, liquidity usually returns.
This is how cycles work: 🔻 High prices test conviction
🔺 Low prices test patience
Right now = uncertainty phase, not final clarity.
The real question: Will BTC find demand before panic… or after it?
EP: Current Market Price
🎯 TP1: $42K rebound zone
🎯 TP2: $50K recovery extension
🛑 SL: $17K breakdown invalidation scenario depends on structure (macro support failure)
#BTC #Bitcoin #CryptoMarket #CycleAnalysis #liquidity
$BTC
17

·
--
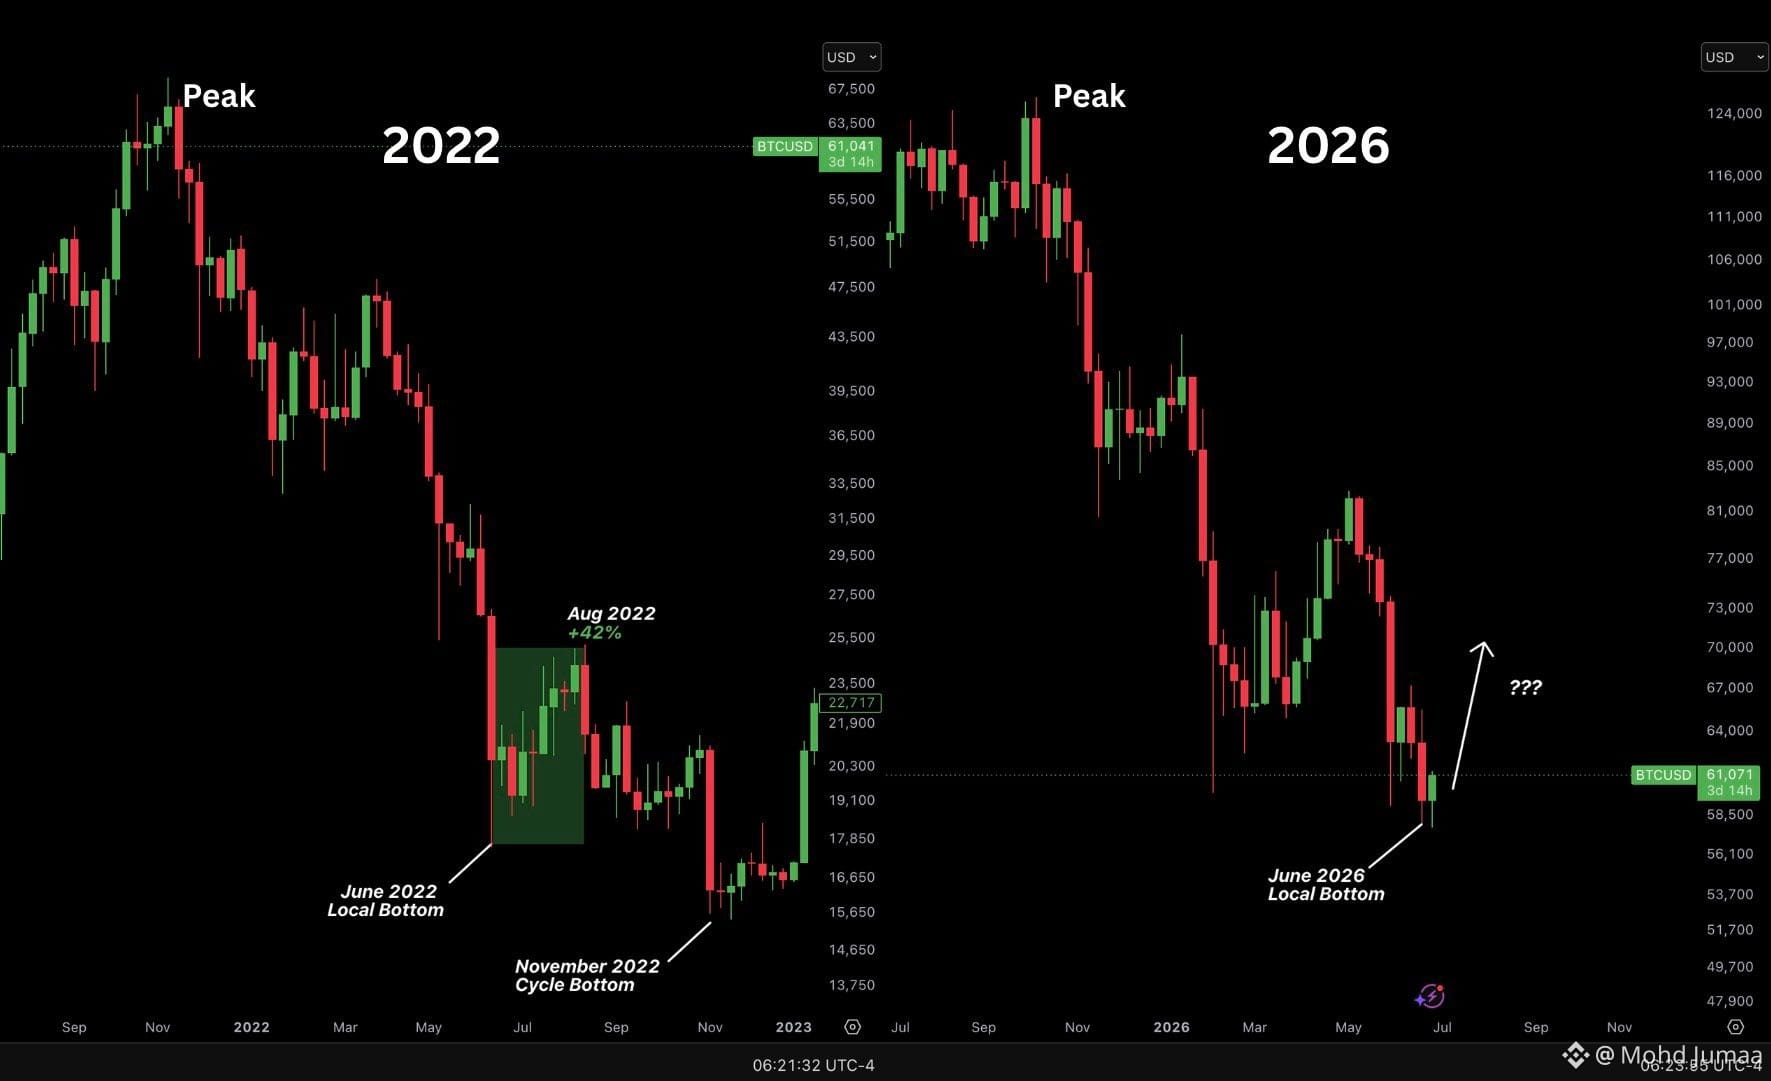
🚨 $BTC Market Cycle Insight 🚨
Is Bitcoin setting up for an $80K move in August? 👀
History doesn’t repeat, but it often rhymes.
📊 2022 Bear Market Structure:
• $BTC bottomed around $17,600 (June 2022)
• Then rallied +42% into August
• Eventually formed the final cycle bottom near $15,500 in November 2022
That move was a classic bear market relief rally before final capitulation.
📊 Current Market Structure (2026):
• $BTC recently formed a local bottom near $57,700 in June
• Price is showing early signs of recovery and liquidity rotation
• Market sentiment is still cautious similar to mid-2022 structure
📈 If the pattern repeats:
A similar +42% rally from $57.7K projects toward:
👉 $80K–$82K zone
This could align with a late summer relief rally before a possible macro driven correction later in the year (Q4 risk window).
⚠️ Important Note:
This is not a guaranteed outcome it's a cycle-based comparison, not a prediction. Macro conditions (Fed policy, CPI, liquidity) will still control direction.
🧠 Market takeaway:
If $BTC continues holding higher lows above the June base, momentum could favor a strong summer expansion phase before the next major cycle reset.
#BTC #BitcoinAnalysis #bullish #CycleAnalysis
🚨 $BTC Market Cycle Insight 🚨
Is Bitcoin setting up for an $80K move in August? 👀
History doesn’t repeat, but it often rhymes.
📊 2022 Bear Market Structure:
• $BTC bottomed around $17,600 (June 2022)
• Then rallied +42% into August
• Eventually formed the final cycle bottom near $15,500 in November 2022
That move was a classic bear market relief rally before final capitulation.
📊 Current Market Structure (2026):
• $BTC recently formed a local bottom near $57,700 in June
• Price is showing early signs of recovery and liquidity rotation
• Market sentiment is still cautious similar to mid-2022 structure
📈 If the pattern repeats:
A similar +42% rally from $57.7K projects toward:
👉 $80K–$82K zone
This could align with a late summer relief rally before a possible macro driven correction later in the year (Q4 risk window).
⚠️ Important Note:
This is not a guaranteed outcome it's a cycle-based comparison, not a prediction. Macro conditions (Fed policy, CPI, liquidity) will still control direction.
🧠 Market takeaway:
If $BTC continues holding higher lows above the June base, momentum could favor a strong summer expansion phase before the next major cycle reset.
#BTC #BitcoinAnalysis #bullish #CycleAnalysis
Is Bitcoin setting up for an $80K move in August? 👀
History doesn’t repeat, but it often rhymes.
📊 2022 Bear Market Structure:
• $BTC bottomed around $17,600 (June 2022)
• Then rallied +42% into August
• Eventually formed the final cycle bottom near $15,500 in November 2022
That move was a classic bear market relief rally before final capitulation.
📊 Current Market Structure (2026):
• $BTC recently formed a local bottom near $57,700 in June
• Price is showing early signs of recovery and liquidity rotation
• Market sentiment is still cautious similar to mid-2022 structure
📈 If the pattern repeats:
A similar +42% rally from $57.7K projects toward:
👉 $80K–$82K zone
This could align with a late summer relief rally before a possible macro driven correction later in the year (Q4 risk window).
⚠️ Important Note:
This is not a guaranteed outcome it's a cycle-based comparison, not a prediction. Macro conditions (Fed policy, CPI, liquidity) will still control direction.
🧠 Market takeaway:
If $BTC continues holding higher lows above the June base, momentum could favor a strong summer expansion phase before the next major cycle reset.
#BTC #BitcoinAnalysis #bullish #CycleAnalysis
3
1
182
🚨 HISTORICAL CYCLE DATA SIGNALS THE FINAL $BTC BEAR BOTTOM IS 20 DAYS AWAY! 💥
Cycle math across previous crypto eras reveals a precise 364-day duration from peak expansion to structural market trough. 📊 Quantitative data points to early October as the final reset window for $BTC , leaving a narrow 20-day horizon before aggressive bids return.
High-profile macro quants who executed the short from $74,688 have already begun shifting structural positioning. 💡 Order flow metrics suggest institutional liquidity is preparing for the next macro impulse cycle.
💬 Are you positioning ahead of this time-based cycle reversal or waiting for price action to confirm? 👇
⚠️ Not financial advice. Always manage your risk. 🛡️
🏷️ #BTC #Bitcoin #Crypto #CycleAnalysis #MarketUpdate
🔥 💎
🚨 HISTORICAL CYCLE DATA SIGNALS THE FINAL $BTC BEAR BOTTOM IS 20 DAYS AWAY! 💥
Cycle math across previous crypto eras reveals a precise 364-day duration from peak expansion to structural market trough. 📊 Quantitative data points to early October as the final reset window for $BTC , leaving a narrow 20-day horizon before aggressive bids return.
High-profile macro quants who executed the short from $74,688 have already begun shifting structural positioning. 💡 Order flow metrics suggest institutional liquidity is preparing for the next macro impulse cycle.
💬 Are you positioning ahead of this time-based cycle reversal or waiting for price action to confirm? 👇
⚠️ Not financial advice. Always manage your risk. 🛡️
🏷️ #BTC #Bitcoin #Crypto #CycleAnalysis #MarketUpdate
🔥 💎
Cycle math across previous crypto eras reveals a precise 364-day duration from peak expansion to structural market trough. 📊 Quantitative data points to early October as the final reset window for $BTC , leaving a narrow 20-day horizon before aggressive bids return.
High-profile macro quants who executed the short from $74,688 have already begun shifting structural positioning. 💡 Order flow metrics suggest institutional liquidity is preparing for the next macro impulse cycle.
💬 Are you positioning ahead of this time-based cycle reversal or waiting for price action to confirm? 👇
⚠️ Not financial advice. Always manage your risk. 🛡️
🏷️ #BTC #Bitcoin #Crypto #CycleAnalysis #MarketUpdate
🔥 💎
17

·
--
🚨 $BTC CYCLE TEMPLATE IS SHATTERING AS CYCLE INTERVALS SHRINK TO RECORD LOWS! 📊
Bitcoin sits at 342 days without a new peak, leading retail to believe this market is stalling. 📊 But on-chain metrics reveal a structural shift: the duration from top to new high compressed from 1,180 days down to 849 days in the last cycle.
The four-year post-halving playbook is officially expiring while smart capital front-runs the next expansion phase. 💡 As cycle compression accelerates, the next explosive breakout could strike much sooner than legacy models predict. 💬 Is the consensus waiting for 2028 about to get left behind in the dust? 👇
⚠️ Not financial advice. Always manage your risk. 🛡️
🏷️ #BTC #Bitcoin #CycleAnalysis #OnChain #Crypto
⚡ 🐂
🚨 $BTC CYCLE TEMPLATE IS SHATTERING AS CYCLE INTERVALS SHRINK TO RECORD LOWS! 📊
Bitcoin sits at 342 days without a new peak, leading retail to believe this market is stalling. 📊 But on-chain metrics reveal a structural shift: the duration from top to new high compressed from 1,180 days down to 849 days in the last cycle.
The four-year post-halving playbook is officially expiring while smart capital front-runs the next expansion phase. 💡 As cycle compression accelerates, the next explosive breakout could strike much sooner than legacy models predict. 💬 Is the consensus waiting for 2028 about to get left behind in the dust? 👇
⚠️ Not financial advice. Always manage your risk. 🛡️
🏷️ #BTC #Bitcoin #CycleAnalysis #OnChain #Crypto
⚡ 🐂
Bitcoin sits at 342 days without a new peak, leading retail to believe this market is stalling. 📊 But on-chain metrics reveal a structural shift: the duration from top to new high compressed from 1,180 days down to 849 days in the last cycle.
The four-year post-halving playbook is officially expiring while smart capital front-runs the next expansion phase. 💡 As cycle compression accelerates, the next explosive breakout could strike much sooner than legacy models predict. 💬 Is the consensus waiting for 2028 about to get left behind in the dust? 👇
⚠️ Not financial advice. Always manage your risk. 🛡️
🏷️ #BTC #Bitcoin #CycleAnalysis #OnChain #Crypto
⚡ 🐂
16

·
--
🚨 $BTC APPROACHING CYCLE BOTTOM IN 51 DAYS – BE READY 🟢
📊 The macro rhythm has been eerily consistent: 1,065‑day bull phases sandwiched between 365‑day bear squeezes. Historical data shows each bear leg cleanses liquidity, setting the stage for a fresh accumulation wave. 🦈 Smart money is likely seeding order blocks around the $79K‑$80K zone, primed to capture the next upside once the 51‑day window closes.
💡 With the next bearish leg projected to end before October, the risk‑reward tilt favors early positioning ahead of the liquidity vacuum. 🤔 Are you aligning your exposure to the impending bottom or waiting for the final shakeout? 👇
⚠️ Not financial advice. Always manage your risk. 🛡️
🏷️ #BTC #CycleAnalysis #BearMarket #SmartMoney #Crypto
🚀 💎
🚨 $BTC APPROACHING CYCLE BOTTOM IN 51 DAYS – BE READY 🟢
📊 The macro rhythm has been eerily consistent: 1,065‑day bull phases sandwiched between 365‑day bear squeezes. Historical data shows each bear leg cleanses liquidity, setting the stage for a fresh accumulation wave. 🦈 Smart money is likely seeding order blocks around the $79K‑$80K zone, primed to capture the next upside once the 51‑day window closes.
💡 With the next bearish leg projected to end before October, the risk‑reward tilt favors early positioning ahead of the liquidity vacuum. 🤔 Are you aligning your exposure to the impending bottom or waiting for the final shakeout? 👇
⚠️ Not financial advice. Always manage your risk. 🛡️
🏷️ #BTC #CycleAnalysis #BearMarket #SmartMoney #Crypto
🚀 💎
📊 The macro rhythm has been eerily consistent: 1,065‑day bull phases sandwiched between 365‑day bear squeezes. Historical data shows each bear leg cleanses liquidity, setting the stage for a fresh accumulation wave. 🦈 Smart money is likely seeding order blocks around the $79K‑$80K zone, primed to capture the next upside once the 51‑day window closes.
💡 With the next bearish leg projected to end before October, the risk‑reward tilt favors early positioning ahead of the liquidity vacuum. 🤔 Are you aligning your exposure to the impending bottom or waiting for the final shakeout? 👇
⚠️ Not financial advice. Always manage your risk. 🛡️
🏷️ #BTC #CycleAnalysis #BearMarket #SmartMoney #Crypto
🚀 💎
26
·
--
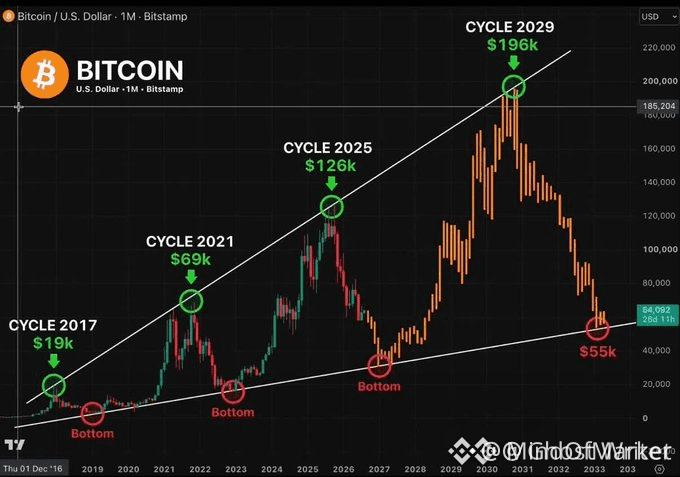
🚨 MACRO ROADMAP: EXECUTING THE NEXT CYCLE LIQUIDITY ACCUMULATION ON $BTC 🔍
Institutional cycle mapping demands methodical timing over emotion. Strategic dollar-cost accumulation for $BTC begins between Q4 2026 and Q1 2027, aiming for deep structural value before the macro trend expands. Secondary allocations into select assets like $SOL and $TAO will systematically build throughout 2027. 📊
Distribution unfolds across calculated liquidity windows: altcoins exit from late 2028 into early 2029, while final $BTC holdings distribute by late August 2029. Projected peak expansion ranges realistically between $120,000 and $200,000, filtering out ungrounded retail targets. 🔍
Preserving upside requires executing a long-range blueprint rather than chasing short-term volatility. 💬 Is your macro cycle roadmap mapped out, or are you reacting day-to-day? 👇
⚠️ Not financial advice. Always manage your risk. 🛡️
🏷️ #BTC #MacroStrategy #Bitcoin #CycleAnalysis #Crypto
🎯 🦈
🚨 MACRO ROADMAP: EXECUTING THE NEXT CYCLE LIQUIDITY ACCUMULATION ON $BTC 🔍
Institutional cycle mapping demands methodical timing over emotion. Strategic dollar-cost accumulation for $BTC begins between Q4 2026 and Q1 2027, aiming for deep structural value before the macro trend expands. Secondary allocations into select assets like $SOL and $TAO will systematically build throughout 2027. 📊
Distribution unfolds across calculated liquidity windows: altcoins exit from late 2028 into early 2029, while final $BTC holdings distribute by late August 2029. Projected peak expansion ranges realistically between $120,000 and $200,000, filtering out ungrounded retail targets. 🔍
Preserving upside requires executing a long-range blueprint rather than chasing short-term volatility. 💬 Is your macro cycle roadmap mapped out, or are you reacting day-to-day? 👇
⚠️ Not financial advice. Always manage your risk. 🛡️
🏷️ #BTC #MacroStrategy #Bitcoin #CycleAnalysis #Crypto
🎯 🦈
Institutional cycle mapping demands methodical timing over emotion. Strategic dollar-cost accumulation for $BTC begins between Q4 2026 and Q1 2027, aiming for deep structural value before the macro trend expands. Secondary allocations into select assets like $SOL and $TAO will systematically build throughout 2027. 📊
Distribution unfolds across calculated liquidity windows: altcoins exit from late 2028 into early 2029, while final $BTC holdings distribute by late August 2029. Projected peak expansion ranges realistically between $120,000 and $200,000, filtering out ungrounded retail targets. 🔍
Preserving upside requires executing a long-range blueprint rather than chasing short-term volatility. 💬 Is your macro cycle roadmap mapped out, or are you reacting day-to-day? 👇
⚠️ Not financial advice. Always manage your risk. 🛡️
🏷️ #BTC #MacroStrategy #Bitcoin #CycleAnalysis #Crypto
🎯 🦈
87
·
--
HODLer Supply Cliffs: The On-Chain Signal Most Traders Ignore
Bitcoin's UTXO age band data is one of the most underrated tools in crypto cycle analysis. When you segment $BTC supply by how long coins have been dormant — 1 month, 6 months, 1 year, 2+ years — you start to see something powerful: supply cliffs.
A supply cliff forms when a large tranche of long-dormant coins begins moving. Long-term holders who accumulated during a bear market are rotating into fresh demand. Historically, when the 1-2 year age band starts declining while price is rising, it signals that patient money is distributing into strength — a classic late-cycle tell.
The inverse is equally useful. When $ETH shows rising dormancy across the 6-12 month cohort during a price drawdown, it signals that sellers are exhausted and conviction holders are absorbing supply. That compression is where the next leg is quietly being built.
$BNB and other ecosystems exhibit similar patterns through staking lockup mechanics — staked supply growing during corrections signals the same HODLer conviction dynamic.
The lesson: price tells you what the market is doing right now. UTXO age bands tell you what long-term capital is doing. Follow the patient money.
On-chain behavior is the market's honest signal — read it before price confirms it.
#Bitcoin #OnChainAnalysis #CryptoMarkets #HODLer #CycleAnalysis
HODLer Supply Cliffs: The On-Chain Signal Most Traders Ignore
Bitcoin's UTXO age band data is one of the most underrated tools in crypto cycle analysis. When you segment $BTC supply by how long coins have been dormant — 1 month, 6 months, 1 year, 2+ years — you start to see something powerful: supply cliffs.
A supply cliff forms when a large tranche of long-dormant coins begins moving. Long-term holders who accumulated during a bear market are rotating into fresh demand. Historically, when the 1-2 year age band starts declining while price is rising, it signals that patient money is distributing into strength — a classic late-cycle tell.
The inverse is equally useful. When $ETH shows rising dormancy across the 6-12 month cohort during a price drawdown, it signals that sellers are exhausted and conviction holders are absorbing supply. That compression is where the next leg is quietly being built.
$BNB and other ecosystems exhibit similar patterns through staking lockup mechanics — staked supply growing during corrections signals the same HODLer conviction dynamic.
The lesson: price tells you what the market is doing right now. UTXO age bands tell you what long-term capital is doing. Follow the patient money.
On-chain behavior is the market's honest signal — read it before price confirms it.
#Bitcoin #OnChainAnalysis #CryptoMarkets #HODLer #CycleAnalysis
Bitcoin's UTXO age band data is one of the most underrated tools in crypto cycle analysis. When you segment $BTC supply by how long coins have been dormant — 1 month, 6 months, 1 year, 2+ years — you start to see something powerful: supply cliffs.
A supply cliff forms when a large tranche of long-dormant coins begins moving. Long-term holders who accumulated during a bear market are rotating into fresh demand. Historically, when the 1-2 year age band starts declining while price is rising, it signals that patient money is distributing into strength — a classic late-cycle tell.
The inverse is equally useful. When $ETH shows rising dormancy across the 6-12 month cohort during a price drawdown, it signals that sellers are exhausted and conviction holders are absorbing supply. That compression is where the next leg is quietly being built.
$BNB and other ecosystems exhibit similar patterns through staking lockup mechanics — staked supply growing during corrections signals the same HODLer conviction dynamic.
The lesson: price tells you what the market is doing right now. UTXO age bands tell you what long-term capital is doing. Follow the patient money.
On-chain behavior is the market's honest signal — read it before price confirms it.
#Bitcoin #OnChainAnalysis #CryptoMarkets #HODLer #CycleAnalysis
64
Log in to explore more content
Join global crypto users on Binance Square
⚡️ Get latest and useful information about crypto.
💬 Trusted by the world’s largest crypto exchange.
👍 Discover real insights from verified creators.
Email / Phone number
Trending Topics
1
#SaylorHintsStrategyBitcoinBuy
2.3M views
12,543 Discussing
2
#BOJRaisesRatesTo31YearHigh
265,785 views
3,337 Discussing
3
#BuffettStepsDownAsBerkshireChairman
130,926 views
1,810 Discussing
4
#XRPExchangeReservesHitSevenYearLow
143,336 views
1,580 Discussing
5
#HKCompletesFirstHKDStablecoinUseCase
160,966 views
1,946 Discussing
6
#VietnamPlansFirstCryptoLicensesIn2026
101,522 views
1,318 Discussing
7
#BTCBreaks80K
551,526 views
5,830 Discussing
8
#BitcoinMarketCapTopsTesla
137,017 views
1,431 Discussing
9
#SOLJumpsAbout10%
137,194 views
1,283 Discussing
10
#EthereumReclaims$2600
12,572 views
140 Discussing