
#cryptoanalysis.
cryptoanalysis.
5,400 views
33 Discussing
Hot
Latest

·
--
🚀 $BTC Technical Analysis: Is Bitcoin Preparing for a Breakout?
Bitcoin is currently testing key dynamic resistance near the 50-EMA as price consolidates inside a critical demand zone.
Key Technical Levels:
* Major Resistance: $82,500 – A daily close above this level confirms bullish continuation toward liquidity pools at $85,000.
* Core Support: $80,200 – Holding this structural demand zone is crucial for maintaining the medium-term bullish bias.
Trading Scenarios:
* Bullish Case: High-volume breakout and retest above key resistance opens immediate upside targets.
* Invalidation: Loss of major support signals a deeper sweep of lower liquidity before the next impulse wave.
Always practice strict risk management and set stop-loss orders according to your trade plan.
#BTC #BitcoinETFs #CryptoAnalysis. #BinanceSquare #Crytotrading
🚀 $BTC Technical Analysis: Is Bitcoin Preparing for a Breakout?
Bitcoin is currently testing key dynamic resistance near the 50-EMA as price consolidates inside a critical demand zone.
Key Technical Levels:
* Major Resistance: $82,500 – A daily close above this level confirms bullish continuation toward liquidity pools at $85,000.
* Core Support: $80,200 – Holding this structural demand zone is crucial for maintaining the medium-term bullish bias.
Trading Scenarios:
* Bullish Case: High-volume breakout and retest above key resistance opens immediate upside targets.
* Invalidation: Loss of major support signals a deeper sweep of lower liquidity before the next impulse wave.
Always practice strict risk management and set stop-loss orders according to your trade plan.
#BTC #BitcoinETFs #CryptoAnalysis. #BinanceSquare #Crytotrading
Bitcoin is currently testing key dynamic resistance near the 50-EMA as price consolidates inside a critical demand zone.
Key Technical Levels:
* Major Resistance: $82,500 – A daily close above this level confirms bullish continuation toward liquidity pools at $85,000.
* Core Support: $80,200 – Holding this structural demand zone is crucial for maintaining the medium-term bullish bias.
Trading Scenarios:
* Bullish Case: High-volume breakout and retest above key resistance opens immediate upside targets.
* Invalidation: Loss of major support signals a deeper sweep of lower liquidity before the next impulse wave.
Always practice strict risk management and set stop-loss orders according to your trade plan.
#BTC #BitcoinETFs #CryptoAnalysis. #BinanceSquare #Crytotrading
1
118

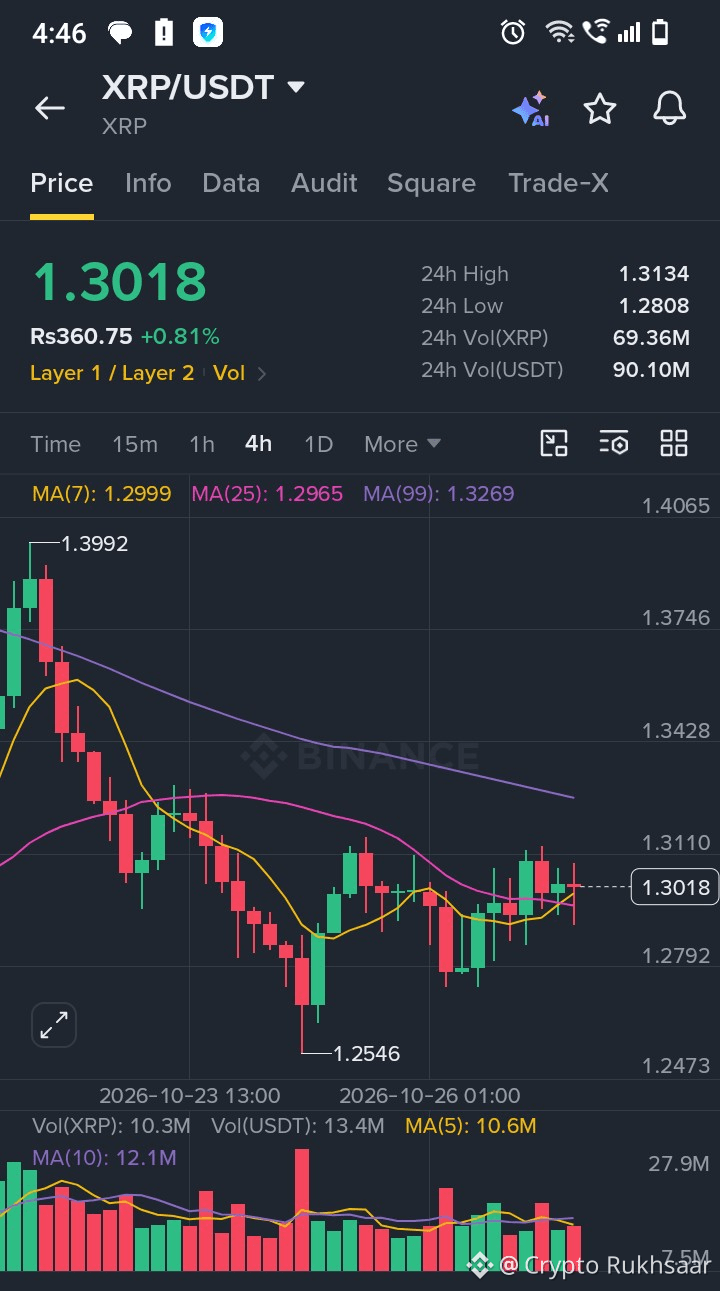
$XRP at a Turning Point — Bullish Breakout or Another Drop?
XRP is approaching a critical zone where the next move could shape its short-term trend. 👀
📈 Bullish Scenario: A strong breakout above $1.34, supported by rising trading volume, could open the door toward $1.38–$1.41.
⚠️ Bearish Scenario: If $1.25 support breaks, XRP could face further downside toward $1.20.
🎯 Key Levels to Watch: • Support: $1.25 • Resistance: $1.34 • Upside targets: $1.38–$1.41
My view: Confirmation matters more than speculation. Watch price action and volume before drawing conclusions.
💬 What’s your take on $XRP — a recovery toward $1.41 or another test of lower support?
#XRP’ #CryptoAnalysis. #priceprediction #CryptoMarket #TradingSignals
$XRP at a Turning Point — Bullish Breakout or Another Drop?
XRP is approaching a critical zone where the next move could shape its short-term trend. 👀
📈 Bullish Scenario: A strong breakout above $1.34, supported by rising trading volume, could open the door toward $1.38–$1.41.
⚠️ Bearish Scenario: If $1.25 support breaks, XRP could face further downside toward $1.20.
🎯 Key Levels to Watch: • Support: $1.25 • Resistance: $1.34 • Upside targets: $1.38–$1.41
My view: Confirmation matters more than speculation. Watch price action and volume before drawing conclusions.
💬 What’s your take on $XRP — a recovery toward $1.41 or another test of lower support?
#XRP’ #CryptoAnalysis. #priceprediction #CryptoMarket #TradingSignals
XRP is approaching a critical zone where the next move could shape its short-term trend. 👀
📈 Bullish Scenario: A strong breakout above $1.34, supported by rising trading volume, could open the door toward $1.38–$1.41.
⚠️ Bearish Scenario: If $1.25 support breaks, XRP could face further downside toward $1.20.
🎯 Key Levels to Watch: • Support: $1.25 • Resistance: $1.34 • Upside targets: $1.38–$1.41
My view: Confirmation matters more than speculation. Watch price action and volume before drawing conclusions.
💬 What’s your take on $XRP — a recovery toward $1.41 or another test of lower support?
#XRP’ #CryptoAnalysis. #priceprediction #CryptoMarket #TradingSignals
2
61

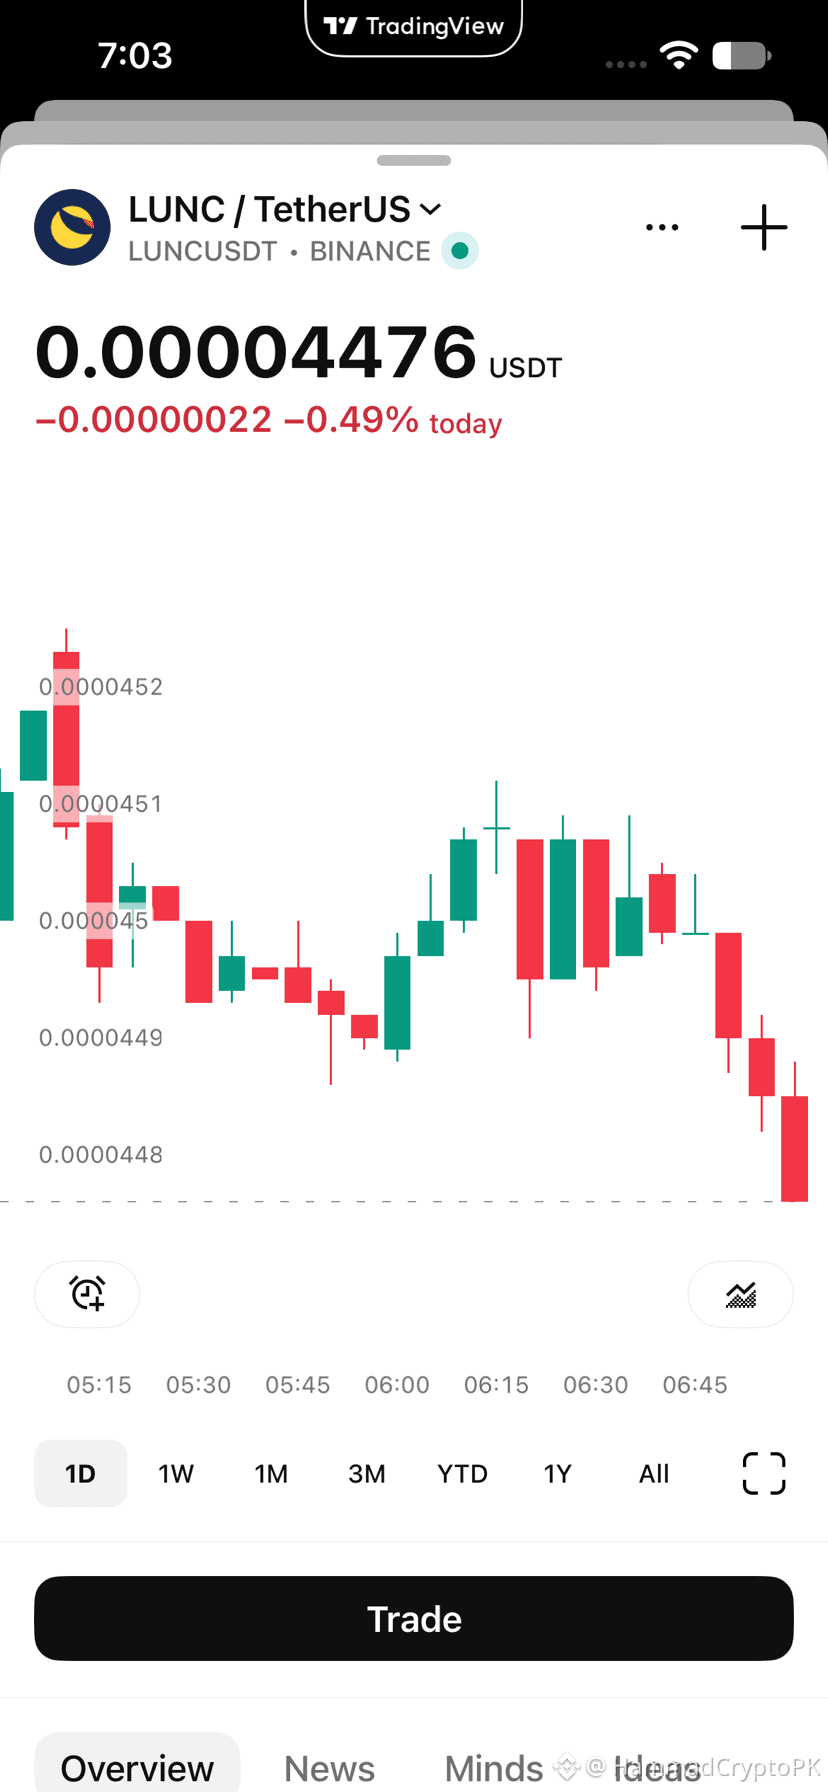
🚨 I SAW $LUNC TESTING $0.00004476! ⚠️
I saw $LUNC pull back and consolidate near $0.00004476 (-0.49% today)!
🔹 Target: $0.00004510+
🔹 Support: $0.00004470
Breakout above $0.00004500 or retesting support?
Drop your prediction below! 👇
DYOR.
#LUNC✅ 🔥🔥 #TerraClassicRevival #BinanceSquare #CryptoAnalysis. #write2earn🌐💹
{spot}(LUNCUSDT)
🚨 I SAW $LUNC TESTING $0.00004476! ⚠️
I saw $LUNC pull back and consolidate near $0.00004476 (-0.49% today)!
🔹 Target: $0.00004510+
🔹 Support: $0.00004470
Breakout above $0.00004500 or retesting support?
Drop your prediction below! 👇
DYOR.
#LUNC✅ 🔥🔥 #TerraClassicRevival #BinanceSquare #CryptoAnalysis. #write2earn🌐💹
I saw $LUNC pull back and consolidate near $0.00004476 (-0.49% today)!
🔹 Target: $0.00004510+
🔹 Support: $0.00004470
Breakout above $0.00004500 or retesting support?
Drop your prediction below! 👇
DYOR.
#LUNC✅ 🔥🔥 #TerraClassicRevival #BinanceSquare #CryptoAnalysis. #write2earn🌐💹
1
5
661

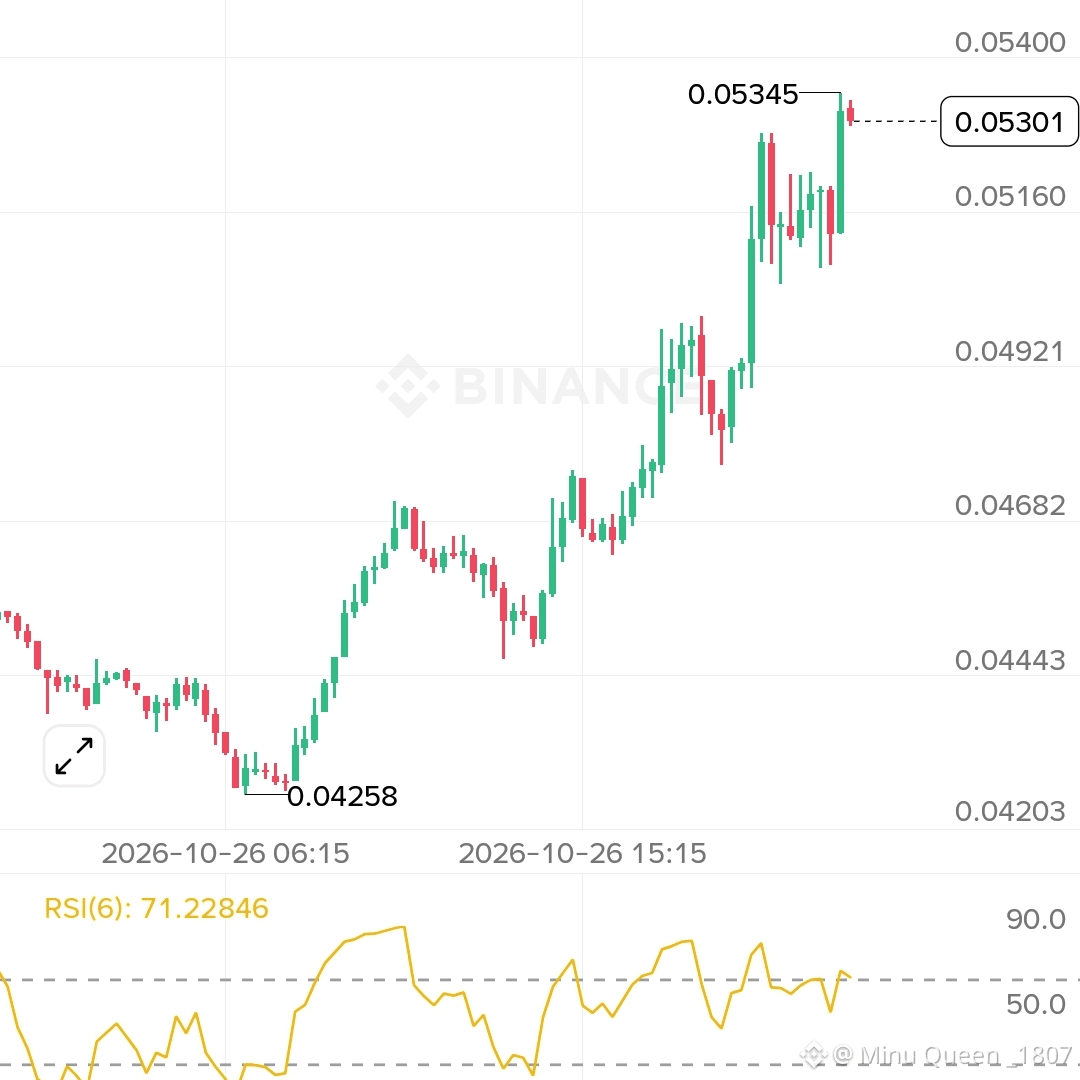
🚀 $CHIP 🚀 BULLISH BREAKOUT OR NEXT BIG MOVE? 🔥
💎 CHIP/USDT TRADING SIGNAL | SPOT
🟢 Direction: LONG / SPOT BUY
💰 Current Price: 0.05301 USDT
📍 Entry Zone: 0.05150 – 0.05250
🎯 TP1: 0.05400
🎯 TP2: 0.05550
🎯 TP3: 0.05800
🛑 Stop Loss: 0.04980
⚡ Leverage: Spot (No Leverage)
📊 TECHNICAL ANALYSIS 🔍
🔥 CHIP is showing strong bullish momentum after rallying from 0.04258 to 0.05345, with a sharp increase in trading volume!
📈 Bullish Signs:
✅ Strong upward price structure
✅ Rising volume supports buying interest
⚠️ RSI(6) is around 71.2, indicating short-term overbought conditions.
🎯 Key Resistance: 0.05345 – 0.05400
🛡️ Key Support: 0.05160, then 0.04980
💡 Trading Strategy: Watch for a confirmed breakout above 0.05345 or a healthy pullback into the entry zone. Avoid FOMO buying near resistance!
🚀 Can CHIP push toward 0.05800? Keep your eyes on volume and price action! 🔥
⚠️ Risk Warning: This is a technical-analysis scenario, not a guaranteed prediction. Targets and stop loss are illustrative, based on the provided chart, and should be reassessed before entry. Always DYOR, use proper risk management, and never invest more than you can afford to lose.
#CHIP #CryptoTrading #BinanceSquareBTC #ALTCOİNS #CryptoAnalysis.
{future}(CHIPUSDT)
🚀 $CHIP 🚀 BULLISH BREAKOUT OR NEXT BIG MOVE? 🔥
💎 CHIP/USDT TRADING SIGNAL | SPOT
🟢 Direction: LONG / SPOT BUY
💰 Current Price: 0.05301 USDT
📍 Entry Zone: 0.05150 – 0.05250
🎯 TP1: 0.05400
🎯 TP2: 0.05550
🎯 TP3: 0.05800
🛑 Stop Loss: 0.04980
⚡ Leverage: Spot (No Leverage)
📊 TECHNICAL ANALYSIS 🔍
🔥 CHIP is showing strong bullish momentum after rallying from 0.04258 to 0.05345, with a sharp increase in trading volume!
📈 Bullish Signs:
✅ Strong upward price structure
✅ Rising volume supports buying interest
⚠️ RSI(6) is around 71.2, indicating short-term overbought conditions.
🎯 Key Resistance: 0.05345 – 0.05400
🛡️ Key Support: 0.05160, then 0.04980
💡 Trading Strategy: Watch for a confirmed breakout above 0.05345 or a healthy pullback into the entry zone. Avoid FOMO buying near resistance!
🚀 Can CHIP push toward 0.05800? Keep your eyes on volume and price action! 🔥
⚠️ Risk Warning: This is a technical-analysis scenario, not a guaranteed prediction. Targets and stop loss are illustrative, based on the provided chart, and should be reassessed before entry. Always DYOR, use proper risk management, and never invest more than you can afford to lose.
#CHIP #CryptoTrading #BinanceSquareBTC #ALTCOİNS #CryptoAnalysis.
💎 CHIP/USDT TRADING SIGNAL | SPOT
🟢 Direction: LONG / SPOT BUY
💰 Current Price: 0.05301 USDT
📍 Entry Zone: 0.05150 – 0.05250
🎯 TP1: 0.05400
🎯 TP2: 0.05550
🎯 TP3: 0.05800
🛑 Stop Loss: 0.04980
⚡ Leverage: Spot (No Leverage)
📊 TECHNICAL ANALYSIS 🔍
🔥 CHIP is showing strong bullish momentum after rallying from 0.04258 to 0.05345, with a sharp increase in trading volume!
📈 Bullish Signs:
✅ Strong upward price structure
✅ Rising volume supports buying interest
⚠️ RSI(6) is around 71.2, indicating short-term overbought conditions.
🎯 Key Resistance: 0.05345 – 0.05400
🛡️ Key Support: 0.05160, then 0.04980
💡 Trading Strategy: Watch for a confirmed breakout above 0.05345 or a healthy pullback into the entry zone. Avoid FOMO buying near resistance!
🚀 Can CHIP push toward 0.05800? Keep your eyes on volume and price action! 🔥
⚠️ Risk Warning: This is a technical-analysis scenario, not a guaranteed prediction. Targets and stop loss are illustrative, based on the provided chart, and should be reassessed before entry. Always DYOR, use proper risk management, and never invest more than you can afford to lose.
#CHIP #CryptoTrading #BinanceSquareBTC #ALTCOİNS #CryptoAnalysis.
1
176

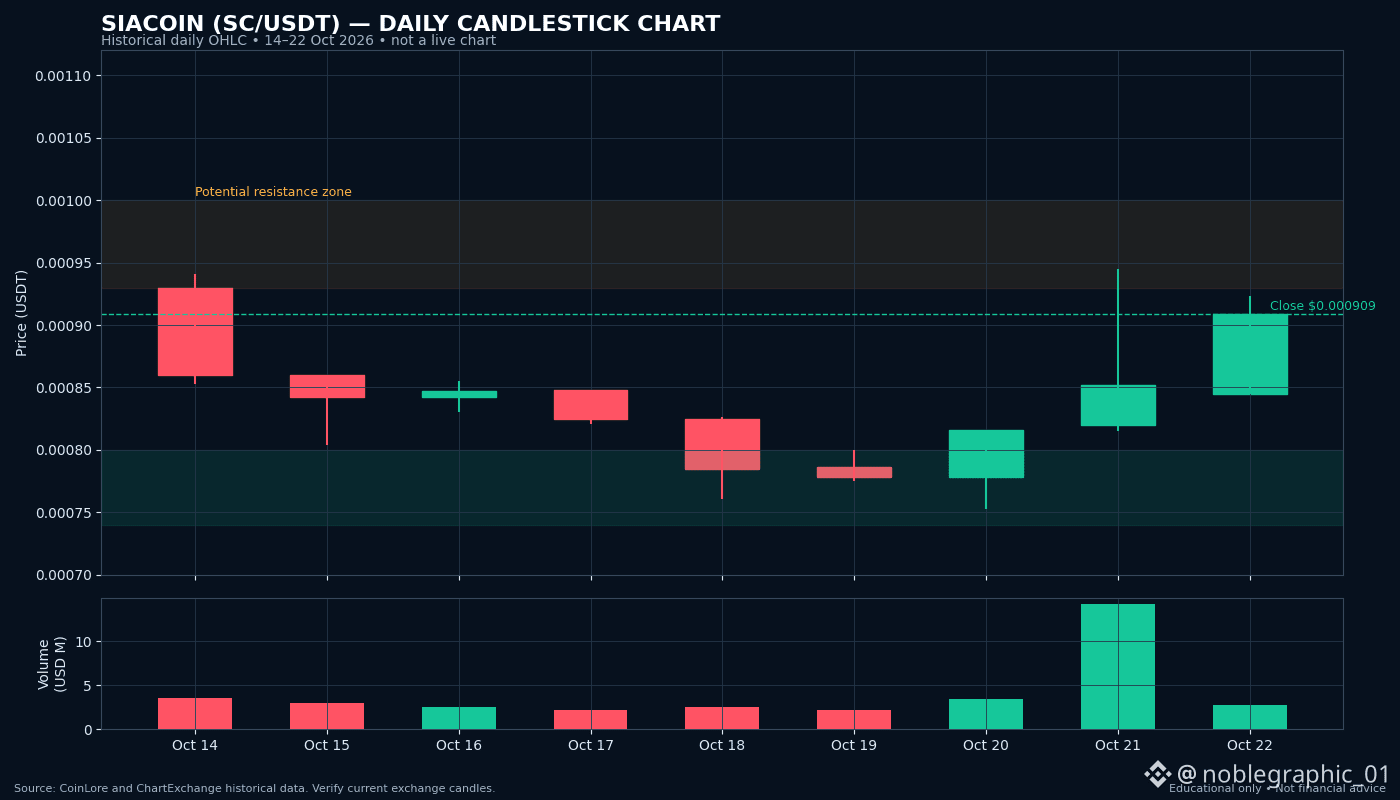
🚀 $SC (SC) PRICE ANALYSIS: BULLISH REVERSAL OR BEARISH TRAP? 📊
💎 Siacoin ($SC ) is a decentralized cloud storage cryptocurrency designed to let users rent out unused storage space through blockchain technology.
📈 SC/USDT Technical Analysis
Recent price action suggests a potential recovery after a period of selling pressure. However, traders should watch for confirmation before assuming a sustained bullish reversal.
🟢 Potential Support Zone: $0.00074–$0.00080
🔴 Potential Resistance Zone: $0.00093–$0.00100
These are preliminary reference levels based on historical price action, not confirmed live trading levels.
🟢 BULLISH SCENARIO If SC breaks above resistance with strong trading volume, it could signal improving momentum and attract additional buying interest.
🔴 BEARISH SCENARIO If the price loses support and selling pressure increases, SC could experience another downward move.
🔍 KEY FACTORS TO WATCH ▪️ SC/USDT candlestick patterns
▪️ Trading volume and liquidity
▪️ Bitcoin's overall market direction
▪️ Adoption of decentralized storage
▪️ Developments in the Sia ecosystem
💡 MY ANALYST'S VIEW
Siacoin has a clear use case in decentralized storage, but long-term token performance depends on real adoption, market demand, and broader crypto market conditions.
A price rebound alone does not confirm a trend reversal. Always verify the latest price action and volume before making trading decisions.
🎯 YOUR TURN!
Can $SC break above resistance and continue its recovery, or will sellers take control again?
📢 Share your bullish or bearish outlook in the comments!
#Siacoin #CryptoAnalysis. #BinanceSquare #TechnicalAnalysis_Tickeron #CryptoMarket
🚀 $SC (SC) PRICE ANALYSIS: BULLISH REVERSAL OR BEARISH TRAP? 📊
💎 Siacoin ($SC ) is a decentralized cloud storage cryptocurrency designed to let users rent out unused storage space through blockchain technology.
📈 SC/USDT Technical Analysis
Recent price action suggests a potential recovery after a period of selling pressure. However, traders should watch for confirmation before assuming a sustained bullish reversal.
🟢 Potential Support Zone: $0.00074–$0.00080
🔴 Potential Resistance Zone: $0.00093–$0.00100
These are preliminary reference levels based on historical price action, not confirmed live trading levels.
🟢 BULLISH SCENARIO If SC breaks above resistance with strong trading volume, it could signal improving momentum and attract additional buying interest.
🔴 BEARISH SCENARIO If the price loses support and selling pressure increases, SC could experience another downward move.
🔍 KEY FACTORS TO WATCH ▪️ SC/USDT candlestick patterns
▪️ Trading volume and liquidity
▪️ Bitcoin's overall market direction
▪️ Adoption of decentralized storage
▪️ Developments in the Sia ecosystem
💡 MY ANALYST'S VIEW
Siacoin has a clear use case in decentralized storage, but long-term token performance depends on real adoption, market demand, and broader crypto market conditions.
A price rebound alone does not confirm a trend reversal. Always verify the latest price action and volume before making trading decisions.
🎯 YOUR TURN!
Can $SC break above resistance and continue its recovery, or will sellers take control again?
📢 Share your bullish or bearish outlook in the comments!
#Siacoin #CryptoAnalysis. #BinanceSquare #TechnicalAnalysis_Tickeron #CryptoMarket
💎 Siacoin ($SC ) is a decentralized cloud storage cryptocurrency designed to let users rent out unused storage space through blockchain technology.
📈 SC/USDT Technical Analysis
Recent price action suggests a potential recovery after a period of selling pressure. However, traders should watch for confirmation before assuming a sustained bullish reversal.
🟢 Potential Support Zone: $0.00074–$0.00080
🔴 Potential Resistance Zone: $0.00093–$0.00100
These are preliminary reference levels based on historical price action, not confirmed live trading levels.
🟢 BULLISH SCENARIO If SC breaks above resistance with strong trading volume, it could signal improving momentum and attract additional buying interest.
🔴 BEARISH SCENARIO If the price loses support and selling pressure increases, SC could experience another downward move.
🔍 KEY FACTORS TO WATCH ▪️ SC/USDT candlestick patterns
▪️ Trading volume and liquidity
▪️ Bitcoin's overall market direction
▪️ Adoption of decentralized storage
▪️ Developments in the Sia ecosystem
💡 MY ANALYST'S VIEW
Siacoin has a clear use case in decentralized storage, but long-term token performance depends on real adoption, market demand, and broader crypto market conditions.
A price rebound alone does not confirm a trend reversal. Always verify the latest price action and volume before making trading decisions.
🎯 YOUR TURN!
Can $SC break above resistance and continue its recovery, or will sellers take control again?
📢 Share your bullish or bearish outlook in the comments!
#Siacoin #CryptoAnalysis. #BinanceSquare #TechnicalAnalysis_Tickeron #CryptoMarket
428

🚨 $ALLO A MAJOR UNLOCK COULD TEST BUYER DEMAND!
Allora’s November 11 unlock is estimated at roughly 164–170M ALLO by tracking platforms, but their figures differ. A large release can increase potential selling pressure, yet unlocked tokens aren’t automatically sold.
📊 Watch these signals:
• Final confirmed unlock amount and recipients
• Selling volume versus available liquidity
• Price reaction as the eve
{spot}(ALLOUSDT)
nt approaches
⚠️ Verify the schedule before acting. Supply events are risks—not guaranteed dumps.
Can demand absorb the new supply?
#ALLO #Allora #CryptoAnalysis. #BinanceSquare
🚨 $ALLO A MAJOR UNLOCK COULD TEST BUYER DEMAND!
Allora’s November 11 unlock is estimated at roughly 164–170M ALLO by tracking platforms, but their figures differ. A large release can increase potential selling pressure, yet unlocked tokens aren’t automatically sold.
📊 Watch these signals:
• Final confirmed unlock amount and recipients
• Selling volume versus available liquidity
• Price reaction as the eve
nt approaches
⚠️ Verify the schedule before acting. Supply events are risks—not guaranteed dumps.
Can demand absorb the new supply?
#ALLO #Allora #CryptoAnalysis. #BinanceSquare
Allora’s November 11 unlock is estimated at roughly 164–170M ALLO by tracking platforms, but their figures differ. A large release can increase potential selling pressure, yet unlocked tokens aren’t automatically sold.
📊 Watch these signals:
• Final confirmed unlock amount and recipients
• Selling volume versus available liquidity
• Price reaction as the eve
nt approaches
⚠️ Verify the schedule before acting. Supply events are risks—not guaranteed dumps.
Can demand absorb the new supply?
#ALLO #Allora #CryptoAnalysis. #BinanceSquare

753


Article
OSMO🤗😊🚀 OSMO COIN: Is a New Hype Wave Coming? 📈🔥
$OSMO is a cryptocurrency worth watching as the market searches for its next big opportunity. But can Osmosis attract fresh buyers and build strong bullish momentum? Let's explore its potential! 👀
🔥 What Could Drive OSMO's Next Move?
Osmosis is a decentralized exchange and liquidity hub within the Cosmos ecosystem. It supports cross-chain trading, liquidity pools, and on-chain governance. Its real utility could help attract users if activity and demand continue to grow.
Another important development is the proposal to end new OSMO token emissions, with an on-chain target date of October 20, 2026. If implemented, this could change its supply dynamics and staking rewards. However, the proposal's outcome and actual market impact remain uncertain.
📊 OSMO Price Prediction: What Could Happen Next?
Based on the $0.0589 price shown in my reference screenshot, these are illustrative scenarios, not confirmed targets based on today's live chart:
- Bullish scenario: $0.065–$0.075 if buying pressure strengthens.
- Strong breakout scenario: $0.080–$0.100 if momentum, volume, and market conditions support a sustained rally.
- Bearish scenario: OSMO could fall further if sellers take control or the broader crypto market weakens.
Before acting on these levels, traders should verify the current price, chart structure, volume, and support and resistance.
🐳 How Many Buyers Could Join?
No one can reliably predict the exact number of future OSMO buyers. Growing trading volume, rising liquidity, increased network activity, and stronger community interest could signal growing demand. A price pump alone does not guarantee lasting adoption.
💎 My Outlook
OSMO has a real ecosystem behind it, but its future hype will depend on execution, token economics, market sentiment, and sustained demand—not speculation alone.
Could OSMO become one of the interesting comeback stories of this market cycle? 👀🔥
Share your thoughts: What price target do you see for OSMO in the next bullish phase?
⚠️ This article is for educational purposes only, not financial advice. Crypto is volatile, and Futures trading carries a high risk of loss.
#OSMO/USDT #OsmosisPriceAction #CryptoAnalysis. #Altcoins #BinanceSquareBTC
OSMO🤗😊
🚀 OSMO COIN: Is a New Hype Wave Coming? 📈🔥
$OSMO is a cryptocurrency worth watching as the market searches for its next big opportunity. But can Osmosis attract fresh buyers and build strong bullish momentum? Let's explore its potential! 👀
🔥 What Could Drive OSMO's Next Move?
Osmosis is a decentralized exchange and liquidity hub within the Cosmos ecosystem. It supports cross-chain trading, liquidity pools, and on-chain governance. Its real utility could help attract users if activity and demand continue to grow.
Another important development is the proposal to end new OSMO token emissions, with an on-chain target date of October 20, 2026. If implemented, this could change its supply dynamics and staking rewards. However, the proposal's outcome and actual market impact remain uncertain.
📊 OSMO Price Prediction: What Could Happen Next?
Based on the $0.0589 price shown in my reference screenshot, these are illustrative scenarios, not confirmed targets based on today's live chart:
- Bullish scenario: $0.065–$0.075 if buying pressure strengthens.
- Strong breakout scenario: $0.080–$0.100 if momentum, volume, and market conditions support a sustained rally.
- Bearish scenario: OSMO could fall further if sellers take control or the broader crypto market weakens.
Before acting on these levels, traders should verify the current price, chart structure, volume, and support and resistance.
🐳 How Many Buyers Could Join?
No one can reliably predict the exact number of future OSMO buyers. Growing trading volume, rising liquidity, increased network activity, and stronger community interest could signal growing demand. A price pump alone does not guarantee lasting adoption.
💎 My Outlook
OSMO has a real ecosystem behind it, but its future hype will depend on execution, token economics, market sentiment, and sustained demand—not speculation alone.
Could OSMO become one of the interesting comeback stories of this market cycle? 👀🔥
Share your thoughts: What price target do you see for OSMO in the next bullish phase?
⚠️ This article is for educational purposes only, not financial advice. Crypto is volatile, and Futures trading carries a high risk of loss.
#OSMO/USDT #OsmosisPriceAction #CryptoAnalysis. #Altcoins #BinanceSquareBTC
$OSMO is a cryptocurrency worth watching as the market searches for its next big opportunity. But can Osmosis attract fresh buyers and build strong bullish momentum? Let's explore its potential! 👀
🔥 What Could Drive OSMO's Next Move?
Osmosis is a decentralized exchange and liquidity hub within the Cosmos ecosystem. It supports cross-chain trading, liquidity pools, and on-chain governance. Its real utility could help attract users if activity and demand continue to grow.
Another important development is the proposal to end new OSMO token emissions, with an on-chain target date of October 20, 2026. If implemented, this could change its supply dynamics and staking rewards. However, the proposal's outcome and actual market impact remain uncertain.
📊 OSMO Price Prediction: What Could Happen Next?
Based on the $0.0589 price shown in my reference screenshot, these are illustrative scenarios, not confirmed targets based on today's live chart:
- Bullish scenario: $0.065–$0.075 if buying pressure strengthens.
- Strong breakout scenario: $0.080–$0.100 if momentum, volume, and market conditions support a sustained rally.
- Bearish scenario: OSMO could fall further if sellers take control or the broader crypto market weakens.
Before acting on these levels, traders should verify the current price, chart structure, volume, and support and resistance.
🐳 How Many Buyers Could Join?
No one can reliably predict the exact number of future OSMO buyers. Growing trading volume, rising liquidity, increased network activity, and stronger community interest could signal growing demand. A price pump alone does not guarantee lasting adoption.
💎 My Outlook
OSMO has a real ecosystem behind it, but its future hype will depend on execution, token economics, market sentiment, and sustained demand—not speculation alone.
Could OSMO become one of the interesting comeback stories of this market cycle? 👀🔥
Share your thoughts: What price target do you see for OSMO in the next bullish phase?
⚠️ This article is for educational purposes only, not financial advice. Crypto is volatile, and Futures trading carries a high risk of loss.
#OSMO/USDT #OsmosisPriceAction #CryptoAnalysis. #Altcoins #BinanceSquareBTC
2
1
191

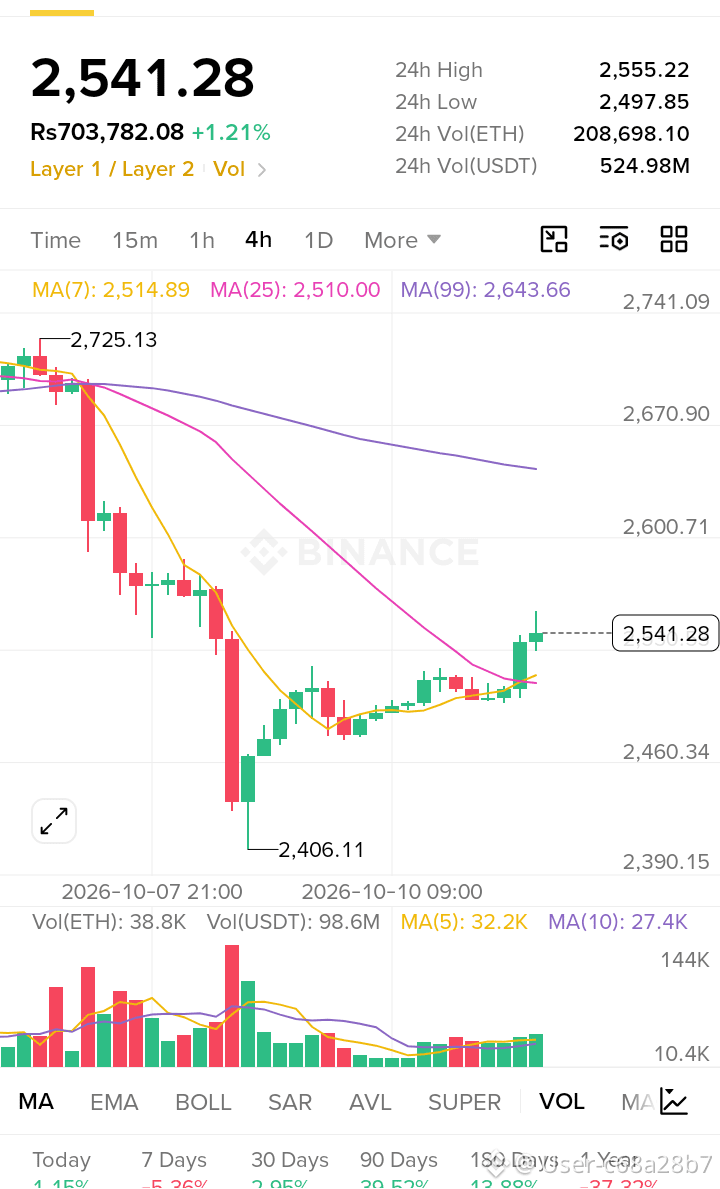
📊 Ethereum ($ETH ): 3 Things Every Trader Should Watch! 🚀
Ethereum is more than just a cryptocurrency — it's a major part of the decentralized finance (DeFi), smart contract, and Web3 ecosystem.
🔍 Here are 3 key things to watch:
1️⃣ Support & Resistance: Watch how ETH reacts around important price levels before entering a trade.
2️⃣ Trading Volume: A breakout with strong volume may be more convincing than a move with weak volume.
3️⃣ Bitcoin's Direction: $ETH often reacts to broader crypto market sentiment, so keep an eye on BTC too.
📈 Bullish Scenario: ETH breaks above resistance with strong volume and holds the breakout level.
📉 Bearish Scenario: ETH loses support and selling pressure increases.
💡 My Strategy: Wait for confirmation, manage risk, and avoid emotional trading. No setup is guaranteed!
👇 Your Turn: Are you bullish or bearish on Ethereum right now? Share your analysis in the comments!
⚠️ This post is for educational purposes only, not financial advice. Always do your own research.
#Ethereum #ETH #CryptoTrading #BinanceSquare #CryptoAnalysis. #EthereumSurpasses2500USDT
📊 Ethereum ($ETH ): 3 Things Every Trader Should Watch! 🚀
Ethereum is more than just a cryptocurrency — it's a major part of the decentralized finance (DeFi), smart contract, and Web3 ecosystem.
🔍 Here are 3 key things to watch:
1️⃣ Support & Resistance: Watch how ETH reacts around important price levels before entering a trade.
2️⃣ Trading Volume: A breakout with strong volume may be more convincing than a move with weak volume.
3️⃣ Bitcoin's Direction: $ETH often reacts to broader crypto market sentiment, so keep an eye on BTC too.
📈 Bullish Scenario: ETH breaks above resistance with strong volume and holds the breakout level.
📉 Bearish Scenario: ETH loses support and selling pressure increases.
💡 My Strategy: Wait for confirmation, manage risk, and avoid emotional trading. No setup is guaranteed!
👇 Your Turn: Are you bullish or bearish on Ethereum right now? Share your analysis in the comments!
⚠️ This post is for educational purposes only, not financial advice. Always do your own research.
#Ethereum #ETH #CryptoTrading #BinanceSquare #CryptoAnalysis. #EthereumSurpasses2500USDT
Ethereum is more than just a cryptocurrency — it's a major part of the decentralized finance (DeFi), smart contract, and Web3 ecosystem.
🔍 Here are 3 key things to watch:
1️⃣ Support & Resistance: Watch how ETH reacts around important price levels before entering a trade.
2️⃣ Trading Volume: A breakout with strong volume may be more convincing than a move with weak volume.
3️⃣ Bitcoin's Direction: $ETH often reacts to broader crypto market sentiment, so keep an eye on BTC too.
📈 Bullish Scenario: ETH breaks above resistance with strong volume and holds the breakout level.
📉 Bearish Scenario: ETH loses support and selling pressure increases.
💡 My Strategy: Wait for confirmation, manage risk, and avoid emotional trading. No setup is guaranteed!
👇 Your Turn: Are you bullish or bearish on Ethereum right now? Share your analysis in the comments!
⚠️ This post is for educational purposes only, not financial advice. Always do your own research.
#Ethereum #ETH #CryptoTrading #BinanceSquare #CryptoAnalysis. #EthereumSurpasses2500USDT
44

·
--
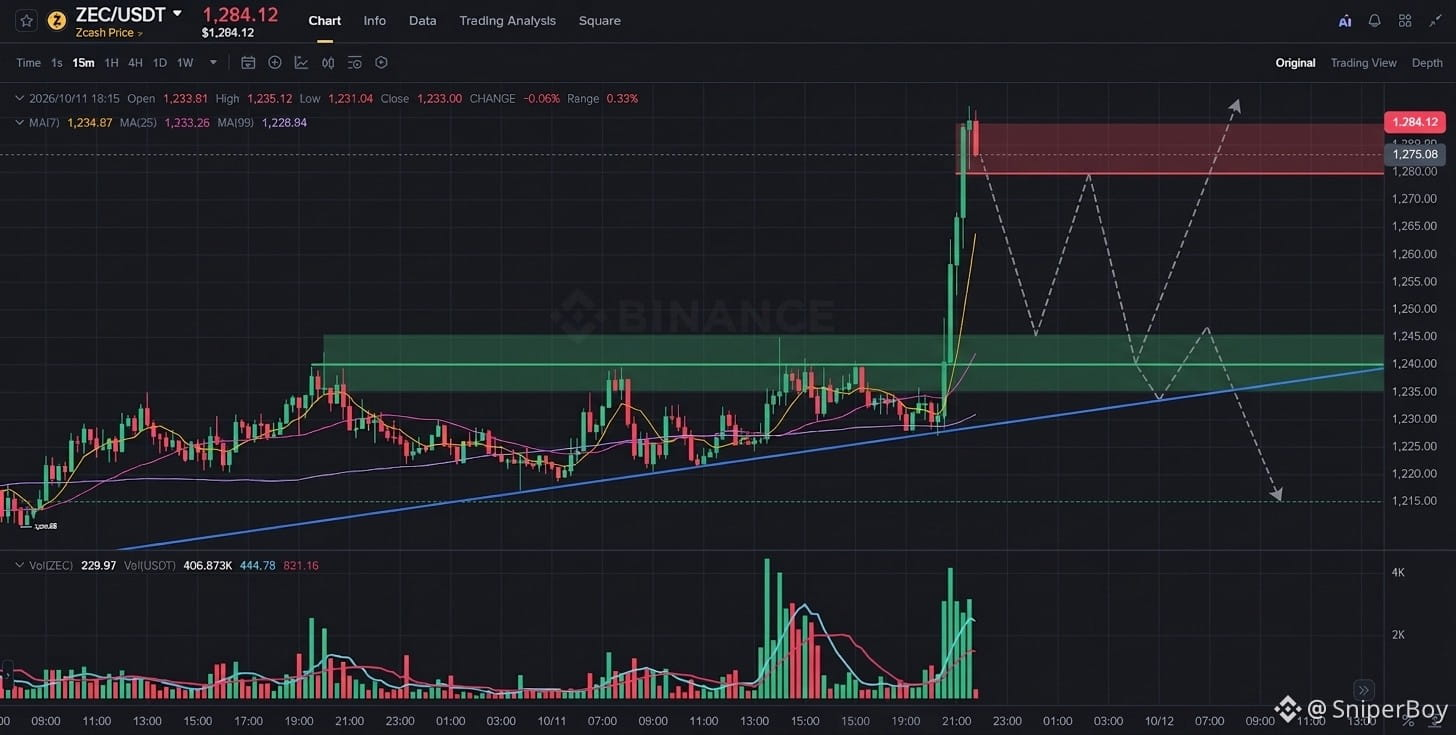
🚨 $ZEC/USDT: +4–5% SURGE! CAN BULLS PUSH HIGHER? 📈
ZEC is trading around $1,284 after breaking above a long consolidation range. Volume confirms strong participation, but early rejection near $1,287 raises one question: continuation or pullback?
🔍 KEY LEVELS TO WATCH
🔴 Resistance: $1,287
🟢 Support 1: $1,275
🟢 Support 2: $1,264
🟢 Support 3: $1,242–$1,246
🟢 Major support: $1,231
📊 THREE POSSIBLE SCENARIOS
🟢 BULLISH: Holding $1,264–$1,275 and breaking $1,287 with strong volume could fuel another leg up.
🟡 NEUTRAL: Consolidation between $1,264 and $1,287 could help price stabilize after the sharp rally.
🔴 BEARISH: Losing $1,264 could trigger a pullback toward $1,245. A confirmed break below $1,242 would weaken the breakout structure.
🎯 MY STRATEGY: The breakout looks strong, but price is stretched above its moving averages. I'd watch for a healthy retest rather than chase the pump.
💬 Your prediction: RETEST first or straight through $1,287? 👇
⚠️ DISCLAIMER: This is technical analysis for educational purposes, not financial advice. Levels are based on the chart data provided and are not independently verified live prices. Always DYOR and manage your risk.
{future}(ZECUSDT)
#ZEC #Zcash #ZEC #Crypto #PrivacyCoin #Blockchain #Binance #Trading #BinanceSquare #CryptoNews #Altcoins #Security #CryptoMarket #CryptoAnalysis. #TechnicalAnalysisGold #BinanceSquare
🚨 $ZEC/USDT: +4–5% SURGE! CAN BULLS PUSH HIGHER? 📈
ZEC is trading around $1,284 after breaking above a long consolidation range. Volume confirms strong participation, but early rejection near $1,287 raises one question: continuation or pullback?
🔍 KEY LEVELS TO WATCH
🔴 Resistance: $1,287
🟢 Support 1: $1,275
🟢 Support 2: $1,264
🟢 Support 3: $1,242–$1,246
🟢 Major support: $1,231
📊 THREE POSSIBLE SCENARIOS
🟢 BULLISH: Holding $1,264–$1,275 and breaking $1,287 with strong volume could fuel another leg up.
🟡 NEUTRAL: Consolidation between $1,264 and $1,287 could help price stabilize after the sharp rally.
🔴 BEARISH: Losing $1,264 could trigger a pullback toward $1,245. A confirmed break below $1,242 would weaken the breakout structure.
🎯 MY STRATEGY: The breakout looks strong, but price is stretched above its moving averages. I'd watch for a healthy retest rather than chase the pump.
💬 Your prediction: RETEST first or straight through $1,287? 👇
⚠️ DISCLAIMER: This is technical analysis for educational purposes, not financial advice. Levels are based on the chart data provided and are not independently verified live prices. Always DYOR and manage your risk.
#ZEC #Zcash #ZEC #Crypto #PrivacyCoin #Blockchain #Binance #Trading #BinanceSquare #CryptoNews #Altcoins #Security #CryptoMarket #CryptoAnalysis. #TechnicalAnalysisGold #BinanceSquare
ZEC is trading around $1,284 after breaking above a long consolidation range. Volume confirms strong participation, but early rejection near $1,287 raises one question: continuation or pullback?
🔍 KEY LEVELS TO WATCH
🔴 Resistance: $1,287
🟢 Support 1: $1,275
🟢 Support 2: $1,264
🟢 Support 3: $1,242–$1,246
🟢 Major support: $1,231
📊 THREE POSSIBLE SCENARIOS
🟢 BULLISH: Holding $1,264–$1,275 and breaking $1,287 with strong volume could fuel another leg up.
🟡 NEUTRAL: Consolidation between $1,264 and $1,287 could help price stabilize after the sharp rally.
🔴 BEARISH: Losing $1,264 could trigger a pullback toward $1,245. A confirmed break below $1,242 would weaken the breakout structure.
🎯 MY STRATEGY: The breakout looks strong, but price is stretched above its moving averages. I'd watch for a healthy retest rather than chase the pump.
💬 Your prediction: RETEST first or straight through $1,287? 👇
⚠️ DISCLAIMER: This is technical analysis for educational purposes, not financial advice. Levels are based on the chart data provided and are not independently verified live prices. Always DYOR and manage your risk.
#ZEC #Zcash #ZEC #Crypto #PrivacyCoin #Blockchain #Binance #Trading #BinanceSquare #CryptoNews #Altcoins #Security #CryptoMarket #CryptoAnalysis. #TechnicalAnalysisGold #BinanceSquare
231
·
--
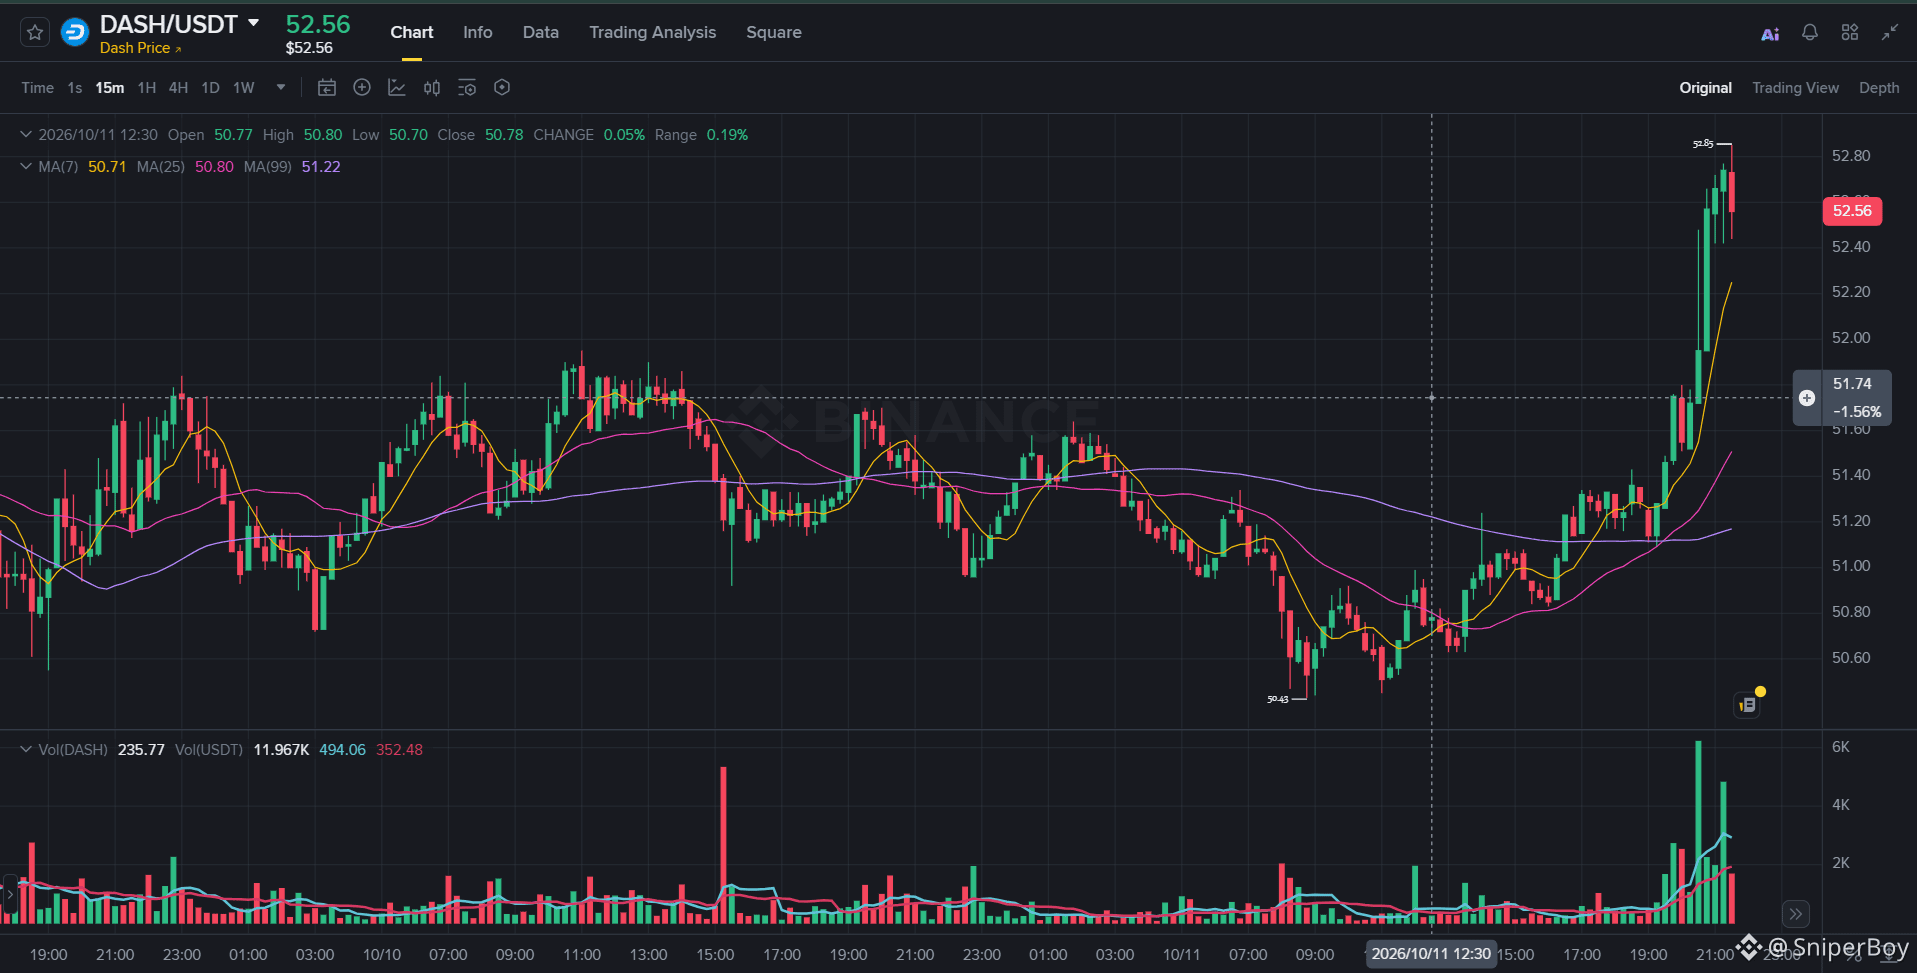
🚨 $DASH/USDT: BREAKOUT CONFIRMED — BUT CAN BULLS HOLD? 📊
$DASH is trading around $52.56, following a strong breakout from a consolidation range. Volume surged during the move, but the latest rejection near $52.85 suggests a potential short-term pullback.
🔍 KEY LEVELS TO WATCH
🔴 Resistance: $52.85
🟢 Support 1: $52.20
🟢 Support 2: $51.75–$51.90
🟢 Support 3: $51.45 / $51.15
📈 THREE POSSIBLE SCENARIOS
🟢 BULLISH: Holding $52.20 and breaking $52.85 with strong volume could open the door to further upside.
🟡 NEUTRAL: Consolidation between $52.20 and $52.85 could allow momentum to cool before the next move.
🔴 BEARISH: A confirmed break below $51.75 could signal a failed breakout, bringing $51.45 and $51.15 into focus.
🎯 MY STRATEGY: I would watch for a retest of $51.80–$52.20 rather than chase the current move. A sustained break below $51.75 would weaken the bullish setup.
💬 Your prediction: Will $DASH break $53, or retest support first? 👇
⚠️ DISCLAIMER: This is technical analysis for educational purposes, not financial advice. These levels may change with market conditions. Verify the live chart, do your own research (DYOR), and manage risk carefully.
{future}(DASHUSDT)
#dashtomoon #DASHUSDT #CryptoAnalysis. #TechnicalAnalysisGold #BinanceSquare
🚨 $DASH /USDT: BREAKOUT CONFIRMED — BUT CAN BULLS HOLD? 📊
$DASH is trading around $52.56, following a strong breakout from a consolidation range. Volume surged during the move, but the latest rejection near $52.85 suggests a potential short-term pullback.
🔍 KEY LEVELS TO WATCH
🔴 Resistance: $52.85
🟢 Support 1: $52.20
🟢 Support 2: $51.75–$51.90
🟢 Support 3: $51.45 / $51.15
📈 THREE POSSIBLE SCENARIOS
🟢 BULLISH: Holding $52.20 and breaking $52.85 with strong volume could open the door to further upside.
🟡 NEUTRAL: Consolidation between $52.20 and $52.85 could allow momentum to cool before the next move.
🔴 BEARISH: A confirmed break below $51.75 could signal a failed breakout, bringing $51.45 and $51.15 into focus.
🎯 MY STRATEGY: I would watch for a retest of $51.80–$52.20 rather than chase the current move. A sustained break below $51.75 would weaken the bullish setup.
💬 Your prediction: Will $DASH break $53, or retest support first? 👇
⚠️ DISCLAIMER: This is technical analysis for educational purposes, not financial advice. These levels may change with market conditions. Verify the live chart, do your own research (DYOR), and manage risk carefully.
#dashtomoon #DASHUSDT #CryptoAnalysis. #TechnicalAnalysisGold #BinanceSquare
$DASH is trading around $52.56, following a strong breakout from a consolidation range. Volume surged during the move, but the latest rejection near $52.85 suggests a potential short-term pullback.
🔍 KEY LEVELS TO WATCH
🔴 Resistance: $52.85
🟢 Support 1: $52.20
🟢 Support 2: $51.75–$51.90
🟢 Support 3: $51.45 / $51.15
📈 THREE POSSIBLE SCENARIOS
🟢 BULLISH: Holding $52.20 and breaking $52.85 with strong volume could open the door to further upside.
🟡 NEUTRAL: Consolidation between $52.20 and $52.85 could allow momentum to cool before the next move.
🔴 BEARISH: A confirmed break below $51.75 could signal a failed breakout, bringing $51.45 and $51.15 into focus.
🎯 MY STRATEGY: I would watch for a retest of $51.80–$52.20 rather than chase the current move. A sustained break below $51.75 would weaken the bullish setup.
💬 Your prediction: Will $DASH break $53, or retest support first? 👇
⚠️ DISCLAIMER: This is technical analysis for educational purposes, not financial advice. These levels may change with market conditions. Verify the live chart, do your own research (DYOR), and manage risk carefully.
#dashtomoon #DASHUSDT #CryptoAnalysis. #TechnicalAnalysisGold #BinanceSquare
2
348

Crypto Breakout Alert! Is the Bull Run Back? 🚀
The crypto market cap just broke out of its long-running accumulation range, officially pushing past $2.80 trillion! With Bitcoin steadily holding ground near the $84,000 mark and Ethereum showing strong structural momentum, it looks like the sideways market is finally behind us.
Are we heading for a major expansion phase in Q4? What are your top coins to watch as the market turns bullish?
Drop your predictions below and let’s discuss the next big moves! 👇📈
#CryptoBreakout #bitcoin #Ethereum #Bullrun #CryptoAnalysis.
Crypto Breakout Alert! Is the Bull Run Back? 🚀
The crypto market cap just broke out of its long-running accumulation range, officially pushing past $2.80 trillion! With Bitcoin steadily holding ground near the $84,000 mark and Ethereum showing strong structural momentum, it looks like the sideways market is finally behind us.
Are we heading for a major expansion phase in Q4? What are your top coins to watch as the market turns bullish?
Drop your predictions below and let’s discuss the next big moves! 👇📈
#CryptoBreakout #bitcoin #Ethereum #Bullrun #CryptoAnalysis.
The crypto market cap just broke out of its long-running accumulation range, officially pushing past $2.80 trillion! With Bitcoin steadily holding ground near the $84,000 mark and Ethereum showing strong structural momentum, it looks like the sideways market is finally behind us.
Are we heading for a major expansion phase in Q4? What are your top coins to watch as the market turns bullish?
Drop your predictions below and let’s discuss the next big moves! 👇📈
#CryptoBreakout #bitcoin #Ethereum #Bullrun #CryptoAnalysis.
68

·
--
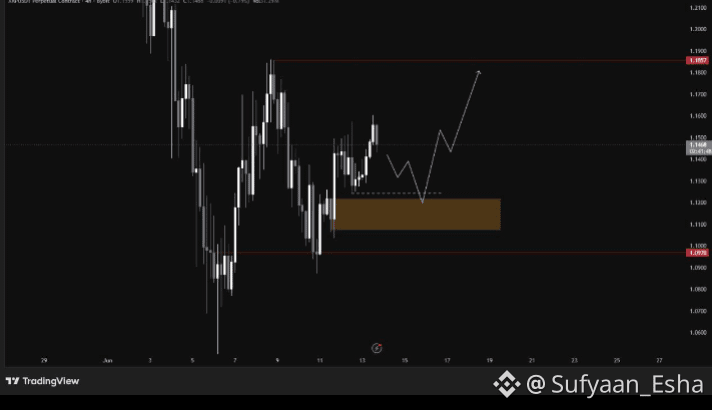
📊 $XRP Evening Update
XRP currently down -1.34%, trading at $1.1364 🔴
This follows our earlier H4 $BOS rejection on the daily — price reacting exactly as expected near our POI. 👀
Watching closely for the next reaction zone — patience pays! 💎
What's your take on $XRP right now? Drop it below! 👇
🔔 Follow @Square-Creator-fd7643080
for daily XRP updates!
#XRP’ #Crypto #BinanceSquareTalks
#CryptoAnalysis.
{future}(XRPUSDT)
📊 $XRP Evening Update
XRP currently down -1.34%, trading at $1.1364 🔴
This follows our earlier H4 $BOS rejection on the daily — price reacting exactly as expected near our POI. 👀
Watching closely for the next reaction zone — patience pays! 💎
What's your take on $XRP right now? Drop it below! 👇
🔔 Follow @Sufyaan_Esha
for daily XRP updates!
#XRP’ #Crypto #BinanceSquareTalks
#CryptoAnalysis.
XRP currently down -1.34%, trading at $1.1364 🔴
This follows our earlier H4 $BOS rejection on the daily — price reacting exactly as expected near our POI. 👀
Watching closely for the next reaction zone — patience pays! 💎
What's your take on $XRP right now? Drop it below! 👇
🔔 Follow @Sufyaan_Esha
for daily XRP updates!
#XRP’ #Crypto #BinanceSquareTalks
#CryptoAnalysis.
96

📊 $ETH TREND UPDATE
$ETH is currently trading around [price].
The important levels for me are:
🟢 Support: [level]
🔴 Resistance: [level]
🎯 Next target: [level]
As long as price holds above [support], the structure remains [bullish/bearish/neutral] in my view.
I've added the $ETH chart so you can see the setup clearly.
What's your view on ETH here? 👇#ETHETFsApproved #EthereumNews #ETHUSD #Crypto #CryptoTrading #Altcoins #BinanceSquare #Trading #CryptoAnalysis. #ETHUSDT永续合约
📊 $ETH TREND UPDATE
$ETH is currently trading around [price].
The important levels for me are:
🟢 Support: [level]
🔴 Resistance: [level]
🎯 Next target: [level]
As long as price holds above [support], the structure remains [bullish/bearish/neutral] in my view.
I've added the $ETH chart so you can see the setup clearly.
What's your view on ETH here? 👇#ETHETFsApproved #EthereumNews #ETHUSD #Crypto #CryptoTrading #Altcoins #BinanceSquare #Trading #CryptoAnalysis. #ETHUSDT永续合约
$ETH is currently trading around [price].
The important levels for me are:
🟢 Support: [level]
🔴 Resistance: [level]
🎯 Next target: [level]
As long as price holds above [support], the structure remains [bullish/bearish/neutral] in my view.
I've added the $ETH chart so you can see the setup clearly.
What's your view on ETH here? 👇#ETHETFsApproved #EthereumNews #ETHUSD #Crypto #CryptoTrading #Altcoins #BinanceSquare #Trading #CryptoAnalysis. #ETHUSDT永续合约
91

·
--
$ZEC
Peace be upon you, guys. What do you think about entering the currency #zec
with the condition that we request it from regions 1017
and see what is happening and going on
#CryptocurrencyPotential #CryptoAnalysis.
#zec
{future}(ZECUSDT)
$ZEC
Peace be upon you, guys. What do you think about entering the currency #zec
with the condition that we request it from regions 1017
and see what is happening and going on
#CryptocurrencyPotential #CryptoAnalysis.
#zec
Peace be upon you, guys. What do you think about entering the currency #zec
with the condition that we request it from regions 1017
and see what is happening and going on
#CryptocurrencyPotential #CryptoAnalysis.
#zec

216
Log in to explore more content
Join global crypto users on Binance Square
⚡️ Get latest and useful information about crypto.
💬 Trusted by the world’s largest crypto exchange.
👍 Discover real insights from verified creators.
Email / Phone number
Trending Topics
1
#BitcoinFiveWeeklyLosses
5,762 views
251 Discussing
2
#AIChipSlumpNasdaq
3,611 views
132 Discussing
3
#NvidiaInvestigatesAfterHuang’sAffairApology
1,801 views
49 Discussing
4
#BinanceReopensWithdrawalsForHYPE&APT
155,187 views
1,209 Discussing
5
#SouthKoreaDraftLawTargets15To20%ShareholderCap
156,397 views
810 Discussing
6
#TradFiForBeginners
228,204 views
2,056 Discussing
7
#KeplrAdvisesSocialLoginUsersToTransferAssets
72,869 views
603 Discussing
8
#TetherPlans€28.8MForJuventusCapitalIncrease
54,717 views
449 Discussing
9
#JobsReportRaisesHikeOdds
976,199 views
4,559 Discussing
10
#CPITestsDecemberRateOutlook
438,763 views
1,984 Discussing