
#criptomonedaslatam
criptomonedaslatam
2,543 views
16 Discussing
Hot
Latest

·
--
Bullish
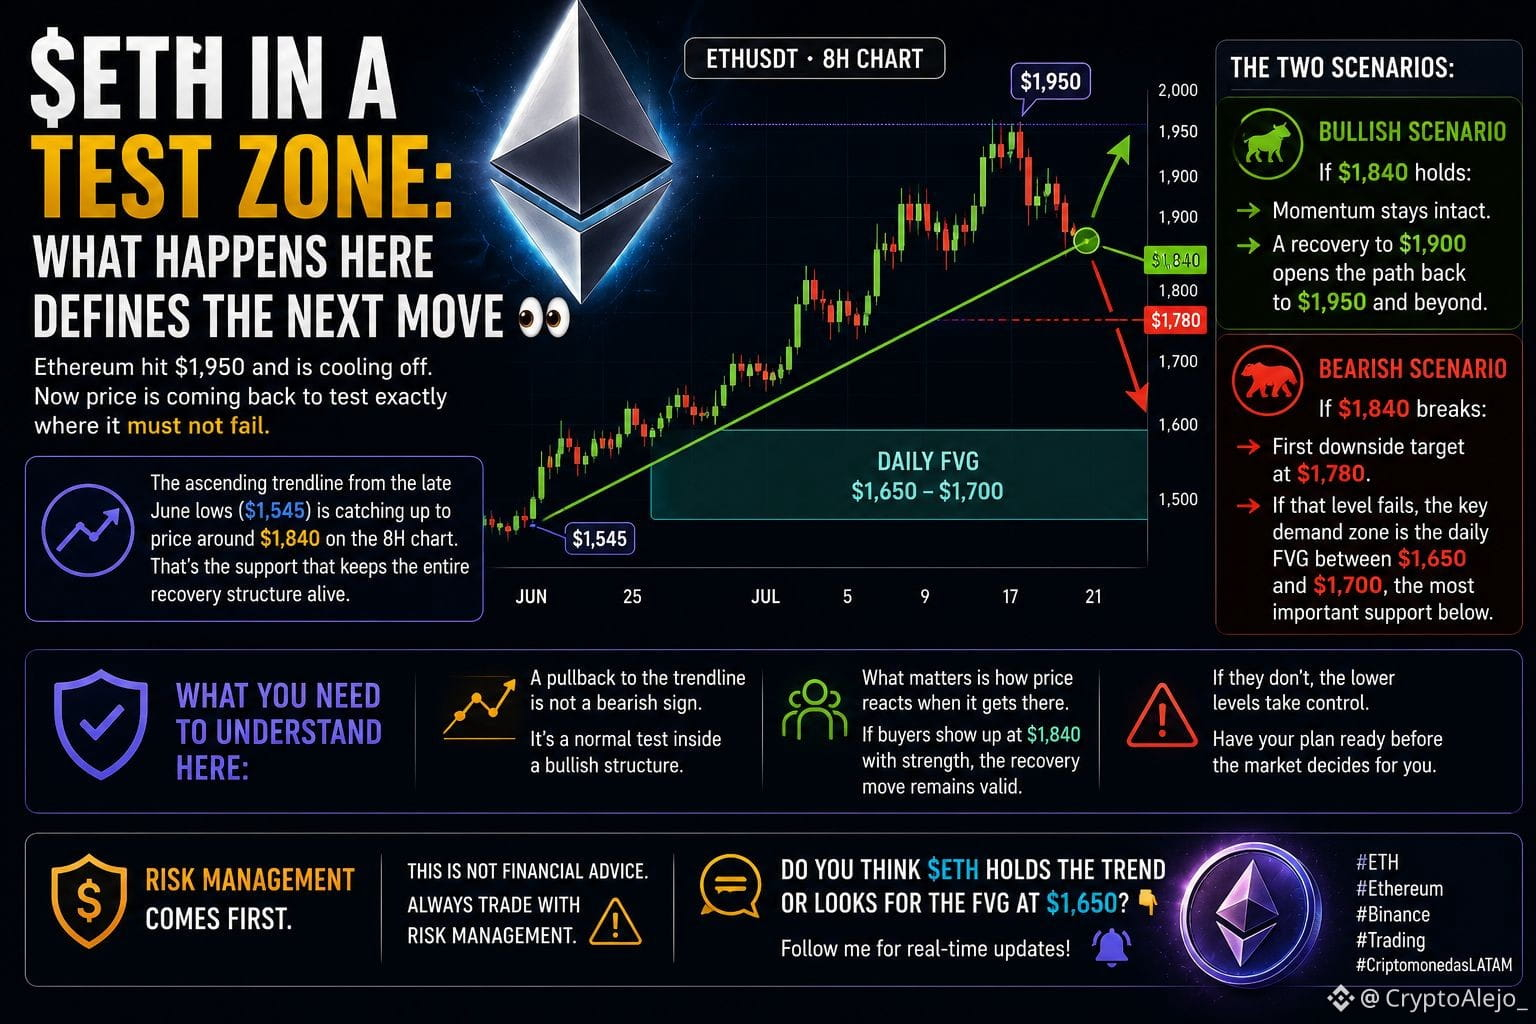
$ETH in a test zone: what happens here defines the next move
Do you think $ETH sustains the trend or looks for the FVG at $1,650? 👇 Follow me for real-time updates. 🔔
Ethereum hit $1,950 and is cooling off. Now price is returning to test exactly where it shouldn’t break.
The uptrend line coming from the late-June lows ($1,545) is catching up to the price around $1,840 on the 8-hour chart. That’s the support keeping the entire recovery structure alive.
The two scenarios:
🟢 If it holds $1,840: momentum remains intact. A rebound toward $1,900 clears the path back to $1,950 and beyond.
🔴 If it breaks $1,840: first bearish target at $1,780. If that level doesn’t hold, the key demand zone is the daily FVG between $1,650 and $1,700—the most important support that $ETH has below.
What you need to understand here:
A pullback to the trend line isn’t a bearish signal. It’s a normal test within a bullish structure. What matters is how price reacts when it gets there.
If the buyer shows up strongly at $1,840, the recovery move remains valid. If not, the lower levels are the ones that take control.
Set your plan before the market defines it for you.
This is not financial advice. Always trade with risk management.
#ETH #trading #CriptomonedasLATAM
$ETH in a test zone: what happens here defines the next move
Do you think $ETH sustains the trend or looks for the FVG at $1,650? 👇 Follow me for real-time updates. 🔔
Ethereum hit $1,950 and is cooling off. Now price is returning to test exactly where it shouldn’t break.
The uptrend line coming from the late-June lows ($1,545) is catching up to the price around $1,840 on the 8-hour chart. That’s the support keeping the entire recovery structure alive.
The two scenarios:
🟢 If it holds $1,840: momentum remains intact. A rebound toward $1,900 clears the path back to $1,950 and beyond.
🔴 If it breaks $1,840: first bearish target at $1,780. If that level doesn’t hold, the key demand zone is the daily FVG between $1,650 and $1,700—the most important support that $ETH has below.
What you need to understand here:
A pullback to the trend line isn’t a bearish signal. It’s a normal test within a bullish structure. What matters is how price reacts when it gets there.
If the buyer shows up strongly at $1,840, the recovery move remains valid. If not, the lower levels are the ones that take control.
Set your plan before the market defines it for you.
This is not financial advice. Always trade with risk management.
#ETH #trading #CriptomonedasLATAM
Do you think $ETH sustains the trend or looks for the FVG at $1,650? 👇 Follow me for real-time updates. 🔔
Ethereum hit $1,950 and is cooling off. Now price is returning to test exactly where it shouldn’t break.
The uptrend line coming from the late-June lows ($1,545) is catching up to the price around $1,840 on the 8-hour chart. That’s the support keeping the entire recovery structure alive.
The two scenarios:
🟢 If it holds $1,840: momentum remains intact. A rebound toward $1,900 clears the path back to $1,950 and beyond.
🔴 If it breaks $1,840: first bearish target at $1,780. If that level doesn’t hold, the key demand zone is the daily FVG between $1,650 and $1,700—the most important support that $ETH has below.
What you need to understand here:
A pullback to the trend line isn’t a bearish signal. It’s a normal test within a bullish structure. What matters is how price reacts when it gets there.
If the buyer shows up strongly at $1,840, the recovery move remains valid. If not, the lower levels are the ones that take control.
Set your plan before the market defines it for you.
This is not financial advice. Always trade with risk management.
#ETH #trading #CriptomonedasLATAM
1
190
·
--
Is Bitcoin about to repeat its most dreaded pattern?
There’s a warning making the rounds among analysts that’s worth reviewing before you make your next decision with $BTC.
A pattern that has never failed
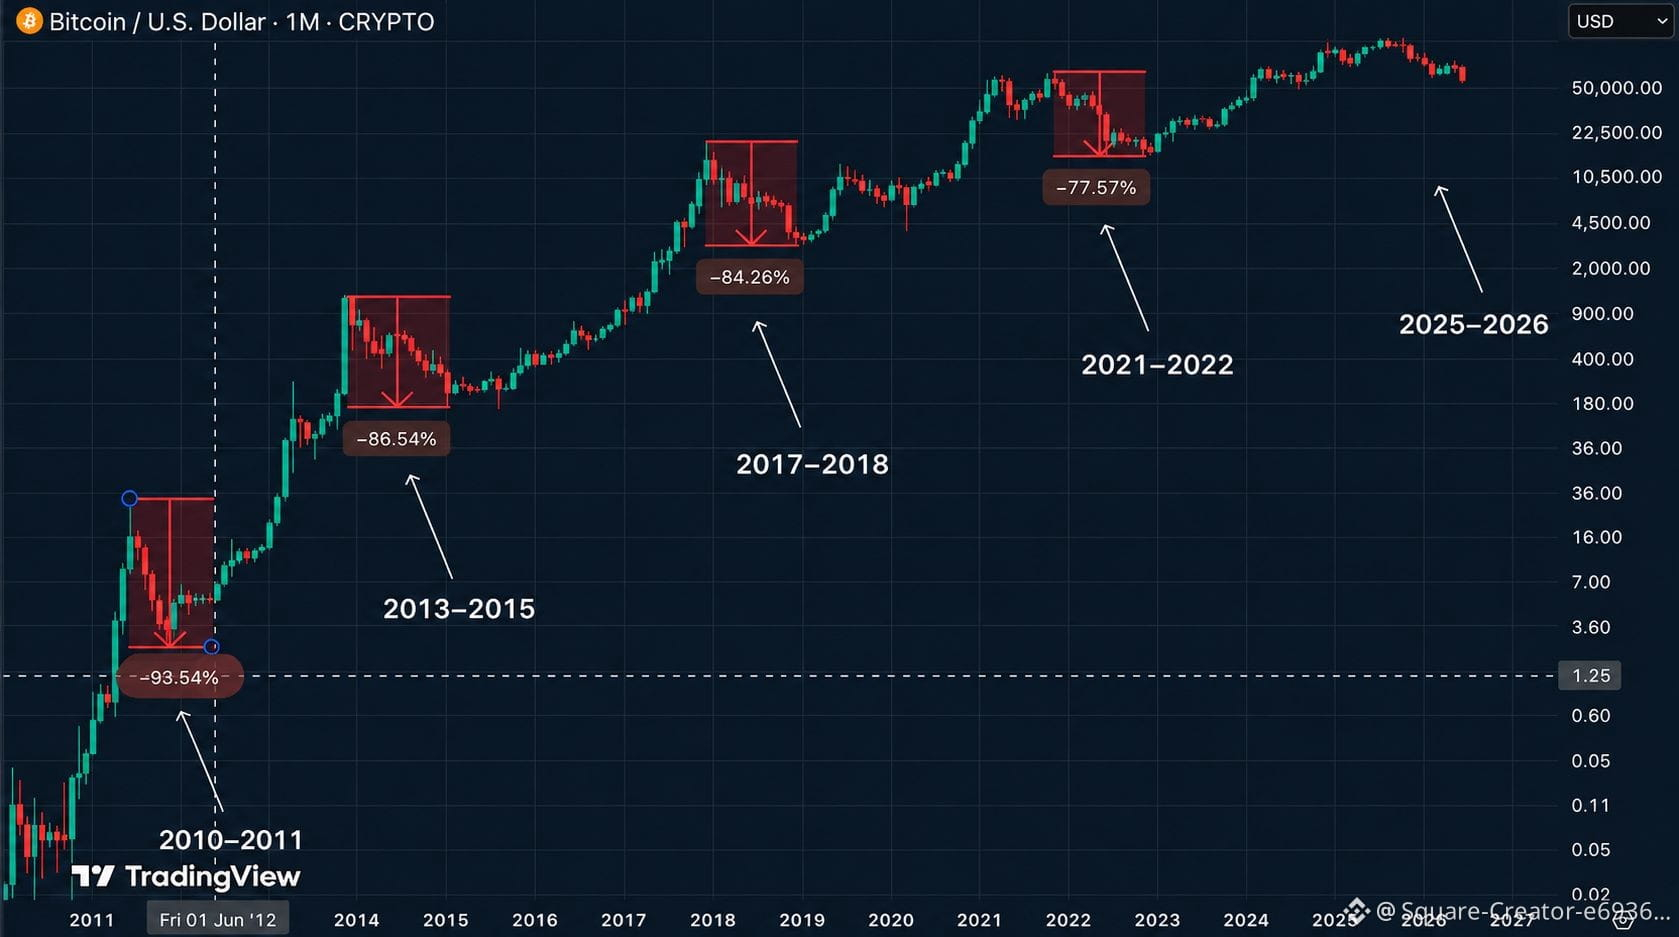
Every Bitcoin bull market has ended the same way: a sharp drop that wipes out most of the gains from the previous cycle.
2010-2011: -93%
2013-2015: -86%
2017-2018: -84%
2021-2022: -77%
2025-2026: still developing
As you can see, the drop percentage has been shrinking from cycle to cycle. But the pattern itself (a brutal correction between 75% and 90%) has repeated without exception.
Where are we now?
Today, the accumulated decline is close to 53%. Most of the market already thinks the worst is behind us. However, if we compare with the historical floors of each cycle, there’s still room for the price to keep falling before bottoming out.
What this means for you
This isn’t a guaranteed prediction—it’s a historical pattern that some analysts are closely watching. If you trade $BTC in this context:
- Watch whether the price respects or breaks medium-term support levels.
- Don’t rule out that volatility continues; this kind of cycle usually brings sudden moves in both directions.
- Set your stop loss before entering, without exception.
History doesn’t repeat itself exactly the same every time, but knowing the pattern gives you an edge to make more informed decisions. It’s up to you whether this cycle follows the same script or breaks the trend.
Do you think this time is different? Follow me for more analysis like this.
#Bitcoin #BTC #criptomonedaslatam $BTC
Is Bitcoin about to repeat its most dreaded pattern?
There’s a warning making the rounds among analysts that’s worth reviewing before you make your next decision with $BTC .
A pattern that has never failed
Every Bitcoin bull market has ended the same way: a sharp drop that wipes out most of the gains from the previous cycle.
2010-2011: -93%
2013-2015: -86%
2017-2018: -84%
2021-2022: -77%
2025-2026: still developing
As you can see, the drop percentage has been shrinking from cycle to cycle. But the pattern itself (a brutal correction between 75% and 90%) has repeated without exception.
Where are we now?
Today, the accumulated decline is close to 53%. Most of the market already thinks the worst is behind us. However, if we compare with the historical floors of each cycle, there’s still room for the price to keep falling before bottoming out.
What this means for you
This isn’t a guaranteed prediction—it’s a historical pattern that some analysts are closely watching. If you trade $BTC in this context:
- Watch whether the price respects or breaks medium-term support levels.
- Don’t rule out that volatility continues; this kind of cycle usually brings sudden moves in both directions.
- Set your stop loss before entering, without exception.
History doesn’t repeat itself exactly the same every time, but knowing the pattern gives you an edge to make more informed decisions. It’s up to you whether this cycle follows the same script or breaks the trend.
Do you think this time is different? Follow me for more analysis like this.
#Bitcoin #BTC #criptomonedaslatam $BTC
There’s a warning making the rounds among analysts that’s worth reviewing before you make your next decision with $BTC .
A pattern that has never failed
Every Bitcoin bull market has ended the same way: a sharp drop that wipes out most of the gains from the previous cycle.
2010-2011: -93%
2013-2015: -86%
2017-2018: -84%
2021-2022: -77%
2025-2026: still developing
As you can see, the drop percentage has been shrinking from cycle to cycle. But the pattern itself (a brutal correction between 75% and 90%) has repeated without exception.
Where are we now?
Today, the accumulated decline is close to 53%. Most of the market already thinks the worst is behind us. However, if we compare with the historical floors of each cycle, there’s still room for the price to keep falling before bottoming out.
What this means for you
This isn’t a guaranteed prediction—it’s a historical pattern that some analysts are closely watching. If you trade $BTC in this context:
- Watch whether the price respects or breaks medium-term support levels.
- Don’t rule out that volatility continues; this kind of cycle usually brings sudden moves in both directions.
- Set your stop loss before entering, without exception.
History doesn’t repeat itself exactly the same every time, but knowing the pattern gives you an edge to make more informed decisions. It’s up to you whether this cycle follows the same script or breaks the trend.
Do you think this time is different? Follow me for more analysis like this.
#Bitcoin #BTC #criptomonedaslatam $BTC
147
·
--
Article
Has XRP already risen, or is there still room to grow?Many people think that since $XRP has already had a good move, the opportunity is already gone. But if you look at the long-term chart, the story could be told differently.
What the price says
Today, XRP is trading far below its all-time high of USD 3.84. That means that if at some point the price tests that level again, from current prices there would be significant potential for revaluation.
What changed in the fundamentals
- Ripple has strengthened its position in the international payments market.
Has XRP already risen, or is there still room to grow?
Many people think that since $XRP has already had a good move, the opportunity is already gone. But if you look at the long-term chart, the story could be told differently.
What the price says
Today, XRP is trading far below its all-time high of USD 3.84. That means that if at some point the price tests that level again, from current prices there would be significant potential for revaluation.
What changed in the fundamentals
- Ripple has strengthened its position in the international payments market.
What the price says
Today, XRP is trading far below its all-time high of USD 3.84. That means that if at some point the price tests that level again, from current prices there would be significant potential for revaluation.
What changed in the fundamentals
- Ripple has strengthened its position in the international payments market.
180
·
--
Bullish
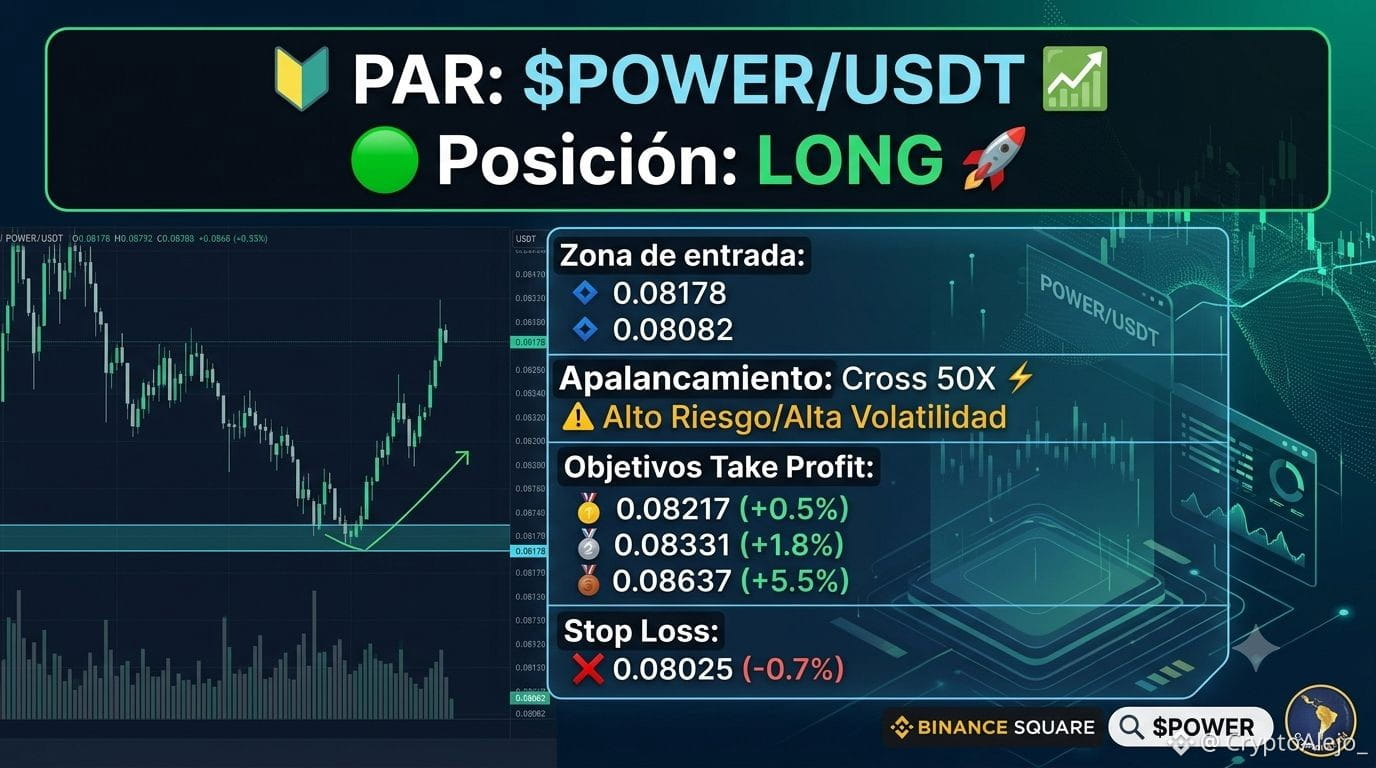
🔰 PAR: $POWER /USDT 💹
🟢 Position: LONG 🚀
$POWER is showing a reaction in a short-term support zone. Here’s how a trade would look structured in this scenario:
☑️ Entry Zone:
💠 0.08178
💠 0.08082
🌐 Leverage: Cross 50X ⚡
⚠️ High leverage, high risk. A small move against you can liquidate the position. Adjust the size according to your capital management.
🎯 Take Profit Targets:
🥇 0.08217 (+0.5%)
🥈 0.08331 (+1.8%)
🥉 0.08637 (+5.5%)
❌ Stop Loss: 0.08025 (-0.7%)
📊 Risk/Reward Ratio: up to the third target the ratio is favorable, but with 50X the margin of error is minimal.
This is an illustrative example of trade structure, not financial advice. Always trade with the capital you are willing to risk.
#POWER #Binance #trading #CriptomonedasLATAM
Are you watching $POWER at these levels? Follow me for more signals like this. 🔔
🔰 PAR: $POWER /USDT 💹
🟢 Position: LONG 🚀
$POWER is showing a reaction in a short-term support zone. Here’s how a trade would look structured in this scenario:
☑️ Entry Zone:
💠 0.08178
💠 0.08082
🌐 Leverage: Cross 50X ⚡
⚠️ High leverage, high risk. A small move against you can liquidate the position. Adjust the size according to your capital management.
🎯 Take Profit Targets:
🥇 0.08217 (+0.5%)
🥈 0.08331 (+1.8%)
🥉 0.08637 (+5.5%)
❌ Stop Loss: 0.08025 (-0.7%)
📊 Risk/Reward Ratio: up to the third target the ratio is favorable, but with 50X the margin of error is minimal.
This is an illustrative example of trade structure, not financial advice. Always trade with the capital you are willing to risk.
#POWER #Binance #trading #CriptomonedasLATAM
Are you watching $POWER at these levels? Follow me for more signals like this. 🔔
🟢 Position: LONG 🚀
$POWER is showing a reaction in a short-term support zone. Here’s how a trade would look structured in this scenario:
☑️ Entry Zone:
💠 0.08178
💠 0.08082
🌐 Leverage: Cross 50X ⚡
⚠️ High leverage, high risk. A small move against you can liquidate the position. Adjust the size according to your capital management.
🎯 Take Profit Targets:
🥇 0.08217 (+0.5%)
🥈 0.08331 (+1.8%)
🥉 0.08637 (+5.5%)
❌ Stop Loss: 0.08025 (-0.7%)
📊 Risk/Reward Ratio: up to the third target the ratio is favorable, but with 50X the margin of error is minimal.
This is an illustrative example of trade structure, not financial advice. Always trade with the capital you are willing to risk.
#POWER #Binance #trading #CriptomonedasLATAM
Are you watching $POWER at these levels? Follow me for more signals like this. 🔔
153
·
--

Article
Bitcoin, "the riskiest asset"? The numbers tell a different story 🤔For years, the dominant narrative has been the same: "Bitcoin is too volatile, too risky, too unpredictable." It’s a story repeated so often that it’s rarely put to the test with real data. Let’s do it.
The question nobody asks
If Bitcoin is so risky, how does its current drop compare to that of established companies, with decades of track record, giant teams, and "institutional stability"? The answer is uncomfortable for those who repeat the narrative without revisiting it.
Bitcoin, "the riskiest asset"? The numbers tell a different story 🤔
For years, the dominant narrative has been the same: "Bitcoin is too volatile, too risky, too unpredictable." It’s a story repeated so often that it’s rarely put to the test with real data. Let’s do it.
The question nobody asks
If Bitcoin is so risky, how does its current drop compare to that of established companies, with decades of track record, giant teams, and "institutional stability"? The answer is uncomfortable for those who repeat the narrative without revisiting it.
The question nobody asks
If Bitcoin is so risky, how does its current drop compare to that of established companies, with decades of track record, giant teams, and "institutional stability"? The answer is uncomfortable for those who repeat the narrative without revisiting it.
117
·
--
Bullish
$ATOM in breakdown territory: what happens here will define the next chapter 🔺
There are assets that reach moments where there is no middle ground. $ATOM is in one of those moments right now.
The context:
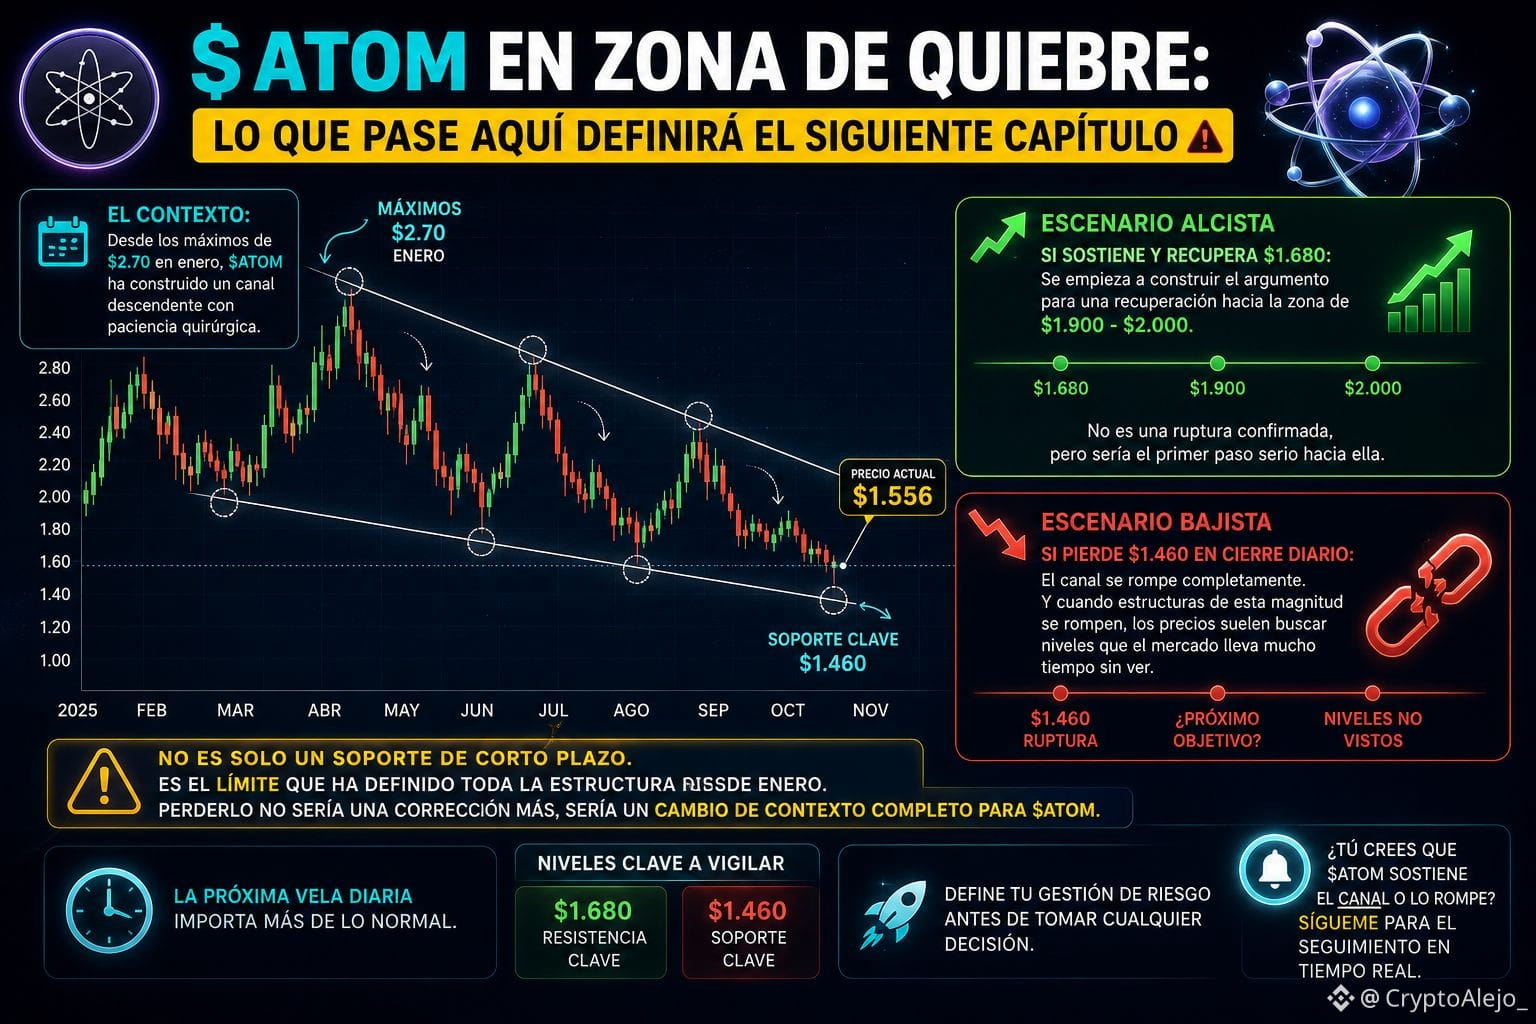
From the $2.70 highs in January, $ATOM has been building a descending channel with surgical patience. Each bounce, each drop—everything within the same structure. And now, trading around $1.556, the price is pressing directly against the lower support of that channel near $1.460, the level that has contained every major decline throughout this entire formation.
This is real decision territory.
The two scenarios:
🟢 If it holds and recovers $1.680: the case begins to build for a recovery toward the $1.900–$2.000 zone. It’s not a confirmed bullish breakout, but it would be the first serious step toward it.
🔴 If it loses $1.460 on a daily close: the channel breaks completely. And when structures of this magnitude break, prices usually seek levels the market hasn’t seen in a long time.
What makes this moment different:
This isn’t just a short-term support. It’s the limit that has defined the entire structure since January. Losing it wouldn’t be just another correction—it would be a complete context change for $ATOM.
The next daily candle matters more than usual.
This is not financial advice. Set your risk management before making any decision.
Do you think ATOM holds the channel or breaks it? Follow me for real-time updates. 🔔
#ATOM #Cosmos #Binance #trading #CriptomonedasLATAM
$ATOM in breakdown territory: what happens here will define the next chapter 🔺
There are assets that reach moments where there is no middle ground. $ATOM is in one of those moments right now.
The context:
From the $2.70 highs in January, $ATOM has been building a descending channel with surgical patience. Each bounce, each drop—everything within the same structure. And now, trading around $1.556, the price is pressing directly against the lower support of that channel near $1.460, the level that has contained every major decline throughout this entire formation.
This is real decision territory.
The two scenarios:
🟢 If it holds and recovers $1.680: the case begins to build for a recovery toward the $1.900–$2.000 zone. It’s not a confirmed bullish breakout, but it would be the first serious step toward it.
🔴 If it loses $1.460 on a daily close: the channel breaks completely. And when structures of this magnitude break, prices usually seek levels the market hasn’t seen in a long time.
What makes this moment different:
This isn’t just a short-term support. It’s the limit that has defined the entire structure since January. Losing it wouldn’t be just another correction—it would be a complete context change for $ATOM .
The next daily candle matters more than usual.
This is not financial advice. Set your risk management before making any decision.
Do you think ATOM holds the channel or breaks it? Follow me for real-time updates. 🔔
#ATOM #Cosmos #Binance #trading #CriptomonedasLATAM
There are assets that reach moments where there is no middle ground. $ATOM is in one of those moments right now.
The context:
From the $2.70 highs in January, $ATOM has been building a descending channel with surgical patience. Each bounce, each drop—everything within the same structure. And now, trading around $1.556, the price is pressing directly against the lower support of that channel near $1.460, the level that has contained every major decline throughout this entire formation.
This is real decision territory.
The two scenarios:
🟢 If it holds and recovers $1.680: the case begins to build for a recovery toward the $1.900–$2.000 zone. It’s not a confirmed bullish breakout, but it would be the first serious step toward it.
🔴 If it loses $1.460 on a daily close: the channel breaks completely. And when structures of this magnitude break, prices usually seek levels the market hasn’t seen in a long time.
What makes this moment different:
This isn’t just a short-term support. It’s the limit that has defined the entire structure since January. Losing it wouldn’t be just another correction—it would be a complete context change for $ATOM .
The next daily candle matters more than usual.
This is not financial advice. Set your risk management before making any decision.
Do you think ATOM holds the channel or breaks it? Follow me for real-time updates. 🔔
#ATOM #Cosmos #Binance #trading #CriptomonedasLATAM
142
·
--
🔰 $XRP /USDT💹
⚠️ Almost a year of compression. The decision is now.
$XRP is trading at $1.0205, exactly at the tip of a massive descending triangle that has been forming since last September.
When price reaches the tip of a structure like this, the move that follows is usually explosive. The question isn’t whether it will move. It’s which direction.
The two scenarios:
🟢 If it breaks above $1.1300:
The path to $1.3000 and $1.4200 opens up quickly. A descending triangle breakout with volume can be violently bullish.
🔴 If it loses $0.9900:
New lows open up that the market hasn’t seen in a long time. There’s no clear structural support below that level.
The structured trade:
☑️ LONG Entry: confirmed breakout above $1.1300 with a candle close and volume.
🎯 TP1: $1.3000
🎯 TP2: $1.4200
❌ Stop Loss: $1.0500
☑️ SHORT Entry: confirmed loss of $0.9900 with a daily close.
🎯 TP1: $0.8500
❌ Stop Loss: $1.0600
Don’t anticipate. Wait for confirmation.
A year of compression generates accumulated energy in both directions. Entering before the breakout is a bet, not a trade.
This is not financial advice. Always have a stop loss before entering.
#xrp #Ripple #BİNANCE #trading #CriptomonedasLATAM
{spot}(XRPUSDT)
Do you see a bullish breakout or do you think $XRP will break to the downside? 👇 Follow me for the alert when it confirms. 🔔
🔰 $XRP /USDT💹
⚠️ Almost a year of compression. The decision is now.
$XRP is trading at $1.0205, exactly at the tip of a massive descending triangle that has been forming since last September.
When price reaches the tip of a structure like this, the move that follows is usually explosive. The question isn’t whether it will move. It’s which direction.
The two scenarios:
🟢 If it breaks above $1.1300:
The path to $1.3000 and $1.4200 opens up quickly. A descending triangle breakout with volume can be violently bullish.
🔴 If it loses $0.9900:
New lows open up that the market hasn’t seen in a long time. There’s no clear structural support below that level.
The structured trade:
☑️ LONG Entry: confirmed breakout above $1.1300 with a candle close and volume.
🎯 TP1: $1.3000
🎯 TP2: $1.4200
❌ Stop Loss: $1.0500
☑️ SHORT Entry: confirmed loss of $0.9900 with a daily close.
🎯 TP1: $0.8500
❌ Stop Loss: $1.0600
Don’t anticipate. Wait for confirmation.
A year of compression generates accumulated energy in both directions. Entering before the breakout is a bet, not a trade.
This is not financial advice. Always have a stop loss before entering.
#xrp #Ripple #BİNANCE #trading #CriptomonedasLATAM
Do you see a bullish breakout or do you think $XRP will break to the downside? 👇 Follow me for the alert when it confirms. 🔔
⚠️ Almost a year of compression. The decision is now.
$XRP is trading at $1.0205, exactly at the tip of a massive descending triangle that has been forming since last September.
When price reaches the tip of a structure like this, the move that follows is usually explosive. The question isn’t whether it will move. It’s which direction.
The two scenarios:
🟢 If it breaks above $1.1300:
The path to $1.3000 and $1.4200 opens up quickly. A descending triangle breakout with volume can be violently bullish.
🔴 If it loses $0.9900:
New lows open up that the market hasn’t seen in a long time. There’s no clear structural support below that level.
The structured trade:
☑️ LONG Entry: confirmed breakout above $1.1300 with a candle close and volume.
🎯 TP1: $1.3000
🎯 TP2: $1.4200
❌ Stop Loss: $1.0500
☑️ SHORT Entry: confirmed loss of $0.9900 with a daily close.
🎯 TP1: $0.8500
❌ Stop Loss: $1.0600
Don’t anticipate. Wait for confirmation.
A year of compression generates accumulated energy in both directions. Entering before the breakout is a bet, not a trade.
This is not financial advice. Always have a stop loss before entering.
#xrp #Ripple #BİNANCE #trading #CriptomonedasLATAM
Do you see a bullish breakout or do you think $XRP will break to the downside? 👇 Follow me for the alert when it confirms. 🔔
Long
58%
Short
42%
105 votes • Voting closed
3
1.9k
·
--

Article
Ultimate guide to burning your trading account using leverage 🔥(Warning: this is sarcasm. If you recognize any of these steps, the market is already getting to know you better than you know it.)
Step 1: Enter without a stop loss
Stop losses are for the weak. You have conviction. The market always comes back, right? Let the position "breathe" while your capital slowly evaporates. Financial meditation.
Step 2: Use the maximum leverage available
Why enter with 5x when you can use 100x? That way, with $100 you control $10,000. What nobody tells you is that a 1% move against you wipes out the entire position. But that will never happen. Never.
Ultimate guide to burning your trading account using leverage 🔥
(Warning: this is sarcasm. If you recognize any of these steps, the market is already getting to know you better than you know it.)
Step 1: Enter without a stop loss
Stop losses are for the weak. You have conviction. The market always comes back, right? Let the position "breathe" while your capital slowly evaporates. Financial meditation.
Step 2: Use the maximum leverage available
Why enter with 5x when you can use 100x? That way, with $100 you control $10,000. What nobody tells you is that a 1% move against you wipes out the entire position. But that will never happen. Never.
Step 1: Enter without a stop loss
Stop losses are for the weak. You have conviction. The market always comes back, right? Let the position "breathe" while your capital slowly evaporates. Financial meditation.
Step 2: Use the maximum leverage available
Why enter with 5x when you can use 100x? That way, with $100 you control $10,000. What nobody tells you is that a 1% move against you wipes out the entire position. But that will never happen. Never.
176
·
--
Bullish
$BTC is sending bottom signals and almost nobody is noticing
Something curious is happening right now. Market sentiment is still deeply bearish on Bitcoin, while the chart is telling a completely different story.
What the price is showing:
$BTC is giving clear technical buy-the-dip signals. The level to watch is $67,000. A breakout and daily close above that zone would not be a minor move—it would open the way toward $80,000 as the next relevant target.
The factor that few people are including in their analysis:
The SP500 also has a critical level at 7,550. If the index breaks that resistance and goes on to new all-time highs, the impact on global risk appetite could be the catalyst that $BTC needs to confirm the move.
Macro and crypto are still more correlated than many want to admit.
The paradox of pessimism:
When everyone is bearish and the price doesn’t keep falling, that in itself is a signal. The seller is getting exhausted. Weak hands are already out. And those who can read the chart start positioning before the narrative changes.
This is not financial advice. Always define your risk management before trading.
#bitcoin #BTC #SP500 #BİNANCE #Trading #CriptomonedasLATAM
Are you still bearish on BTC, or are you already seeing what the chart is showing? 👇 Follow me for more analysis like this. 🔔
$BTC is sending bottom signals and almost nobody is noticing
Something curious is happening right now. Market sentiment is still deeply bearish on Bitcoin, while the chart is telling a completely different story.
What the price is showing:
$BTC is giving clear technical buy-the-dip signals. The level to watch is $67,000. A breakout and daily close above that zone would not be a minor move—it would open the way toward $80,000 as the next relevant target.
The factor that few people are including in their analysis:
The SP500 also has a critical level at 7,550. If the index breaks that resistance and goes on to new all-time highs, the impact on global risk appetite could be the catalyst that $BTC needs to confirm the move.
Macro and crypto are still more correlated than many want to admit.
The paradox of pessimism:
When everyone is bearish and the price doesn’t keep falling, that in itself is a signal. The seller is getting exhausted. Weak hands are already out. And those who can read the chart start positioning before the narrative changes.
This is not financial advice. Always define your risk management before trading.
#bitcoin #BTC #SP500 #BİNANCE #Trading #CriptomonedasLATAM
Are you still bearish on BTC, or are you already seeing what the chart is showing? 👇 Follow me for more analysis like this. 🔔
Something curious is happening right now. Market sentiment is still deeply bearish on Bitcoin, while the chart is telling a completely different story.
What the price is showing:
$BTC is giving clear technical buy-the-dip signals. The level to watch is $67,000. A breakout and daily close above that zone would not be a minor move—it would open the way toward $80,000 as the next relevant target.
The factor that few people are including in their analysis:
The SP500 also has a critical level at 7,550. If the index breaks that resistance and goes on to new all-time highs, the impact on global risk appetite could be the catalyst that $BTC needs to confirm the move.
Macro and crypto are still more correlated than many want to admit.
The paradox of pessimism:
When everyone is bearish and the price doesn’t keep falling, that in itself is a signal. The seller is getting exhausted. Weak hands are already out. And those who can read the chart start positioning before the narrative changes.
This is not financial advice. Always define your risk management before trading.
#bitcoin #BTC #SP500 #BİNANCE #Trading #CriptomonedasLATAM
Are you still bearish on BTC, or are you already seeing what the chart is showing? 👇 Follow me for more analysis like this. 🔔

4
3
199
·
--
Bullish
🔥 The macro buy zone for $BTC is here. The numbers say so.
Are you accumulating in this zone or waiting for lower prices? 👇 Follow me for more analysis like this. 🔔
While the market debates whether a bigger correction is coming, the long-term parabolic trend line is telling a different story.
In 2026, the price is touching exactly the zone where historically the market has capitulated and institutions have accumulated. Not an opinion. It’s the same pattern that has repeated in every cycle.
What the current fractal shows:
The mathematical projection from structural support points to a **+203%** move from these levels. If the fractal plays out as it has in previous cycles, the long-term target remains $200,000 per BTC
Guaranteed? No. No analysis is.
Dismissible? Also no. Not when the macro support has held the price exactly where it should be for months according to the long-term trend.
The real question isn’t whether $BTC will get there.
The real question is whether you’ll be positioned when it happens, or whether you’ll keep waiting for a lower price the market might not give you.
Cycles don’t wait for anyone. Patience does have an expiration date.
This is not financial advice. Always operate with risk management.
#bitcoin #BTC #CryptoAnalysis #bullmarket #CriptomonedasLATAM
🔥 The macro buy zone for $BTC is here. The numbers say so.
Are you accumulating in this zone or waiting for lower prices? 👇 Follow me for more analysis like this. 🔔
While the market debates whether a bigger correction is coming, the long-term parabolic trend line is telling a different story.
In 2026, the price is touching exactly the zone where historically the market has capitulated and institutions have accumulated. Not an opinion. It’s the same pattern that has repeated in every cycle.
What the current fractal shows:
The mathematical projection from structural support points to a **+203%** move from these levels. If the fractal plays out as it has in previous cycles, the long-term target remains $200,000 per BTC
Guaranteed? No. No analysis is.
Dismissible? Also no. Not when the macro support has held the price exactly where it should be for months according to the long-term trend.
The real question isn’t whether $BTC will get there.
The real question is whether you’ll be positioned when it happens, or whether you’ll keep waiting for a lower price the market might not give you.
Cycles don’t wait for anyone. Patience does have an expiration date.
This is not financial advice. Always operate with risk management.
#bitcoin #BTC #CryptoAnalysis #bullmarket #CriptomonedasLATAM
Are you accumulating in this zone or waiting for lower prices? 👇 Follow me for more analysis like this. 🔔
While the market debates whether a bigger correction is coming, the long-term parabolic trend line is telling a different story.
In 2026, the price is touching exactly the zone where historically the market has capitulated and institutions have accumulated. Not an opinion. It’s the same pattern that has repeated in every cycle.
What the current fractal shows:
The mathematical projection from structural support points to a **+203%** move from these levels. If the fractal plays out as it has in previous cycles, the long-term target remains $200,000 per BTC
Guaranteed? No. No analysis is.
Dismissible? Also no. Not when the macro support has held the price exactly where it should be for months according to the long-term trend.
The real question isn’t whether $BTC will get there.
The real question is whether you’ll be positioned when it happens, or whether you’ll keep waiting for a lower price the market might not give you.
Cycles don’t wait for anyone. Patience does have an expiration date.
This is not financial advice. Always operate with risk management.
#bitcoin #BTC #CryptoAnalysis #bullmarket #CriptomonedasLATAM

2
2
109
·
--
Bullish
$BTC
{spot}(BTCUSDT)
decision zone: is the foundation for the next move being formed?
There’s something interesting happening with Bitcoin that’s worth keeping on your radar this week.
What the chart is showing:
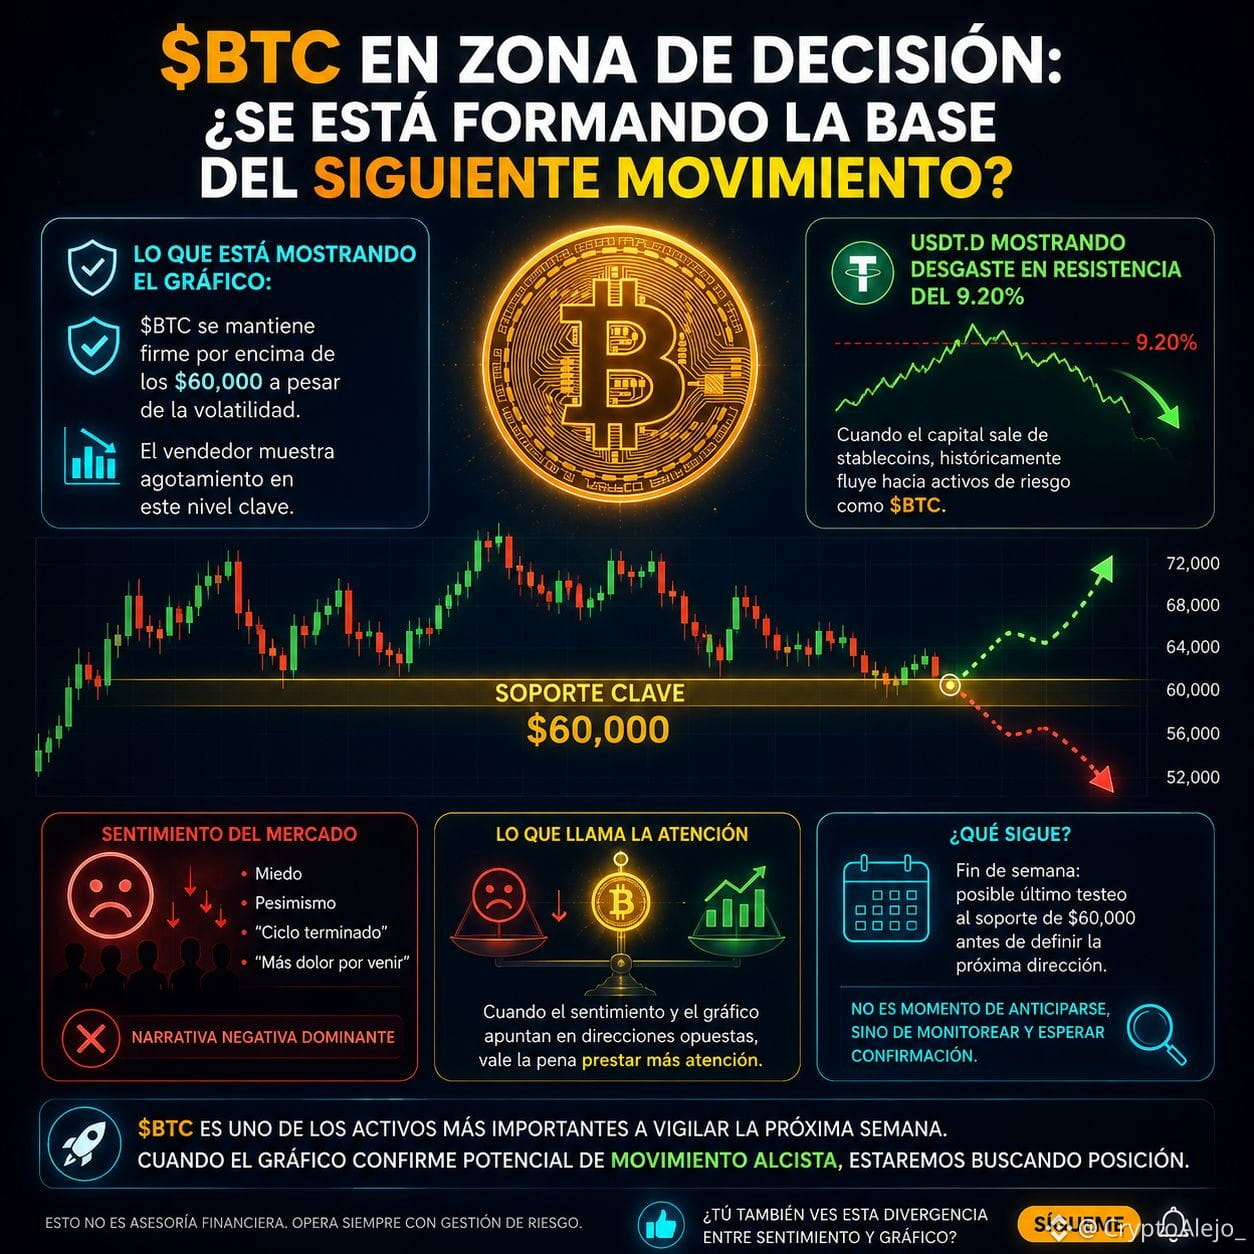
Despite all the volatility that’s shaken traditional markets, $BTC has managed to hold above $60,000. That resilience isn’t a minor detail—it’s a sign that the seller is showing signs of exhaustion at this level.
On top of that, USDT.D (Tether dominance) is beginning to show wear at the 9.20% resistance. When capital starts leaving stablecoins, historically that has preceded moves into risk assets like $BTC.
What stands out:
Market sentiment right now is decidedly bearish. Everyone is talking about a drop, about the cycle being over, about more pain to come. And interestingly, this very negative narrative contrasts with what the chart is showing: a price that won’t give up, consolidating above a key level.
When sentiment and the chart point in opposite directions, it’s worth paying closer attention.
What’s next?
Since it’s the weekend, there’s a possibility of one last test of the $60,000 support before price determines its next direction. This isn’t a time to anticipate—it’s a time to monitor and wait for confirmation.
BTC is one of the most important assets to watch next week. When the chart confirms a potential bullish move, we’ll look for a position.
This is not financial advice. Always trade with risk management.
Do you also see this divergence between sentiment and the chart?
#Bitcoin #BTC #Binance #trading #CriptomonedasLATAM
$BTC
decision zone: is the foundation for the next move being formed?
There’s something interesting happening with Bitcoin that’s worth keeping on your radar this week.
What the chart is showing:
Despite all the volatility that’s shaken traditional markets, $BTC has managed to hold above $60,000. That resilience isn’t a minor detail—it’s a sign that the seller is showing signs of exhaustion at this level.
On top of that, USDT.D (Tether dominance) is beginning to show wear at the 9.20% resistance. When capital starts leaving stablecoins, historically that has preceded moves into risk assets like $BTC .
What stands out:
Market sentiment right now is decidedly bearish. Everyone is talking about a drop, about the cycle being over, about more pain to come. And interestingly, this very negative narrative contrasts with what the chart is showing: a price that won’t give up, consolidating above a key level.
When sentiment and the chart point in opposite directions, it’s worth paying closer attention.
What’s next?
Since it’s the weekend, there’s a possibility of one last test of the $60,000 support before price determines its next direction. This isn’t a time to anticipate—it’s a time to monitor and wait for confirmation.
BTC is one of the most important assets to watch next week. When the chart confirms a potential bullish move, we’ll look for a position.
This is not financial advice. Always trade with risk management.
Do you also see this divergence between sentiment and the chart?
#Bitcoin #BTC #Binance #trading #CriptomonedasLATAM
decision zone: is the foundation for the next move being formed?
There’s something interesting happening with Bitcoin that’s worth keeping on your radar this week.
What the chart is showing:
Despite all the volatility that’s shaken traditional markets, $BTC has managed to hold above $60,000. That resilience isn’t a minor detail—it’s a sign that the seller is showing signs of exhaustion at this level.
On top of that, USDT.D (Tether dominance) is beginning to show wear at the 9.20% resistance. When capital starts leaving stablecoins, historically that has preceded moves into risk assets like $BTC .
What stands out:
Market sentiment right now is decidedly bearish. Everyone is talking about a drop, about the cycle being over, about more pain to come. And interestingly, this very negative narrative contrasts with what the chart is showing: a price that won’t give up, consolidating above a key level.
When sentiment and the chart point in opposite directions, it’s worth paying closer attention.
What’s next?
Since it’s the weekend, there’s a possibility of one last test of the $60,000 support before price determines its next direction. This isn’t a time to anticipate—it’s a time to monitor and wait for confirmation.
BTC is one of the most important assets to watch next week. When the chart confirms a potential bullish move, we’ll look for a position.
This is not financial advice. Always trade with risk management.
Do you also see this divergence between sentiment and the chart?
#Bitcoin #BTC #Binance #trading #CriptomonedasLATAM
85
·
--
Bearish
🚨 BitMart shuts down: are your funds safe?
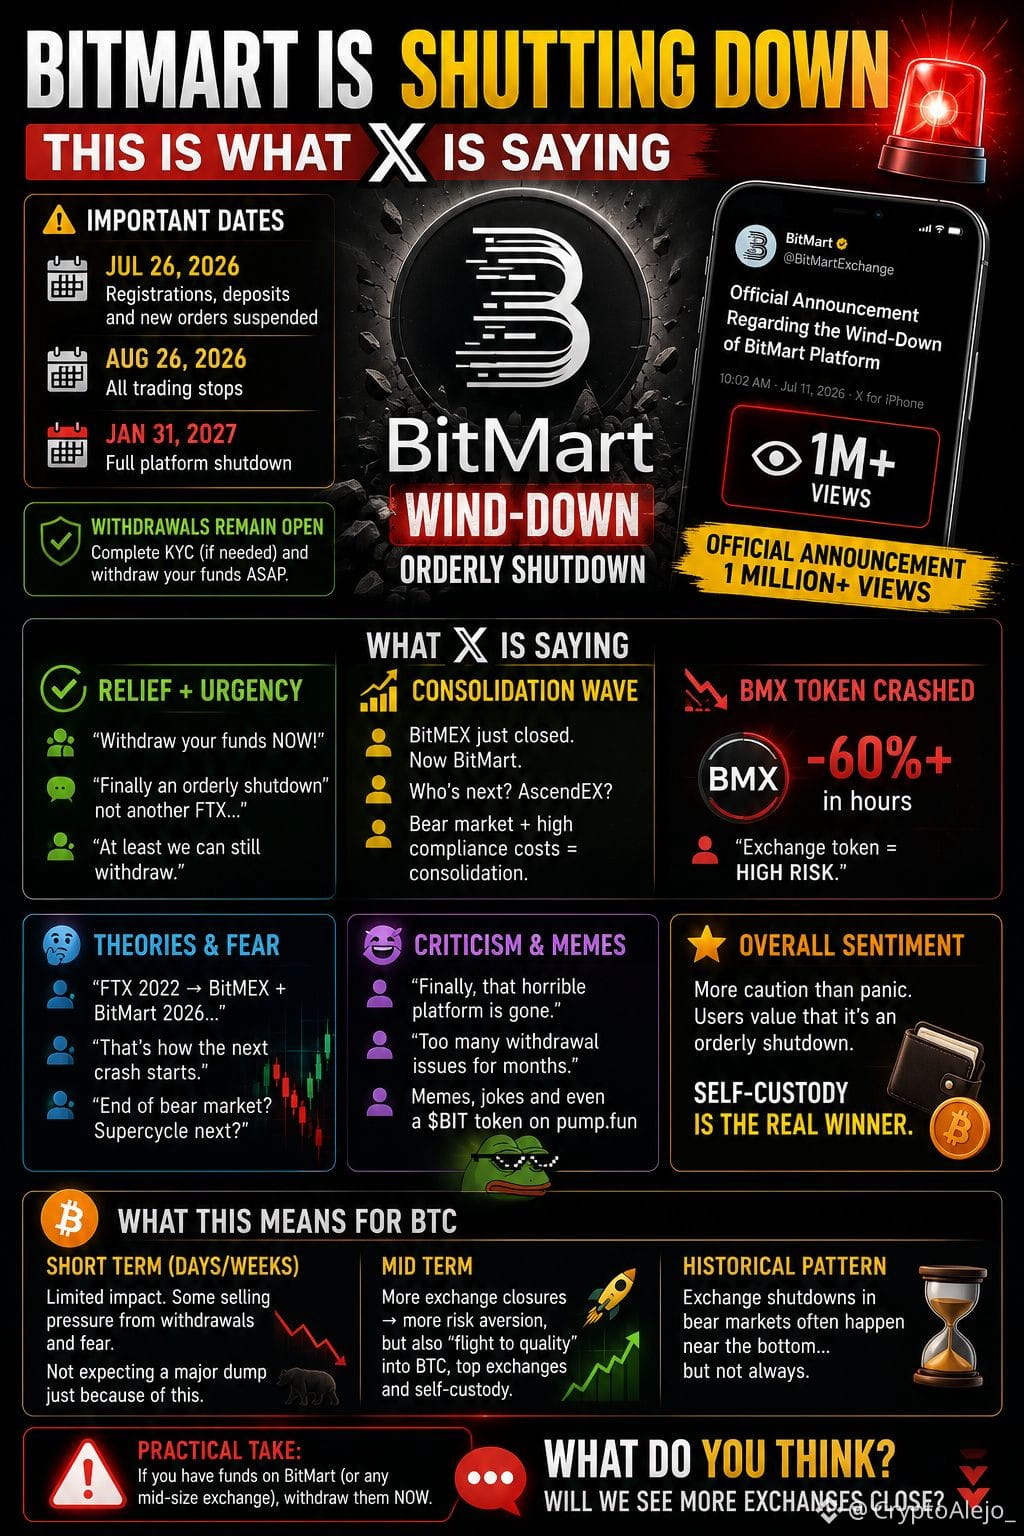
BitMart announced its orderly shutdown. Withdrawals are still open, but time is running out.
Key dates:
- Jul 26: deposits suspended and new orders
- Aug 26: end of trading
- Jan 31, 2027: full cessation
BitMEX also shut down days earlier. Mid-sized exchanges are getting crushed by regulation, competition, and lack of liquidity. This is not an isolated case.
When exchanges collapse, the market gets nervous. And when the market gets nervous, $BTC drops first.
The question you should ask yourself right now:
Where are your funds, and how safe is that platform?
Big exchanges like Binance, with audited reserves and real volume, are not the same as a mid-sized platform operating on the edge. The difference shows up when something goes wrong.
Protecting capital isn’t cowardice. It’s the smartest decision before the market decides for you.
This is not financial advice.
#bitcoin #BitMart #Binance #CriptoSeguridad #CriptomonedasLATAM
{spot}(BTCUSDT)
Have you checked where you keep your funds yet? 👇 Follow me for more analysis like this. 🔔
🚨 BitMart shuts down: are your funds safe?
BitMart announced its orderly shutdown. Withdrawals are still open, but time is running out.
Key dates:
- Jul 26: deposits suspended and new orders
- Aug 26: end of trading
- Jan 31, 2027: full cessation
BitMEX also shut down days earlier. Mid-sized exchanges are getting crushed by regulation, competition, and lack of liquidity. This is not an isolated case.
When exchanges collapse, the market gets nervous. And when the market gets nervous, $BTC drops first.
The question you should ask yourself right now:
Where are your funds, and how safe is that platform?
Big exchanges like Binance, with audited reserves and real volume, are not the same as a mid-sized platform operating on the edge. The difference shows up when something goes wrong.
Protecting capital isn’t cowardice. It’s the smartest decision before the market decides for you.
This is not financial advice.
#bitcoin #BitMart #Binance #CriptoSeguridad #CriptomonedasLATAM
Have you checked where you keep your funds yet? 👇 Follow me for more analysis like this. 🔔
BitMart announced its orderly shutdown. Withdrawals are still open, but time is running out.
Key dates:
- Jul 26: deposits suspended and new orders
- Aug 26: end of trading
- Jan 31, 2027: full cessation
BitMEX also shut down days earlier. Mid-sized exchanges are getting crushed by regulation, competition, and lack of liquidity. This is not an isolated case.
When exchanges collapse, the market gets nervous. And when the market gets nervous, $BTC drops first.
The question you should ask yourself right now:
Where are your funds, and how safe is that platform?
Big exchanges like Binance, with audited reserves and real volume, are not the same as a mid-sized platform operating on the edge. The difference shows up when something goes wrong.
Protecting capital isn’t cowardice. It’s the smartest decision before the market decides for you.
This is not financial advice.
#bitcoin #BitMart #Binance #CriptoSeguridad #CriptomonedasLATAM
Have you checked where you keep your funds yet? 👇 Follow me for more analysis like this. 🔔
324
Log in to explore more content
Join global crypto users on Binance Square
⚡️ Get latest and useful information about crypto.
💬 Trusted by the world’s largest crypto exchange.
👍 Discover real insights from verified creators.
Email / Phone number
Trending Topics
1
#AIStocksWhatNext
542,280 views
4,027 Discussing
2
#21SharesLaunchesEuropesFirstZcashETP
0 views
0 Discussing
3
#CardanoJoinsX402PaymentStandard
243 views
30 Discussing
4
#BitcoinTops$87KAtEightMonthHigh
2,399 views
45 Discussing
5
#ZECBreaksAbove$1600AtRecordHigh
953 views
32 Discussing
6
#BitwiseNEARStakingETPAssetsTop$100M
16,934 views
64 Discussing
7
#BitcoinBreaksAboveMayHighNears$86K
24,946 views
247 Discussing
8
#DogecoinRises15%
85,204 views
1,454 Discussing
9
#$14BBitcoinOptionsExpireFriday
7,229 views
107 Discussing
10
#BNBMarketCapPassesBNYMellon
52,032 views
1,110 Discussing