
#cyber
cyber
26.5M views
79,940 Discussing
Hot
Latest

🩸 $CYBER BLEEDING TO MULTI-MONTH LOWS AS SELLERS FLUSH OUT LATE LONG LIQUIDITY 📉
When the scoreboard flashes deep crimson on assets like $CYBER , emotional sellers panic-dump right into institutional accumulation bands. 🌊
Order flow shows aggressive exhaustion wicks rather than sustained structural distribution on the lower timeframes. 📊
Patience pays dividends when the crowd is busy capitulating at the worst possible technical inflection point. 💡 Are you hunting for reversal confirmations or waiting for a clean trend reclaim? 👇
⚠️ Not financial advice. Always manage your risk. 🛡️
🏷️ #CYBER #Capitulation #SmartMoney #ReversalSetup #Crypto
🦈 💎
🩸 $CYBER BLEEDING TO MULTI-MONTH LOWS AS SELLERS FLUSH OUT LATE LONG LIQUIDITY 📉
When the scoreboard flashes deep crimson on assets like $CYBER , emotional sellers panic-dump right into institutional accumulation bands. 🌊
Order flow shows aggressive exhaustion wicks rather than sustained structural distribution on the lower timeframes. 📊
Patience pays dividends when the crowd is busy capitulating at the worst possible technical inflection point. 💡 Are you hunting for reversal confirmations or waiting for a clean trend reclaim? 👇
⚠️ Not financial advice. Always manage your risk. 🛡️
🏷️ #CYBER #Capitulation #SmartMoney #ReversalSetup #Crypto
🦈 💎
When the scoreboard flashes deep crimson on assets like $CYBER , emotional sellers panic-dump right into institutional accumulation bands. 🌊
Order flow shows aggressive exhaustion wicks rather than sustained structural distribution on the lower timeframes. 📊
Patience pays dividends when the crowd is busy capitulating at the worst possible technical inflection point. 💡 Are you hunting for reversal confirmations or waiting for a clean trend reclaim? 👇
⚠️ Not financial advice. Always manage your risk. 🛡️
🏷️ #CYBER #Capitulation #SmartMoney #ReversalSetup #Crypto
🦈 💎
50

·
--
Bullish
🚀 $CYBER : THE NEXT BIG OPPORTUNITY OR A TRAP FOR LATE BUYERS?
Is CYBER preparing for a powerful bullish move, or are traders about to fall into another market trap? 👀
The big question is whether this is the right time to go LONG or wait for confirmation.
📈 Bullish Scenario: A strong breakout with increasing volume could attract fresh buyers and create an opportunity for further upside.
⚠️ Bearish Risk: A failed breakout could trigger long liquidations and catch FOMO buyers off guard.
🎯 My Strategy: Don't chase green candles. Watch volume, support, resistance, and breakout confirmation before entering.
🔥 CYBER TRADERS, LET'S DISCUSS!
Are you opening a LONG position now, waiting for a pullback, or skipping this opportunity?
What's your CYBER price target? Drop your prediction below!
If you like this analysis, support with a ❤️ Like, Comment & Tip.
#CYBER #CryptoTrading #BinanceSquare #Altcoins #FuturesTrading
🚀 $CYBER : THE NEXT BIG OPPORTUNITY OR A TRAP FOR LATE BUYERS?
Is CYBER preparing for a powerful bullish move, or are traders about to fall into another market trap? 👀
The big question is whether this is the right time to go LONG or wait for confirmation.
📈 Bullish Scenario: A strong breakout with increasing volume could attract fresh buyers and create an opportunity for further upside.
⚠️ Bearish Risk: A failed breakout could trigger long liquidations and catch FOMO buyers off guard.
🎯 My Strategy: Don't chase green candles. Watch volume, support, resistance, and breakout confirmation before entering.
🔥 CYBER TRADERS, LET'S DISCUSS!
Are you opening a LONG position now, waiting for a pullback, or skipping this opportunity?
What's your CYBER price target? Drop your prediction below!
If you like this analysis, support with a ❤️ Like, Comment & Tip.
#CYBER #CryptoTrading #BinanceSquare #Altcoins #FuturesTrading
Is CYBER preparing for a powerful bullish move, or are traders about to fall into another market trap? 👀
The big question is whether this is the right time to go LONG or wait for confirmation.
📈 Bullish Scenario: A strong breakout with increasing volume could attract fresh buyers and create an opportunity for further upside.
⚠️ Bearish Risk: A failed breakout could trigger long liquidations and catch FOMO buyers off guard.
🎯 My Strategy: Don't chase green candles. Watch volume, support, resistance, and breakout confirmation before entering.
🔥 CYBER TRADERS, LET'S DISCUSS!
Are you opening a LONG position now, waiting for a pullback, or skipping this opportunity?
What's your CYBER price target? Drop your prediction below!
If you like this analysis, support with a ❤️ Like, Comment & Tip.
#CYBER #CryptoTrading #BinanceSquare #Altcoins #FuturesTrading
1
419

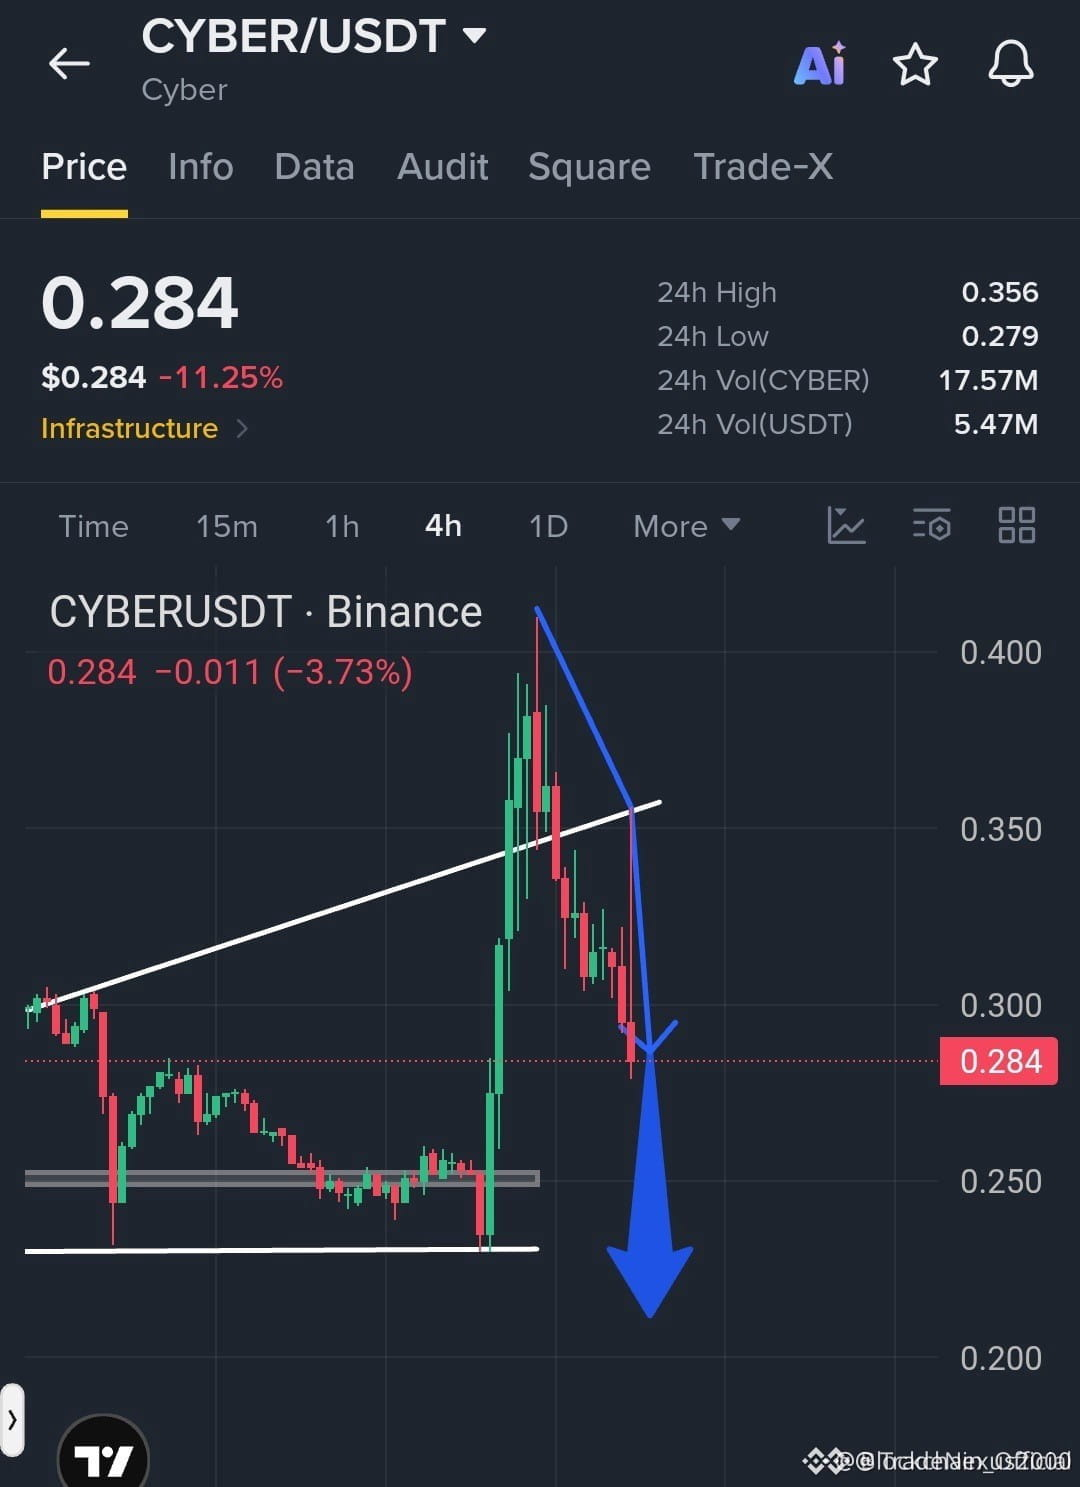
🚨 $CYBER LOSES RISING TRENDLINE AS SMART MONEY DISTRIBUTION TARGETS LOWER LIQUIDITY ZONES 📉
Entry: 0.284 – 0.290 ⚡
Target: 0.220 🚀
Stop Loss: 0.310 ⚠️
Institutional order flow on $CYBER has flipped defensive following a heavy rejection at the 0.400 macro resistance barrier. Price action broke decisively below the ascending trendline structure, signaling a shift toward aggressive bearish continuation. 📊
Sellers are currently leaning on the 0.284 to 0.290 distribution zone, with intermediate inefficiency fills eyed down at 0.270 and 0.250 before sweeping the major liquidity pool at 0.220. 🌊 Are you scaling into shorts on this retest, or waiting for a breakdown confirmation below support? 👇
⚠️ Not financial advice. Always manage your risk. 🛡️
🏷️ #CYBER #ShortSetup #MarketStructure #Bearish #Crypto
🦈 📉
🚨 $CYBER LOSES RISING TRENDLINE AS SMART MONEY DISTRIBUTION TARGETS LOWER LIQUIDITY ZONES 📉
Entry: 0.284 – 0.290 ⚡
Target: 0.220 🚀
Stop Loss: 0.310 ⚠️
Institutional order flow on $CYBER has flipped defensive following a heavy rejection at the 0.400 macro resistance barrier. Price action broke decisively below the ascending trendline structure, signaling a shift toward aggressive bearish continuation. 📊
Sellers are currently leaning on the 0.284 to 0.290 distribution zone, with intermediate inefficiency fills eyed down at 0.270 and 0.250 before sweeping the major liquidity pool at 0.220. 🌊 Are you scaling into shorts on this retest, or waiting for a breakdown confirmation below support? 👇
⚠️ Not financial advice. Always manage your risk. 🛡️
🏷️ #CYBER #ShortSetup #MarketStructure #Bearish #Crypto
🦈 📉
Entry: 0.284 – 0.290 ⚡
Target: 0.220 🚀
Stop Loss: 0.310 ⚠️
Institutional order flow on $CYBER has flipped defensive following a heavy rejection at the 0.400 macro resistance barrier. Price action broke decisively below the ascending trendline structure, signaling a shift toward aggressive bearish continuation. 📊
Sellers are currently leaning on the 0.284 to 0.290 distribution zone, with intermediate inefficiency fills eyed down at 0.270 and 0.250 before sweeping the major liquidity pool at 0.220. 🌊 Are you scaling into shorts on this retest, or waiting for a breakdown confirmation below support? 👇
⚠️ Not financial advice. Always manage your risk. 🛡️
🏷️ #CYBER #ShortSetup #MarketStructure #Bearish #Crypto
🦈 📉
7
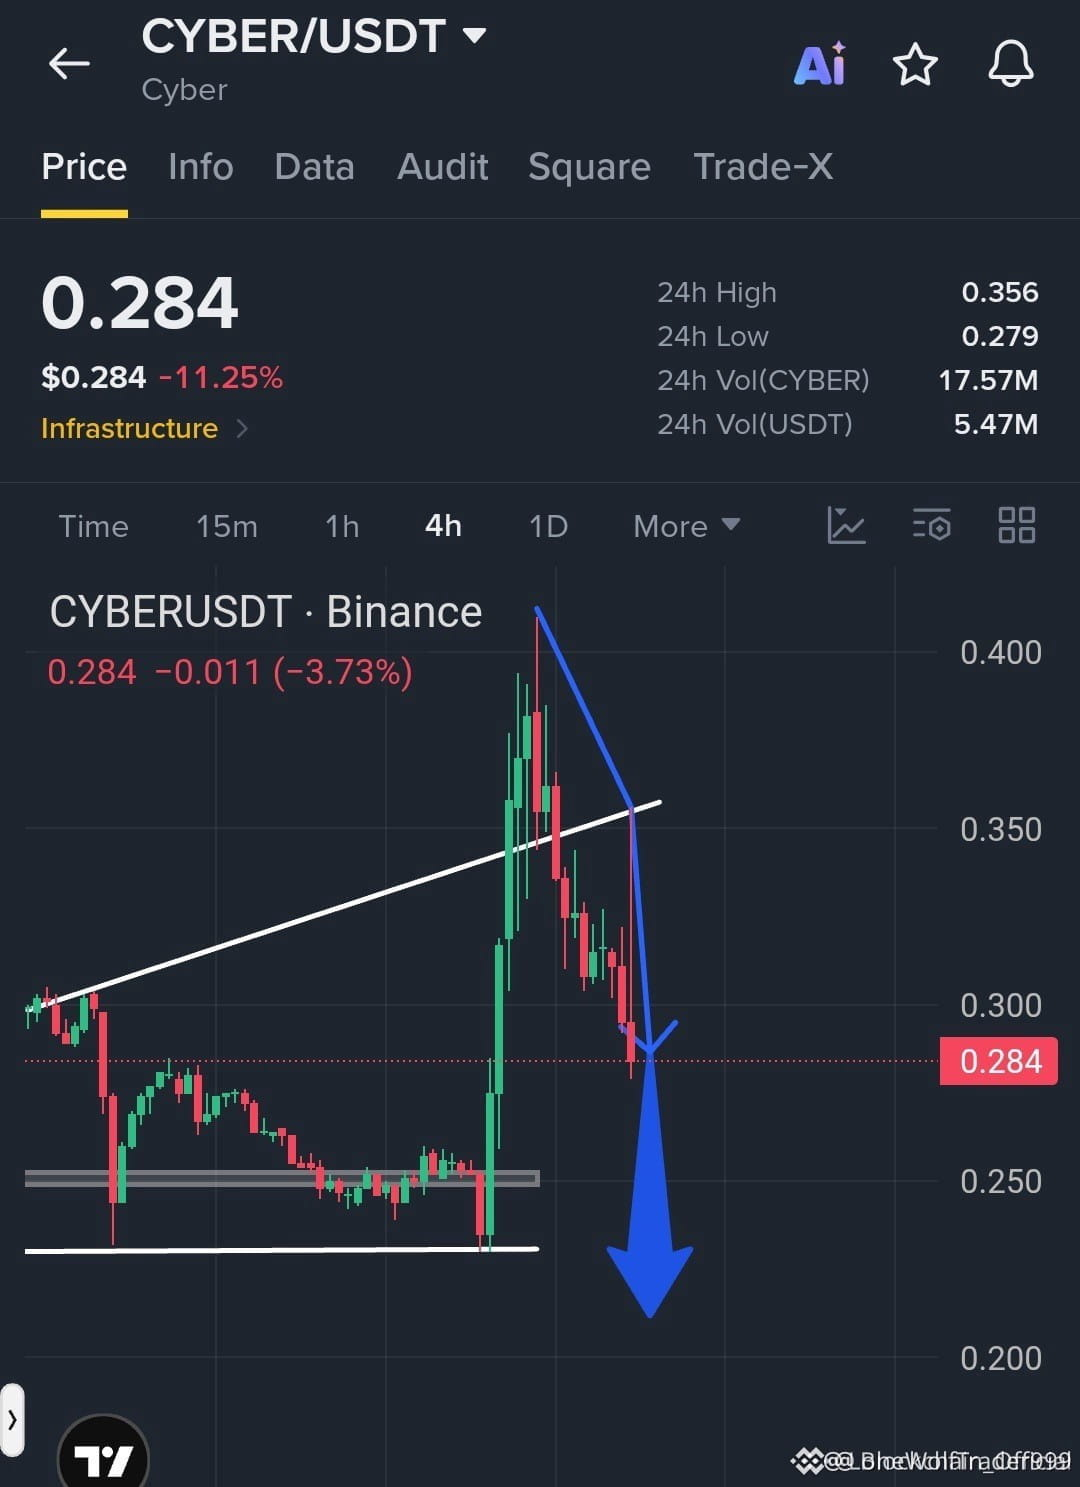
🚨 $CYBER BREAKS KEY RISING TRENDLINE AS SELLERS CRUSH THE $0.400 REJECTION ZONE! 📉
Entry: $0.284 – $0.290 ⚡
Target 1: $0.270 🎯
Target 2: $0.250 🎯
Target 3: $0.220 🚀
Stop Loss: $0.310 ⚠️
The structure is cracking under heavy distribution after that failed attempt to hold the $0.400 ceiling. 📊 Order flow shows aggressive sellers stepping in every time price attempts a minor relief bounce. 📉
With the rising trendline now officially breached, the path of least resistance points straight downward into deeper historical liquidity pockets. 🌊
Are you riding this momentum down to the lower supports or waiting for a retest? 👇
⚠️ Not financial advice. Always manage your risk. 🛡️
🏷️ #CYBER #ShortSetup #Crypto #Bearish
🐻 📉
🚨 $CYBER BREAKS KEY RISING TRENDLINE AS SELLERS CRUSH THE $0.400 REJECTION ZONE! 📉
Entry: $0.284 – $0.290 ⚡
Target 1: $0.270 🎯
Target 2: $0.250 🎯
Target 3: $0.220 🚀
Stop Loss: $0.310 ⚠️
The structure is cracking under heavy distribution after that failed attempt to hold the $0.400 ceiling. 📊 Order flow shows aggressive sellers stepping in every time price attempts a minor relief bounce. 📉
With the rising trendline now officially breached, the path of least resistance points straight downward into deeper historical liquidity pockets. 🌊
Are you riding this momentum down to the lower supports or waiting for a retest? 👇
⚠️ Not financial advice. Always manage your risk. 🛡️
🏷️ #CYBER #ShortSetup #Crypto #Bearish
🐻 📉
Entry: $0.284 – $0.290 ⚡
Target 1: $0.270 🎯
Target 2: $0.250 🎯
Target 3: $0.220 🚀
Stop Loss: $0.310 ⚠️
The structure is cracking under heavy distribution after that failed attempt to hold the $0.400 ceiling. 📊 Order flow shows aggressive sellers stepping in every time price attempts a minor relief bounce. 📉
With the rising trendline now officially breached, the path of least resistance points straight downward into deeper historical liquidity pockets. 🌊
Are you riding this momentum down to the lower supports or waiting for a retest? 👇
⚠️ Not financial advice. Always manage your risk. 🛡️
🏷️ #CYBER #ShortSetup #Crypto #Bearish
🐻 📉
10

·
--
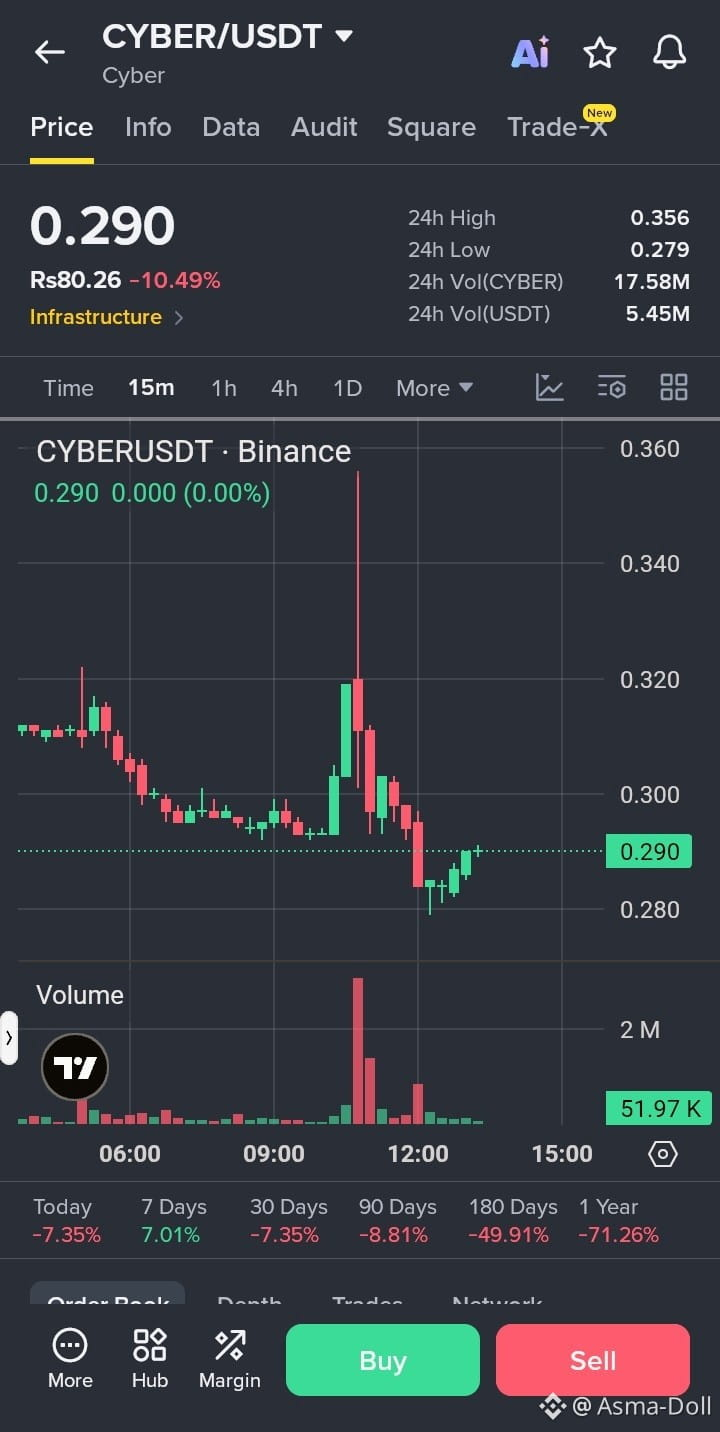
🔴 $CYBER /USDT – SHORT SIGNAL
Current Price: $0.290
24H Change: -10.49%
Bias: Bearish 📉
Trade Plan
Entry: $0.290 – $0.296
Stop Loss (SL): $0.310
🎯 Take Profits
TP1: $0.280
TP2: $0.270
TP3: $0.255
Trade here $CYBER
{future}(CYBERUSDT)
Analysis
Strong selling pressure with a 10.49% daily decline.
Rejection from the $0.356 resistance zone.
Price approaching the $0.279 support.
Lower-timeframe momentum appears bearish.
Further downside possible if support breaks.
Confirmation
A clean 15-minute candle close below $0.279 with strong selling volume confirms bearish continuation.
Risk-to-Reward
Approximate R:R (entry $0.293):
TP1: 1:0.65
TP2: 1:1.15
TP3: 1:1.9
⚠️ Risk Management: Avoid chasing the dump. Wait for a breakdown or failed retest. Invalidation above $0.310.
#CYBER #CyberConnect #USDT #CryptoSignals #ShortSignal
🔴 $CYBER /USDT – SHORT SIGNAL
Current Price: $0.290
24H Change: -10.49%
Bias: Bearish 📉
Trade Plan
Entry: $0.290 – $0.296
Stop Loss (SL): $0.310
🎯 Take Profits
TP1: $0.280
TP2: $0.270
TP3: $0.255
Trade here $CYBER
Analysis
Strong selling pressure with a 10.49% daily decline.
Rejection from the $0.356 resistance zone.
Price approaching the $0.279 support.
Lower-timeframe momentum appears bearish.
Further downside possible if support breaks.
Confirmation
A clean 15-minute candle close below $0.279 with strong selling volume confirms bearish continuation.
Risk-to-Reward
Approximate R:R (entry $0.293):
TP1: 1:0.65
TP2: 1:1.15
TP3: 1:1.9
⚠️ Risk Management: Avoid chasing the dump. Wait for a breakdown or failed retest. Invalidation above $0.310.
#CYBER #CyberConnect #USDT #CryptoSignals #ShortSignal
Current Price: $0.290
24H Change: -10.49%
Bias: Bearish 📉
Trade Plan
Entry: $0.290 – $0.296
Stop Loss (SL): $0.310
🎯 Take Profits
TP1: $0.280
TP2: $0.270
TP3: $0.255
Trade here $CYBER
Analysis
Strong selling pressure with a 10.49% daily decline.
Rejection from the $0.356 resistance zone.
Price approaching the $0.279 support.
Lower-timeframe momentum appears bearish.
Further downside possible if support breaks.
Confirmation
A clean 15-minute candle close below $0.279 with strong selling volume confirms bearish continuation.
Risk-to-Reward
Approximate R:R (entry $0.293):
TP1: 1:0.65
TP2: 1:1.15
TP3: 1:1.9
⚠️ Risk Management: Avoid chasing the dump. Wait for a breakdown or failed retest. Invalidation above $0.310.
#CYBER #CyberConnect #USDT #CryptoSignals #ShortSignal
2
35

·
--
Bullish
CYBER shorts took a hit around $0.28373.
The upside squeeze is worth watching.
$CYBER
{future}(CYBERUSDT)
$KOMA
{future}(KOMAUSDT)
$IDOL
{future}(IDOLUSDT)
🟢 LIQUIDITY ZONE HIT 🟢
Short liquidation spotted 🧨
$4.9432K cleared at $0.28373
Upside liquidity swept — watch reaction 👀
🎯 TP Targets:
TP1: ~$0.28514865
TP2: ~$0.2865673
TP3: ~$0.28798595
#CYBER
CYBER shorts took a hit around $0.28373.
The upside squeeze is worth watching.
$CYBER
$KOMA
$IDOL
🟢 LIQUIDITY ZONE HIT 🟢
Short liquidation spotted 🧨
$4.9432K cleared at $0.28373
Upside liquidity swept — watch reaction 👀
🎯 TP Targets:
TP1: ~$0.28514865
TP2: ~$0.2865673
TP3: ~$0.28798595
#CYBER
The upside squeeze is worth watching.
$CYBER
$KOMA
$IDOL
🟢 LIQUIDITY ZONE HIT 🟢
Short liquidation spotted 🧨
$4.9432K cleared at $0.28373
Upside liquidity swept — watch reaction 👀
🎯 TP Targets:
TP1: ~$0.28514865
TP2: ~$0.2865673
TP3: ~$0.28798595
#CYBER
26

·
--
Bearish
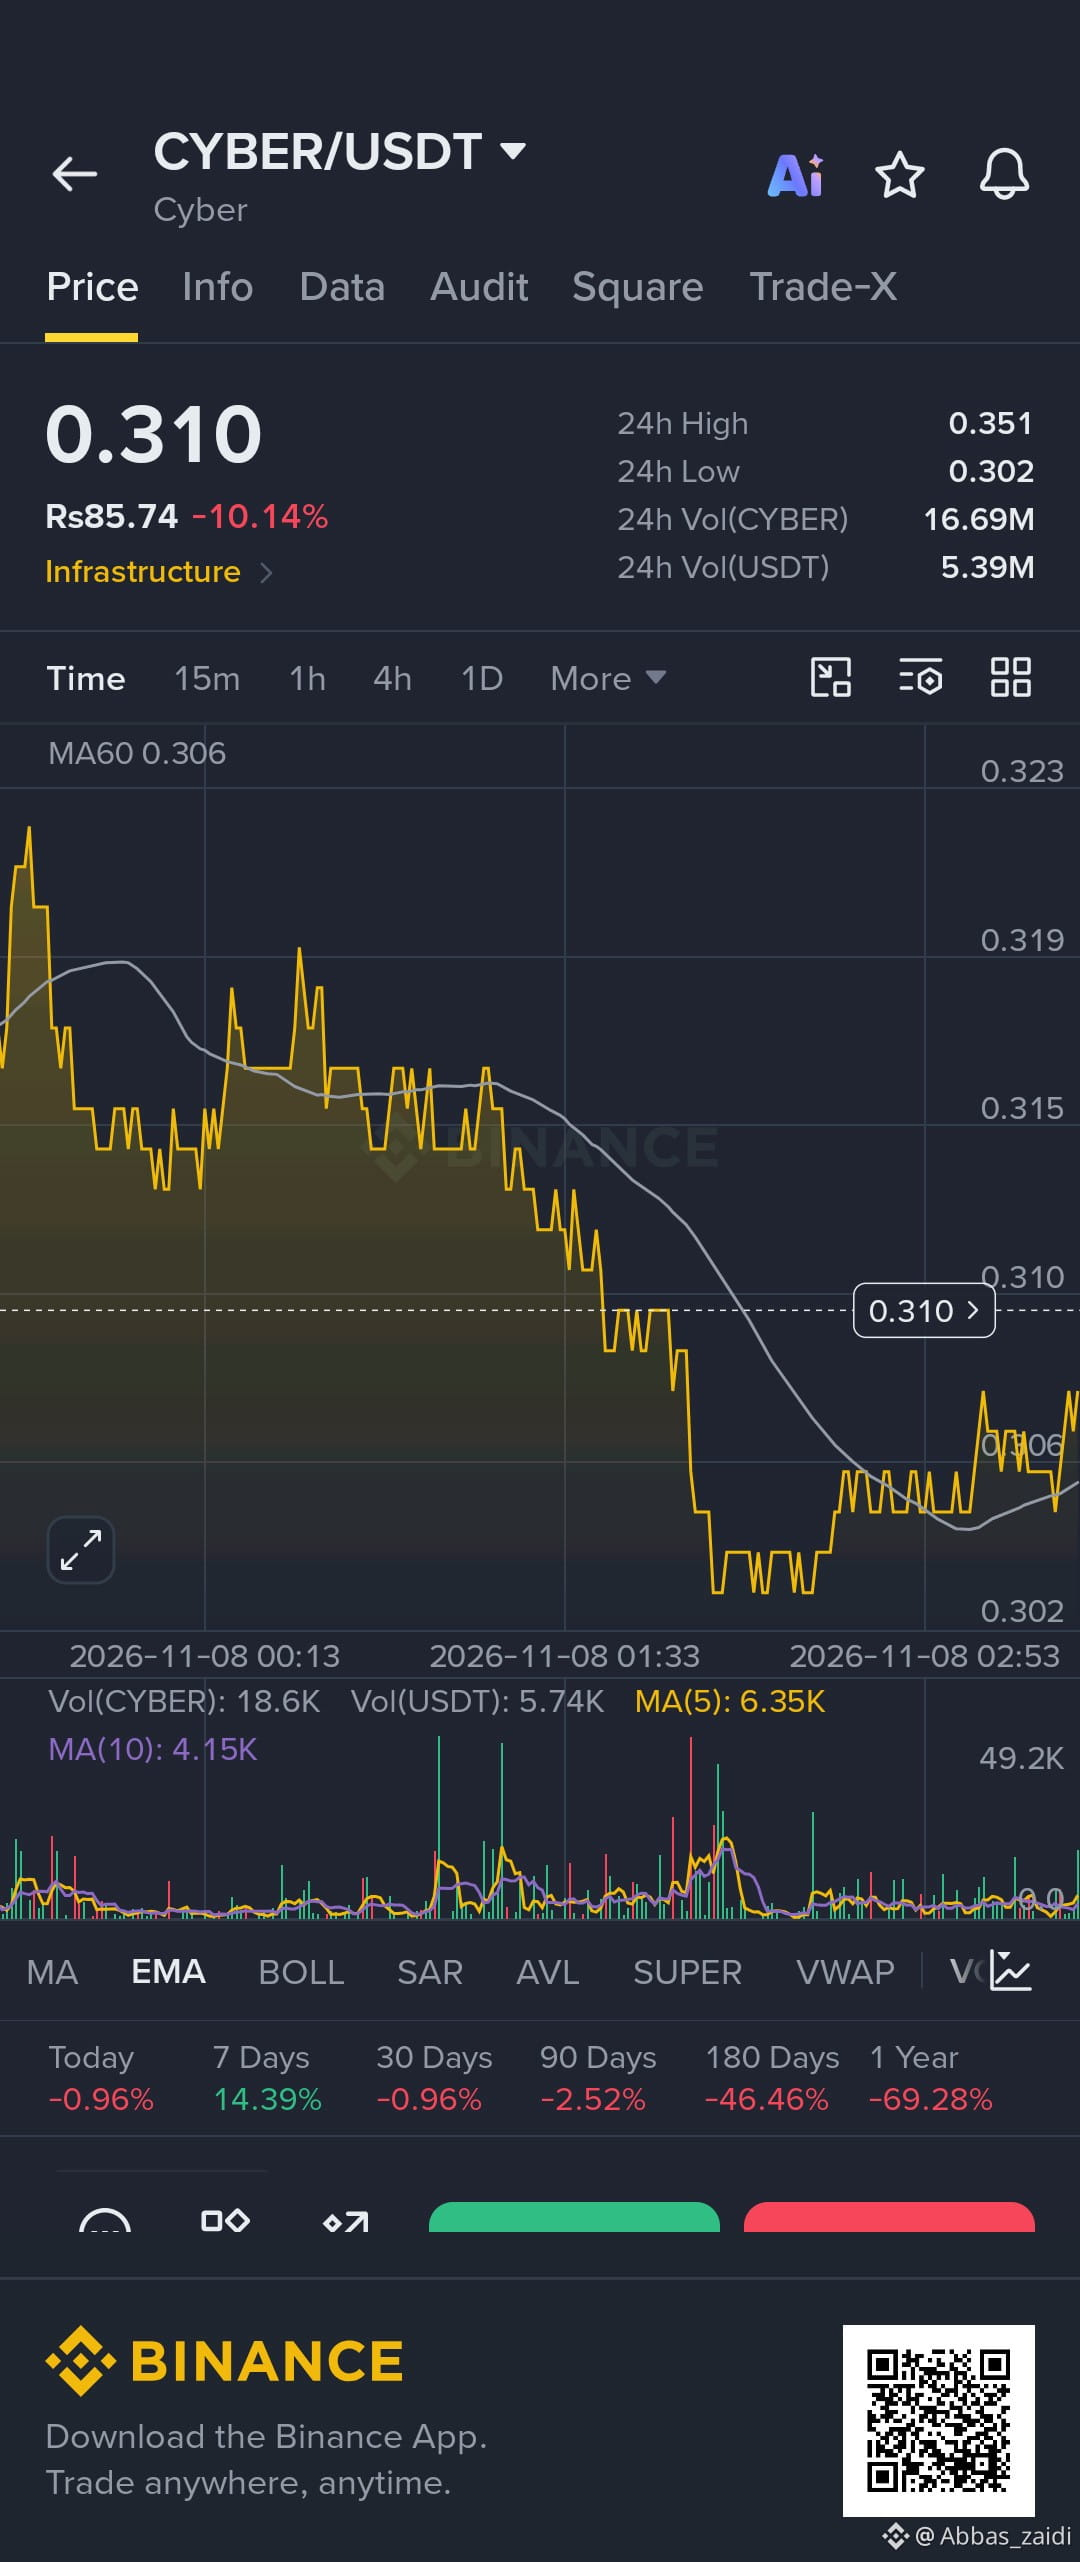
🚨 CYBER/USDT Market Update: Is this dip a buying opportunity? 🤔
$CYBER is currently trading on Binance at $0.310, experiencing a -10.14% drop over the last 24 hours. 📉 According to the chart, the token is attempting to hold support near its daily low.
📊 Key Stats:
* Current Price: $0.310 (Rs 85.74)
* 24h High / Low: $0.351 / $0.302
* 24h Volume: 16.69M CYBER
* Weekly Trend: Despite today's correction, it remains +14.39% up over the last 7 days.
💡 Technical View: The chart shows a short-term downtrend, and after touching the $0.302 low, it is currently consolidating around the $0.310 zone. If the $0.302 support breaks, we could see a further dip—so always make sure to use a stop-loss in your trades. 🛑
Do you think CYBER will pump from here or head lower? Drop your thoughts in the comments! 👇
{spot}(CYBERUSDT)
#CYBER #CYBERUSDT #Binance #CryptoAnalysis
🚨 CYBER/USDT Market Update: Is this dip a buying opportunity? 🤔
$CYBER is currently trading on Binance at $0.310, experiencing a -10.14% drop over the last 24 hours. 📉 According to the chart, the token is attempting to hold support near its daily low.
📊 Key Stats:
* Current Price: $0.310 (Rs 85.74)
* 24h High / Low: $0.351 / $0.302
* 24h Volume: 16.69M CYBER
* Weekly Trend: Despite today's correction, it remains +14.39% up over the last 7 days.
💡 Technical View: The chart shows a short-term downtrend, and after touching the $0.302 low, it is currently consolidating around the $0.310 zone. If the $0.302 support breaks, we could see a further dip—so always make sure to use a stop-loss in your trades. 🛑
Do you think CYBER will pump from here or head lower? Drop your thoughts in the comments! 👇
#CYBER #CYBERUSDT #Binance #CryptoAnalysis
$CYBER is currently trading on Binance at $0.310, experiencing a -10.14% drop over the last 24 hours. 📉 According to the chart, the token is attempting to hold support near its daily low.
📊 Key Stats:
* Current Price: $0.310 (Rs 85.74)
* 24h High / Low: $0.351 / $0.302
* 24h Volume: 16.69M CYBER
* Weekly Trend: Despite today's correction, it remains +14.39% up over the last 7 days.
💡 Technical View: The chart shows a short-term downtrend, and after touching the $0.302 low, it is currently consolidating around the $0.310 zone. If the $0.302 support breaks, we could see a further dip—so always make sure to use a stop-loss in your trades. 🛑
Do you think CYBER will pump from here or head lower? Drop your thoughts in the comments! 👇
#CYBER #CYBERUSDT #Binance #CryptoAnalysis
1
471

·
--
sometimes luck Favor you $CYBER
SL save me
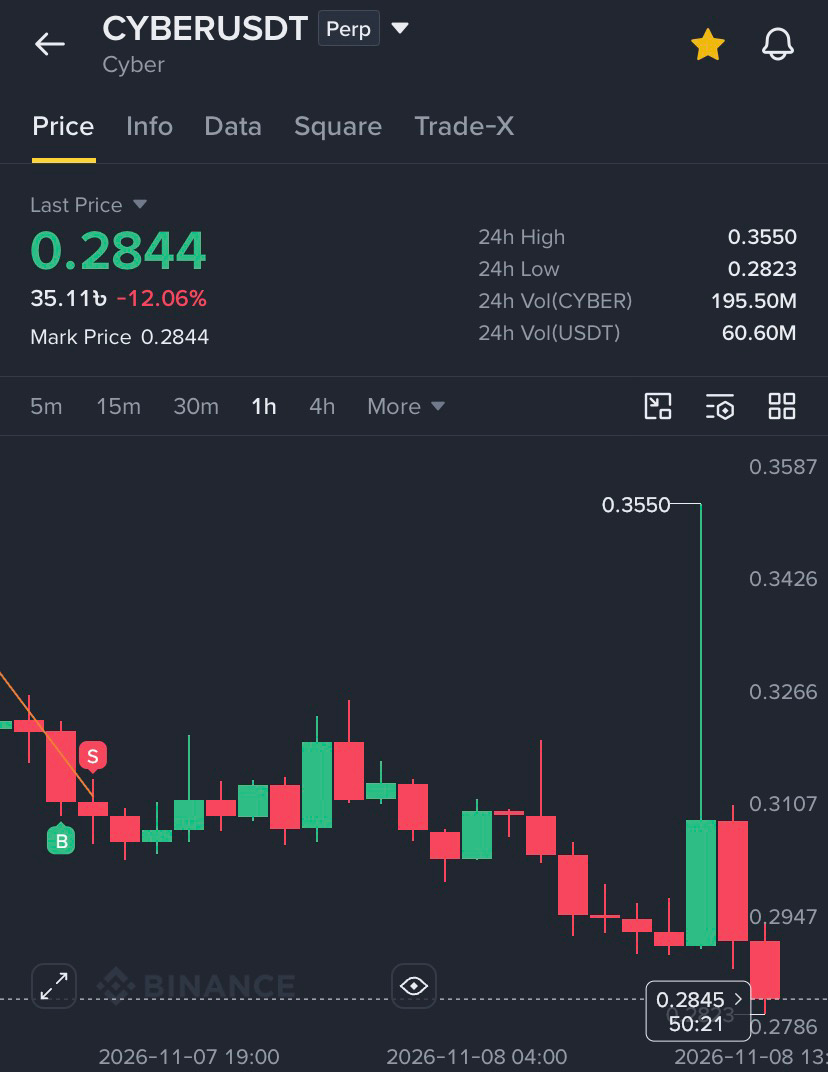
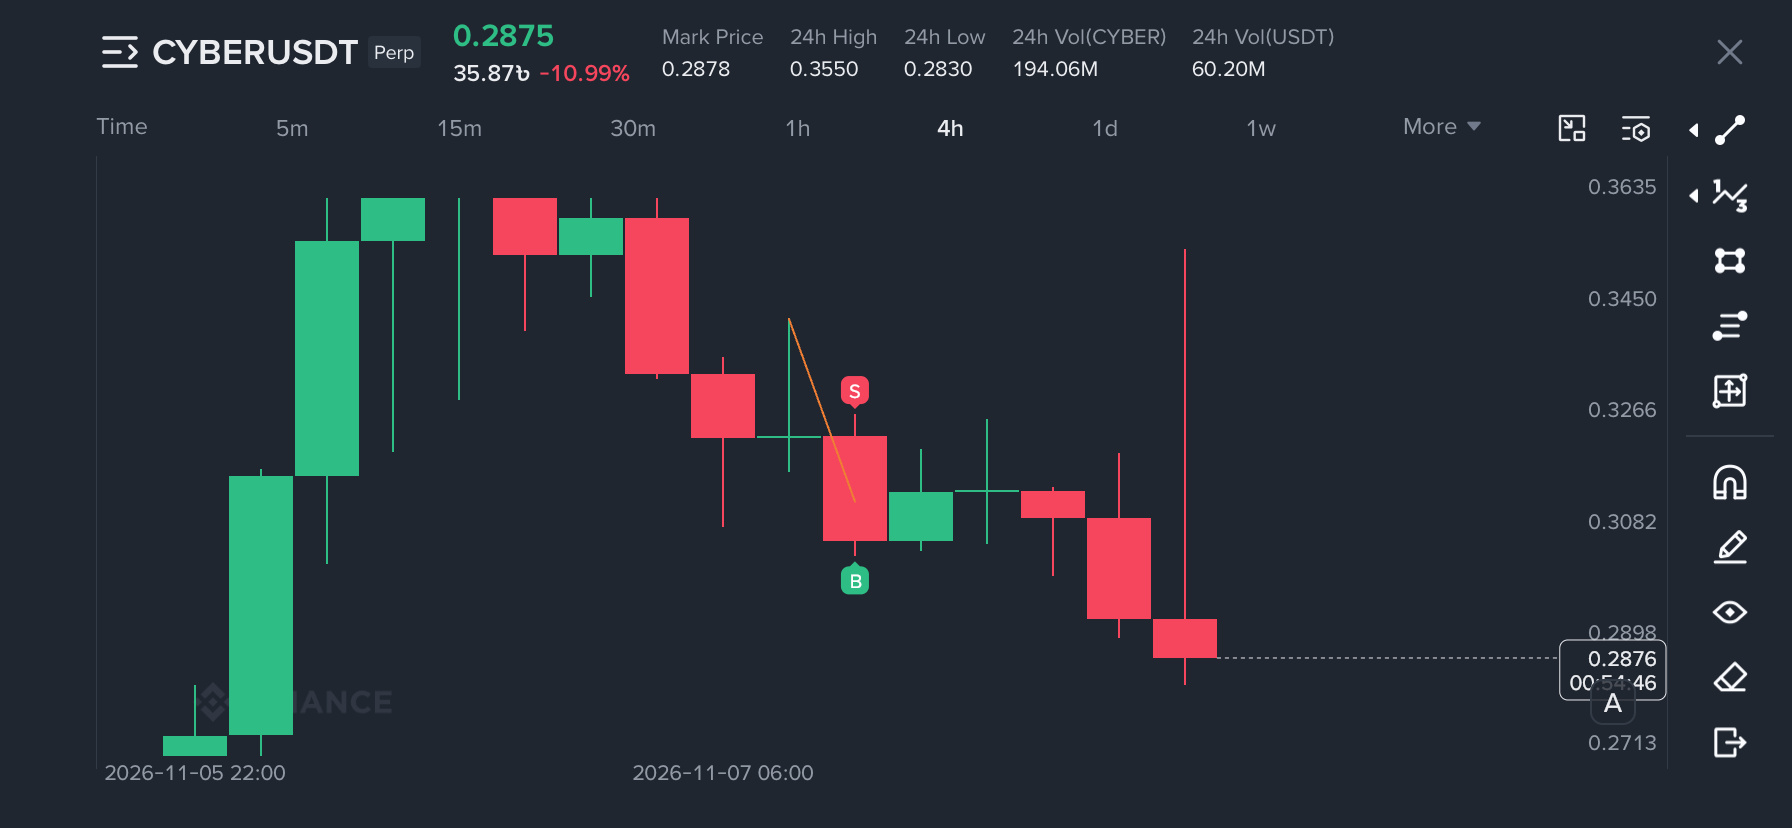
#CYBER took my SL yesterday
after taking the SL
the spike is really noticeable
Look at the ss below 1h tf
now it is going down which make me satisfied
And look at the 4h tf the pin is hugeeeeeee
#JobsReportRaisesHikeOdds
sometimes luck Favor you $CYBER
SL save me
#CYBER took my SL yesterday
after taking the SL
the spike is really noticeable
Look at the ss below 1h tf
now it is going down which make me satisfied
And look at the 4h tf the pin is hugeeeeeee
#JobsReportRaisesHikeOdds
SL save me
#CYBER took my SL yesterday
after taking the SL
the spike is really noticeable
Look at the ss below 1h tf
now it is going down which make me satisfied
And look at the 4h tf the pin is hugeeeeeee
#JobsReportRaisesHikeOdds
2
338


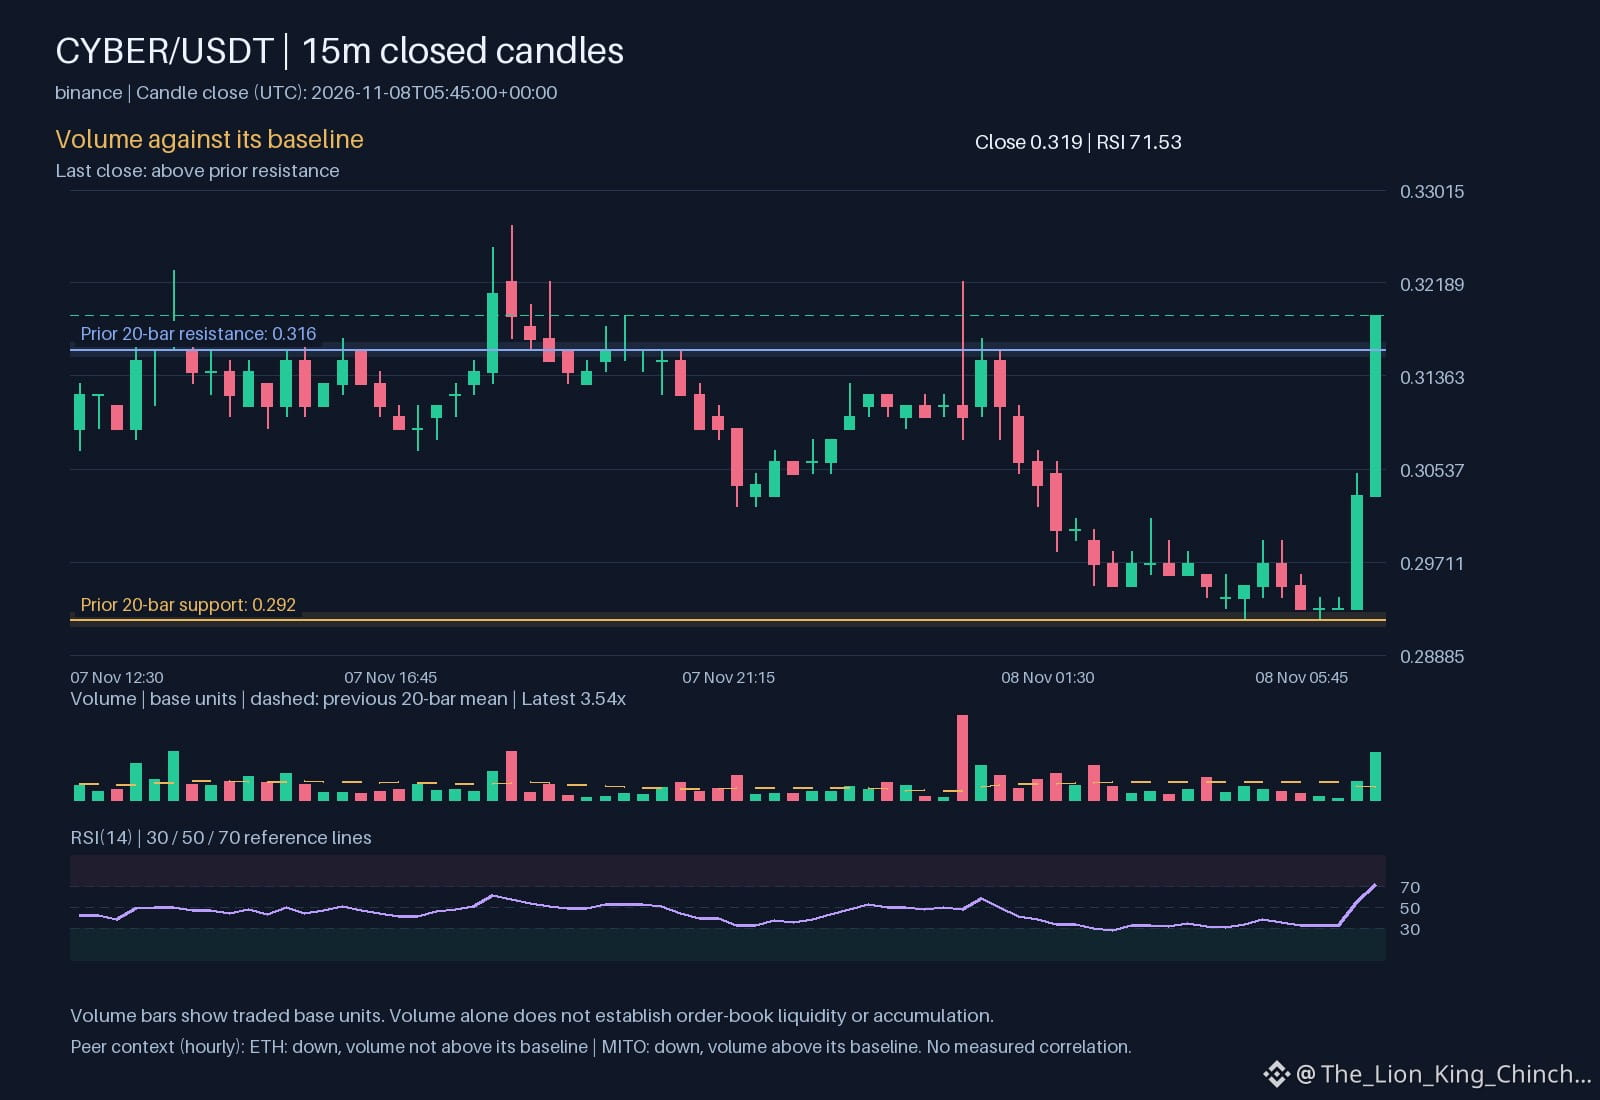
$CYBER: Why Shared Direction Lacks Causality
The asset $CYBER sits above resistance with an upward hourly trend. Its volume is above baseline, yet single-timeframe data limits certainty. Two peers provide context. $ETH moves down with low volume. $MITO moves down with high volume. Despite the shared downward direction, these assets show divergent participation.
This difference highlights volume as a key metric. Low volume suggests limited conviction in that movement. High volume suggests active trading. Two names moving in the same direction does not prove they are linked. It does not show capital rotation or a single cause. A watchlist ranking is not a market-wide gainer list.
We must distinguish observation from proof. Just because two charts slope the same way does not mean they move together long term. Volume changes show how firm consensus is. High volume can mean solid movement or heavy churning. We do not know from this data alone.
To verify your read, check if price keeps support. If $CYBER breaks resistance but volume fades, the move may be weak. If volume stays high, the shift is more supported. Ask yourself whether this looks like a coordinated setup or just a grouping. Do not overstate the link. A single data point is not proof of a relationship. We wait for more confirmation than just this snapshot. The details matter far more than the broad direction. Do not rush to a conclusion here. We trust the flow of tokens, not just the arrows. This is a starting point for deeper lookup.
Probabilistic market research, not a recommendation or guaranteed return.
The comparison to keep in mind: $ETH has hourly direction down and volume not above its baseline; $MITO has hourly direction down and volume above its baseline. This alone does not establish correlation.
Which matters more in this comparison: direction or how the move holds?
#CYBER #ETH #MITO #CryptoWatchlist
$CYBER : Why Shared Direction Lacks Causality
The asset $CYBER sits above resistance with an upward hourly trend. Its volume is above baseline, yet single-timeframe data limits certainty. Two peers provide context. $ETH moves down with low volume. $MITO moves down with high volume. Despite the shared downward direction, these assets show divergent participation.
This difference highlights volume as a key metric. Low volume suggests limited conviction in that movement. High volume suggests active trading. Two names moving in the same direction does not prove they are linked. It does not show capital rotation or a single cause. A watchlist ranking is not a market-wide gainer list.
We must distinguish observation from proof. Just because two charts slope the same way does not mean they move together long term. Volume changes show how firm consensus is. High volume can mean solid movement or heavy churning. We do not know from this data alone.
To verify your read, check if price keeps support. If $CYBER breaks resistance but volume fades, the move may be weak. If volume stays high, the shift is more supported. Ask yourself whether this looks like a coordinated setup or just a grouping. Do not overstate the link. A single data point is not proof of a relationship. We wait for more confirmation than just this snapshot. The details matter far more than the broad direction. Do not rush to a conclusion here. We trust the flow of tokens, not just the arrows. This is a starting point for deeper lookup.
Probabilistic market research, not a recommendation or guaranteed return.
The comparison to keep in mind: $ETH has hourly direction down and volume not above its baseline; $MITO has hourly direction down and volume above its baseline. This alone does not establish correlation.
Which matters more in this comparison: direction or how the move holds?
#CYBER #ETH #MITO #CryptoWatchlist
The asset $CYBER sits above resistance with an upward hourly trend. Its volume is above baseline, yet single-timeframe data limits certainty. Two peers provide context. $ETH moves down with low volume. $MITO moves down with high volume. Despite the shared downward direction, these assets show divergent participation.
This difference highlights volume as a key metric. Low volume suggests limited conviction in that movement. High volume suggests active trading. Two names moving in the same direction does not prove they are linked. It does not show capital rotation or a single cause. A watchlist ranking is not a market-wide gainer list.
We must distinguish observation from proof. Just because two charts slope the same way does not mean they move together long term. Volume changes show how firm consensus is. High volume can mean solid movement or heavy churning. We do not know from this data alone.
To verify your read, check if price keeps support. If $CYBER breaks resistance but volume fades, the move may be weak. If volume stays high, the shift is more supported. Ask yourself whether this looks like a coordinated setup or just a grouping. Do not overstate the link. A single data point is not proof of a relationship. We wait for more confirmation than just this snapshot. The details matter far more than the broad direction. Do not rush to a conclusion here. We trust the flow of tokens, not just the arrows. This is a starting point for deeper lookup.
Probabilistic market research, not a recommendation or guaranteed return.
The comparison to keep in mind: $ETH has hourly direction down and volume not above its baseline; $MITO has hourly direction down and volume above its baseline. This alone does not establish correlation.
Which matters more in this comparison: direction or how the move holds?
#CYBER #ETH #MITO #CryptoWatchlist
21

·
--
Bullish
🚀 $CYBER BOOM! Targets SMASHED! ✅🔥
{future}(CYBERUSDT)
If you followed the $CYBER setup shared earlier, look at how amazingly the market played out! 📈
24h High Reached: $0.3850 ✅
TP 1 ($0.3750): ✅ HIT!
TP 2 ($0.4000): ❌ (Reached a peak of $0.4111 prior to this 24h window, current 24h high touched $0.3850)
TP 1 was successfully crushed as price pumped past $0.3850! This is the power of catching strong structural setups right before momentum kicks in.
Hope everyone locked in solid profits on this move! Keep managing your risk and stay tuned for the next setup. 💰💪
#CYBER #CryptoTrading #BinanceSquare #Alizbahcrypto #ProfitTargetHit
🚀 $CYBER BOOM! Targets SMASHED! ✅🔥
If you followed the $CYBER setup shared earlier, look at how amazingly the market played out! 📈
24h High Reached: $0.3850 ✅
TP 1 ($0.3750): ✅ HIT!
TP 2 ($0.4000): ❌ (Reached a peak of $0.4111 prior to this 24h window, current 24h high touched $0.3850)
TP 1 was successfully crushed as price pumped past $0.3850! This is the power of catching strong structural setups right before momentum kicks in.
Hope everyone locked in solid profits on this move! Keep managing your risk and stay tuned for the next setup. 💰💪
#CYBER #CryptoTrading #BinanceSquare #Alizbahcrypto #ProfitTargetHit
If you followed the $CYBER setup shared earlier, look at how amazingly the market played out! 📈
24h High Reached: $0.3850 ✅
TP 1 ($0.3750): ✅ HIT!
TP 2 ($0.4000): ❌ (Reached a peak of $0.4111 prior to this 24h window, current 24h high touched $0.3850)
TP 1 was successfully crushed as price pumped past $0.3850! This is the power of catching strong structural setups right before momentum kicks in.
Hope everyone locked in solid profits on this move! Keep managing your risk and stay tuned for the next setup. 💰💪
#CYBER #CryptoTrading #BinanceSquare #Alizbahcrypto #ProfitTargetHit
Alizbahcrypto
·
--
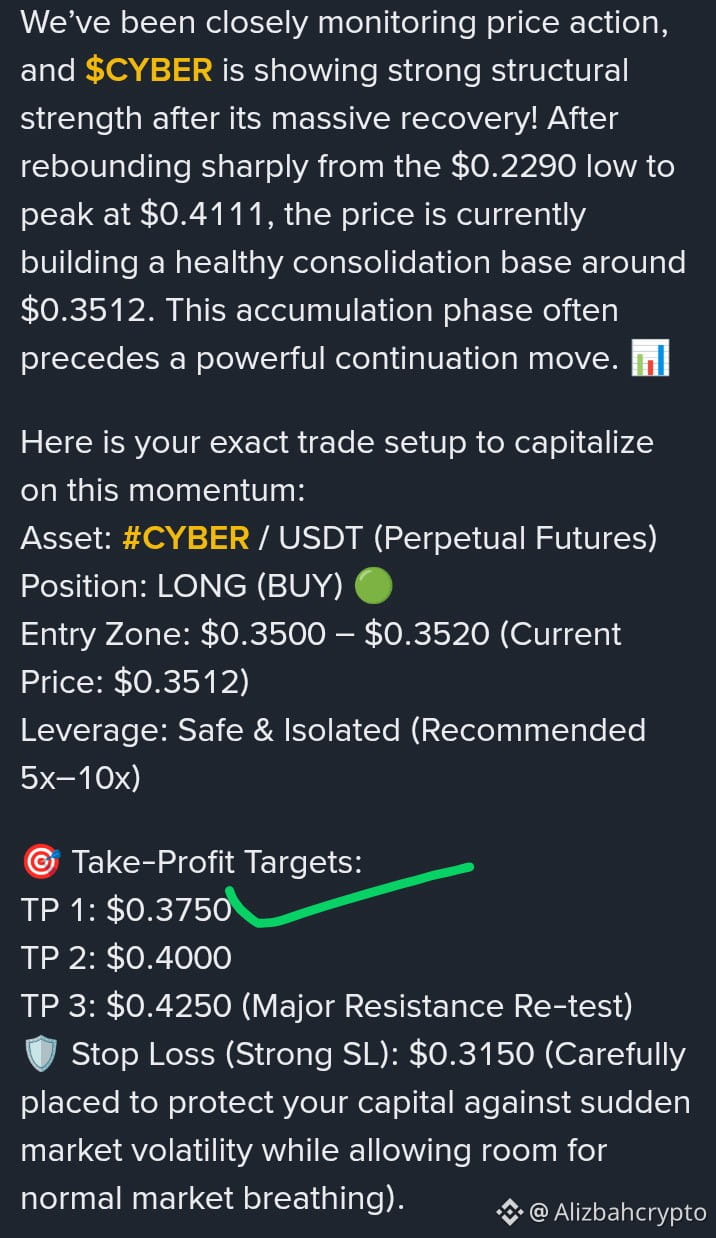
Bullish🔥 HIGH-POTENTIAL SETUP: $CYBER READY FOR THE NEXT LEG UP! 🚀
We’ve been closely monitoring price action, and $CYBER is showing strong structural strength after its massive recovery! After rebounding sharply from the $0.2290 low to peak at $0.4111, the price is currently building a healthy consolidation base around $0.3512. This accumulation phase often precedes a powerful continuation move. 📊
Here is your exact trade setup to capitalize on this momentum:
Asset: #CYBER / USDT (Perpetual Futures)
Position: LONG (BUY) 🟢
Entry Zone: $0.3500 – $0.3520 (Current Price: $0.3512)
Leverage: Safe & Isolated (Recommended 5x–10x)
🎯 Take-Profit Targets:
TP 1: $0.3750
TP 2: $0.4000
TP 3: $0.4250 (Major Resistance Re-test)
🛡️ Stop Loss (Strong SL): $0.3150 (Carefully placed to protect your capital against sudden market volatility while allowing room for normal market breathing).
💡 Market Insight: As long as we hold above the local support levels, the market structure remains favorable for a push back toward local highs. Always manage your risk strictly! 📉🔒
💬 Let’s discuss in the comments: Do you think $CYBER will smash past $0.40 today, or are you waiting for a deeper dip before entering? Drop your targets below! 👇✨
#CYBER #BinanceSquare #CryptoSignals #Altcoins
We’ve been closely monitoring price action, and $CYBER is showing strong structural strength after its massive recovery! After rebounding sharply from the $0.2290 low to peak at $0.4111, the price is currently building a healthy consolidation base around $0.3512. This accumulation phase often precedes a powerful continuation move. 📊
Here is your exact trade setup to capitalize on this momentum:
Asset: #CYBER / USDT (Perpetual Futures)
Position: LONG (BUY) 🟢
Entry Zone: $0.3500 – $0.3520 (Current Price: $0.3512)
Leverage: Safe & Isolated (Recommended 5x–10x)
🎯 Take-Profit Targets:
TP 1: $0.3750
TP 2: $0.4000
TP 3: $0.4250 (Major Resistance Re-test)
🛡️ Stop Loss (Strong SL): $0.3150 (Carefully placed to protect your capital against sudden market volatility while allowing room for normal market breathing).
💡 Market Insight: As long as we hold above the local support levels, the market structure remains favorable for a push back toward local highs. Always manage your risk strictly! 📉🔒
💬 Let’s discuss in the comments: Do you think $CYBER will smash past $0.40 today, or are you waiting for a deeper dip before entering? Drop your targets below! 👇✨
#CYBER #BinanceSquare #CryptoSignals #Altcoins
277

·
--
Bullish
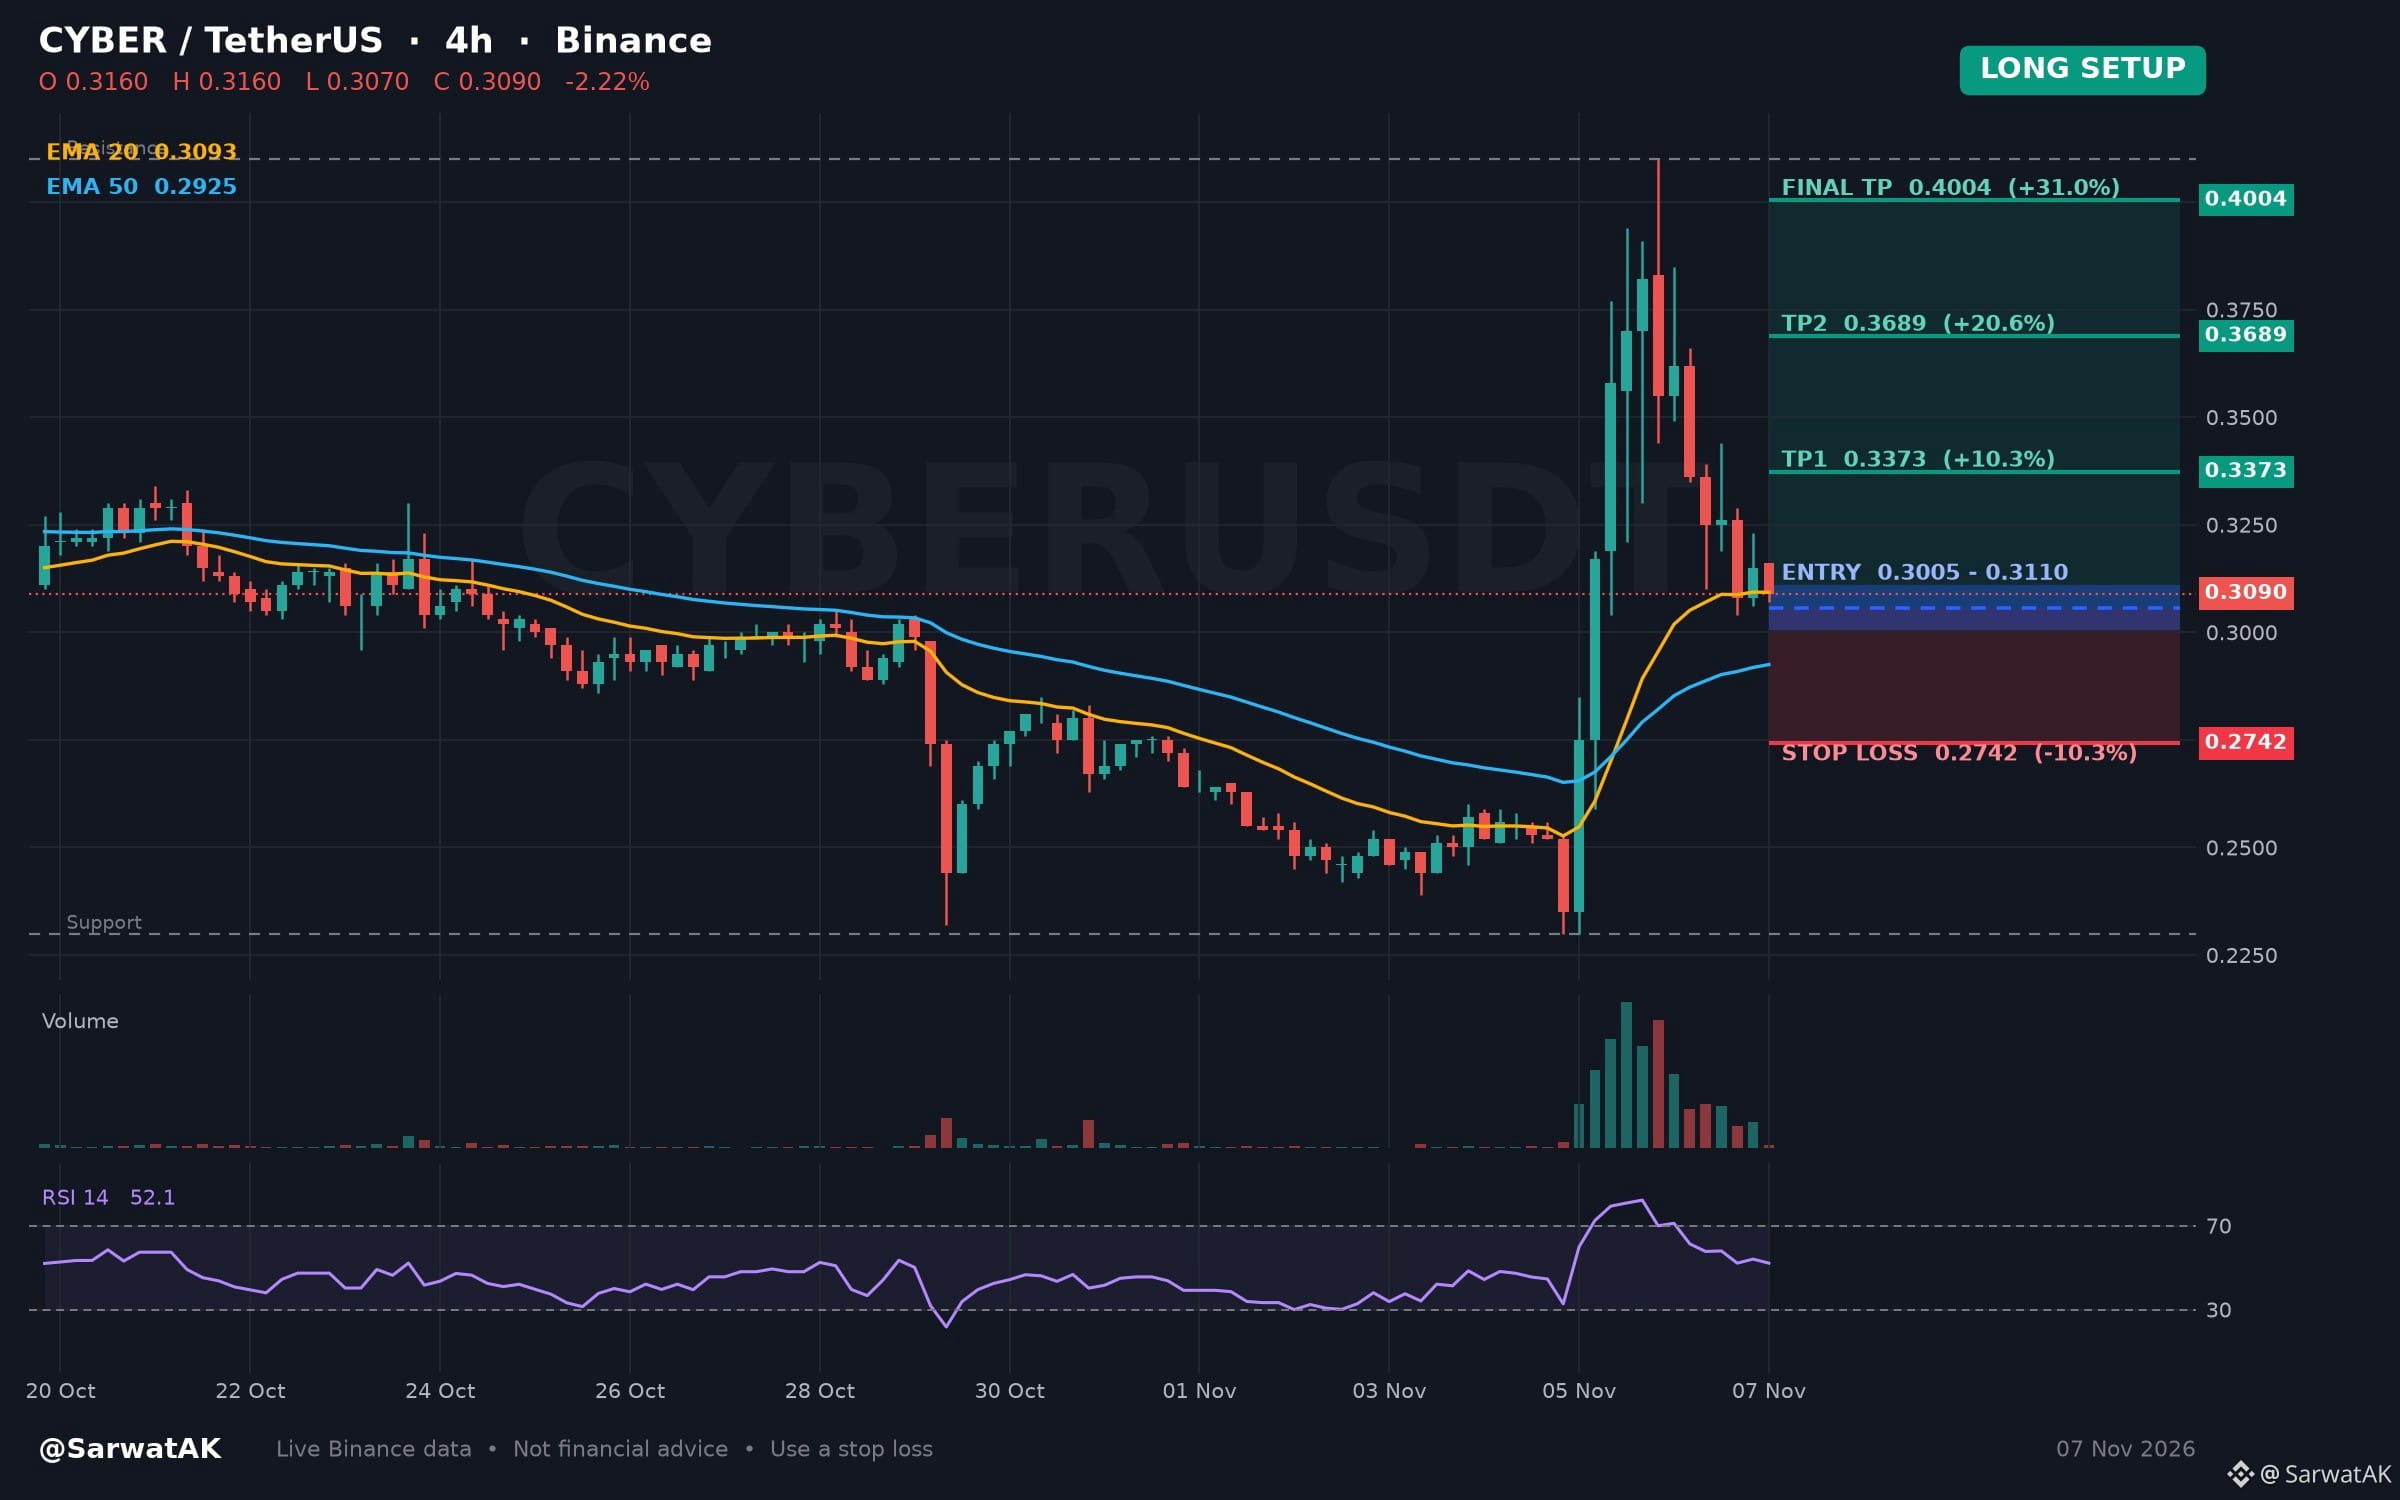
$CYBER LONG SETUP ... NEXT TARGET 0.4004
Exponential Moving Average Structure Holds Despite Recent Downward Pressure
Entry: 0.3005 - 0.3110 (Long)
TP1: 0.3373
TP2: 0.3689
Final TP: 0.4004
SL: 0.2742
Although price moved down over the past twenty-four hours, price remains above the aligned exponential moving averages. With the relative strength index in neutral territory on the four-hour chart, traders are watching whether market structure holds.
As long as 0.3005 holds, structure stays constructive
Must use stop loss while trading
Trade $CYBER
Not financial advice. Always DYOR.
Like & Follow for Daily Trade Analytics & Insider News. @SarwatAK
#CYBER #HotTrends #TradingSignals
{spot}(CYBERUSDT)
$CYBER LONG SETUP ... NEXT TARGET 0.4004
Exponential Moving Average Structure Holds Despite Recent Downward Pressure
Entry: 0.3005 - 0.3110 (Long)
TP1: 0.3373
TP2: 0.3689
Final TP: 0.4004
SL: 0.2742
Although price moved down over the past twenty-four hours, price remains above the aligned exponential moving averages. With the relative strength index in neutral territory on the four-hour chart, traders are watching whether market structure holds.
As long as 0.3005 holds, structure stays constructive
Must use stop loss while trading
Trade $CYBER
Not financial advice. Always DYOR.
Like & Follow for Daily Trade Analytics & Insider News. @SarwatAK
#CYBER #HotTrends #TradingSignals
Exponential Moving Average Structure Holds Despite Recent Downward Pressure
Entry: 0.3005 - 0.3110 (Long)
TP1: 0.3373
TP2: 0.3689
Final TP: 0.4004
SL: 0.2742
Although price moved down over the past twenty-four hours, price remains above the aligned exponential moving averages. With the relative strength index in neutral territory on the four-hour chart, traders are watching whether market structure holds.
As long as 0.3005 holds, structure stays constructive
Must use stop loss while trading
Trade $CYBER
Not financial advice. Always DYOR.
Like & Follow for Daily Trade Analytics & Insider News. @SarwatAK
#CYBER #HotTrends #TradingSignals
214

·
--
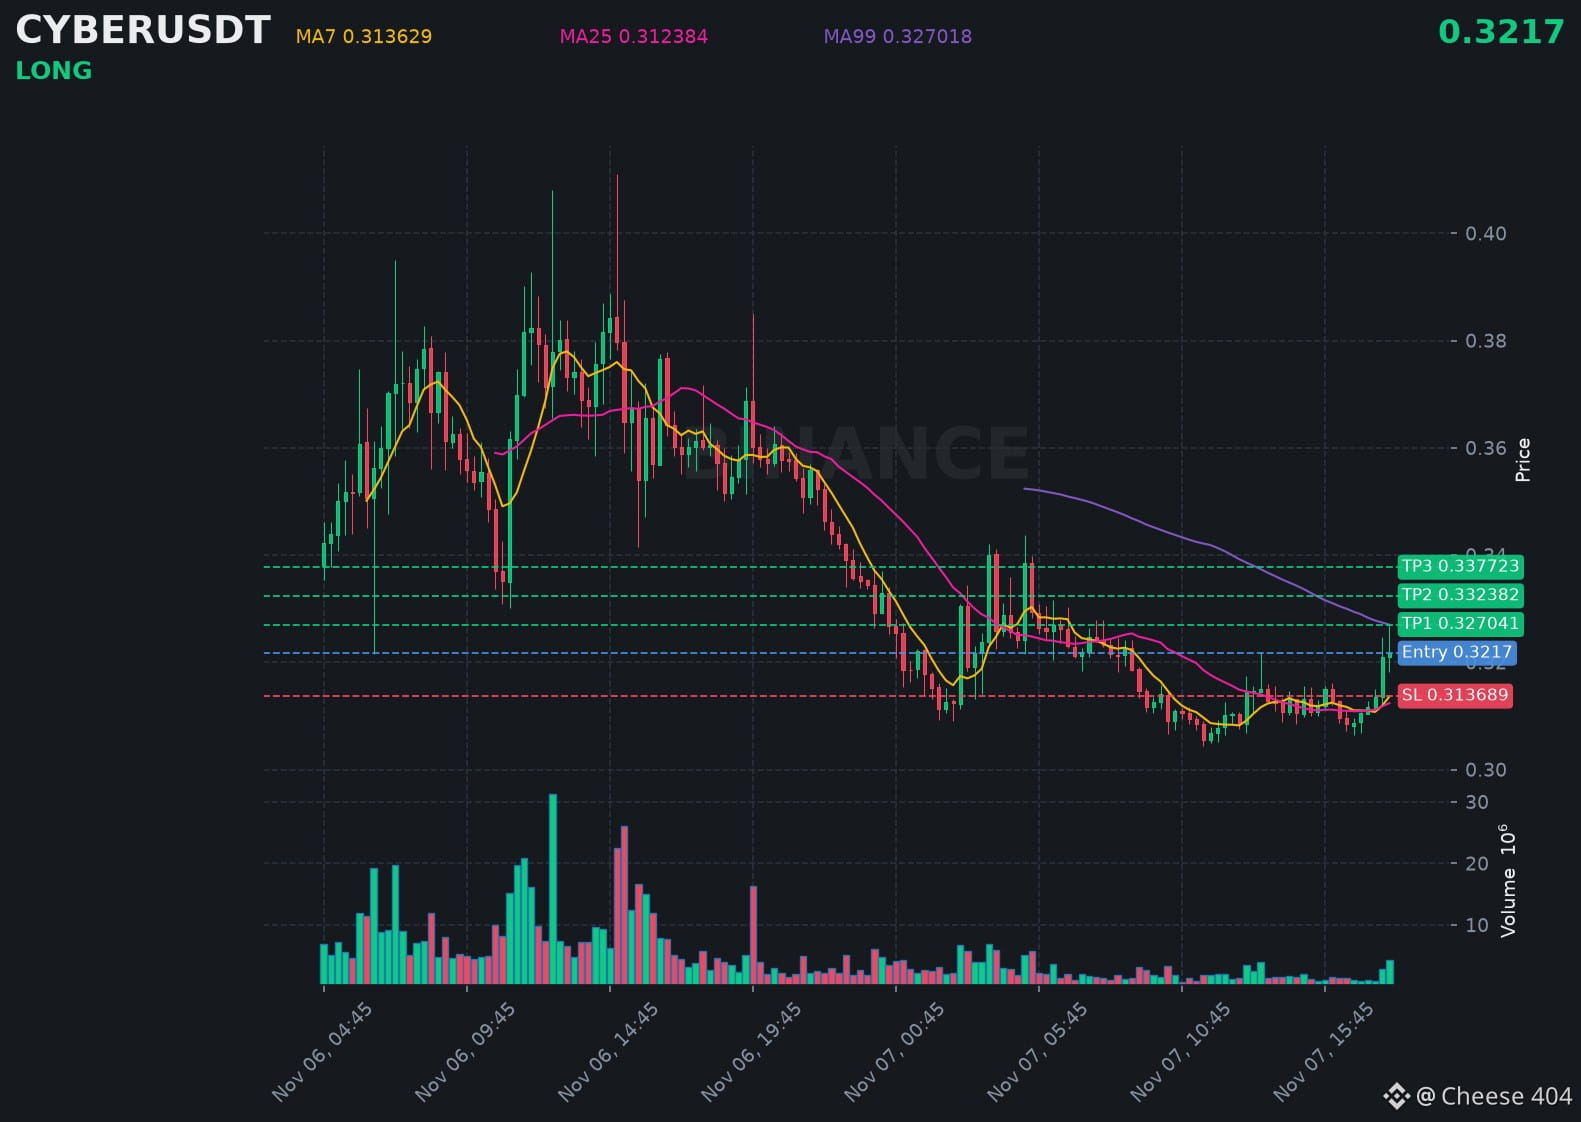
$CYBER looks primed to keep climbing, with bulls firmly in control of the trend.
📍 @ 0.3217 | Volume: 1.36M USD
RSI 64 | EMA20: 0.313533 USD
📈 Trade Plan:
📈 Entry: 0.320098 – 0.323302
🛑 Stop Loss: 0.313689
🎯 TP1: 0.327041
🎯 TP2: 0.332382
🎯 TP3: 0.337723
Waiting for a retest, then riding the uptrend.
👉 $CYBER 👈 Catch it
#CYBER
$CYBER looks primed to keep climbing, with bulls firmly in control of the trend.
📍 @ 0.3217 | Volume: 1.36M USD
RSI 64 | EMA20: 0.313533 USD
📈 Trade Plan:
📈 Entry: 0.320098 – 0.323302
🛑 Stop Loss: 0.313689
🎯 TP1: 0.327041
🎯 TP2: 0.332382
🎯 TP3: 0.337723
Waiting for a retest, then riding the uptrend.
👉 $CYBER 👈 Catch it
#CYBER
📍 @ 0.3217 | Volume: 1.36M USD
RSI 64 | EMA20: 0.313533 USD
📈 Trade Plan:
📈 Entry: 0.320098 – 0.323302
🛑 Stop Loss: 0.313689
🎯 TP1: 0.327041
🎯 TP2: 0.332382
🎯 TP3: 0.337723
Waiting for a retest, then riding the uptrend.
👉 $CYBER 👈 Catch it
#CYBER
218

·
--
$CYBER is under selling pressure!
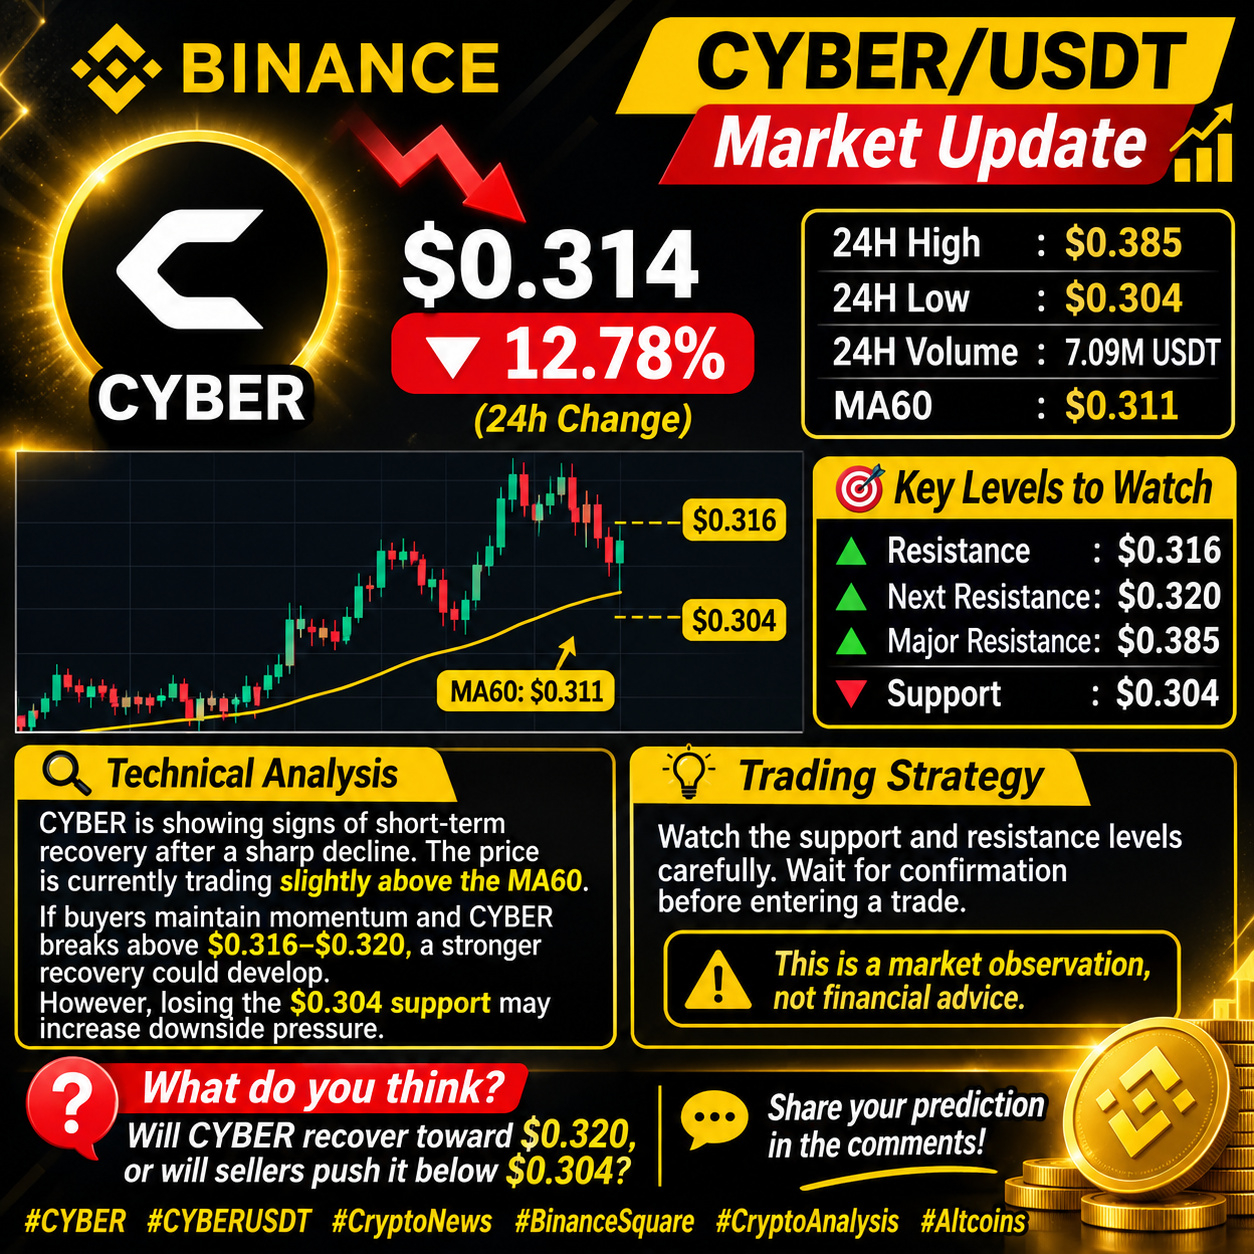
$CYBER is currently trading around $0.314, down approximately 12.78% in 24 hours.
📊 Market Overview
💰 Current Price: $0.314
📉 24H Change: -12.78%
🔺 24H High: $0.385
🔻 24H Low: $0.304
📊 24H Volume: 7.09M USDT
📈 MA60: $0.311
🎯 Key Levels to Watch
Support: $0.304
Resistance: $0.316
Next Resistance: $0.320
Major Resistance: $0.385
🔍 Technical Analysis: $CYBER is showing signs of short-term recovery after a sharp decline. The price is currently trading slightly above the MA60 on the 15-minute chart.
If buyers maintain momentum and CYBER breaks above $0.316–$0.320, a stronger recovery could develop.
However, losing the $0.304 support may increase downside pressure.
⚠️ Trading Strategy: Watch the support and resistance levels carefully. Wait for confirmation before entering a trade. This is a market observation, not financial advice.
👇 What do you think? Will CYBER recover toward $0.320, or will sellers push it below $0.304?
💬 Share your prediction in the comments!
#CYBER #CYBERUSDT #CryptoNews #BinanceSquare #CryptoAnalysis
{future}(CYBERUSDT)
$CYBER is under selling pressure!
$CYBER is currently trading around $0.314, down approximately 12.78% in 24 hours.
📊 Market Overview
💰 Current Price: $0.314
📉 24H Change: -12.78%
🔺 24H High: $0.385
🔻 24H Low: $0.304
📊 24H Volume: 7.09M USDT
📈 MA60: $0.311
🎯 Key Levels to Watch
Support: $0.304
Resistance: $0.316
Next Resistance: $0.320
Major Resistance: $0.385
🔍 Technical Analysis: $CYBER is showing signs of short-term recovery after a sharp decline. The price is currently trading slightly above the MA60 on the 15-minute chart.
If buyers maintain momentum and CYBER breaks above $0.316–$0.320, a stronger recovery could develop.
However, losing the $0.304 support may increase downside pressure.
⚠️ Trading Strategy: Watch the support and resistance levels carefully. Wait for confirmation before entering a trade. This is a market observation, not financial advice.
👇 What do you think? Will CYBER recover toward $0.320, or will sellers push it below $0.304?
💬 Share your prediction in the comments!
#CYBER #CYBERUSDT #CryptoNews #BinanceSquare #CryptoAnalysis
$CYBER is currently trading around $0.314, down approximately 12.78% in 24 hours.
📊 Market Overview
💰 Current Price: $0.314
📉 24H Change: -12.78%
🔺 24H High: $0.385
🔻 24H Low: $0.304
📊 24H Volume: 7.09M USDT
📈 MA60: $0.311
🎯 Key Levels to Watch
Support: $0.304
Resistance: $0.316
Next Resistance: $0.320
Major Resistance: $0.385
🔍 Technical Analysis: $CYBER is showing signs of short-term recovery after a sharp decline. The price is currently trading slightly above the MA60 on the 15-minute chart.
If buyers maintain momentum and CYBER breaks above $0.316–$0.320, a stronger recovery could develop.
However, losing the $0.304 support may increase downside pressure.
⚠️ Trading Strategy: Watch the support and resistance levels carefully. Wait for confirmation before entering a trade. This is a market observation, not financial advice.
👇 What do you think? Will CYBER recover toward $0.320, or will sellers push it below $0.304?
💬 Share your prediction in the comments!
#CYBER #CYBERUSDT #CryptoNews #BinanceSquare #CryptoAnalysis
266

·
--
🚨 $CYBER
{spot}(CYBERUSDT)
RECOVERY OR ANOTHER DUMP? 🔥
📅 November 7 Market Update
- Price: $0.324
- 24H Change: +1.54%
- Market Cap: $25.4M
- Volume: $156M
📊 KEY LEVELS:
- Support: $0.297
- Strong Support: $0.246
- Resistance: $0.343
- Next Target: $0.365–$0.387
🟢 Break above $0.343 = Bullish momentum.
🔴 Drop below $0.297 = More downside risk.
⚡ MY VIEW: Recovery is showing, but the overall trend remains bearish. Wait for breakout confirmation.
💬 CYBER: BUY, SELL OR WAIT?
⚠️ DYOR. Not financial advice.
#CYBER #crypto #altcoins #Binance
🚨 $CYBER
RECOVERY OR ANOTHER DUMP? 🔥
📅 November 7 Market Update
- Price: $0.324
- 24H Change: +1.54%
- Market Cap: $25.4M
- Volume: $156M
📊 KEY LEVELS:
- Support: $0.297
- Strong Support: $0.246
- Resistance: $0.343
- Next Target: $0.365–$0.387
🟢 Break above $0.343 = Bullish momentum.
🔴 Drop below $0.297 = More downside risk.
⚡ MY VIEW: Recovery is showing, but the overall trend remains bearish. Wait for breakout confirmation.
💬 CYBER: BUY, SELL OR WAIT?
⚠️ DYOR. Not financial advice.
#CYBER #crypto #altcoins #Binance
RECOVERY OR ANOTHER DUMP? 🔥
📅 November 7 Market Update
- Price: $0.324
- 24H Change: +1.54%
- Market Cap: $25.4M
- Volume: $156M
📊 KEY LEVELS:
- Support: $0.297
- Strong Support: $0.246
- Resistance: $0.343
- Next Target: $0.365–$0.387
🟢 Break above $0.343 = Bullish momentum.
🔴 Drop below $0.297 = More downside risk.
⚡ MY VIEW: Recovery is showing, but the overall trend remains bearish. Wait for breakout confirmation.
💬 CYBER: BUY, SELL OR WAIT?
⚠️ DYOR. Not financial advice.
#CYBER #crypto #altcoins #Binance

3
199

·
--
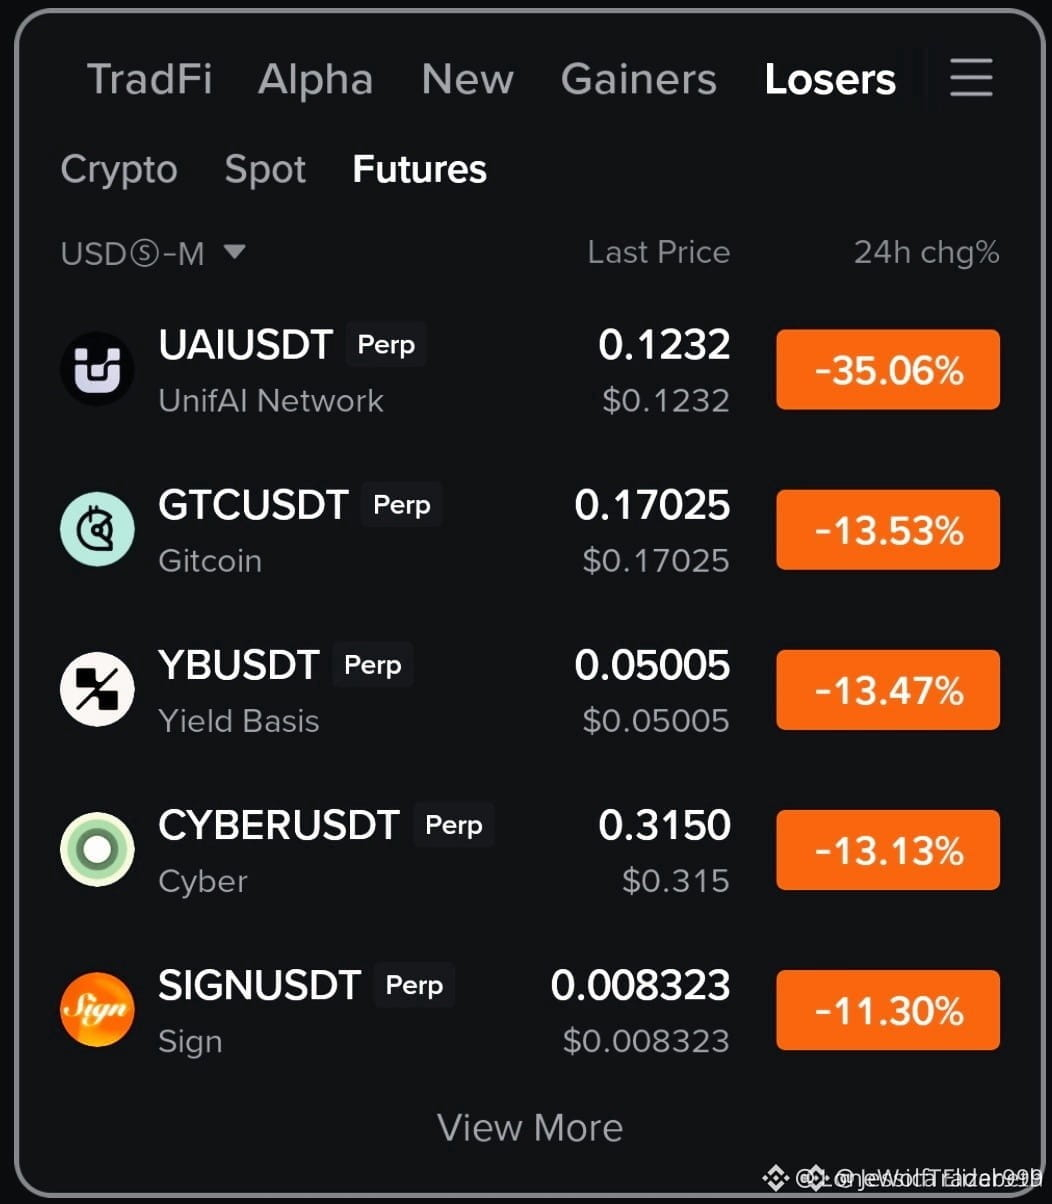
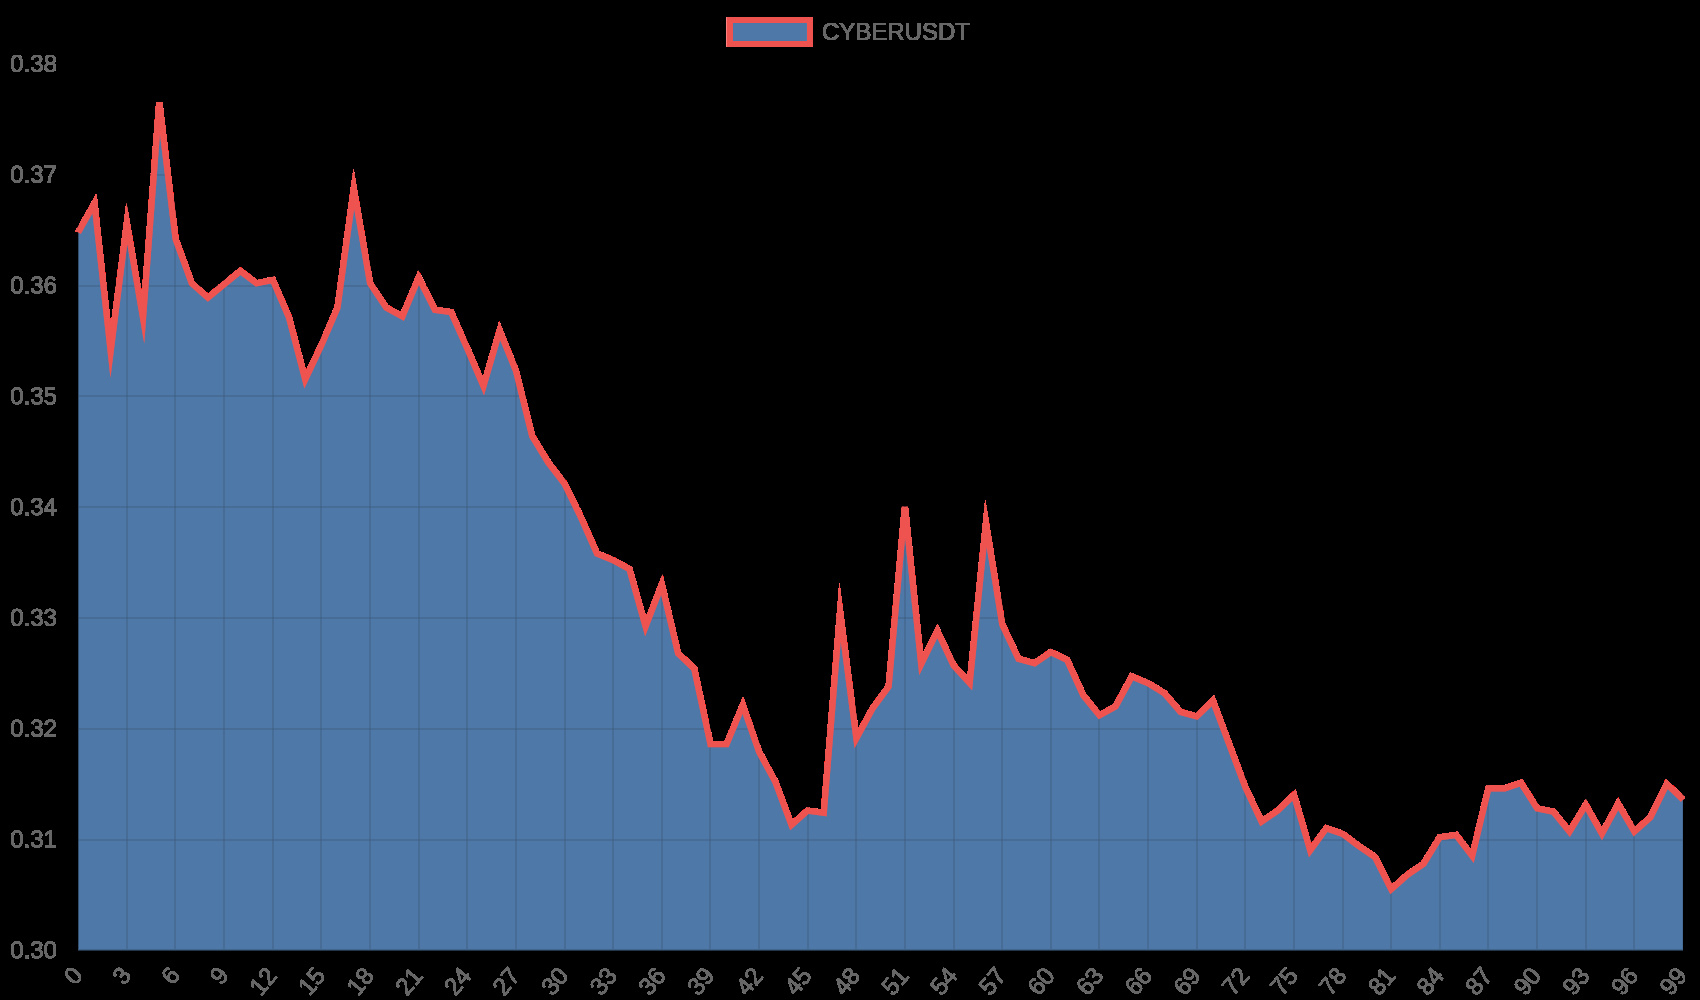
🔻 The altcoin bloodbath continues — PUMP, CYBER, and GTC all dumped 11-12% while BTC barely flinched. Classic alt rotation pain.
Why watch these three together? They're all mid/small-cap alts getting hammered in the same risk-off wave. When one dumps this hard, the others follow. Understanding the group dynamics tells you whether this is isolated weakness or sector-wide capitulation.
📉 PUMP ($0.003585 | -11.3%)
RSI on 4H sitting at 30.8 — flirting with oversold but not yet screaming reversal. MACD deeply negative with no bullish divergence. Declining volume on the dump means sellers aren't exhausted yet. The bounce trap is real here.
📉 CYBER ($0.315 | -12.3%)
Interesting case — 4H RSI at 53.7 looks neutral, but the daily chart tells a different story. Volume surged 1.95x on this candle, meaning real conviction behind the selling. When vol spikes on red candles, don't catch the knife too early.
📉 GTC ($0.1719 | -12.3%)
4H RSI at 29.7 — officially oversold. But oversold can stay oversold for days. Price is well below all major SMAs and the downtrend is intact. The only bullish case is a dead-cat bounce, not a reversal.
🎯 Trade Plans (all SHORT):
PUMP: Entry $0.003508–0.003662 | SL $0.003892 | TP $0.003403
CYBER: Entry $0.2944–0.3356 | SL $0.3974 | TP $0.2856
GTC: Entry $0.1663–0.1774 | SL $0.1941 | TP $0.1613
⚡ Key insight: All three have risk/reward below 1.0 — this is momentum trading, not value hunting. Get in, get out. Don't marry these positions.
Which one do you think bounces first? Or are they all going lower? 👇
#PUMP #CYBER #GTC
🔻 The altcoin bloodbath continues — PUMP, CYBER, and GTC all dumped 11-12% while BTC barely flinched. Classic alt rotation pain.
Why watch these three together? They're all mid/small-cap alts getting hammered in the same risk-off wave. When one dumps this hard, the others follow. Understanding the group dynamics tells you whether this is isolated weakness or sector-wide capitulation.
📉 PUMP ($0.003585 | -11.3%)
RSI on 4H sitting at 30.8 — flirting with oversold but not yet screaming reversal. MACD deeply negative with no bullish divergence. Declining volume on the dump means sellers aren't exhausted yet. The bounce trap is real here.
📉 CYBER ($0.315 | -12.3%)
Interesting case — 4H RSI at 53.7 looks neutral, but the daily chart tells a different story. Volume surged 1.95x on this candle, meaning real conviction behind the selling. When vol spikes on red candles, don't catch the knife too early.
📉 GTC ($0.1719 | -12.3%)
4H RSI at 29.7 — officially oversold. But oversold can stay oversold for days. Price is well below all major SMAs and the downtrend is intact. The only bullish case is a dead-cat bounce, not a reversal.
🎯 Trade Plans (all SHORT):
PUMP: Entry $0.003508–0.003662 | SL $0.003892 | TP $0.003403
CYBER: Entry $0.2944–0.3356 | SL $0.3974 | TP $0.2856
GTC: Entry $0.1663–0.1774 | SL $0.1941 | TP $0.1613
⚡ Key insight: All three have risk/reward below 1.0 — this is momentum trading, not value hunting. Get in, get out. Don't marry these positions.
Which one do you think bounces first? Or are they all going lower? 👇
#PUMP #CYBER #GTC
Why watch these three together? They're all mid/small-cap alts getting hammered in the same risk-off wave. When one dumps this hard, the others follow. Understanding the group dynamics tells you whether this is isolated weakness or sector-wide capitulation.
📉 PUMP ($0.003585 | -11.3%)
RSI on 4H sitting at 30.8 — flirting with oversold but not yet screaming reversal. MACD deeply negative with no bullish divergence. Declining volume on the dump means sellers aren't exhausted yet. The bounce trap is real here.
📉 CYBER ($0.315 | -12.3%)
Interesting case — 4H RSI at 53.7 looks neutral, but the daily chart tells a different story. Volume surged 1.95x on this candle, meaning real conviction behind the selling. When vol spikes on red candles, don't catch the knife too early.
📉 GTC ($0.1719 | -12.3%)
4H RSI at 29.7 — officially oversold. But oversold can stay oversold for days. Price is well below all major SMAs and the downtrend is intact. The only bullish case is a dead-cat bounce, not a reversal.
🎯 Trade Plans (all SHORT):
PUMP: Entry $0.003508–0.003662 | SL $0.003892 | TP $0.003403
CYBER: Entry $0.2944–0.3356 | SL $0.3974 | TP $0.2856
GTC: Entry $0.1663–0.1774 | SL $0.1941 | TP $0.1613
⚡ Key insight: All three have risk/reward below 1.0 — this is momentum trading, not value hunting. Get in, get out. Don't marry these positions.
Which one do you think bounces first? Or are they all going lower? 👇
#PUMP #CYBER #GTC
538


·
--
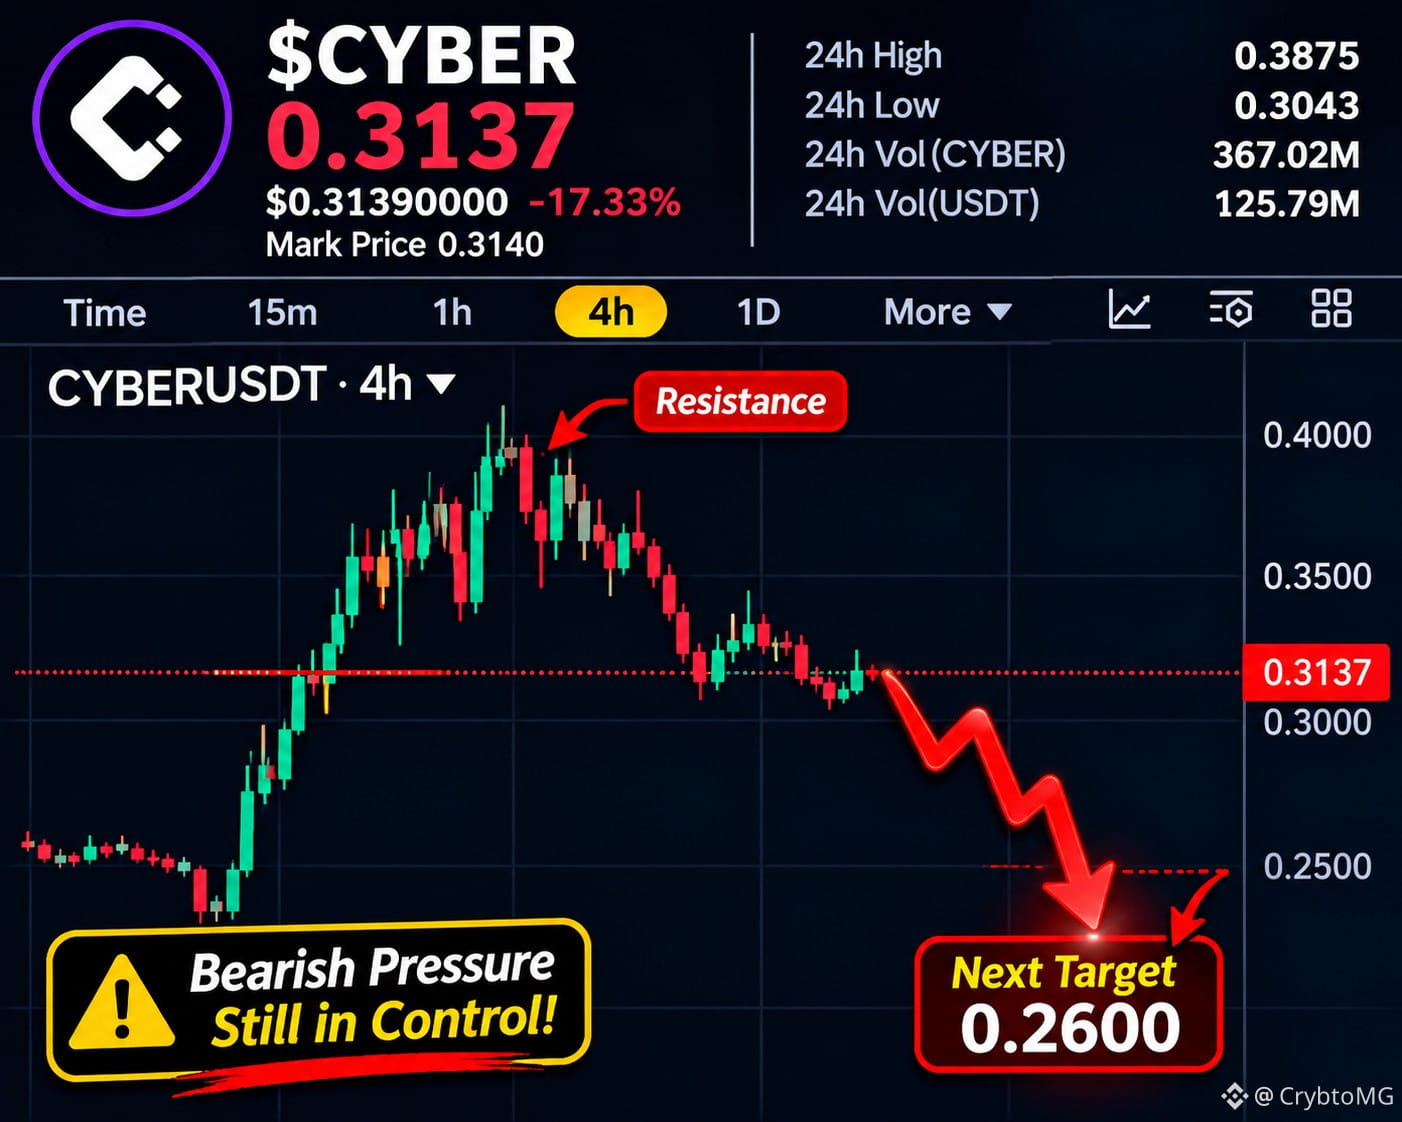
$CYBER – Watching for a Possible Pullback 👀
CYBER is showing signs worth monitoring, and I'm keeping an eye on its market structure.
A loss of support could increase selling pressure, but buyers may also step in and change the direction.
The next move will depend on how price reacts around key support levels.
No need to rush into leveraged positions. Patience and risk management matter.
Also watching $IDOL and $ONE .
What's your view on CYBER? Are sellers gaining control?
#CYBER #IDOL #ONE #CryptoMarket
$CYBER – Watching for a Possible Pullback 👀
CYBER is showing signs worth monitoring, and I'm keeping an eye on its market structure.
A loss of support could increase selling pressure, but buyers may also step in and change the direction.
The next move will depend on how price reacts around key support levels.
No need to rush into leveraged positions. Patience and risk management matter.
Also watching $IDOL and $ONE .
What's your view on CYBER? Are sellers gaining control?
#CYBER #IDOL #ONE #CryptoMarket
CYBER is showing signs worth monitoring, and I'm keeping an eye on its market structure.
A loss of support could increase selling pressure, but buyers may also step in and change the direction.
The next move will depend on how price reacts around key support levels.
No need to rush into leveraged positions. Patience and risk management matter.
Also watching $IDOL and $ONE .
What's your view on CYBER? Are sellers gaining control?
#CYBER #IDOL #ONE #CryptoMarket
1
849

·
--
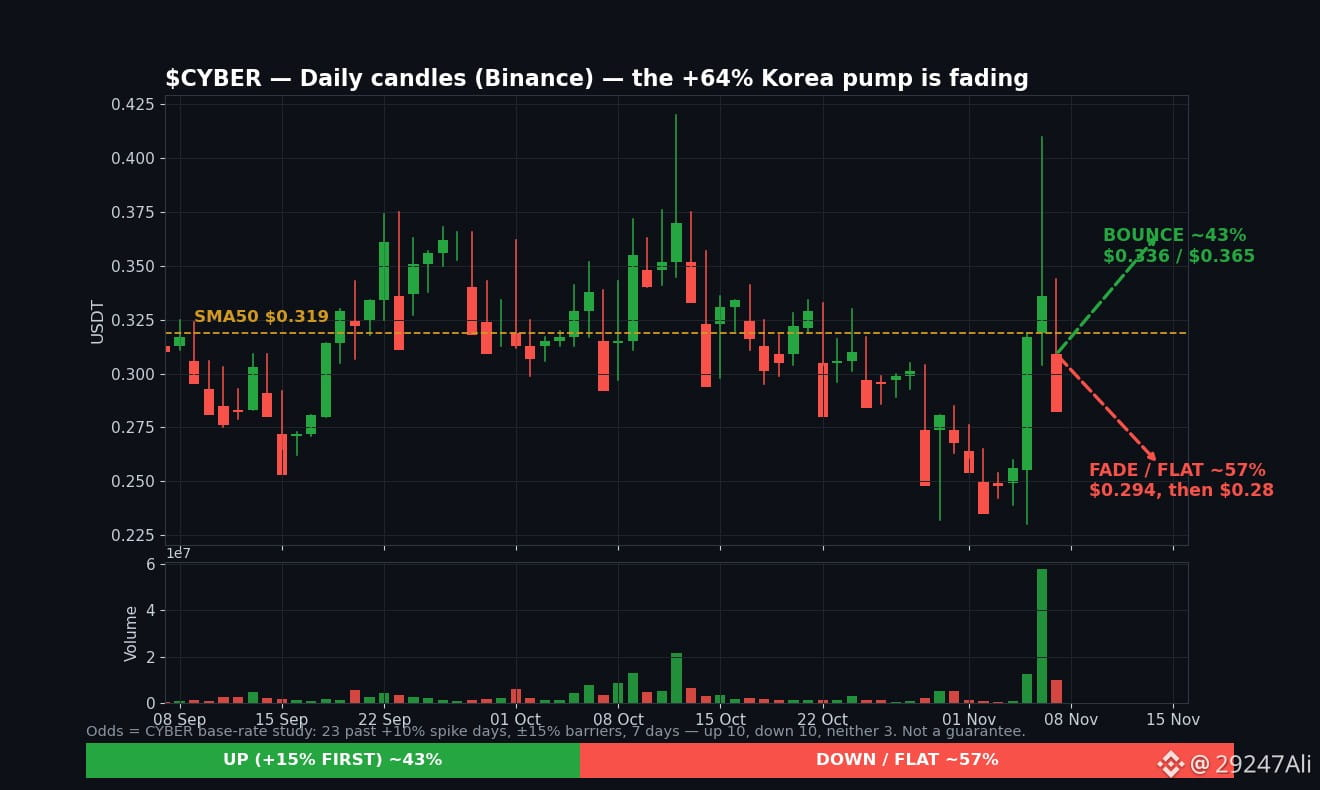
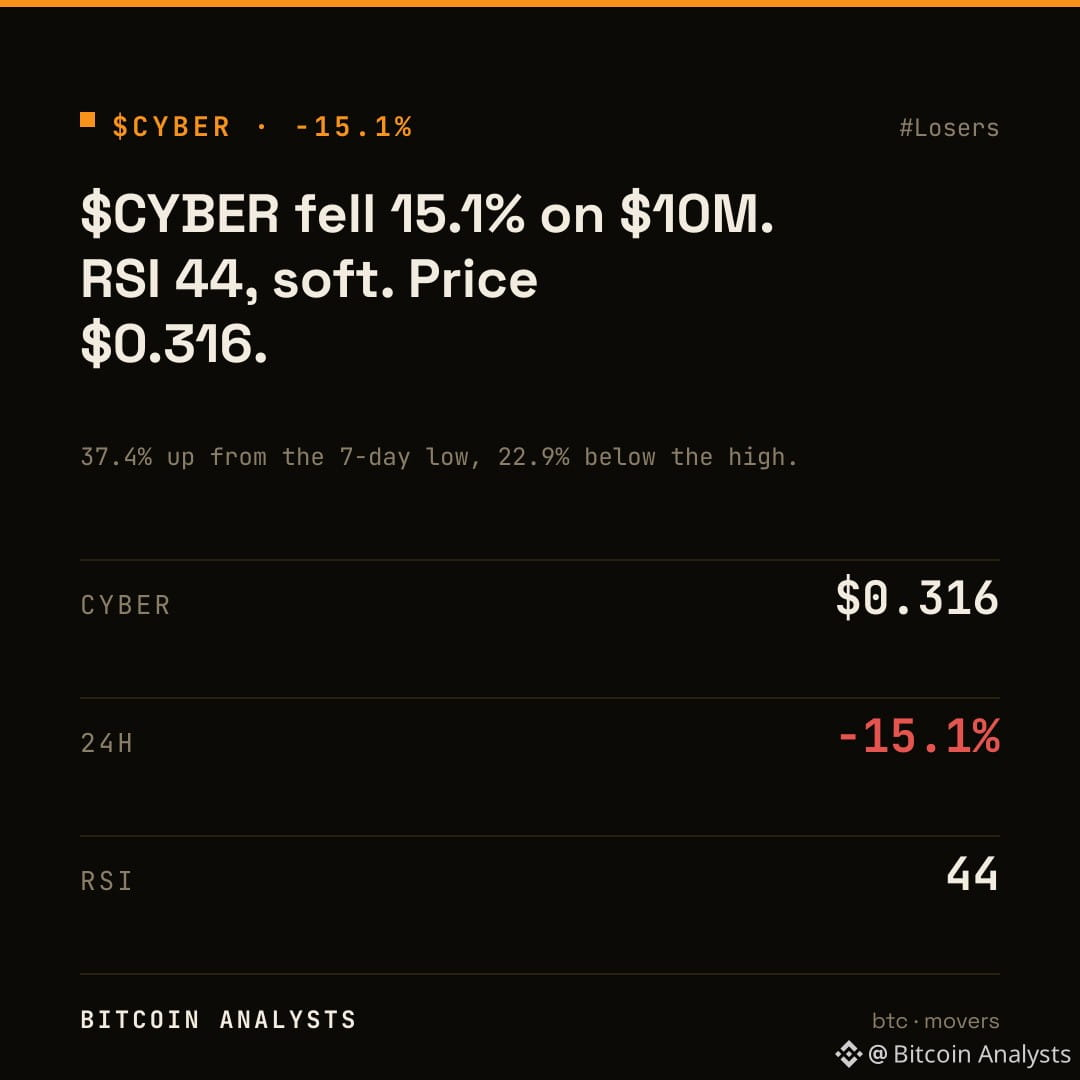
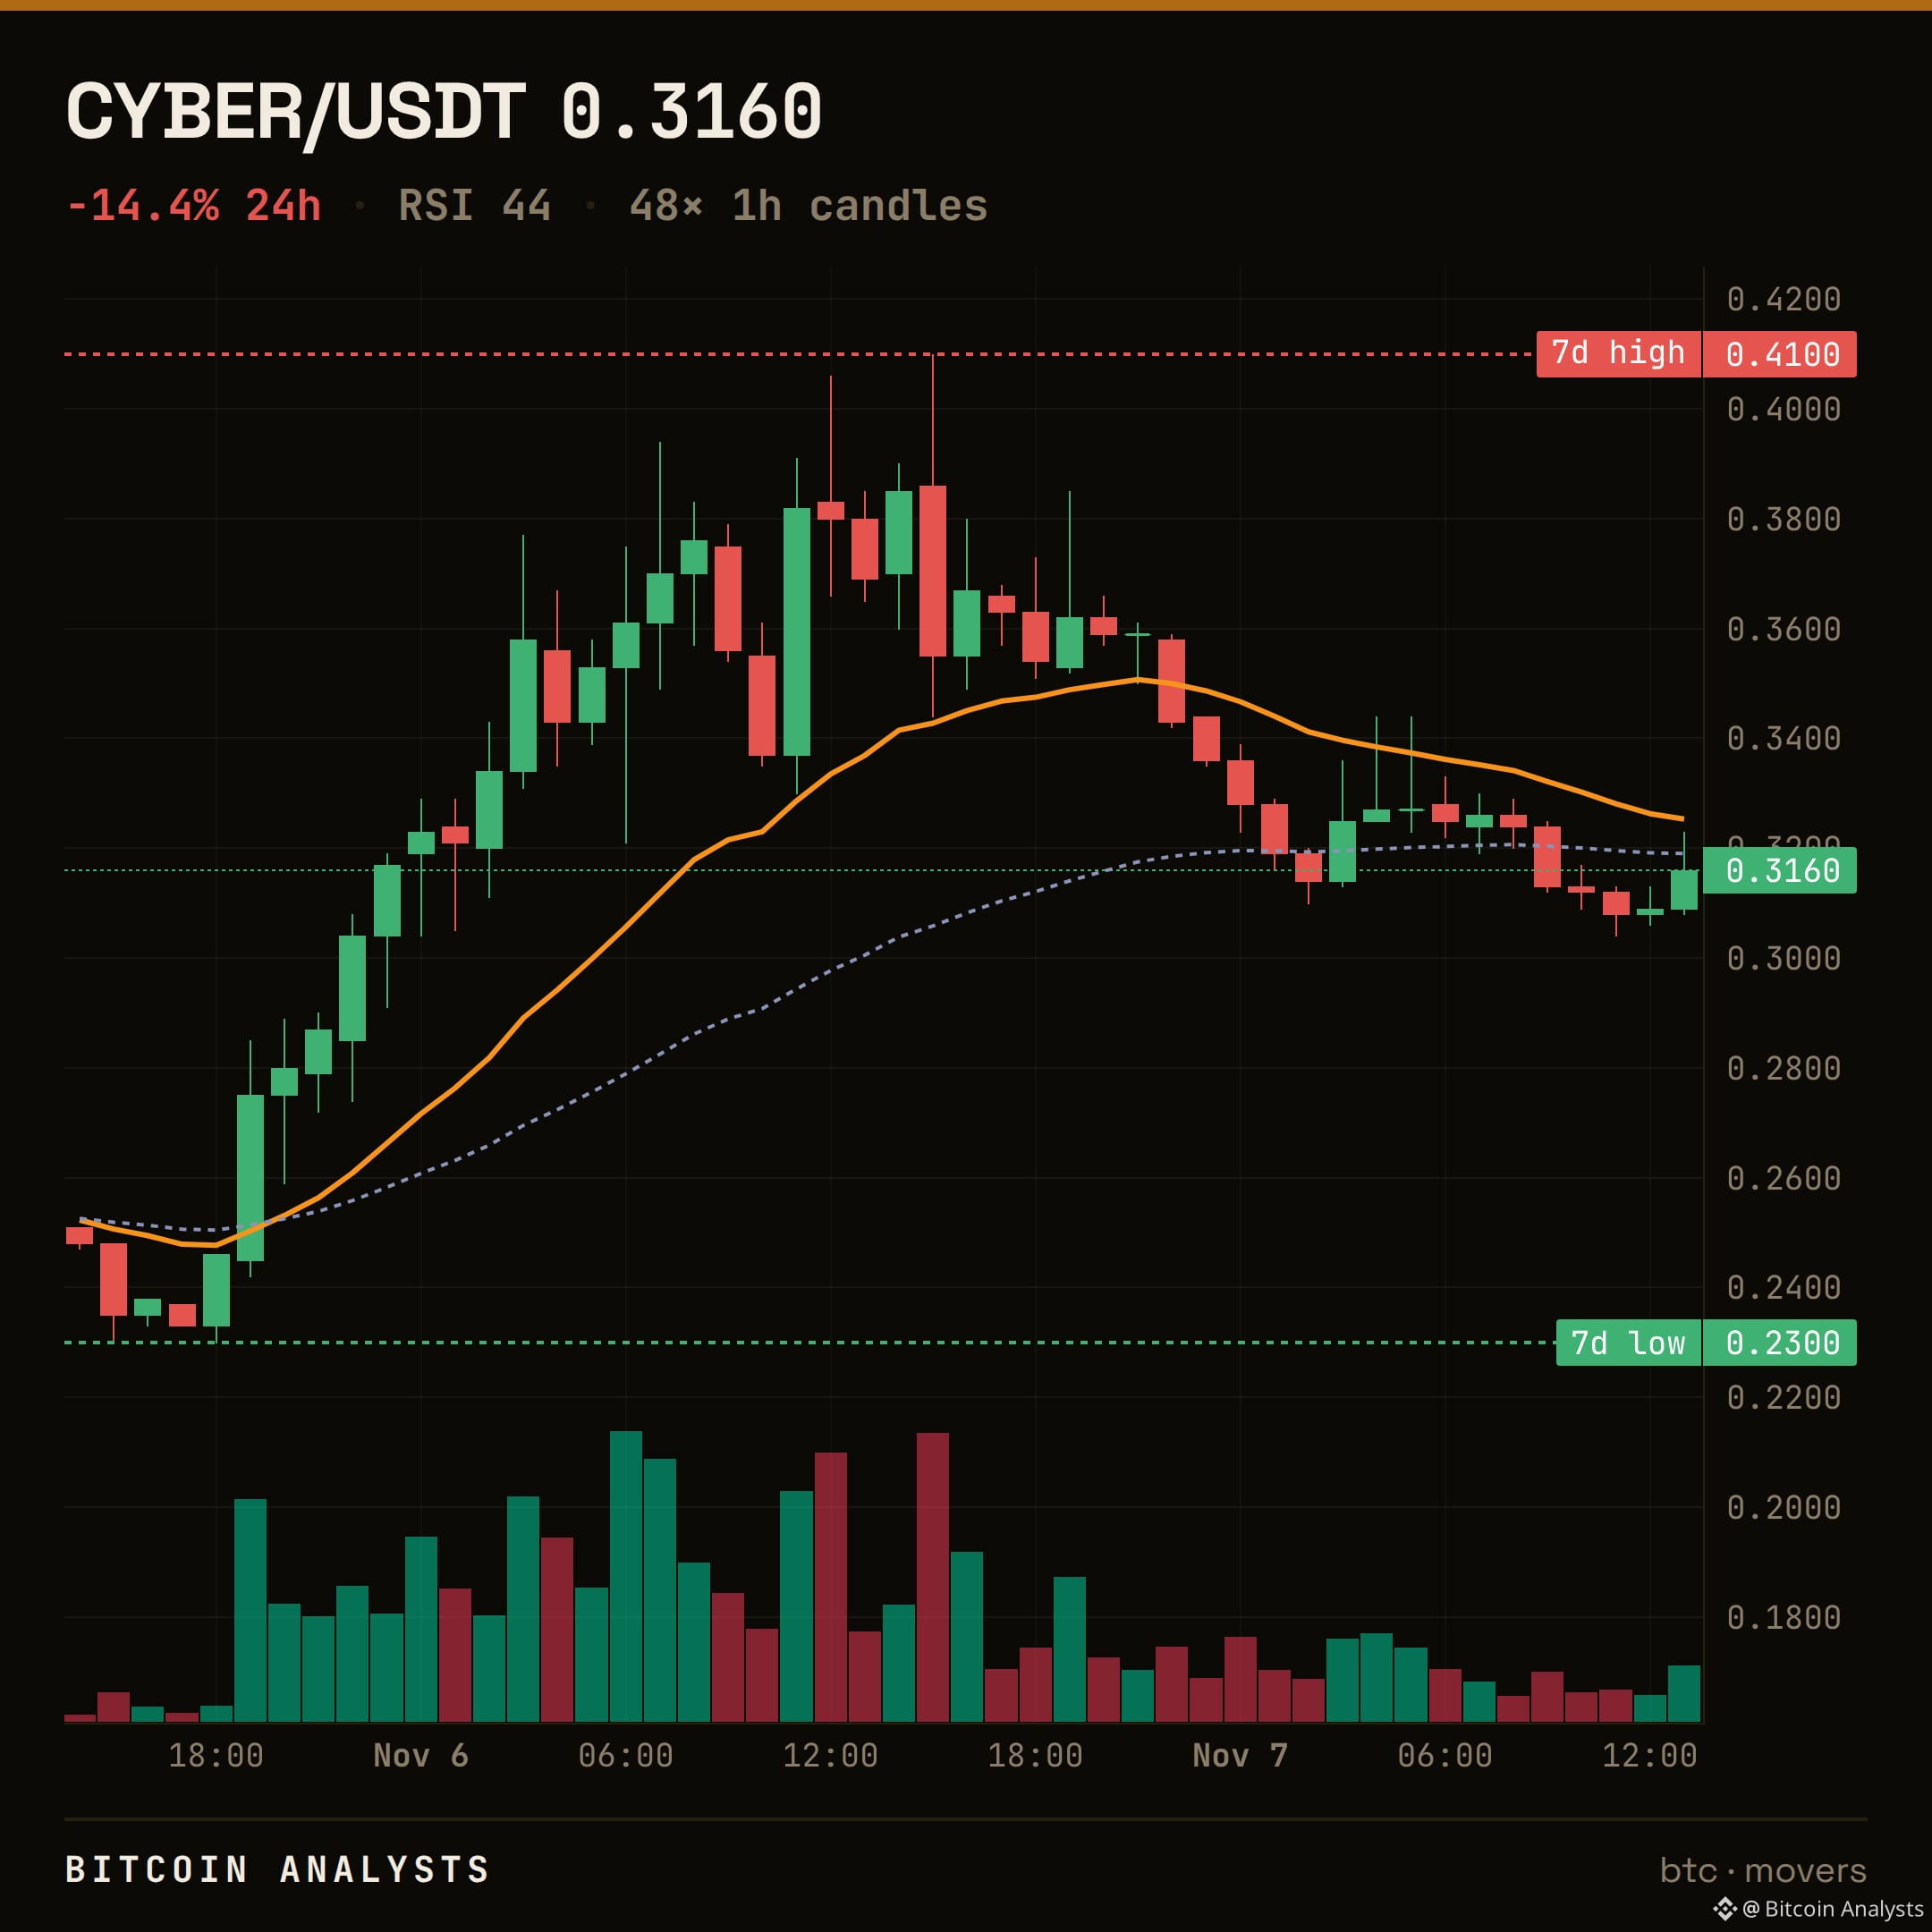
$CYBER Pumped +64% in Two Days — Now It Is Giving It Back
Two days ago CYBER was a forgotten $0.25 token. Then Korea found it.
📊 Snapshot (Binance, 7 Nov, ~15:45 PKT)
$CYBER $0.3100 | −12.2% in 24h | range $0.309–$0.410 | volume $13.5M (about 7x its 30-day average)
Market cap only ~$13M. All-time high $15.11 (Mar 2024) — still −98% below it.
🔥 What happened
After weeks of silence (daily volume under $0.2M), CYBER jumped +24% on 5 Nov, then spiked to $0.410 on 6 Nov — from $0.25 to $0.41 in two days — while topping CoinMarketCap's trending list in South Korea. No project announcement, no upgrade, no listing: an attention spike, not a fundamental one.
Today the fade: back to $0.310, and volume is already shrinking from yesterday's $20.8M peak.
⚠️ The structure now
Price sits below its 50-day average ($0.319) and 200-day ($0.365). The 20-day average ($0.294) is the last support under price, and daily RSI is back to 50 — the spike's momentum is spent. But this is still a $13M coin that can move 20% on a headline.
🎲 Odds from CYBER's own history (no options market exists)
After every past single-day spike of +10% or more — 23 episodes in 800 daily candles, de-clustered — the next 7 days hit +15% first 10 times (~43%), fell −15% first 10 times (~43%), and did neither 3 times (~13%). A coin flip, with a fade-or-flat lean of ~57%. Not a guarantee.
🎯 Plan
No knife-catching mid-fade, no chasing. Default: stand aside.
Bounce trade only if $0.294 holds on a daily close — tiny size, targets $0.336 → $0.365 → $0.410. Momentum returns only on a daily close above $0.336.
Invalidation: daily close below $0.280. Spot only. Confidence: Low — attention pump, no catalyst, fading volume.
Probabilities are historical base rates, not guarantees. Not financial advice. DYOR.
#CYBER #Altcoins #Crypto
$CYBER Pumped +64% in Two Days — Now It Is Giving It Back
Two days ago CYBER was a forgotten $0.25 token. Then Korea found it.
📊 Snapshot (Binance, 7 Nov, ~15:45 PKT)
$CYBER $0.3100 | −12.2% in 24h | range $0.309–$0.410 | volume $13.5M (about 7x its 30-day average)
Market cap only ~$13M. All-time high $15.11 (Mar 2024) — still −98% below it.
🔥 What happened
After weeks of silence (daily volume under $0.2M), CYBER jumped +24% on 5 Nov, then spiked to $0.410 on 6 Nov — from $0.25 to $0.41 in two days — while topping CoinMarketCap's trending list in South Korea. No project announcement, no upgrade, no listing: an attention spike, not a fundamental one.
Today the fade: back to $0.310, and volume is already shrinking from yesterday's $20.8M peak.
⚠️ The structure now
Price sits below its 50-day average ($0.319) and 200-day ($0.365). The 20-day average ($0.294) is the last support under price, and daily RSI is back to 50 — the spike's momentum is spent. But this is still a $13M coin that can move 20% on a headline.
🎲 Odds from CYBER's own history (no options market exists)
After every past single-day spike of +10% or more — 23 episodes in 800 daily candles, de-clustered — the next 7 days hit +15% first 10 times (~43%), fell −15% first 10 times (~43%), and did neither 3 times (~13%). A coin flip, with a fade-or-flat lean of ~57%. Not a guarantee.
🎯 Plan
No knife-catching mid-fade, no chasing. Default: stand aside.
Bounce trade only if $0.294 holds on a daily close — tiny size, targets $0.336 → $0.365 → $0.410. Momentum returns only on a daily close above $0.336.
Invalidation: daily close below $0.280. Spot only. Confidence: Low — attention pump, no catalyst, fading volume.
Probabilities are historical base rates, not guarantees. Not financial advice. DYOR.
#CYBER #Altcoins #Crypto
Two days ago CYBER was a forgotten $0.25 token. Then Korea found it.
📊 Snapshot (Binance, 7 Nov, ~15:45 PKT)
$CYBER $0.3100 | −12.2% in 24h | range $0.309–$0.410 | volume $13.5M (about 7x its 30-day average)
Market cap only ~$13M. All-time high $15.11 (Mar 2024) — still −98% below it.
🔥 What happened
After weeks of silence (daily volume under $0.2M), CYBER jumped +24% on 5 Nov, then spiked to $0.410 on 6 Nov — from $0.25 to $0.41 in two days — while topping CoinMarketCap's trending list in South Korea. No project announcement, no upgrade, no listing: an attention spike, not a fundamental one.
Today the fade: back to $0.310, and volume is already shrinking from yesterday's $20.8M peak.
⚠️ The structure now
Price sits below its 50-day average ($0.319) and 200-day ($0.365). The 20-day average ($0.294) is the last support under price, and daily RSI is back to 50 — the spike's momentum is spent. But this is still a $13M coin that can move 20% on a headline.
🎲 Odds from CYBER's own history (no options market exists)
After every past single-day spike of +10% or more — 23 episodes in 800 daily candles, de-clustered — the next 7 days hit +15% first 10 times (~43%), fell −15% first 10 times (~43%), and did neither 3 times (~13%). A coin flip, with a fade-or-flat lean of ~57%. Not a guarantee.
🎯 Plan
No knife-catching mid-fade, no chasing. Default: stand aside.
Bounce trade only if $0.294 holds on a daily close — tiny size, targets $0.336 → $0.365 → $0.410. Momentum returns only on a daily close above $0.336.
Invalidation: daily close below $0.280. Spot only. Confidence: Low — attention pump, no catalyst, fading volume.
Probabilities are historical base rates, not guarantees. Not financial advice. DYOR.
#CYBER #Altcoins #Crypto
324
·
--
Bearish
CYBER longs just got caught around $0.31875.
The downside sweep is putting pressure on buyers.
$CYBER
{future}(CYBERUSDT)
$LYN
{future}(LYNUSDT)
$AIN
{future}(AINUSDT)
🔴 LIQUIDITY ZONE HIT 🔴
Long liquidation spotted 🧨
$1.3082K cleared at $0.31875
Downside liquidity swept — watch reaction 👀
🎯 TP Targets:
TP1: ~$0.317156
TP2: ~$0.315563
TP3: ~$0.313969
#CYBER
CYBER longs just got caught around $0.31875.
The downside sweep is putting pressure on buyers.
$CYBER
$LYN
$AIN
🔴 LIQUIDITY ZONE HIT 🔴
Long liquidation spotted 🧨
$1.3082K cleared at $0.31875
Downside liquidity swept — watch reaction 👀
🎯 TP Targets:
TP1: ~$0.317156
TP2: ~$0.315563
TP3: ~$0.313969
#CYBER
The downside sweep is putting pressure on buyers.
$CYBER
$LYN
$AIN
🔴 LIQUIDITY ZONE HIT 🔴
Long liquidation spotted 🧨
$1.3082K cleared at $0.31875
Downside liquidity swept — watch reaction 👀
🎯 TP Targets:
TP1: ~$0.317156
TP2: ~$0.315563
TP3: ~$0.313969
#CYBER
15

Log in to explore more content
Join global crypto users on Binance Square
⚡️ Get latest and useful information about crypto.
💬 Trusted by the world’s largest crypto exchange.
👍 Discover real insights from verified creators.
Email / Phone number
Trending Topics
1
#BitcoinFiveWeeklyLosses
153 views
77 Discussing
2
#AIChipSlumpNasdaq
24 views
49 Discussing
3
#BinanceReopensWithdrawalsForHYPE&APT
137,920 views
1,117 Discussing
4
#SouthKoreaDraftLawTargets15To20%ShareholderCap
137,316 views
744 Discussing
5
#TradFiForBeginners
214,124 views
1,972 Discussing
6
#KeplrAdvisesSocialLoginUsersToTransferAssets
64,948 views
564 Discussing
7
#TetherPlans€28.8MForJuventusCapitalIncrease
50,252 views
431 Discussing
8
#JobsReportRaisesHikeOdds
947,662 views
4,520 Discussing
9
#CPITestsDecemberRateOutlook
413,709 views
1,950 Discussing
10
#US Data Center Rules May Constrain AI Expansion
145,101 views
261 Discussing