Binance Square
#bitcoinprice

bitcoinprice

1.5M views
2,237 Discussing
MarketPilot01
·
--
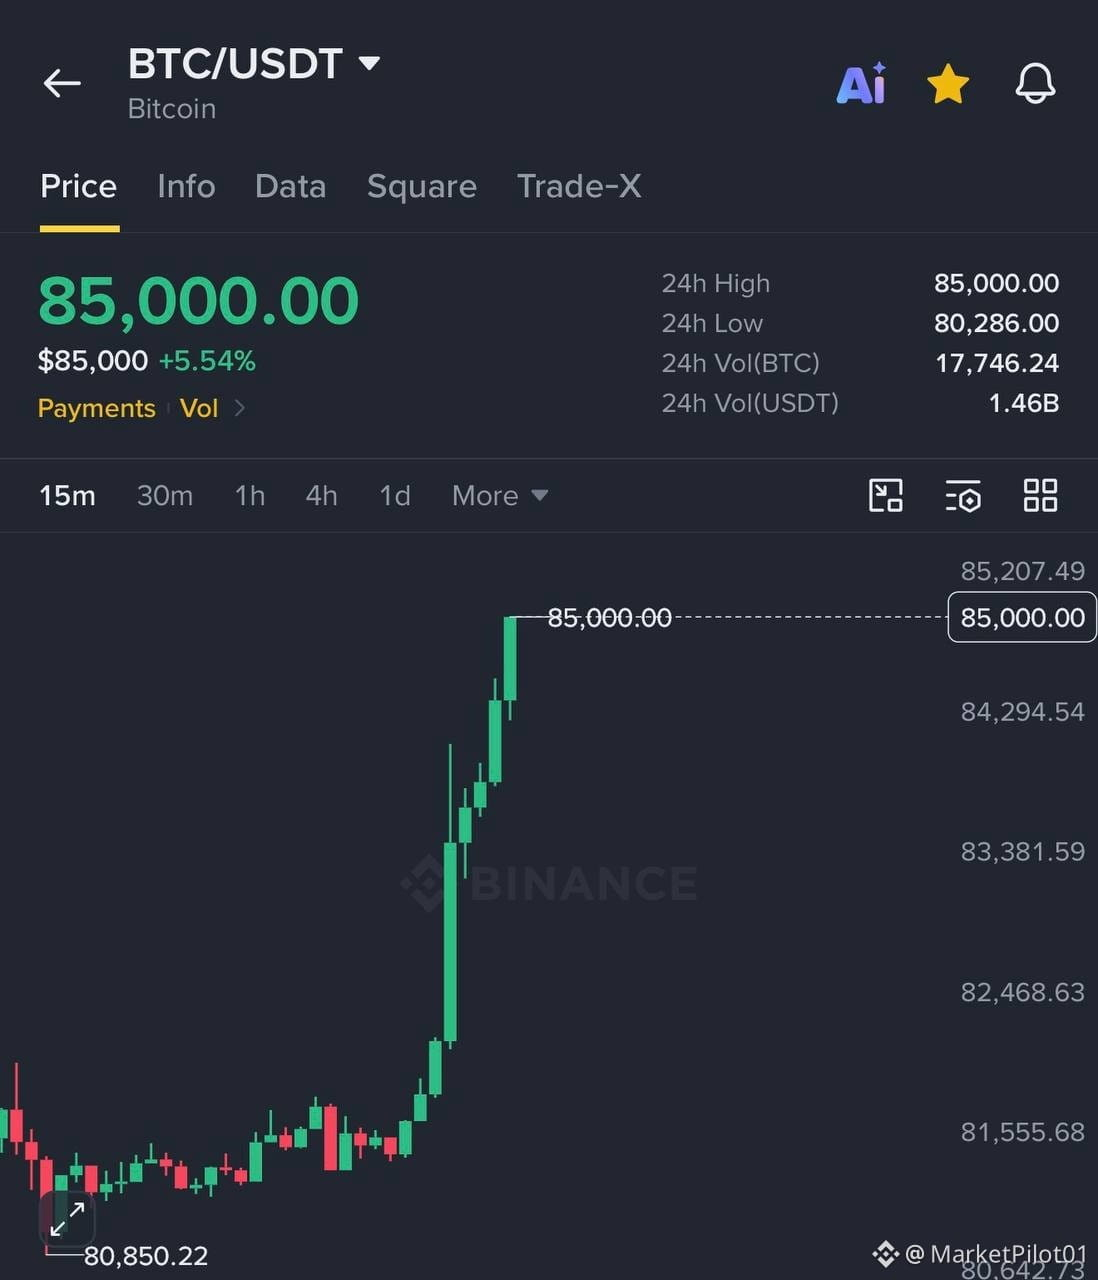
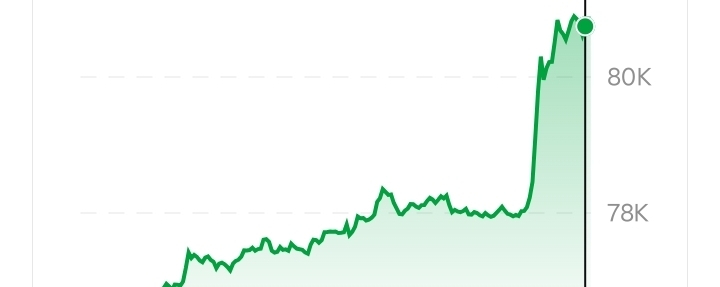
🚨 BITCOIN JUST BROKE $85,000! For the first time in nearly 8 months, $BTC has pushed above the $85K level after reclaiming $80K. Momentum is building fast. 🔥 Now the key level to watch is $85K. If Bitcoin can hold it as support, attention could quickly turn toward the $90K psychological level. The market is waking up again. 👀 BTC: $85,570.99 (+4.91%) #Bitcoin #BTC #Crypto #BitcoinPrice
🚨 BITCOIN JUST BROKE $85,000!

For the first time in nearly 8 months, $BTC has pushed above the $85K level after reclaiming $80K.

Momentum is building fast. 🔥

Now the key level to watch is $85K. If Bitcoin can hold it as support, attention could quickly turn toward the $90K psychological level.

The market is waking up again. 👀

BTC: $85,570.99 (+4.91%)

#Bitcoin #BTC #Crypto #BitcoinPrice
·
--
Bullish
🚨 Bitcoin (BTC) Latest News — September 22, 2026 📈 Bitcoin has recently surged above the $86,000–$87,000 level, reaching its highest level since January. 💥 Around $648 million in crypto short positions were liquidated during the rally, adding further buying pressure. 🏦 U.S. Spot Bitcoin ETFs recorded approximately $68.1 million in net inflows on September 21, marking the third consecutive day of inflows. 🇷🇺 Russia’s Moscow Exchange is also launching Bitcoin-linked perpetual futures, available to qualified investors. These products are cash-settled and do not involve directly buying BTC. 📊 Bitcoin’s rally is also happening alongside strong performance in U.S. technology and AI stocks. 🎯 Market Watch: Bitcoin is showing strong momentum, with the $90,000 level attracting attention. However, crypto remains highly volatile, so a pullback is always possible. #Bitcoin #BTC #crypto #BitcoinNews #BTCUSD #Bitcoinprice #cryptocurrency
🚨 Bitcoin (BTC) Latest News — September 22, 2026

📈 Bitcoin has recently surged above the $86,000–$87,000 level, reaching its highest level since January.

💥 Around $648 million in crypto short positions were liquidated during the rally, adding further buying pressure.

🏦 U.S. Spot Bitcoin ETFs recorded approximately $68.1 million in net inflows on September 21, marking the third consecutive day of inflows.

🇷🇺 Russia’s Moscow Exchange is also launching Bitcoin-linked perpetual futures, available to qualified investors. These products are cash-settled and do not involve directly buying BTC.

📊 Bitcoin’s rally is also happening alongside strong performance in U.S. technology and AI stocks.

🎯 Market Watch: Bitcoin is showing strong momentum, with the $90,000 level attracting attention. However, crypto remains highly volatile, so a pullback is always possible.

#Bitcoin #BTC #crypto #BitcoinNews #BTCUSD #Bitcoinprice #cryptocurrency
·
--
Bullish
·
--
Bullish
🚨 $BTC IS TESTING KEY RESISTANCE AGAIN! 🔥 {spot}(BTCUSDT) Bitcoin is making its third attempt at the same resistance zone. 👀 A clean breakout could signal that the current range is finally coming to an end. 📈 Potential $BTC Setup: 🎯 Entry: $80,600 – $81,900 🛑 Stop Loss: $79,900 🎯 Targets: $82,000 → $84,000 → $86,000 💰 Reports suggest around $100M in BTC sell orders are sitting between the current price and the first higher-high zone. Will the bulls finally break through? 🚀👀 #BTC #Bitcoin #Crypto #CryptoTrading #Bullish #BitcoinPrice #BTCUSD #Trading
🚨 $BTC IS TESTING KEY RESISTANCE AGAIN! 🔥


Bitcoin is making its third attempt at the same resistance zone. 👀
A clean breakout could signal that the current range is finally coming to an end.

📈 Potential $BTC Setup:
🎯 Entry: $80,600 – $81,900
🛑 Stop Loss: $79,900
🎯 Targets: $82,000 → $84,000 → $86,000

💰 Reports suggest around $100M in BTC sell orders are sitting between the current price and the first higher-high zone.

Will the bulls finally break through? 🚀👀

#BTC #Bitcoin #Crypto #CryptoTrading #Bullish #BitcoinPrice #BTCUSD #Trading
·
--
Bullish
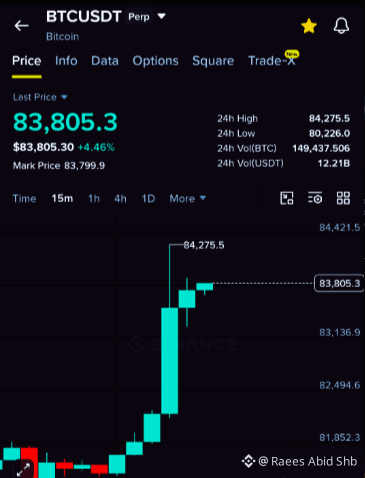
Bitcoin is showing strong momentum today, with $BTC /USDT trading around $84,026, up roughly 4.55% on the day. The chart shows a sharp breakout from the $82K-$83K area, followed by consolidation near the $84K level. Trading volume also spiked during the move, suggesting increased market activity. 📊 Key levels from the chart: * 🔥 Current price: ~$84,026 * 📈 24H high: $84,174 * 🟢 24H low: $80,286 * 📌 MA60: ~$83,581 * 🎯 Immediate resistance: $84,174-$84,200 * 🛡️ Near support: $83,600 * ⚠️ Deeper support: $82,000-$82,400 One important point is that BTC is currently trading above the MA60, which indicates short-term momentum has strengthened. However, the price is also approaching the recent high around $84.2K, so whether Bitcoin can hold above this zone will be worth watching. If $BTC breaks and sustains above the recent high, traders may look for further upside. If the breakout fails, a pullback toward the moving average or previous consolidation area could occur. Bitcoin is moving fast. The next few candles could be important. 👀 #Crypto #BTCUSDT #CryptoTrading #Write2Earn #BitcoinPrice
Bitcoin is showing strong momentum today, with $BTC /USDT trading around $84,026, up roughly 4.55% on the day.

The chart shows a sharp breakout from the $82K-$83K area, followed by consolidation near the $84K level. Trading volume also spiked during the move, suggesting increased market activity.

📊 Key levels from the chart:

* 🔥 Current price: ~$84,026
* 📈 24H high: $84,174
* 🟢 24H low: $80,286
* 📌 MA60: ~$83,581
* 🎯 Immediate resistance: $84,174-$84,200
* 🛡️ Near support: $83,600
* ⚠️ Deeper support: $82,000-$82,400

One important point is that BTC is currently trading above the MA60, which indicates short-term momentum has strengthened. However, the price is also approaching the recent high around $84.2K, so whether Bitcoin can hold above this zone will be worth watching.

If $BTC breaks and sustains above the recent high, traders may look for further upside. If the breakout fails, a pullback toward the moving average or previous consolidation area could occur.

Bitcoin is moving fast. The next few candles could be important. 👀

#Crypto #BTCUSDT #CryptoTrading #Write2Earn #BitcoinPrice
🚨 BITCOIN HITS $81,000 Bitcoin has reached the $81,000 level, while nearly $420 million in short positions were liquidated across the crypto market. 📈🔥 The move shows how quickly momentum can shift when short positions get squeezed. Disclaimer: Crypto markets are highly volatile. This post is for informational purposes only and is not financial advice. #Bitcoin #Crypto #BitcoinPrice #CryptoMarket
🚨 BITCOIN HITS $81,000
Bitcoin has reached the $81,000 level, while nearly $420 million in short positions were liquidated across the crypto market. 📈🔥

The move shows how quickly momentum can shift when short positions get squeezed.
Disclaimer: Crypto markets are highly volatile. This post is for informational purposes only and is not financial advice.

#Bitcoin #Crypto #BitcoinPrice #CryptoMarket
Article
🚨 BTC Is Back in Focus: What's Next for Bitcoin?# 🚨 BTC Is Back in Focus: What's Next for Bitcoin? Bitcoin is once again taking center stage in the crypto market. 📈 After a strong push higher, BTC is back above the key **$80,000** level, and traders everywhere are asking the same question: what happens next? 👇 ## 🔥 Where Is BTC Right Now? BTC has moved back above **$80,000**, with strong short-term momentum and increased market activity. On Binance, Bitcoin is trading around **$81.25K**, up more than **5% in 24 hours**. 🚀 A move like this brings fresh attention, higher volume, and stronger emotions. Excitement grows fast when price rises, but that is exactly when it pays to stay calm and think clearly. 🧠 ## ❓ The Real Question The important question now isn't simply *"Will BTC go up?"* 🤔 The better question is: **can Bitcoin hold its recent gains?** Price action depends on more than one factor. Trading volume, macroeconomic news, and overall market sentiment all influence where BTC goes next. Holding a level is often harder than reaching it. 💪 ## 🔑 Key Things to Watch ### 1️⃣ BTC Holding Above $80K The $80,000 level is now the big line in the sand. 📍 If BTC keeps trading above it, buyers stay in control and the recent breakout looks stronger. If it falls back below, the move may lose strength. ### 2️⃣ Trading Volume and Liquidity Volume shows how strong a move really is. 📊 A rally with rising volume and healthy liquidity is more convincing than one with fading activity. Watch whether buyers keep showing up as price climbs. ### 3️⃣ ETF and Institutional Flows Big players can move the market. 🏦 Flows into and out of Bitcoin ETFs, and the behavior of large institutions, are often used as signals of demand. ### 4️⃣ Global Interest-Rate Expectations Bitcoin doesn't trade in a bubble. 🌍 Expectations about interest rates around the world affect risk appetite across all markets, including crypto. Changes in those expectations can quickly change sentiment. ### 5️⃣ Overall Crypto Market Sentiment When the whole market feels confident, BTC often finds support. 😎 When fear takes over, even strong moves can fade. Keep an eye on the general mood, not just the BTC chart. ## ⚠️ Volatility Warning Crypto markets are **highly volatile**. A strong move can continue, but it can also reverse quickly. 🎢 A 5% gain in a day is a good reminder of how fast things can change in both directions. ## 🛡️ Smart Habits for Traders - 🔍 **Do your own research.** Don't trade on hype or on someone else's opinion alone. - 🧯 **Manage your risk.** Decide how much you can afford to lose before you enter. - ⏳ **Be patient.** Wait for clear confirmation instead of chasing green candles. - 📉 **Plan for both sides.** Know what you'll do if price rises and if it falls. ## 🏁 Final Thoughts Bitcoin has reclaimed the $80K zone, and the market is paying attention. 👀 Whether this momentum continues will depend on volume, institutional flows, interest-rate expectations, and overall sentiment. Stay informed, stay disciplined, and let the market show its direction. **BTC remains the market to watch.** ₿ ⚠️* **:** #Bitcoin #CryptoNews #BitcoinPrice #esp #sonic $BTC {spot}(BTCUSDT)

🚨 BTC Is Back in Focus: What's Next for Bitcoin?

# 🚨 BTC Is Back in Focus: What's Next for Bitcoin?
Bitcoin is once again taking center stage in the crypto market. 📈 After a strong push higher, BTC is back above the key **$80,000** level, and traders everywhere are asking the same question: what happens next? 👇
## 🔥 Where Is BTC Right Now?
BTC has moved back above **$80,000**, with strong short-term momentum and increased market activity. On Binance, Bitcoin is trading around **$81.25K**, up more than **5% in 24 hours**. 🚀
A move like this brings fresh attention, higher volume, and stronger emotions. Excitement grows fast when price rises, but that is exactly when it pays to stay calm and think clearly. 🧠
## ❓ The Real Question
The important question now isn't simply *"Will BTC go up?"* 🤔
The better question is: **can Bitcoin hold its recent gains?**
Price action depends on more than one factor. Trading volume, macroeconomic news, and overall market sentiment all influence where BTC goes next. Holding a level is often harder than reaching it. 💪
## 🔑 Key Things to Watch
### 1️⃣ BTC Holding Above $80K
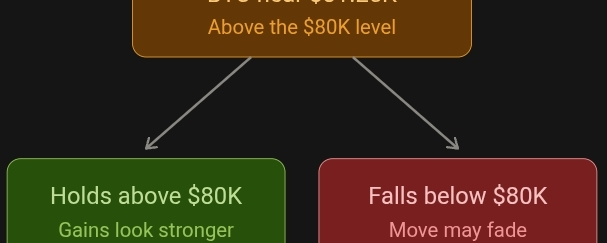
The $80,000 level is now the big line in the sand. 📍 If BTC keeps trading above it, buyers stay in control and the recent breakout looks stronger. If it falls back below, the move may lose strength.
### 2️⃣ Trading Volume and Liquidity
Volume shows how strong a move really is. 📊 A rally with rising volume and healthy liquidity is more convincing than one with fading activity. Watch whether buyers keep showing up as price climbs.
### 3️⃣ ETF and Institutional Flows
Big players can move the market. 🏦 Flows into and out of Bitcoin ETFs, and the behavior of large institutions, are often used as signals of demand.
### 4️⃣ Global Interest-Rate Expectations
Bitcoin doesn't trade in a bubble. 🌍 Expectations about interest rates around the world affect risk appetite across all markets, including crypto. Changes in those expectations can quickly change sentiment.
### 5️⃣ Overall Crypto Market Sentiment
When the whole market feels confident, BTC often finds support. 😎 When fear takes over, even strong moves can fade. Keep an eye on the general mood, not just the BTC chart.
## ⚠️ Volatility Warning
Crypto markets are **highly volatile**. A strong move can continue, but it can also reverse quickly. 🎢 A 5% gain in a day is a good reminder of how fast things can change in both directions.
## 🛡️ Smart Habits for Traders
- 🔍 **Do your own research.** Don't trade on hype or on someone else's opinion alone.
- 🧯 **Manage your risk.** Decide how much you can afford to lose before you enter.
- ⏳ **Be patient.** Wait for clear confirmation instead of chasing green candles.
- 📉 **Plan for both sides.** Know what you'll do if price rises and if it falls.
## 🏁 Final Thoughts
Bitcoin has reclaimed the $80K zone, and the market is paying attention. 👀 Whether this momentum continues will depend on volume, institutional flows, interest-rate expectations, and overall sentiment. Stay informed, stay disciplined, and let the market show its direction.
**BTC remains the market to watch.** ₿
⚠️*
**:** #Bitcoin #CryptoNews #BitcoinPrice #esp #sonic
$BTC
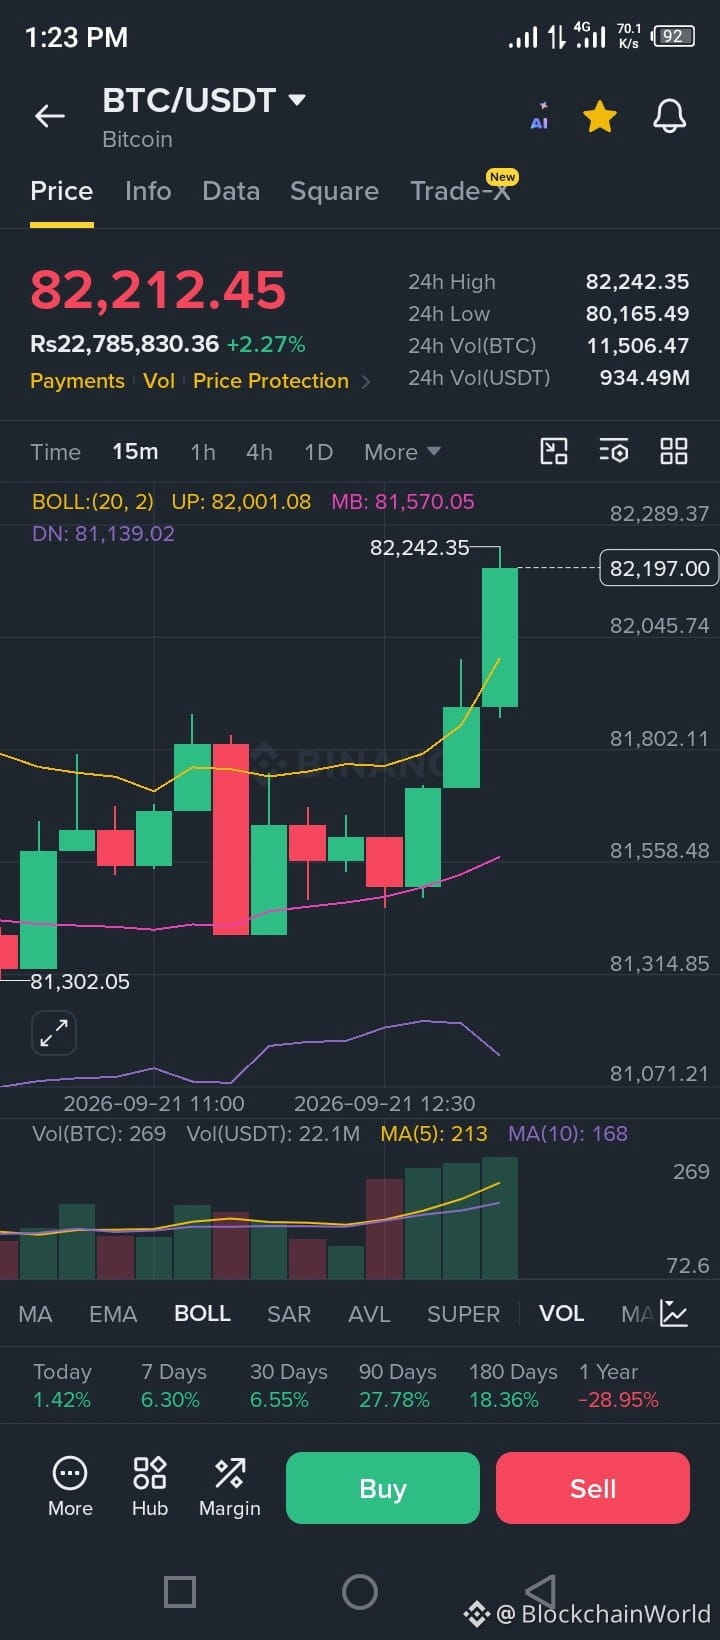
🚨 BTC MARKET STRUCTURE — KEY LEVELS TO WATCH ₿ Bitcoin is currently holding around the $81K zone, keeping the short-term recovery structure intact above $80K. The key battle is now around $82K–$83K resistance. A strong breakout with volume could open the way toward $85K–$86K, while rejection from resistance could bring BTC back toward $80K, followed by the $78K–$76.6K support zone. 📊 Key Levels: 🟢 Support: $80K → $78K → $76.6K 🔴 Resistance: $82K → $83K 🚀 Breakout area: $83K+ 🎯 Potential upside zone: $85K–$86K Macro conditions, ETF flows and upcoming U.S. economic developments remain important catalysts for the next major BTC move. For now, holding above $80K keeps the recovery structure stronger, while a loss of the lower support zones would weaken it. ⚠️ Not financial advice. Confirm price action + volume and manage risk before trading. #Bitcoin #BTC #Crypto #BitcoinPrice #CryptoTrading $BTC $ETH $SOL {future}(BTCUSDT) {spot}(SOLUSDT) {spot}(ETHUSDT)
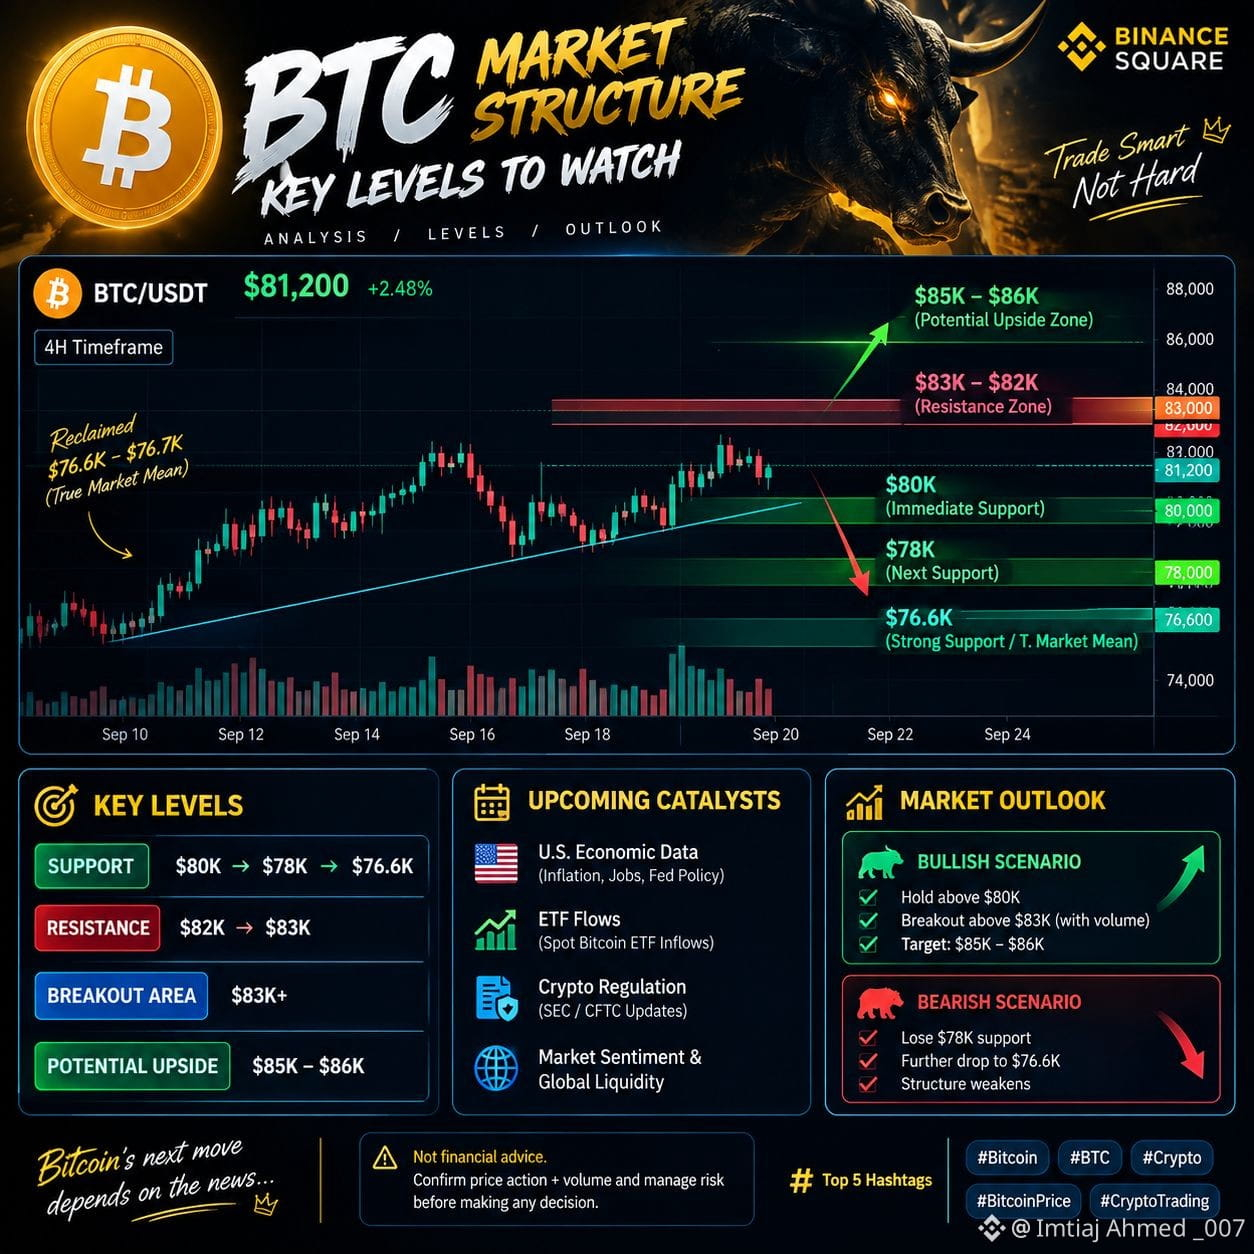
🚨 BTC MARKET STRUCTURE — KEY LEVELS TO WATCH

₿ Bitcoin is currently holding around the $81K zone, keeping the short-term recovery structure intact above $80K. The key battle is now around $82K–$83K resistance. A strong breakout with volume could open the way toward $85K–$86K, while rejection from resistance could bring BTC back toward $80K, followed by the $78K–$76.6K support zone.

📊 Key Levels:
🟢 Support: $80K → $78K → $76.6K
🔴 Resistance: $82K → $83K
🚀 Breakout area: $83K+
🎯 Potential upside zone: $85K–$86K

Macro conditions, ETF flows and upcoming U.S. economic developments remain important catalysts for the next major BTC move. For now, holding above $80K keeps the recovery structure stronger, while a loss of the lower support zones would weaken it.

⚠️ Not financial advice. Confirm price action + volume and manage risk before trading.

#Bitcoin #BTC #Crypto #BitcoinPrice #CryptoTrading
$BTC $ETH $SOL
·
--
Bullish
💬 What’s Your BTC Outlook? Bitcoin is approaching the key $82,300 resistance zone. What do you think happens next? 🟢 Bullish: BTC breaks above $82,300 and continues higher 🔴 Bearish: BTC gets rejected and pulls back toward $78K 🟡 Neutral: BTC consolidates between $78K–$82.3K Share your analysis in the comments — let’s see what the community thinks. 👇 #Bitcoin #BTC #BTCUSDT #BinanceSquare #Crypto #CryptoAnalysis #Trading #Bitcoinprice $BTC $ETH $SUI {future}(BTCUSDT)
💬 What’s Your BTC Outlook?
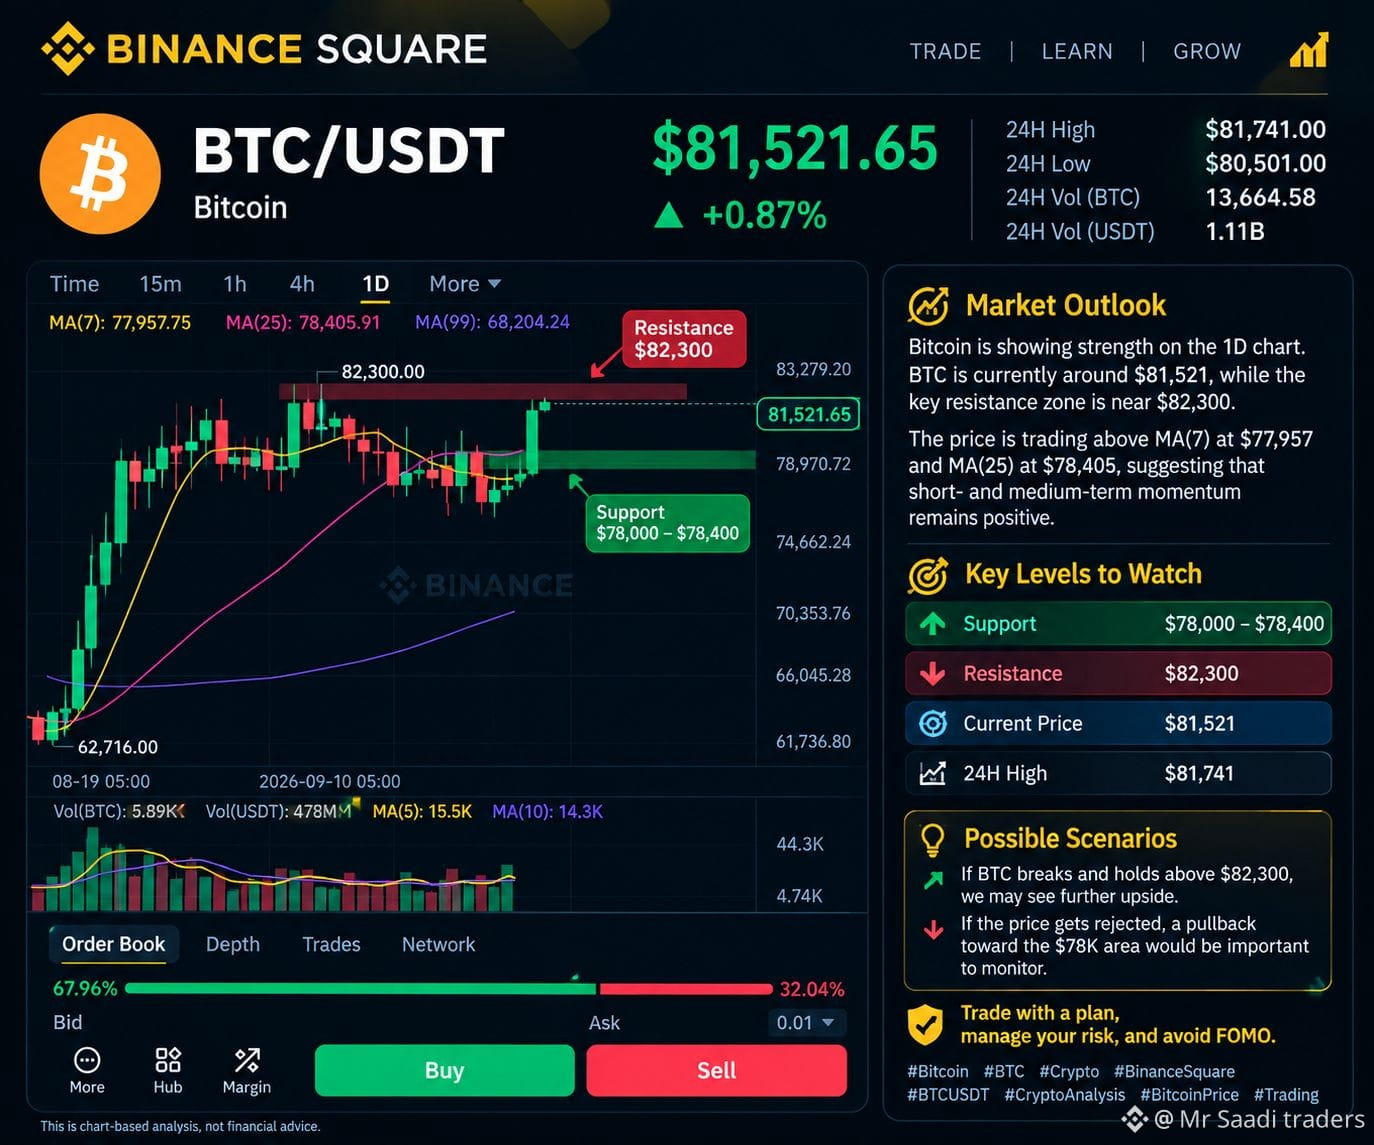
Bitcoin is approaching the key $82,300 resistance zone. What do you think happens next?
🟢 Bullish: BTC breaks above $82,300 and continues higher
🔴 Bearish: BTC gets rejected and pulls back toward $78K
🟡 Neutral: BTC consolidates between $78K–$82.3K
Share your analysis in the comments — let’s see what the community thinks. 👇
#Bitcoin #BTC #BTCUSDT #BinanceSquare #Crypto #CryptoAnalysis #Trading #Bitcoinprice $BTC $ETH $SUI
#Bitcoin ($BTC) displays impressive resilience, hitting $76,294 despite regulatory headwinds after the CLARITY Act missed a key Senate procedural threshold. Traders are now closely monitoring key technical levels as bullish momentum holds strong. Will BTC maintain this support for another leg up, or are we due for a brief consolidation? What’s your short-term target? 👇 #BTC #CryptoNews #BitcoinPrice
#Bitcoin ($BTC ) displays impressive resilience, hitting $76,294 despite regulatory headwinds after the CLARITY Act missed a key Senate procedural threshold.

Traders are now closely monitoring key technical levels as bullish momentum holds strong. Will BTC maintain this support for another leg up, or are we due for a brief consolidation?

What’s your short-term target? 👇

#BTC #CryptoNews #BitcoinPrice
BITCOIN 2026: $90K OR $100K NEXT? 🚀 BTC is currently around $80,748, with roughly 104 days left in 2026. 📊 Key scenarios: • 🎯 $90K — 58% scenario • 🚀 $100K — 24% scenario • ⚠️ $70K dip first — 48% scenario Bitcoin has shown resilience despite recent macro and regulatory pressure. BTC rebounded strongly after the September sell-off, while major altcoins have also delivered solid 30-day gains. With the Fed rate decision, regulatory developments, and U.S. midterm elections ahead, volatility could remain high. 🔥 The big question: Can BTC break above $90K and make a run toward $100K before year-end? 👇 What’s your 2026 BTC target? #Bitcoin #BTC #Crypto #Bitcoinprice #BinanceSquare
BITCOIN 2026: $90K OR $100K NEXT? 🚀

BTC is currently around $80,748, with roughly 104 days left in 2026.

📊 Key scenarios: • 🎯 $90K — 58% scenario
• 🚀 $100K — 24% scenario
• ⚠️ $70K dip first — 48% scenario

Bitcoin has shown resilience despite recent macro and regulatory pressure. BTC rebounded strongly after the September sell-off, while major altcoins have also delivered solid 30-day gains.

With the Fed rate decision, regulatory developments, and U.S. midterm elections ahead, volatility could remain high.

🔥 The big question:
Can BTC break above $90K and make a run toward $100K before year-end?

👇 What’s your 2026 BTC target?

#Bitcoin #BTC #Crypto #Bitcoinprice #BinanceSquare
BITCOIN BREAKS ABOVE $80KBitcoin ($BTC) has officially reclaimed the $80,000 level, trading around $80,192.61 USDT. 📈 24H Change: +4.94% 💰 Price: $80,192.61 🔥 Key Level: $80K reclaimed Momentum is heating up as BTC pushes back above a major psychological level. The next move could be crucial for the broader crypto market. 👀 #Bitcoin #BTC #Crypto #BitcoinPrice #Crypto Market$BTC {spot}(BTCUSDT)

BITCOIN BREAKS ABOVE $80K

Bitcoin ($BTC ) has officially reclaimed the $80,000 level, trading around $80,192.61 USDT.
📈 24H Change: +4.94%
💰 Price: $80,192.61
🔥 Key Level: $80K reclaimed
Momentum is heating up as BTC pushes back above a major psychological level. The next move could be crucial for the broader crypto market. 👀
#Bitcoin #BTC #Crypto #BitcoinPrice #Crypto Market$BTC
Article
₿ Bitcoin (BTC) Price & Candlesti₿ Bitcoin (BTC) Price & Candlestick Analysis — September 18, 2026Bitcoin is currently trading around $80,864, after a strong move higher today. BTC has traded as high as approximately $80,944, while the intraday low is around $76,205. The latest price action shows strong buying interest, but Bitcoin is also approaching an important resistance area. This makes the next few candles particularly important for traders. 🕯️ What Is the Current Candle Telling Us? The latest price action shows a strong bullish move from the mid-$76K area toward the $80K zone. A large bullish candle generally indicates that buyers are currently stronger than sellers during that period. However, one candle alone cannot confirm a long-term trend. Traders should watch: Candle + Volume + Support/Resistance + Momentum rather than relying on the candle alone. 📊 Key Support Levels Important areas to watch include: 🔹 $79,500–$80,000 — immediate breakout/retest zone 🔹 $76,000–$75,000 — important short-term support 🔹 $73,800 area — deeper technical support Recent technical analysis has highlighted approximately $75,000 as an important support area. A sustained move below this zone would weaken the current bullish structure. 🚀 Key Resistance Levels Bitcoin is now testing an important resistance region around: 🔸 $80,000–$80,900 — current resistance area 🔸 $82,000–$82,200 — next potential technical target 🔸 $85,000 — higher resistance/target zone A clean breakout should ideally be supported by strong trading volume and a candle close above resistance. 📈 Bullish Scenario If Bitcoin produces a strong candle close above the $80K–$81K region and successfully holds that area as support, traders may watch the next zones around $82K and potentially $85K. The key point is confirmation. A quick move above resistance followed by a rejection is different from a sustained breakout. 📉 Bearish Scenario If BTC is rejected from the current resistance zone and falls below $75K–$76K, the market could enter another correction. A break below major support would make lower levels increasingly important, including the area around $73.8K. This does not mean Bitcoin must fall; it simply identifies levels traders may monitor if selling pressure increases. 🧠 RSI & Momentum Momentum indicators should be watched alongside the candles. Recent analysis has shown that Bitcoin's short-term momentum can become overheated after a sharp rally. One recent report noted hourly RSI moving into overbought territory while BTC was near resistance. An overbought RSI does not automatically mean “sell.” It means price has moved strongly and traders should watch for either: ✅ continued momentum or ⚠️ a pullback/consolidation. 📦 Volume Is Important A breakout with increasing volume is generally more convincing than a breakout occurring on weak volume. For example: Price ↑ + Volume ↑ = stronger confirmation while: Price ↑ + Volume ↓ = breakout needs more caution Volume should therefore be checked whenever Bitcoin approaches major resistance. 🕯️ Candlestick Signals to Watch Bullish Signal A strong bullish candle closes above resistance and the following candle holds the breakout level. Bearish Rejection Price moves above resistance but closes back below it with a noticeable upper wick. Doji A doji can show indecision between buyers and sellers. Bullish Engulfing A large bullish candle completely covers the previous smaller bearish candle and can indicate increasing buying pressure. Bearish Engulfing A large bearish candle covers the previous bullish candle and can indicate increasing selling pressure. Remember: no candlestick pattern guarantees the next price movement. 🔮 Bitcoin Price Outlook Instead of giving one guaranteed prediction, traders can consider different scenarios. Bullish scenario: BTC holds above $80K → breakout confirmation → $82K → $85K area becomes important. Sideways scenario: BTC remains between approximately $75K and $81K while buyers and sellers fight for control. Bearish scenario: BTC loses $75K–$76K support → deeper correction becomes possible. These are technical scenarios, not guaranteed price predictions. 🔥 What Should Traders Watch Next? The most important things to monitor are: Daily candle close $80K–$81K resistance $75K–$76K support Trading volume RSI momentum MACD direction Bitcoin dominance Overall crypto market sentiment ETF/institutional flows Major global economic and central-bank news ⚠️ Risk Management Bitcoin can move thousands of dollars in a short period. Never assume that a green candle means the price must continue rising. Before entering a trade, consider: • Entry price • Stop-loss level • Take-profit levels • Position size • Trading fees • Your personal risk tolerance Never trade with money you cannot afford to lose. 🎯 Final Takeaway Bitcoin's current structure is being tested around the $80K–$81K resistance area after today's strong move. The next important question is not simply: “Will Bitcoin go up?” The better question is: “Can Bitcoin break resistance and hold it as support?” A confirmed breakout, strong volume and successful retest would provide stronger technical evidence than a temporary move above resistance. On the other hand, rejection from resistance followed by a loss of major support would indicate that traders should pay closer attention to downside levels. Watch the candle. Watch the volume. Respect the support and resistance. Manage your risk. #Bitcoin #BTC #Crypto #Binance #BitcoinAnalysis #BTCUSDT #CryptoTrading #TechnicalAnalysis #Candlestick #BitcoinPrice ck Analysis — September 18, 2026 Bitcoin is currently trading around $80,864, after a strong move higher today. BTC has traded as high as approximately $80,944, while the intraday low is around $76,205. The latest price action shows strong buying interest, but Bitcoin is also approaching an important resistance area. This makes the next few candles particularly important for traders. 🕯️ What Is the Current Candle Telling Us? The latest price action shows a strong bullish move from the mid-$76K area toward the $80K zone. A large bullish candle generally indicates that buyers are currently stronger than sellers during that period. However, one candle alone cannot confirm a long-term trend. Traders should watch: Candle + Volume + Support/Resistance + Momentum rather than relying on the candle alone. 📊 Key Support Levels Important areas to watch include: 🔹 $79,500–$80,000 — immediate breakout/retest zone 🔹 $76,000–$75,000 — important short-term support 🔹 $73,800 area — deeper technical support Recent technical analysis has highlighted approximately $75,000 as an important support area. A sustained move below this zone would weaken the current bullish structure. 🚀 Key Resistance Levels Bitcoin is now testing an important resistance region around: 🔸 $80,000–$80,900 — current resistance area 🔸 $82,000–$82,200 — next potential technical target 🔸 $85,000 — higher resistance/target zone A clean breakout should ideally be supported by strong trading volume and a candle close above resistance. 📈 Bullish Scenario If Bitcoin produces a strong candle close above the $80K–$81K region and successfully holds that area as support, traders may watch the next zones around $82K and potentially $85K. The key point is confirmation. A quick move above resistance followed by a rejection is different from a sustained breakout. 📉 Bearish Scenario If BTC is rejected from the current resistance zone and falls below $75K–$76K, the market could enter another correction. A break below major support would make lower levels increasingly important, including the area around $73.8K. This does not mean Bitcoin must fall; it simply identifies levels traders may monitor if selling pressure increases. 🧠 RSI & Momentum Momentum indicators should be watched alongside the candles. Recent analysis has shown that Bitcoin's short-term momentum can become overheated after a sharp rally. One recent report noted hourly RSI moving into overbought territory while BTC was near resistance. An overbought RSI does not automatically mean “sell.” It means price has moved strongly and traders should watch for either: ✅ continued momentum or ⚠️ a pullback/consolidation. 📦 Volume Is Important A breakout with increasing volume is generally more convincing than a breakout occurring on weak volume. For example: Price ↑ + Volume ↑ = stronger confirmation while: Price ↑ + Volume ↓ = breakout needs more caution Volume should therefore be checked whenever Bitcoin approaches major resistance. 🕯️ Candlestick Signals to Watch Bullish Signal A strong bullish candle closes above resistance and the following candle holds the breakout level. Bearish Rejection Price moves above resistance but closes back below it with a noticeable upper wick. Doji A doji can show indecision between buyers and sellers. Bullish Engulfing A large bullish candle completely covers the previous smaller bearish candle and can indicate increasing buying pressure. Bearish Engulfing A large bearish candle covers the previous bullish candle and can indicate increasing selling pressure. Remember: no candlestick pattern guarantees the next price movement. 🔮 Bitcoin Price Outlook Instead of giving one guaranteed prediction, traders can consider different scenarios. Bullish scenario: BTC holds above $80K → breakout confirmation → $82K → $85K area becomes important. Sideways scenario: BTC remains between approximately $75K and $81K while buyers and sellers fight for control. Bearish scenario: BTC loses $75K–$76K support → deeper correction becomes possible. These are technical scenarios, not guaranteed price predictions. 🔥 What Should Traders Watch Next? The most important things to monitor are: Daily candle close $80K–$81K resistance $75K–$76K support Trading volume RSI momentum MACD direction Bitcoin dominance Overall crypto market sentiment ETF/institutional flows Major global economic and central-bank news ⚠️ Risk Management Bitcoin can move thousands of dollars in a short period. Never assume that a green candle means the price must continue rising. Before entering a trade, consider: • Entry price • Stop-loss level • Take-profit levels • Position size • Trading fees • Your personal risk tolerance Never trade with money you cannot afford to lose. 🎯 Final Takeaway Bitcoin's current structure is being tested around the $80K–$81K resistance area after today's strong move. The next important question is not simply: “Will Bitcoin go up?” The better question is: “Can Bitcoin break resistance and hold it as support?” A confirmed breakout, strong volume and successful retest would provide stronger technical evidence than a temporary move above resistance. On the other hand, rejection from resistance followed by a loss of major support would indicate that traders should pay closer attention to downside levels. Watch the candle. Watch the volume. Respect the support and resistance. Manage your risk. #Bitcoin #BTC #Crypto #Binance #BitcoinAnalysis #BTCUSDT #CryptoTrading #TechnicalAnalysis #Candlestick #BitcoinPrice #BTCBreaks80K #BTC走势分析 #BTCBULISH

₿ Bitcoin (BTC) Price & Candlesti₿ Bitcoin (BTC) Price & Candlestick Analysis — September 18, 2026

Bitcoin is currently trading around $80,864, after a strong move higher today. BTC has traded as high as approximately $80,944, while the intraday low is around $76,205.
The latest price action shows strong buying interest, but Bitcoin is also approaching an important resistance area. This makes the next few candles particularly important for traders.
🕯️ What Is the Current Candle Telling Us?
The latest price action shows a strong bullish move from the mid-$76K area toward the $80K zone.
A large bullish candle generally indicates that buyers are currently stronger than sellers during that period. However, one candle alone cannot confirm a long-term trend.
Traders should watch:
Candle + Volume + Support/Resistance + Momentum
rather than relying on the candle alone.
📊 Key Support Levels
Important areas to watch include:
🔹 $79,500–$80,000 — immediate breakout/retest zone
🔹 $76,000–$75,000 — important short-term support
🔹 $73,800 area — deeper technical support
Recent technical analysis has highlighted approximately $75,000 as an important support area. A sustained move below this zone would weaken the current bullish structure.
🚀 Key Resistance Levels
Bitcoin is now testing an important resistance region around:
🔸 $80,000–$80,900 — current resistance area
🔸 $82,000–$82,200 — next potential technical target
🔸 $85,000 — higher resistance/target zone
A clean breakout should ideally be supported by strong trading volume and a candle close above resistance.
📈 Bullish Scenario
If Bitcoin produces a strong candle close above the $80K–$81K region and successfully holds that area as support, traders may watch the next zones around $82K and potentially $85K.
The key point is confirmation.
A quick move above resistance followed by a rejection is different from a sustained breakout.
📉 Bearish Scenario
If BTC is rejected from the current resistance zone and falls below $75K–$76K, the market could enter another correction.
A break below major support would make lower levels increasingly important, including the area around $73.8K.
This does not mean Bitcoin must fall; it simply identifies levels traders may monitor if selling pressure increases.
🧠 RSI & Momentum
Momentum indicators should be watched alongside the candles.
Recent analysis has shown that Bitcoin's short-term momentum can become overheated after a sharp rally. One recent report noted hourly RSI moving into overbought territory while BTC was near resistance.
An overbought RSI does not automatically mean “sell.”
It means price has moved strongly and traders should watch for either:
✅ continued momentum
or
⚠️ a pullback/consolidation.
📦 Volume Is Important
A breakout with increasing volume is generally more convincing than a breakout occurring on weak volume.
For example:
Price ↑ + Volume ↑ = stronger confirmation
while:
Price ↑ + Volume ↓ = breakout needs more caution
Volume should therefore be checked whenever Bitcoin approaches major resistance.
🕯️ Candlestick Signals to Watch
Bullish Signal
A strong bullish candle closes above resistance and the following candle holds the breakout level.
Bearish Rejection
Price moves above resistance but closes back below it with a noticeable upper wick.
Doji
A doji can show indecision between buyers and sellers.
Bullish Engulfing
A large bullish candle completely covers the previous smaller bearish candle and can indicate increasing buying pressure.
Bearish Engulfing
A large bearish candle covers the previous bullish candle and can indicate increasing selling pressure.
Remember: no candlestick pattern guarantees the next price movement.
🔮 Bitcoin Price Outlook
Instead of giving one guaranteed prediction, traders can consider different scenarios.
Bullish scenario:
BTC holds above $80K → breakout confirmation → $82K → $85K area becomes important.
Sideways scenario:
BTC remains between approximately $75K and $81K while buyers and sellers fight for control.
Bearish scenario:
BTC loses $75K–$76K support → deeper correction becomes possible.
These are technical scenarios, not guaranteed price predictions.
🔥 What Should Traders Watch Next?
The most important things to monitor are:
Daily candle close
$80K–$81K resistance
$75K–$76K support
Trading volume
RSI momentum
MACD direction
Bitcoin dominance
Overall crypto market sentiment
ETF/institutional flows
Major global economic and central-bank news
⚠️ Risk Management
Bitcoin can move thousands of dollars in a short period.
Never assume that a green candle means the price must continue rising.
Before entering a trade, consider:
• Entry price
• Stop-loss level
• Take-profit levels
• Position size
• Trading fees
• Your personal risk tolerance
Never trade with money you cannot afford to lose.
🎯 Final Takeaway
Bitcoin's current structure is being tested around the $80K–$81K resistance area after today's strong move.
The next important question is not simply:
“Will Bitcoin go up?”
The better question is:
“Can Bitcoin break resistance and hold it as support?”
A confirmed breakout, strong volume and successful retest would provide stronger technical evidence than a temporary move above resistance.
On the other hand, rejection from resistance followed by a loss of major support would indicate that traders should pay closer attention to downside levels.
Watch the candle. Watch the volume. Respect the support and resistance. Manage your risk.
#Bitcoin #BTC #Crypto #Binance #BitcoinAnalysis #BTCUSDT #CryptoTrading #TechnicalAnalysis #Candlestick #BitcoinPrice ck Analysis — September 18, 2026
Bitcoin is currently trading around $80,864, after a strong move higher today. BTC has traded as high as approximately $80,944, while the intraday low is around $76,205.
The latest price action shows strong buying interest, but Bitcoin is also approaching an important resistance area. This makes the next few candles particularly important for traders.
🕯️ What Is the Current Candle Telling Us?
The latest price action shows a strong bullish move from the mid-$76K area toward the $80K zone.
A large bullish candle generally indicates that buyers are currently stronger than sellers during that period. However, one candle alone cannot confirm a long-term trend.
Traders should watch:
Candle + Volume + Support/Resistance + Momentum
rather than relying on the candle alone.
📊 Key Support Levels
Important areas to watch include:
🔹 $79,500–$80,000 — immediate breakout/retest zone
🔹 $76,000–$75,000 — important short-term support
🔹 $73,800 area — deeper technical support
Recent technical analysis has highlighted approximately $75,000 as an important support area. A sustained move below this zone would weaken the current bullish structure.
🚀 Key Resistance Levels
Bitcoin is now testing an important resistance region around:
🔸 $80,000–$80,900 — current resistance area
🔸 $82,000–$82,200 — next potential technical target
🔸 $85,000 — higher resistance/target zone
A clean breakout should ideally be supported by strong trading volume and a candle close above resistance.
📈 Bullish Scenario
If Bitcoin produces a strong candle close above the $80K–$81K region and successfully holds that area as support, traders may watch the next zones around $82K and potentially $85K.
The key point is confirmation.
A quick move above resistance followed by a rejection is different from a sustained breakout.
📉 Bearish Scenario
If BTC is rejected from the current resistance zone and falls below $75K–$76K, the market could enter another correction.
A break below major support would make lower levels increasingly important, including the area around $73.8K.
This does not mean Bitcoin must fall; it simply identifies levels traders may monitor if selling pressure increases.
🧠 RSI & Momentum
Momentum indicators should be watched alongside the candles.
Recent analysis has shown that Bitcoin's short-term momentum can become overheated after a sharp rally. One recent report noted hourly RSI moving into overbought territory while BTC was near resistance.
An overbought RSI does not automatically mean “sell.”
It means price has moved strongly and traders should watch for either:
✅ continued momentum
or
⚠️ a pullback/consolidation.
📦 Volume Is Important
A breakout with increasing volume is generally more convincing than a breakout occurring on weak volume.
For example:
Price ↑ + Volume ↑ = stronger confirmation
while:
Price ↑ + Volume ↓ = breakout needs more caution
Volume should therefore be checked whenever Bitcoin approaches major resistance.
🕯️ Candlestick Signals to Watch
Bullish Signal
A strong bullish candle closes above resistance and the following candle holds the breakout level.
Bearish Rejection
Price moves above resistance but closes back below it with a noticeable upper wick.
Doji
A doji can show indecision between buyers and sellers.
Bullish Engulfing
A large bullish candle completely covers the previous smaller bearish candle and can indicate increasing buying pressure.
Bearish Engulfing
A large bearish candle covers the previous bullish candle and can indicate increasing selling pressure.
Remember: no candlestick pattern guarantees the next price movement.
🔮 Bitcoin Price Outlook
Instead of giving one guaranteed prediction, traders can consider different scenarios.
Bullish scenario:
BTC holds above $80K → breakout confirmation → $82K → $85K area becomes important.
Sideways scenario:
BTC remains between approximately $75K and $81K while buyers and sellers fight for control.
Bearish scenario:
BTC loses $75K–$76K support → deeper correction becomes possible.
These are technical scenarios, not guaranteed price predictions.
🔥 What Should Traders Watch Next?
The most important things to monitor are:
Daily candle close
$80K–$81K resistance
$75K–$76K support
Trading volume
RSI momentum
MACD direction
Bitcoin dominance
Overall crypto market sentiment
ETF/institutional flows
Major global economic and central-bank news
⚠️ Risk Management
Bitcoin can move thousands of dollars in a short period.
Never assume that a green candle means the price must continue rising.
Before entering a trade, consider:
• Entry price
• Stop-loss level
• Take-profit levels
• Position size
• Trading fees
• Your personal risk tolerance
Never trade with money you cannot afford to lose.
🎯 Final Takeaway
Bitcoin's current structure is being tested around the $80K–$81K resistance area after today's strong move.
The next important question is not simply:
“Will Bitcoin go up?”
The better question is:
“Can Bitcoin break resistance and hold it as support?”
A confirmed breakout, strong volume and successful retest would provide stronger technical evidence than a temporary move above resistance.
On the other hand, rejection from resistance followed by a loss of major support would indicate that traders should pay closer attention to downside levels.
Watch the candle. Watch the volume. Respect the support and resistance. Manage your risk.
#Bitcoin #BTC #Crypto #Binance #BitcoinAnalysis #BTCUSDT #CryptoTrading #TechnicalAnalysis #Candlestick #BitcoinPrice #BTCBreaks80K #BTC走势分析 #BTCBULISH

Bitcoin surged nearly 6 percent to break the $80,000 level, fueled by a significant short squeeze. While the momentum is bullish, technical indicators suggest the move might be slightly overextended. #BitcoinPrice #ShortSqueeze ‎
Bitcoin surged nearly 6 percent to break the $80,000 level, fueled by a significant short squeeze. While the momentum is bullish, technical indicators suggest the move might be slightly overextended.

#BitcoinPrice #ShortSqueeze
🚨 $BTC DETAILED ANALYSIS - SEP 2026 🚨 Current Price: $78,074 Look at this chart carefully 👇 Sep 1: $62K → Sep 7: $81.8K = +32% in 7 days 🚀 Sep 7 to Sep 14: Correction to $76,270 Sep 18: Bounced to $78,074 What does this tell us? ✅ SUPPORT $76,270 is ROCK SOLID - Tested 4 times, never broken ✅ RESISTANCE $80K is the final boss - Break it and $85K is open ✅ This is a textbook Bull Flag - Healthy correction, not crash My Trade Plan: LONG above $77,500 Target 1: $80,000 Target 2: $82,500 Target 3: $85,000 Stop Loss: Daily close below $76,270 Risk:Reward = 1:4 - Best setup this month. I warned you at $76,708 bottom. Now we are up $1,400. Next move is $80K. Screenshot this. Are you Bullish or Bearish? Comment 👇 Not Financial Advice. #BTC #Bitcoin #BTCAnalysis #CryptoTrading #TradingView #SupportResistance #BullFlag #Bitcoinprice #StellarActivatesProtocol28At211TPS #ChainlinkPowersBottomlinePaymentPlatform #BOJHikesRatesTo31YearHigh #HKMAPlansWholesaleCBDCByYearEnd
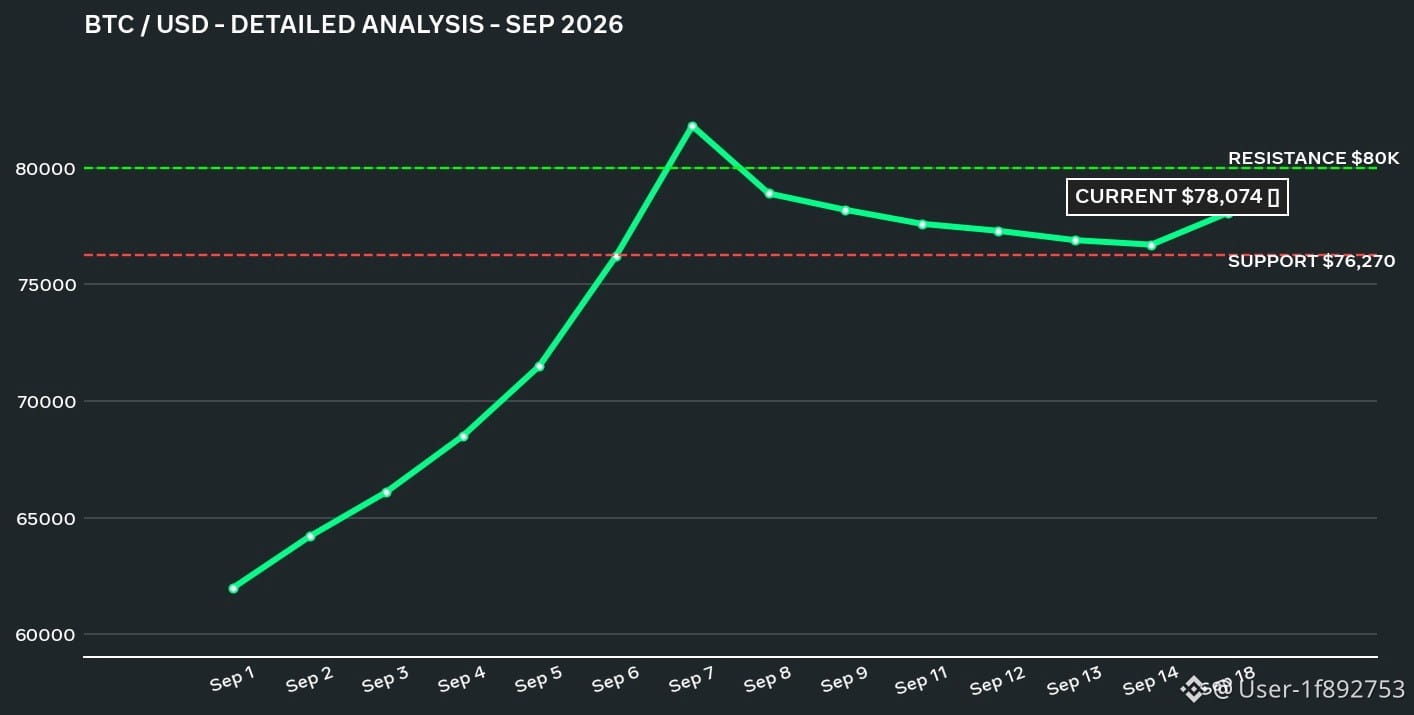
🚨 $BTC DETAILED ANALYSIS - SEP 2026 🚨

Current Price: $78,074

Look at this chart carefully 👇

Sep 1: $62K → Sep 7: $81.8K = +32% in 7 days 🚀
Sep 7 to Sep 14: Correction to $76,270
Sep 18: Bounced to $78,074

What does this tell us?

✅ SUPPORT $76,270 is ROCK SOLID - Tested 4 times, never broken
✅ RESISTANCE $80K is the final boss - Break it and $85K is open
✅ This is a textbook Bull Flag - Healthy correction, not crash

My Trade Plan:

LONG above $77,500
Target 1: $80,000
Target 2: $82,500
Target 3: $85,000

Stop Loss: Daily close below $76,270

Risk:Reward = 1:4 - Best setup this month.

I warned you at $76,708 bottom. Now we are up $1,400.

Next move is $80K. Screenshot this.

Are you Bullish or Bearish? Comment 👇

Not Financial Advice.

#BTC #Bitcoin #BTCAnalysis #CryptoTrading #TradingView #SupportResistance #BullFlag #Bitcoinprice #StellarActivatesProtocol28At211TPS #ChainlinkPowersBottomlinePaymentPlatform #BOJHikesRatesTo31YearHigh #HKMAPlansWholesaleCBDCByYearEnd
Holding $USDT 1 USDT
$BTC {spot}(BTCUSDT) 📊 BTC 24-Hour Update — Bullish or Bearish? Current bias: 🟢 Mildly Bullish — Binance shows BTC around $77.7K, up about 1.69% over the last 24 hours, with a 24h range of roughly $75.95K–$77.78K. � Binance BTC has recovered from the lower end of today’s range, but it still needs to hold the $77K area and push through the recent high for stronger upside confirmation. So, for the next 24 hours, the momentum is bullish but not guaranteed. #Bitcoin #BTC #Crypto #Binance #Bitcoinprice $USDT {spot}(USDCUSDT)
$BTC
📊 BTC 24-Hour Update — Bullish or Bearish?
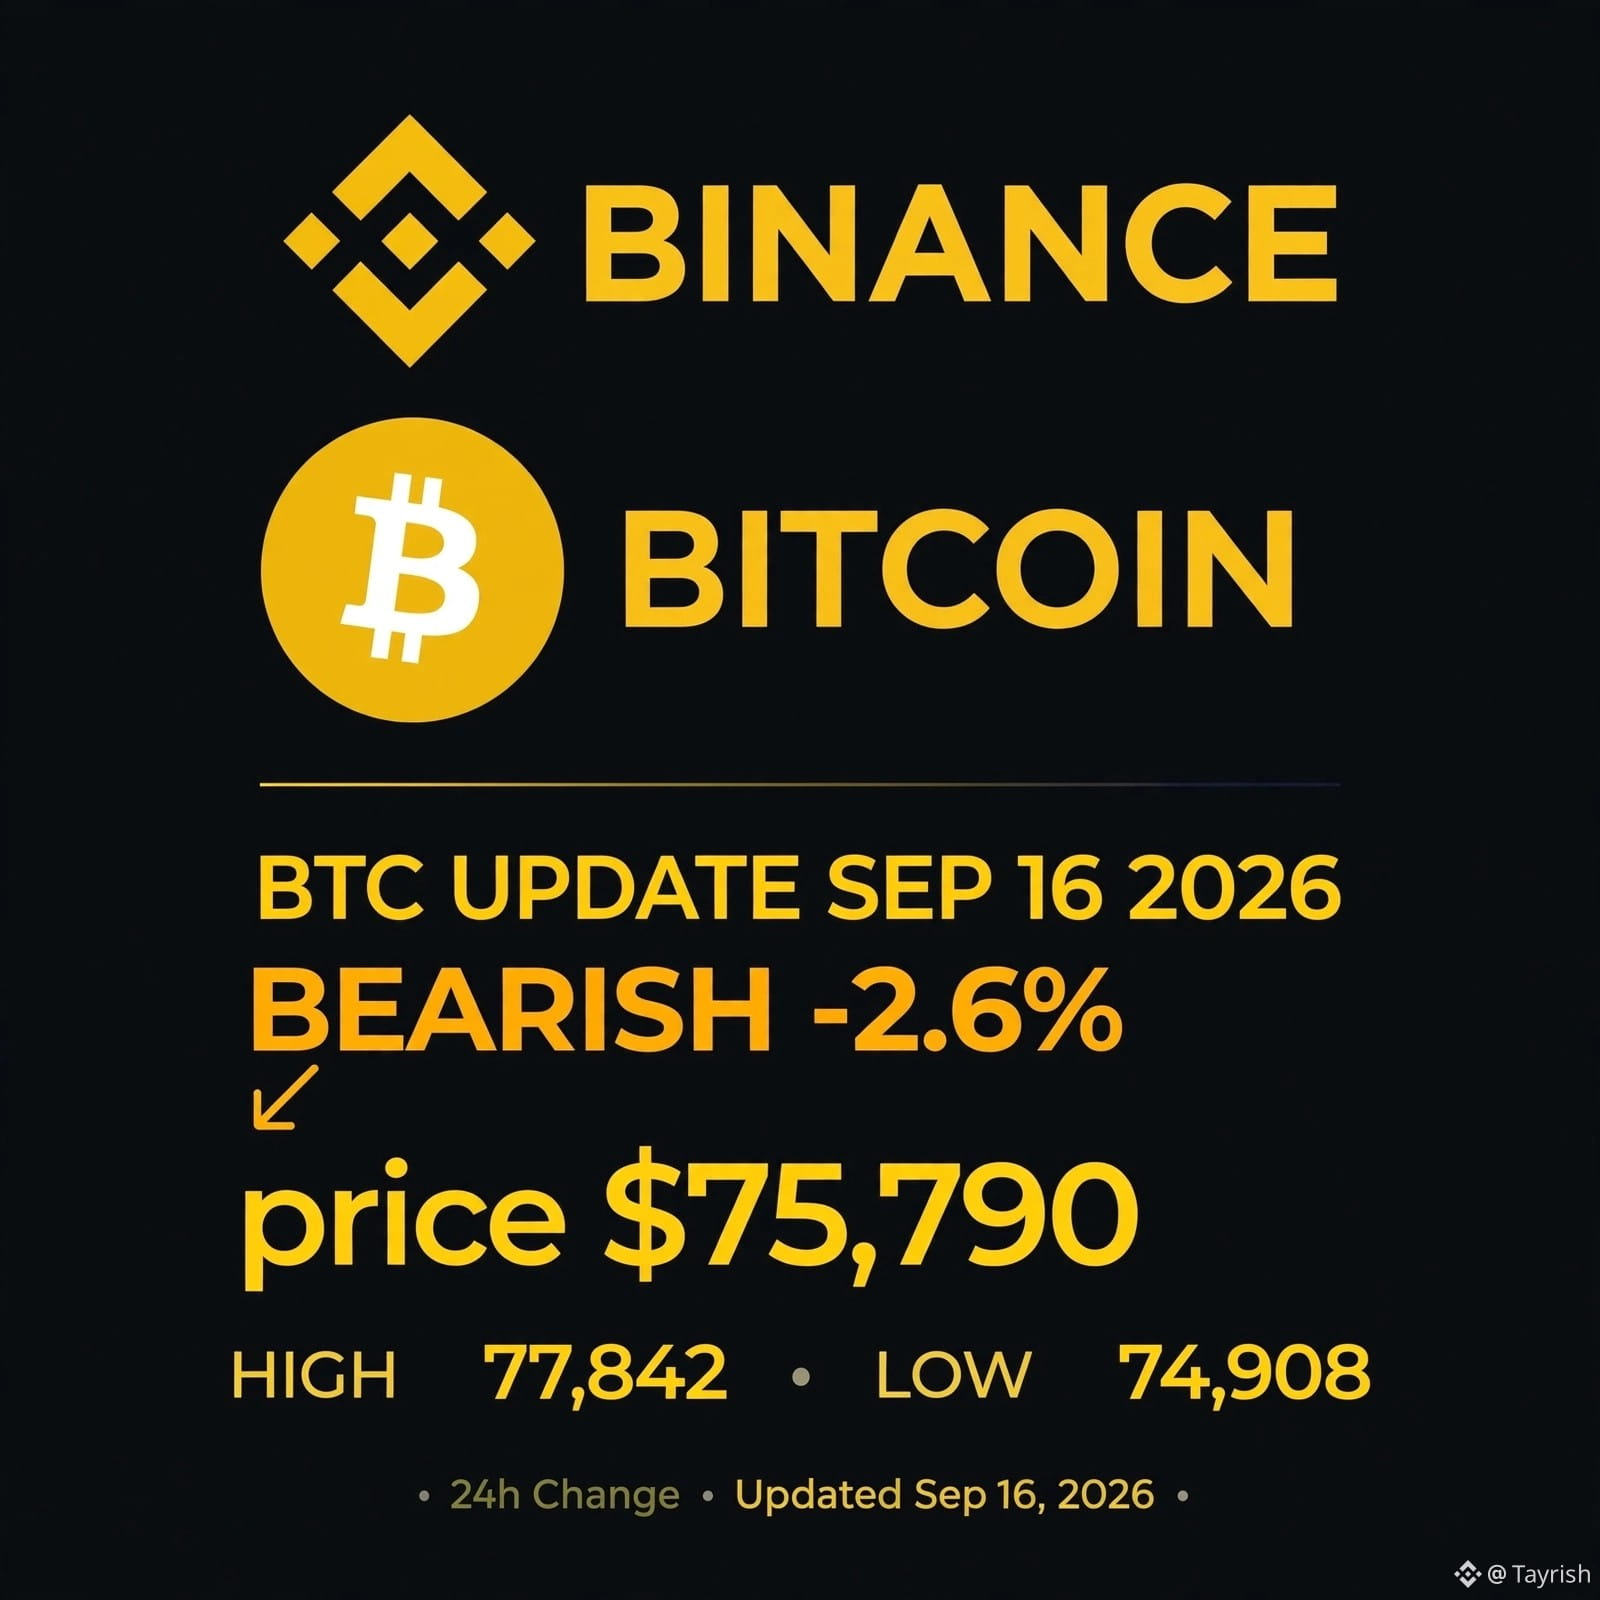
Current bias: 🟢 Mildly Bullish — Binance shows BTC around $77.7K, up about 1.69% over the last 24 hours, with a 24h range of roughly $75.95K–$77.78K. �
Binance
BTC has recovered from the lower end of today’s range, but it still needs to hold the $77K area and push through the recent high for stronger upside confirmation. So, for the next 24 hours, the momentum is bullish but not guaranteed.
#Bitcoin #BTC #Crypto #Binance #Bitcoinprice
$USDT
LoL: Team WE vs JD Gaming (BO5) - LPL Regional Finals Playoffs

LoL: Team WE vs JD Gaming (BO5) - LPL Regional Finals Playoffs

Game 1 Winner99%O/U 3.5 Games99%Total Kills Over/U...99%
Volume $922,790.1
💫**Bitcoin Is Holding the $76K Zone — What’s Next? ₿** $BTC is back around **$76.4K**, up roughly **1% in 24 hours** as markets digest the latest Fed rate move. 📍 **Key zone:** $76K–$77K support 🎯 **Next levels to watch:** $78K → $80K ⚠️ A sustained break below $76K could put further downside levels in focus. For now, **Bitcoin’s next move depends on whether buyers can defend the current support zone.** Are you watching **$78K or $80K** next? 👀 #bitcoin #BTC #CryptoNewss #BinanceSquare #Bitcoinprice #CryptoTrading {spot}(BTCUSDT)
💫**Bitcoin Is Holding the $76K Zone — What’s Next? ₿**

$BTC is back around **$76.4K**, up roughly **1% in 24 hours** as markets digest the latest Fed rate move.

📍 **Key zone:** $76K–$77K support
🎯 **Next levels to watch:** $78K → $80K
⚠️ A sustained break below $76K could put further downside levels in focus.

For now, **Bitcoin’s next move depends on whether buyers can defend the current support zone.**

Are you watching **$78K or $80K** next? 👀

#bitcoin #BTC #CryptoNewss #BinanceSquare #Bitcoinprice #CryptoTrading
🚨 BITCOIN SEES SEPTEMBER’S BIGGEST CAPITULATION Bitcoin is facing its biggest capitulation wave of September as short-term holders absorb the recent market sell-off. 🔑 Key Points: • BTC recently dropped toward the $75K area • Short-term holders are facing increased selling pressure • The latest decline followed a sharp risk-off move in crypto • Market participants are watching whether selling pressure continues • BTC remains highly sensitive to regulatory and macro catalysts 📊 Market Insight: The latest capitulation shows that short-term holders are taking the brunt of the correction. Whether this develops into further downside or stabilizes depends on whether buyers can absorb the remaining selling pressure. 🔴 Short-Term Pressure: DOWN #Bitcoin #BTC #CryptoMarket #Bitcoinprice #CryptoNews $BTC {future}(BTCUSDT)
🚨 BITCOIN SEES SEPTEMBER’S BIGGEST CAPITULATION

Bitcoin is facing its biggest capitulation wave of September as short-term holders absorb the recent market sell-off.

🔑 Key Points:
• BTC recently dropped toward the $75K area
• Short-term holders are facing increased selling pressure
• The latest decline followed a sharp risk-off move in crypto
• Market participants are watching whether selling pressure continues
• BTC remains highly sensitive to regulatory and macro catalysts

📊 Market Insight:
The latest capitulation shows that short-term holders are taking the brunt of the correction. Whether this develops into further downside or stabilizes depends on whether buyers can absorb the remaining selling pressure.

🔴 Short-Term Pressure: DOWN

#Bitcoin #BTC #CryptoMarket #Bitcoinprice #CryptoNews $BTC
Log in to explore more content
Join global crypto users on Binance Square
⚡️ Get latest and useful information about crypto.
💬 Trusted by the world’s largest crypto exchange.
👍 Discover real insights from verified creators.
Email / Phone number