
#bitcoinbearish
bitcoinbearish
5,705 views
42 Discussing
Hot
Latest

·
--
Bearish
🚨 $BTC Bitcoin Is Losing Critical Support, And The Weekly Chart Is Turning Bearish.
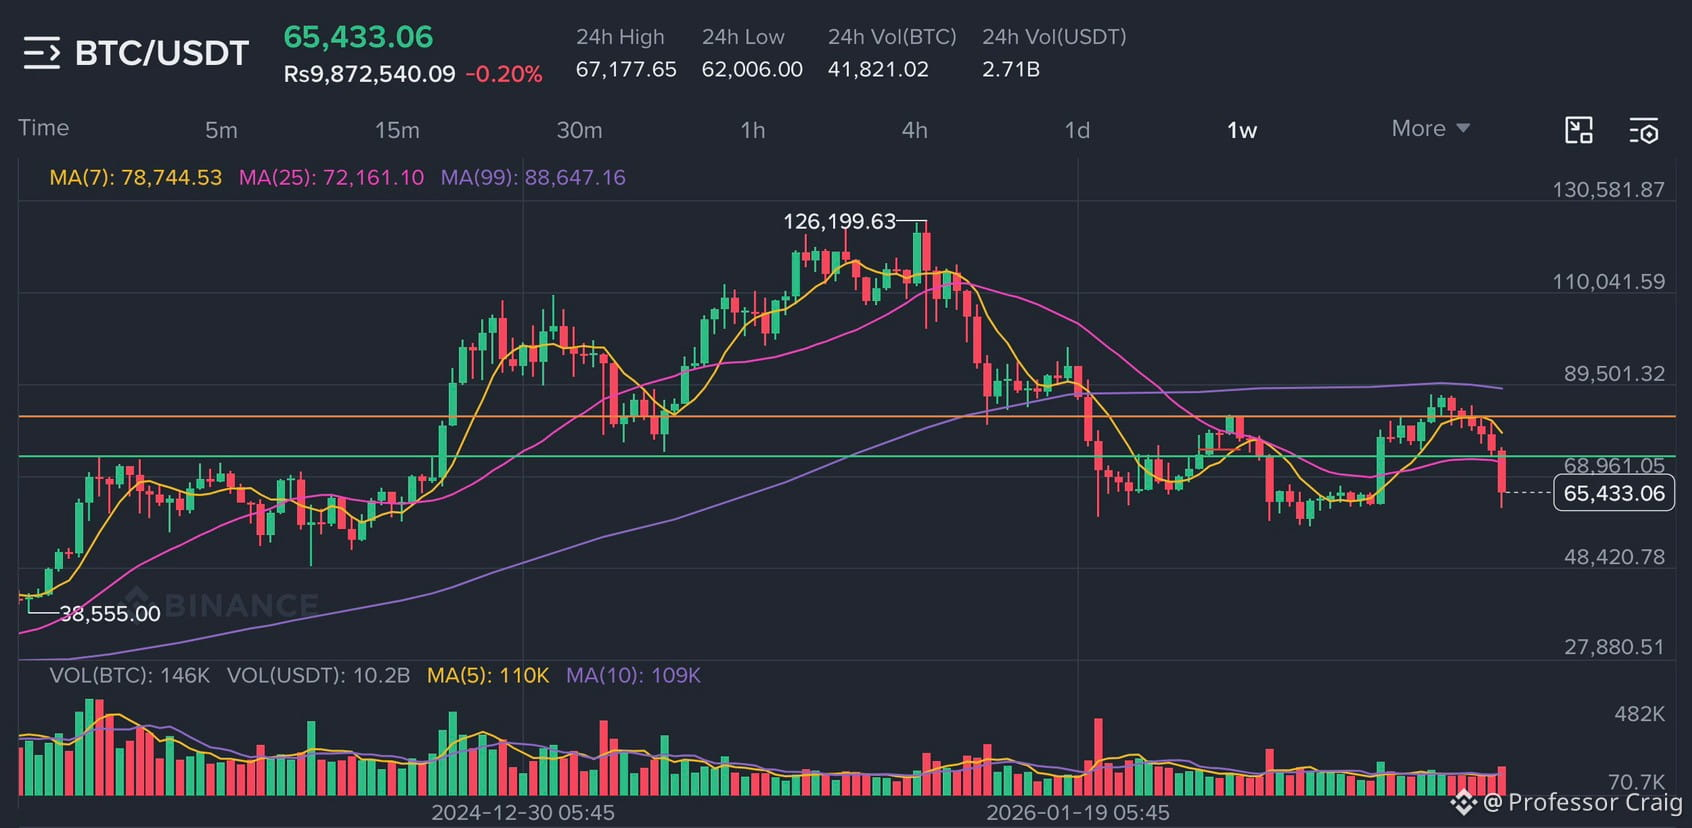
Bitcoin is showing serious weakness on the weekly timeframe, and the latest price action is raising concerns about a deeper correction. Trading around $65,433, it has fallen below the $68,961 support zone, which previously acted as an important price floor. This breakdown is significant because buyers have repeatedly tried to maintain this area, but the latest red candle suggests that selling pressure is taking control. The market is no longer showing the same strength that pushed Bitcoin toward its previous high of $126,199.
Looking at the moving averages, the situation becomes even more concerning. The 7 week moving average is currently around $78,744, while the 25 week moving average sits near $72,161. Bitcoin is trading below both of them, and even the 99 week moving average around $88,647 remains far above the current price. This alignment shows that the broader trend has weakened considerably. The recent recovery toward the $85,000-$88,000 region failed to develop into a sustainable breakout, and sellers quickly pushed the price lower again. Volume also deserves attention because a strong increase in selling activity could accelerate the downside.
The immediate level to watch is $62,000, which is close to the recent 24 hour low. If Bitcoin continues trading below $68,961 and loses the $62,000 region, the next major downside area could be around $52,000. That would represent another substantial correction from current levels. On the upside, reclaiming $68,961 is the first step toward improving the structure. However, $72,161 and $78,744 are additional resistance areas that buyers would need to overcome before any meaningful recovery takes shape.
My current outlook is bearish. Bitcoin needs to recover its lost support levels before the weekly structure can show genuine strength again. Until then, another leg down remains a serious possibility.
{future}(BTCUSDT)
#btcusdt #BitcoinBearish #BitcoinAnalysis
🚨 $BTC Bitcoin Is Losing Critical Support, And The Weekly Chart Is Turning Bearish.
Bitcoin is showing serious weakness on the weekly timeframe, and the latest price action is raising concerns about a deeper correction. Trading around $65,433, it has fallen below the $68,961 support zone, which previously acted as an important price floor. This breakdown is significant because buyers have repeatedly tried to maintain this area, but the latest red candle suggests that selling pressure is taking control. The market is no longer showing the same strength that pushed Bitcoin toward its previous high of $126,199.
Looking at the moving averages, the situation becomes even more concerning. The 7 week moving average is currently around $78,744, while the 25 week moving average sits near $72,161. Bitcoin is trading below both of them, and even the 99 week moving average around $88,647 remains far above the current price. This alignment shows that the broader trend has weakened considerably. The recent recovery toward the $85,000-$88,000 region failed to develop into a sustainable breakout, and sellers quickly pushed the price lower again. Volume also deserves attention because a strong increase in selling activity could accelerate the downside.
The immediate level to watch is $62,000, which is close to the recent 24 hour low. If Bitcoin continues trading below $68,961 and loses the $62,000 region, the next major downside area could be around $52,000. That would represent another substantial correction from current levels. On the upside, reclaiming $68,961 is the first step toward improving the structure. However, $72,161 and $78,744 are additional resistance areas that buyers would need to overcome before any meaningful recovery takes shape.
My current outlook is bearish. Bitcoin needs to recover its lost support levels before the weekly structure can show genuine strength again. Until then, another leg down remains a serious possibility.
#btcusdt #BitcoinBearish #BitcoinAnalysis
Bitcoin is showing serious weakness on the weekly timeframe, and the latest price action is raising concerns about a deeper correction. Trading around $65,433, it has fallen below the $68,961 support zone, which previously acted as an important price floor. This breakdown is significant because buyers have repeatedly tried to maintain this area, but the latest red candle suggests that selling pressure is taking control. The market is no longer showing the same strength that pushed Bitcoin toward its previous high of $126,199.
Looking at the moving averages, the situation becomes even more concerning. The 7 week moving average is currently around $78,744, while the 25 week moving average sits near $72,161. Bitcoin is trading below both of them, and even the 99 week moving average around $88,647 remains far above the current price. This alignment shows that the broader trend has weakened considerably. The recent recovery toward the $85,000-$88,000 region failed to develop into a sustainable breakout, and sellers quickly pushed the price lower again. Volume also deserves attention because a strong increase in selling activity could accelerate the downside.
The immediate level to watch is $62,000, which is close to the recent 24 hour low. If Bitcoin continues trading below $68,961 and loses the $62,000 region, the next major downside area could be around $52,000. That would represent another substantial correction from current levels. On the upside, reclaiming $68,961 is the first step toward improving the structure. However, $72,161 and $78,744 are additional resistance areas that buyers would need to overcome before any meaningful recovery takes shape.
My current outlook is bearish. Bitcoin needs to recover its lost support levels before the weekly structure can show genuine strength again. Until then, another leg down remains a serious possibility.
#btcusdt #BitcoinBearish #BitcoinAnalysis
Christina Cooper:
Tipped the creator!
3
1
253

·
--
Bearish
We are sitting on top of the bear market. Recession style. Short to 28k😂😂😂 #BitcoinBearish $BTC $NVDAB short
We are sitting on top of the bear market. Recession style. Short to 28k😂😂😂 #BitcoinBearish $BTC $NVDAB short
28

·
--
Bearish
BREAKING: 🚨 Bitcoin STUCK below $60K – while stocks soar on Iran peace talks, BTC can’t even fake a breakout. Glassnode admits buyers are WEAK-handed. 📉
So let me get this straight – equities pump on geopolitical hopium, yet the "digital gold" narrative folds like a cheap suit? Either Bitcoin is not the macro hedge we thought, or institutional money is playing us for exit liquidity again. 🧐
This isn’t a dip – it’s a confidence crisis. On-chain data shows quiet accumulation, but NO conviction. That’s not a bull market foundation; that’s a house of cards waiting for one bad tweet.
My hot take: We don’t need peace – we need a REAL capitulation flush to $52K before any sustainable bounce. History says: weak hands get wrecked, strong hands buy fear. Are YOU buying this fake recovery or waiting for blood? 👇
Drop your price target for July 1 – and tell me why I’m wrong. I’ll wait.
#BitcoinBearish #CryptoRealityCheck #MacroCrush
$BTC
{future}(BTCUSDT)
BREAKING: 🚨 Bitcoin STUCK below $60K – while stocks soar on Iran peace talks, BTC can’t even fake a breakout. Glassnode admits buyers are WEAK-handed. 📉
So let me get this straight – equities pump on geopolitical hopium, yet the "digital gold" narrative folds like a cheap suit? Either Bitcoin is not the macro hedge we thought, or institutional money is playing us for exit liquidity again. 🧐
This isn’t a dip – it’s a confidence crisis. On-chain data shows quiet accumulation, but NO conviction. That’s not a bull market foundation; that’s a house of cards waiting for one bad tweet.
My hot take: We don’t need peace – we need a REAL capitulation flush to $52K before any sustainable bounce. History says: weak hands get wrecked, strong hands buy fear. Are YOU buying this fake recovery or waiting for blood? 👇
Drop your price target for July 1 – and tell me why I’m wrong. I’ll wait.
#BitcoinBearish #CryptoRealityCheck #MacroCrush
$BTC
So let me get this straight – equities pump on geopolitical hopium, yet the "digital gold" narrative folds like a cheap suit? Either Bitcoin is not the macro hedge we thought, or institutional money is playing us for exit liquidity again. 🧐
This isn’t a dip – it’s a confidence crisis. On-chain data shows quiet accumulation, but NO conviction. That’s not a bull market foundation; that’s a house of cards waiting for one bad tweet.
My hot take: We don’t need peace – we need a REAL capitulation flush to $52K before any sustainable bounce. History says: weak hands get wrecked, strong hands buy fear. Are YOU buying this fake recovery or waiting for blood? 👇
Drop your price target for July 1 – and tell me why I’m wrong. I’ll wait.
#BitcoinBearish #CryptoRealityCheck #MacroCrush
$BTC


48

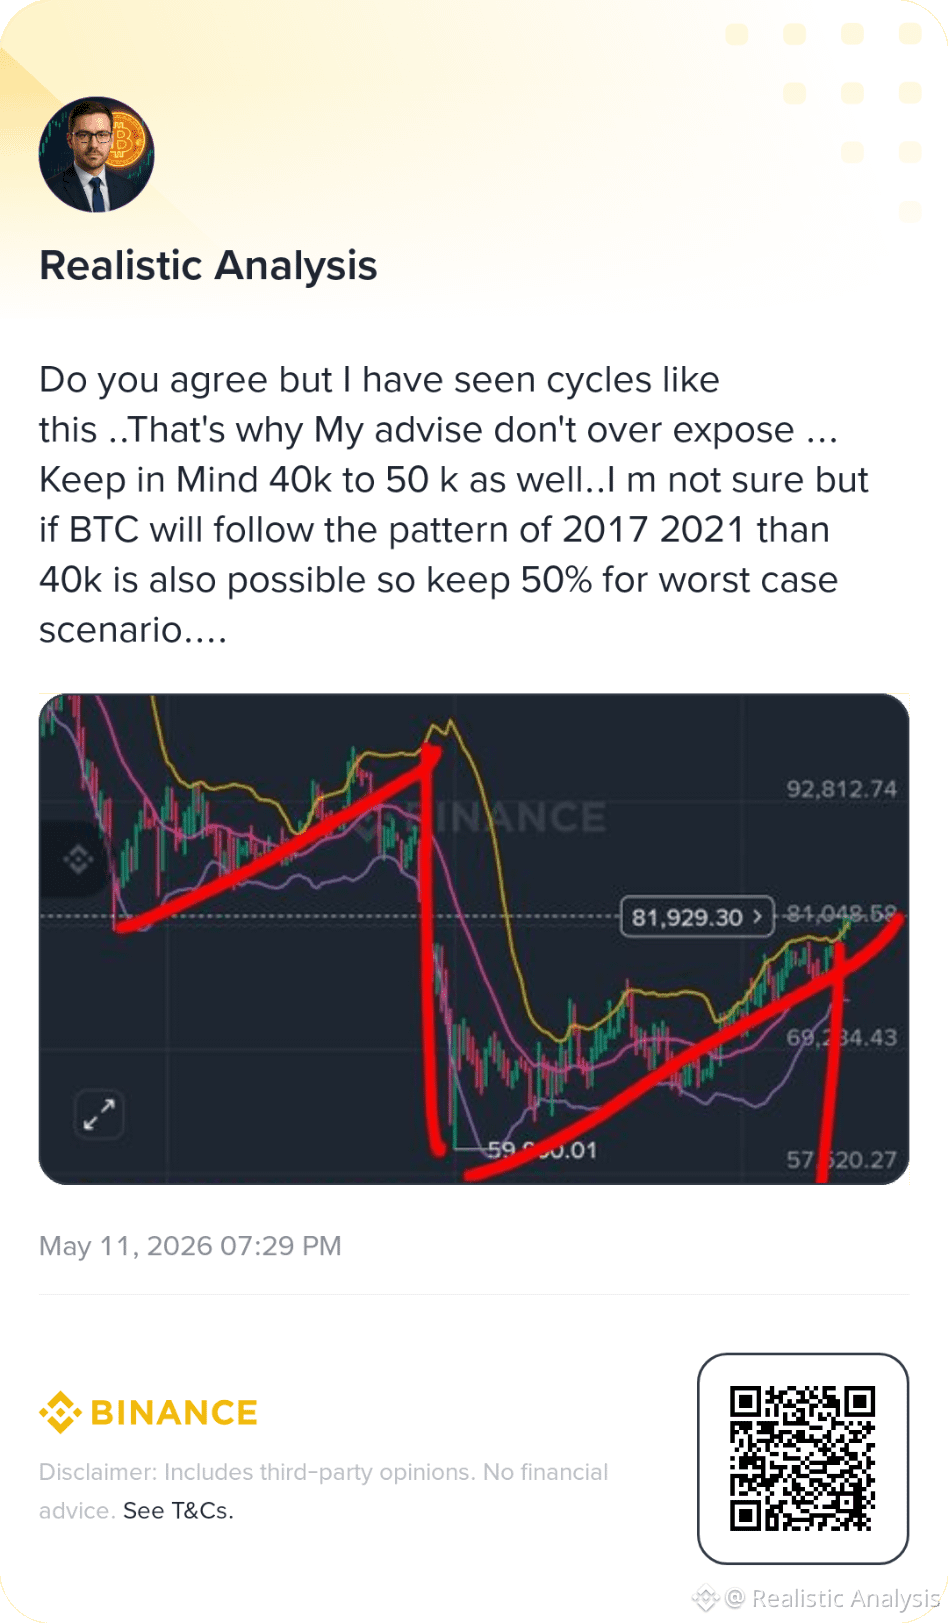
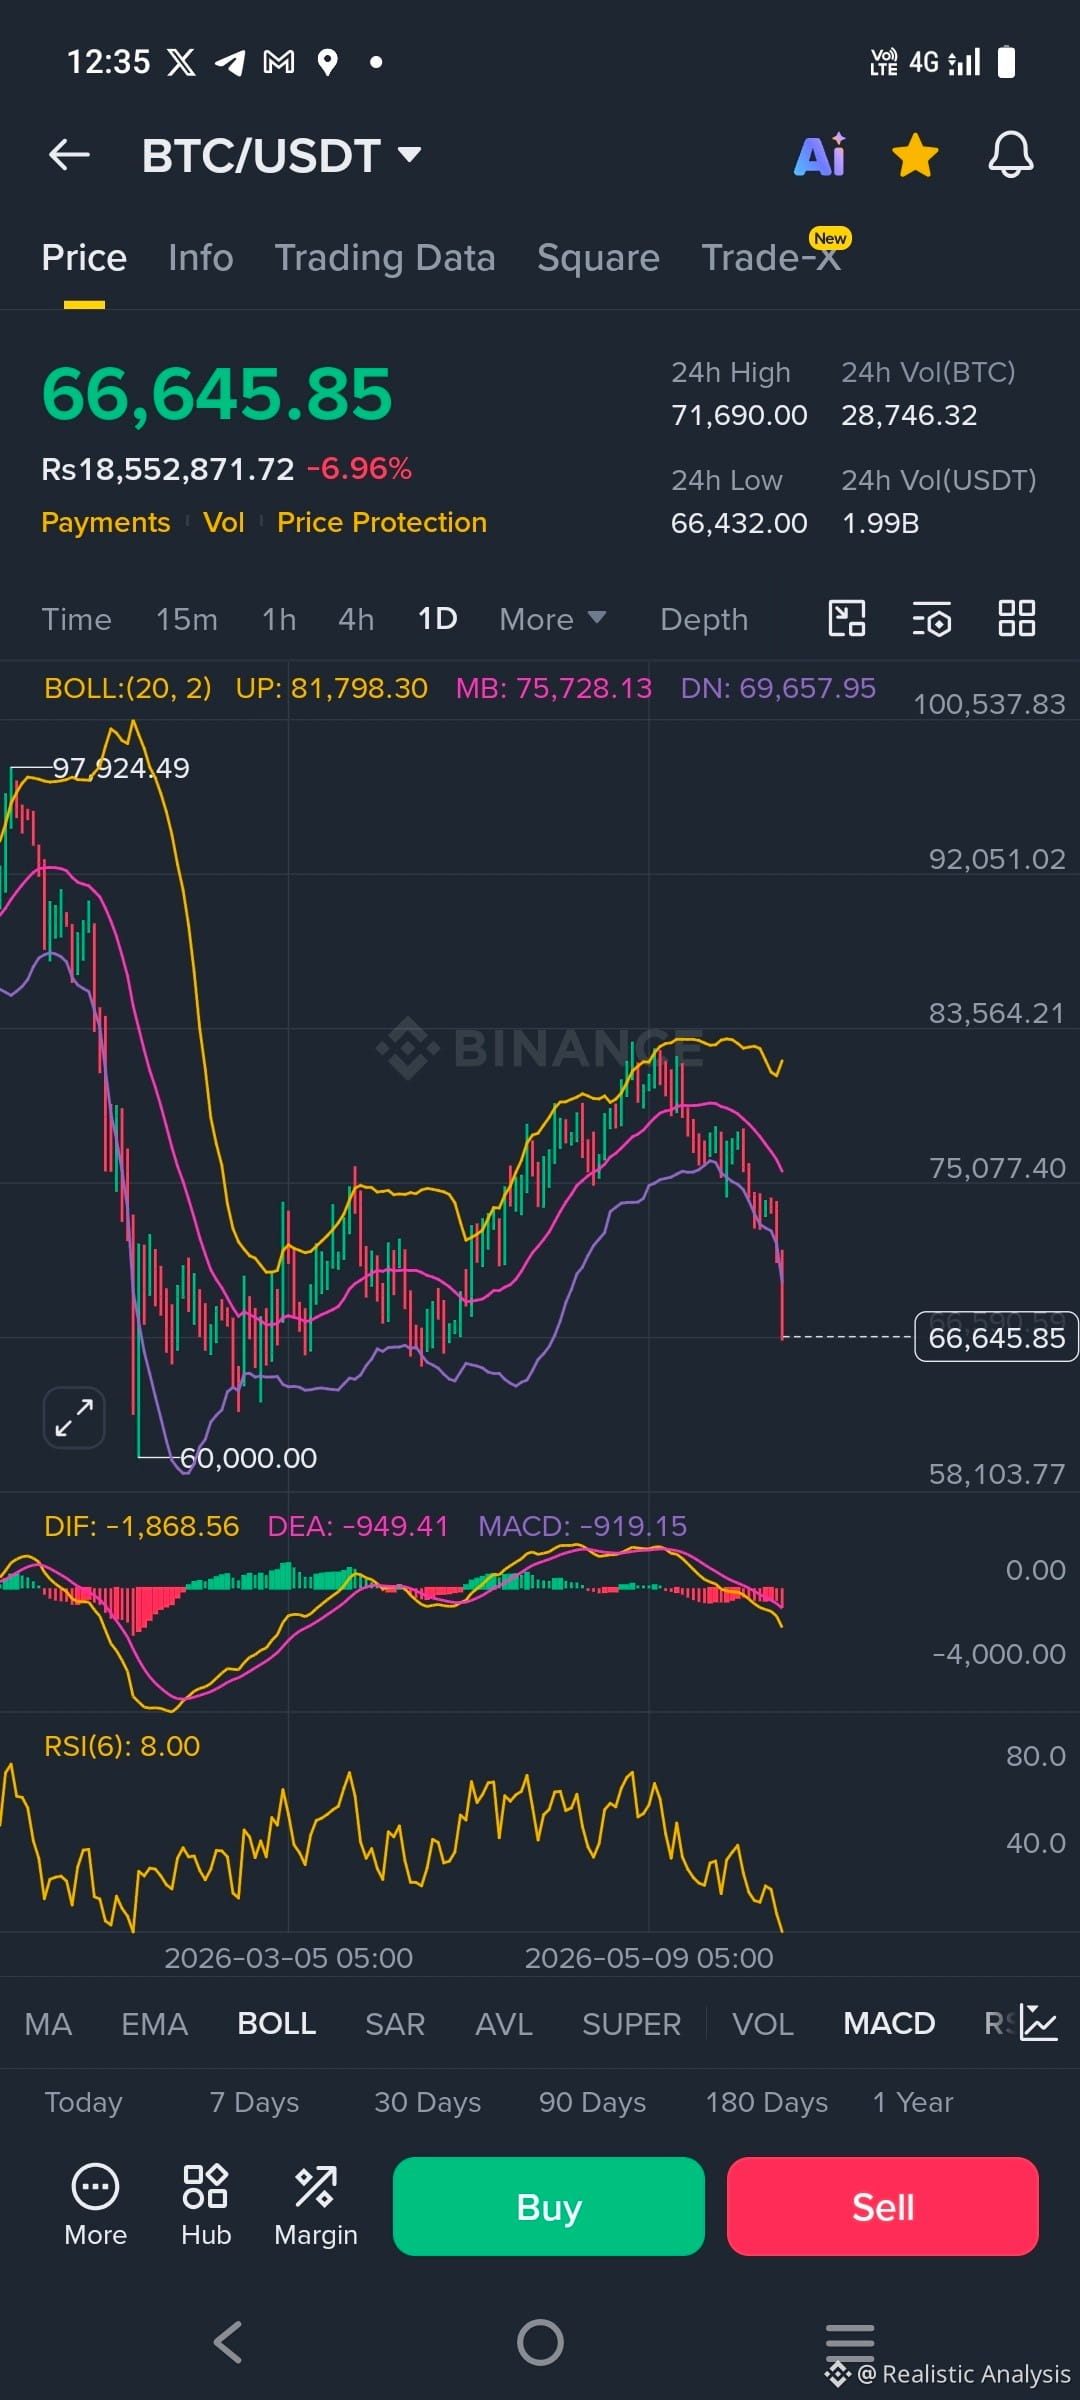
Now Compare these two Pictures what i was screaming when BTC touched at 82k said it's a bull trap be careful...
$BTC $BITCOIN #BTC #BitcoinBearish #CryptoTrends
Now Compare these two Pictures what i was screaming when BTC touched at 82k said it's a bull trap be careful...
$BTC $BITCOIN #BTC #BitcoinBearish #CryptoTrends
$BTC $BITCOIN #BTC #BitcoinBearish #CryptoTrends
1
2
220

·
--
Bullish
🚨 $BTC Trading Signal: Bearish Momentum building 🔴📉
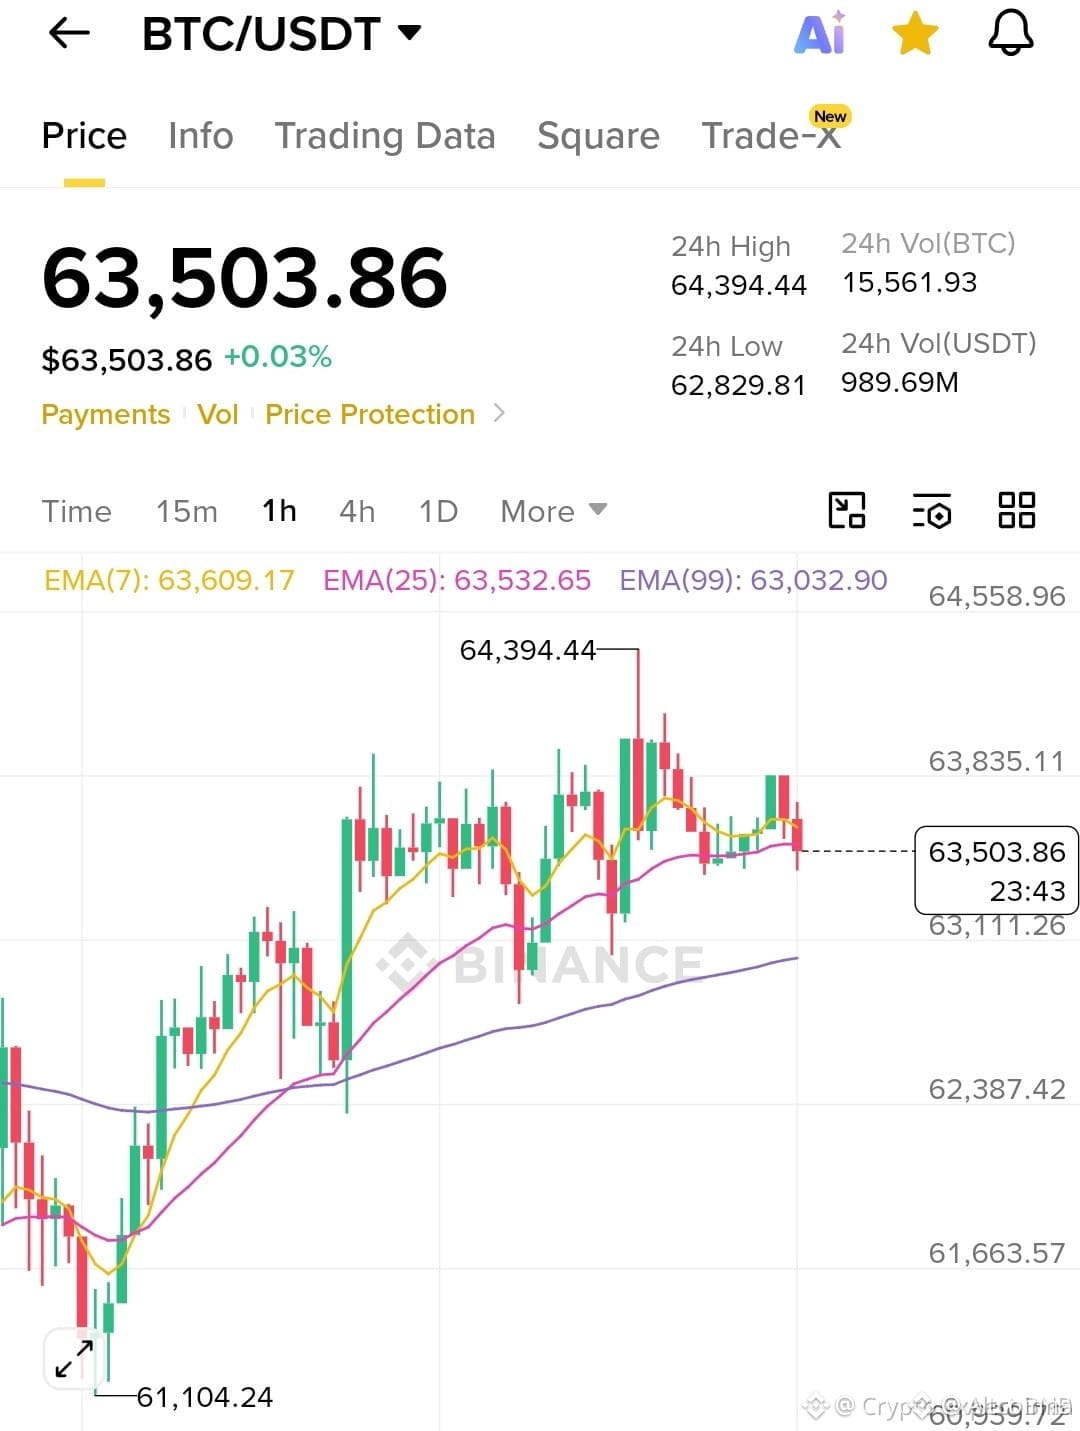
Bitcoin is exhibiting clear short-term weakness as strong overhead resistance holds firm at $63,500. A failure by bulls to reclaim these upper levels points toward an impending correction into lower support zones.
🔹 Short Entry Range: $63,300 – $63,800
🎯 Take Profit Targets: $62,000 → $60,000 → $57,500
🛑 Stop Loss: $65,000
Key Bearish Factors:
• Heavy selling pressure acting as a ceiling around $64K–$65K
• Clean lower-high market structure printing on shorter timeframes
• Fading momentum directly beneath major resistance zones
• A confirmed breakdown below $62K is highly likely to trigger accelerated liquidations. Manage your risk closely!
#BitcoinBearish #CryptoTradingSignals #BTCShort
🚨 $BTC Trading Signal: Bearish Momentum building 🔴📉
Bitcoin is exhibiting clear short-term weakness as strong overhead resistance holds firm at $63,500. A failure by bulls to reclaim these upper levels points toward an impending correction into lower support zones.
🔹 Short Entry Range: $63,300 – $63,800
🎯 Take Profit Targets: $62,000 → $60,000 → $57,500
🛑 Stop Loss: $65,000
Key Bearish Factors:
• Heavy selling pressure acting as a ceiling around $64K–$65K
• Clean lower-high market structure printing on shorter timeframes
• Fading momentum directly beneath major resistance zones
• A confirmed breakdown below $62K is highly likely to trigger accelerated liquidations. Manage your risk closely!
#BitcoinBearish #CryptoTradingSignals #BTCShort
Bitcoin is exhibiting clear short-term weakness as strong overhead resistance holds firm at $63,500. A failure by bulls to reclaim these upper levels points toward an impending correction into lower support zones.
🔹 Short Entry Range: $63,300 – $63,800
🎯 Take Profit Targets: $62,000 → $60,000 → $57,500
🛑 Stop Loss: $65,000
Key Bearish Factors:
• Heavy selling pressure acting as a ceiling around $64K–$65K
• Clean lower-high market structure printing on shorter timeframes
• Fading momentum directly beneath major resistance zones
• A confirmed breakdown below $62K is highly likely to trigger accelerated liquidations. Manage your risk closely!
#BitcoinBearish #CryptoTradingSignals #BTCShort
87

·
--
Bearish
Bitcoin is likely heading towards 70.000$BTC for support; if it breaks that, we could see it drop to 66.000$BTC
#BitcoinBearish
Bitcoin is likely heading towards 70.000$BTC for support; if it breaks that, we could see it drop to 66.000$BTC
#BitcoinBearish
#BitcoinBearish
1
146

·
--
Bearish
$BTC
{future}(BTCUSDT)
#BitcoinBearish after 1 hour exactly $BTC will go bearish
ENTRY: 64050
STOP LOSS: 64300
TAKE PROFIT: 63850
TAKE PROFIT2: 63740
$BTC
#BitcoinBearish after 1 hour exactly $BTC will go bearish
ENTRY: 64050
STOP LOSS: 64300
TAKE PROFIT: 63850
TAKE PROFIT2: 63740
#BitcoinBearish after 1 hour exactly $BTC will go bearish
ENTRY: 64050
STOP LOSS: 64300
TAKE PROFIT: 63850
TAKE PROFIT2: 63740
41

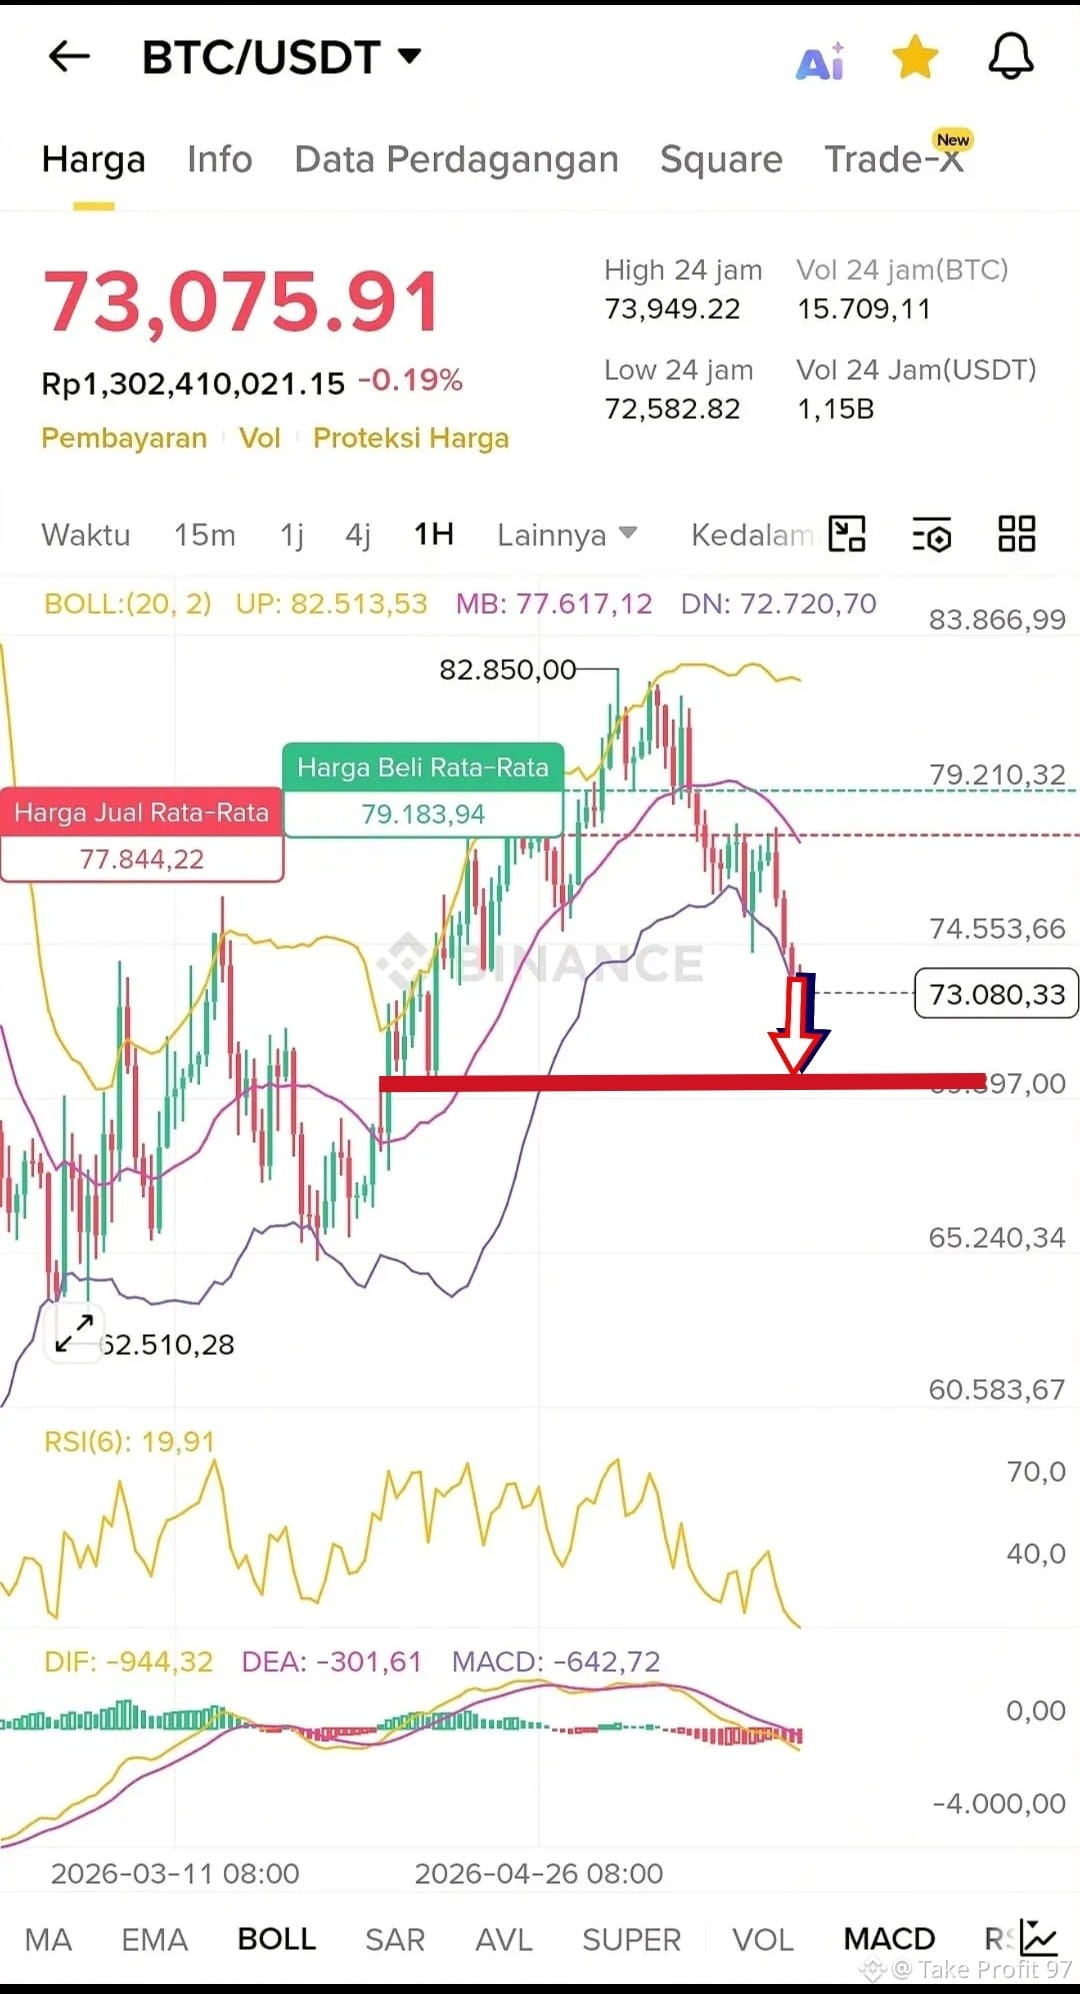
stay alert guys bitcoin didnt cross 82850 level but RSI broke the swing high. it could be sign of bearish continuation.
#bitconnews #BitcoinBearish
stay alert guys bitcoin didnt cross 82850 level but RSI broke the swing high. it could be sign of bearish continuation.
#bitconnews #BitcoinBearish
#bitconnews #BitcoinBearish
1
161

·
--
Bearish
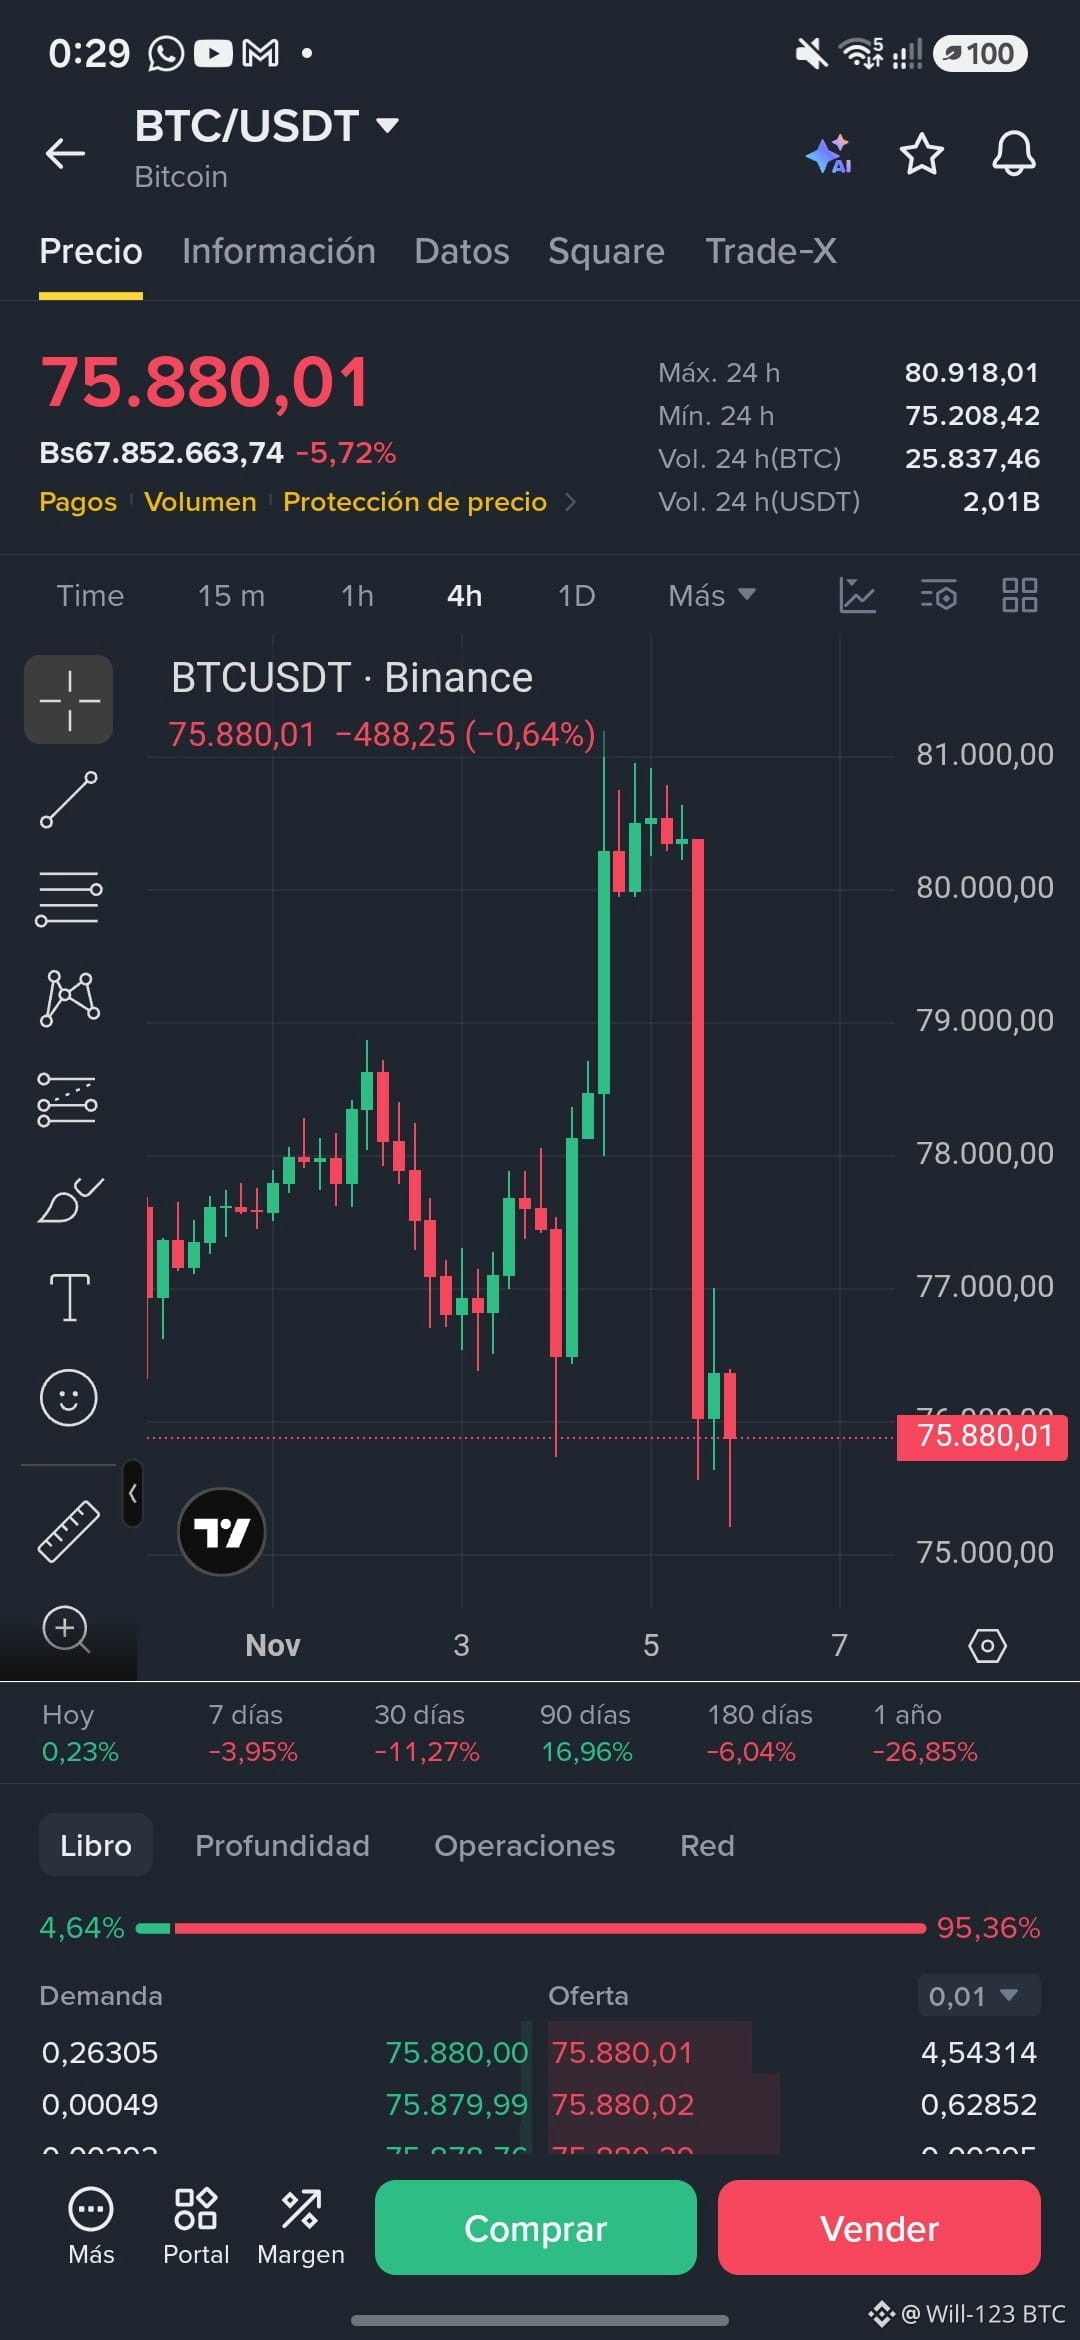
What are analysts saying about Bitcoin?
Will it be a bear trap, or is the long-awaited 15% or 20% correction coming? Markets are in the red today, along with the world's major real-world assets...
Some are talking about a global financial market reset??? Or is it simply the result of the U.S. MIDTERMS or the exploit that took place?
Leave me your comments ✅️
#USMidterms-WhatAreMarketsExpecting? #BitcoinBearish $BTC
{future}(BTCUSDT)
What are analysts saying about Bitcoin?
Will it be a bear trap, or is the long-awaited 15% or 20% correction coming? Markets are in the red today, along with the world's major real-world assets...
Some are talking about a global financial market reset??? Or is it simply the result of the U.S. MIDTERMS or the exploit that took place?
Leave me your comments ✅️
#USMidterms-WhatAreMarketsExpecting? #BitcoinBearish $BTC
Will it be a bear trap, or is the long-awaited 15% or 20% correction coming? Markets are in the red today, along with the world's major real-world assets...
Some are talking about a global financial market reset??? Or is it simply the result of the U.S. MIDTERMS or the exploit that took place?
Leave me your comments ✅️
#USMidterms-WhatAreMarketsExpecting? #BitcoinBearish $BTC
3
184

·
--

Article
Bitcoin Bearish Alert: Correction Targeting $66,000!The crypto market is showing high volatility, especially $BTC . Are you ready to face this correction, or are you seeing it as a buy the dip opportunity? Stay vigilant!
#BitcoinBearish #CryptoCorrection #btc66k #Badsignal #AnalisisCrypto
Bitcoin Bearish Alert: Correction Targeting $66,000!
The crypto market is showing high volatility, especially $BTC . Are you ready to face this correction, or are you seeing it as a buy the dip opportunity? Stay vigilant!
#BitcoinBearish #CryptoCorrection #btc66k #Badsignal #AnalisisCrypto
#BitcoinBearish #CryptoCorrection #btc66k #Badsignal #AnalisisCrypto
204

·
--
Bearish
🚨 BEAR ALERT: Is the $BTC Bounce a Trap? 📉🛑
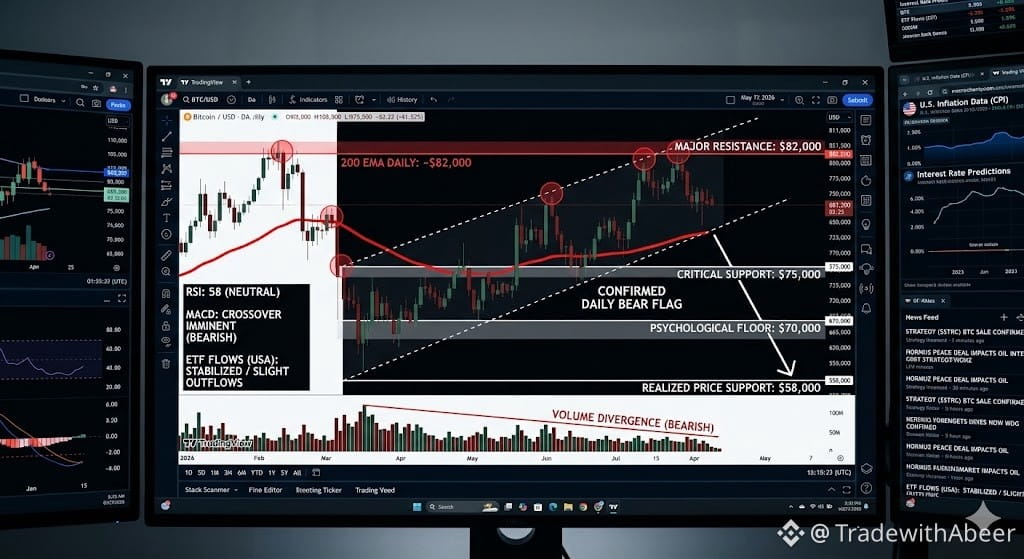
While the market eyes a recovery, the technical data for Bitcoin ($BTC ) today, May 7, 2026, suggests we might be walking into a "Bear Flag" trap. The "Digital Gold" is facing a fierce rejection at the ultimate resistance level.
📊 The Bearish Breakdown:
The 200 EMA Wall: $BTC is struggling to break the $82,000 level. This 200-day EMA has rejected every rally for the last seven months—until we close above it, the bears are in control.
The "Bear Flag" Pattern: Analysts are tracking an ascending channel that looks like a classic bear flag. If this breaks to the downside, we could see a rapid slide.
Drying Liquidity: Price is grinding up, but trading volume is falling. This "divergence" usually ends in a sharp correction.
Corporate Sell Pressure: With giants like Strategy signaling potential sales to fund STRC dividends, the "Hold" wall is facing its first real test.
⚠️ Critical Danger Zones:
$75,000: The immediate decision zone. Losing this confirms the short-term top.
$70,000: The psychological floor. A break here could trigger a cascade toward $66,000.
$58,000: The ultimate bear target if the flag pattern fully plays out this summer.
The Verdict: The trend is your friend until the end, and right now, the macro trend is pointing south. Are you "buying the dip" or "waiting for the slip"? 🐻🤔
#BTC #BitcoinBearish #CryptoAnalysis2026 #BinanceSquare #MichaelSaylor #TradingStrategy #BearMarket
{future}(BTCUSDT)
🚨 BEAR ALERT: Is the $BTC Bounce a Trap? 📉🛑
While the market eyes a recovery, the technical data for Bitcoin ($BTC ) today, May 7, 2026, suggests we might be walking into a "Bear Flag" trap. The "Digital Gold" is facing a fierce rejection at the ultimate resistance level.
📊 The Bearish Breakdown:
The 200 EMA Wall: $BTC is struggling to break the $82,000 level. This 200-day EMA has rejected every rally for the last seven months—until we close above it, the bears are in control.
The "Bear Flag" Pattern: Analysts are tracking an ascending channel that looks like a classic bear flag. If this breaks to the downside, we could see a rapid slide.
Drying Liquidity: Price is grinding up, but trading volume is falling. This "divergence" usually ends in a sharp correction.
Corporate Sell Pressure: With giants like Strategy signaling potential sales to fund STRC dividends, the "Hold" wall is facing its first real test.
⚠️ Critical Danger Zones:
$75,000: The immediate decision zone. Losing this confirms the short-term top.
$70,000: The psychological floor. A break here could trigger a cascade toward $66,000.
$58,000: The ultimate bear target if the flag pattern fully plays out this summer.
The Verdict: The trend is your friend until the end, and right now, the macro trend is pointing south. Are you "buying the dip" or "waiting for the slip"? 🐻🤔
#BTC #BitcoinBearish #CryptoAnalysis2026 #BinanceSquare #MichaelSaylor #TradingStrategy #BearMarket
While the market eyes a recovery, the technical data for Bitcoin ($BTC ) today, May 7, 2026, suggests we might be walking into a "Bear Flag" trap. The "Digital Gold" is facing a fierce rejection at the ultimate resistance level.
📊 The Bearish Breakdown:
The 200 EMA Wall: $BTC is struggling to break the $82,000 level. This 200-day EMA has rejected every rally for the last seven months—until we close above it, the bears are in control.
The "Bear Flag" Pattern: Analysts are tracking an ascending channel that looks like a classic bear flag. If this breaks to the downside, we could see a rapid slide.
Drying Liquidity: Price is grinding up, but trading volume is falling. This "divergence" usually ends in a sharp correction.
Corporate Sell Pressure: With giants like Strategy signaling potential sales to fund STRC dividends, the "Hold" wall is facing its first real test.
⚠️ Critical Danger Zones:
$75,000: The immediate decision zone. Losing this confirms the short-term top.
$70,000: The psychological floor. A break here could trigger a cascade toward $66,000.
$58,000: The ultimate bear target if the flag pattern fully plays out this summer.
The Verdict: The trend is your friend until the end, and right now, the macro trend is pointing south. Are you "buying the dip" or "waiting for the slip"? 🐻🤔
#BTC #BitcoinBearish #CryptoAnalysis2026 #BinanceSquare #MichaelSaylor #TradingStrategy #BearMarket
108
Log in to explore more content
Join global crypto users on Binance Square
⚡️ Get latest and useful information about crypto.
💬 Trusted by the world’s largest crypto exchange.
👍 Discover real insights from verified creators.
Email / Phone number
Trending Topics
1
#NvidiaEarningsTonight:AIStocks’NextMove?
27,279 views
467 Discussing
2
#A Packed Week of Earnings and Data Tests Markets
109,047 views
560 Discussing
3
#AnthropicIPOTestsInvestorAppetiteForAI
228,794 views
2,279 Discussing
4
#NvidiaBoardNotConsideringHuang’sReturnasCEO
52,476 views
579 Discussing
5
#KOSPIFalls2.59%ToLowestCloseSinceFebruary
101 views
22 Discussing
6
#AnthropicClearedToListOnNasdaqAsANT
1,068 views
49 Discussing
7
#WhatInvestmentSignalsDo13FFilingsReveal?
30,026 views
437 Discussing
8
#EvernorthRecords$505MImpairmentOnPreListingXRP
679 views
14 Discussing
9
#GoldmanSachsReports$1.22BInEtherETFHoldings
541 views
8 Discussing
10
#GoldmanSachsAndMillenniumEachHeldOver$1.2BInBitcoinETFs
4,821 views
12 Discussing