
#binacehodlermmt
binacehodlermmt
222 views
5 Discussing
Hot
Latest

·
--
$BTC
{spot}(BTCUSDT)
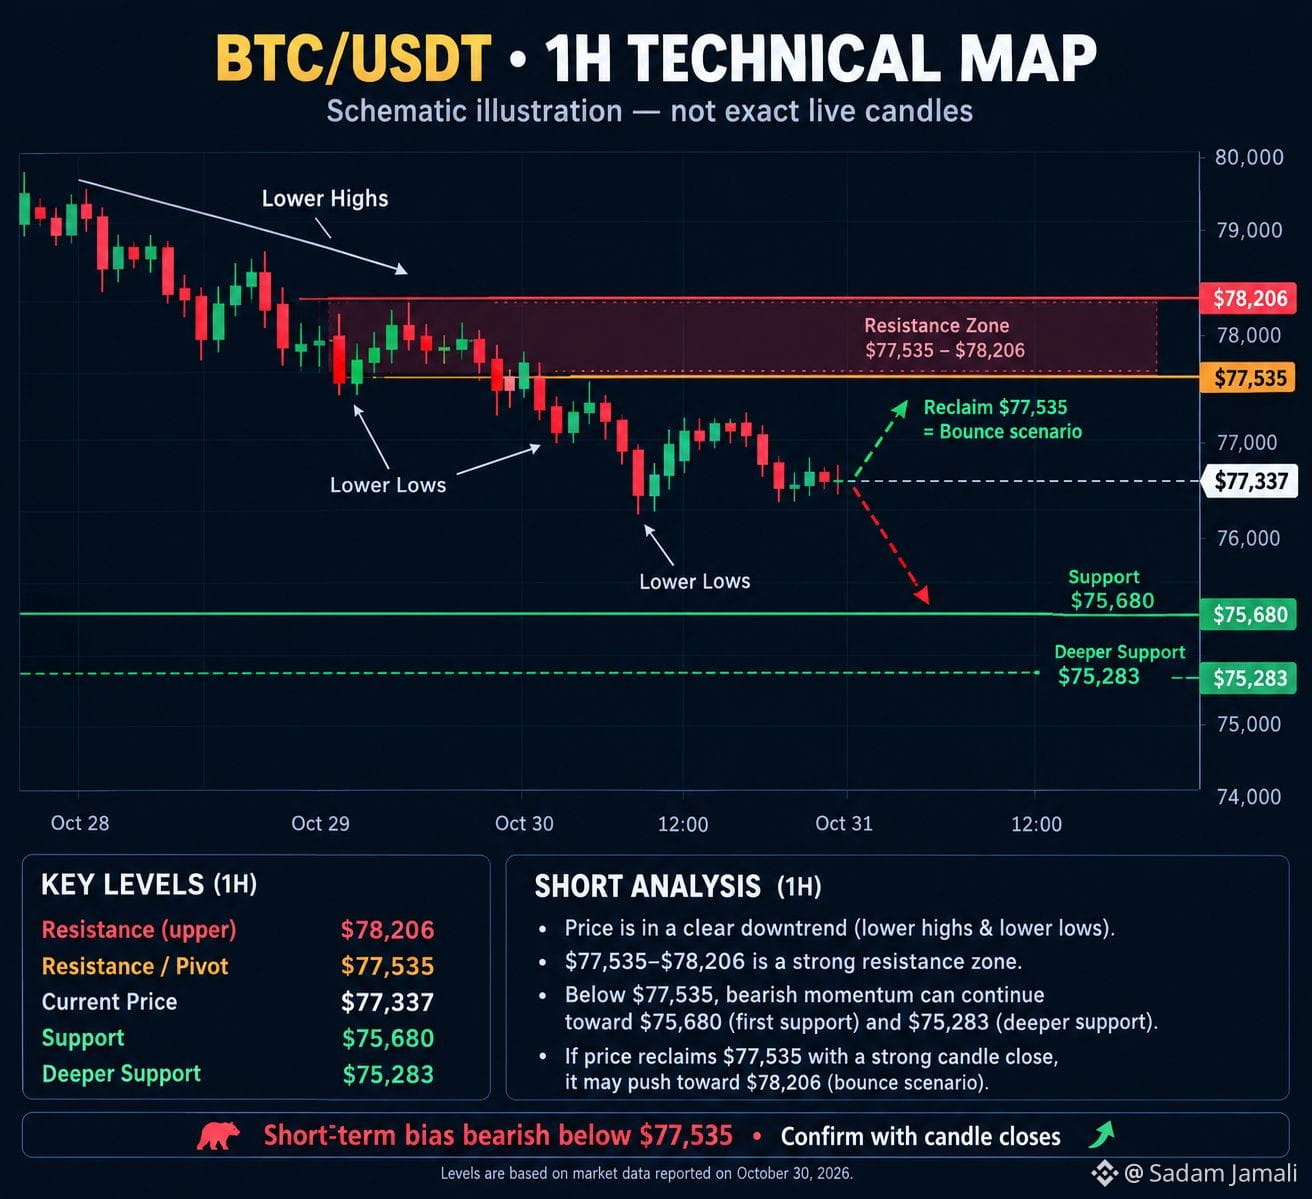
#ADPJobsSurge✨ #BinaceHODLerMMT #PrivacyCoinSurge BTC/USDT — 1H Technical Analysis
30 October 2026 | Short-term bias: Bearish 📉
Bitcoin is trading around $77,300–$77,800 in the latest market data I found. The short-term picture leans bearish, with selling pressure and weak momentum.
Key levels to watch:
Resistance: $77,535, then $78,200.
Support: $75,680, then $75,280.
Bullish possibility: Price reclaims resistance and holds above it.
Bearish possibility: Price remains below resistance and breaks support.
These are reference levels, not guaranteed price targets.
Chart reading: The chart above is a schematic based on reported market levels, not an exact live Binance chart.
For learning technical analysis, focus on these three things:
Market structure: Lower highs and lower lows indicate a downtrend.
Support and resistance: Watch how price behaves around the marked zones.
Confirmation: A candle closing beyond a level is more informative than a brief wick through it.
Bitcoin can reverse quickly, so treat these levels as observations rather than predictions.
$BTC
#ADPJobsSurge✨ #BinaceHODLerMMT #PrivacyCoinSurge BTC/USDT — 1H Technical Analysis
30 October 2026 | Short-term bias: Bearish 📉
Bitcoin is trading around $77,300–$77,800 in the latest market data I found. The short-term picture leans bearish, with selling pressure and weak momentum.
Key levels to watch:
Resistance: $77,535, then $78,200.
Support: $75,680, then $75,280.
Bullish possibility: Price reclaims resistance and holds above it.
Bearish possibility: Price remains below resistance and breaks support.
These are reference levels, not guaranteed price targets.
Chart reading: The chart above is a schematic based on reported market levels, not an exact live Binance chart.
For learning technical analysis, focus on these three things:
Market structure: Lower highs and lower lows indicate a downtrend.
Support and resistance: Watch how price behaves around the marked zones.
Confirmation: A candle closing beyond a level is more informative than a brief wick through it.
Bitcoin can reverse quickly, so treat these levels as observations rather than predictions.
#ADPJobsSurge✨ #BinaceHODLerMMT #PrivacyCoinSurge BTC/USDT — 1H Technical Analysis
30 October 2026 | Short-term bias: Bearish 📉
Bitcoin is trading around $77,300–$77,800 in the latest market data I found. The short-term picture leans bearish, with selling pressure and weak momentum.
Key levels to watch:
Resistance: $77,535, then $78,200.
Support: $75,680, then $75,280.
Bullish possibility: Price reclaims resistance and holds above it.
Bearish possibility: Price remains below resistance and breaks support.
These are reference levels, not guaranteed price targets.
Chart reading: The chart above is a schematic based on reported market levels, not an exact live Binance chart.
For learning technical analysis, focus on these three things:
Market structure: Lower highs and lower lows indicate a downtrend.
Support and resistance: Watch how price behaves around the marked zones.
Confirmation: A candle closing beyond a level is more informative than a brief wick through it.
Bitcoin can reverse quickly, so treat these levels as observations rather than predictions.
70

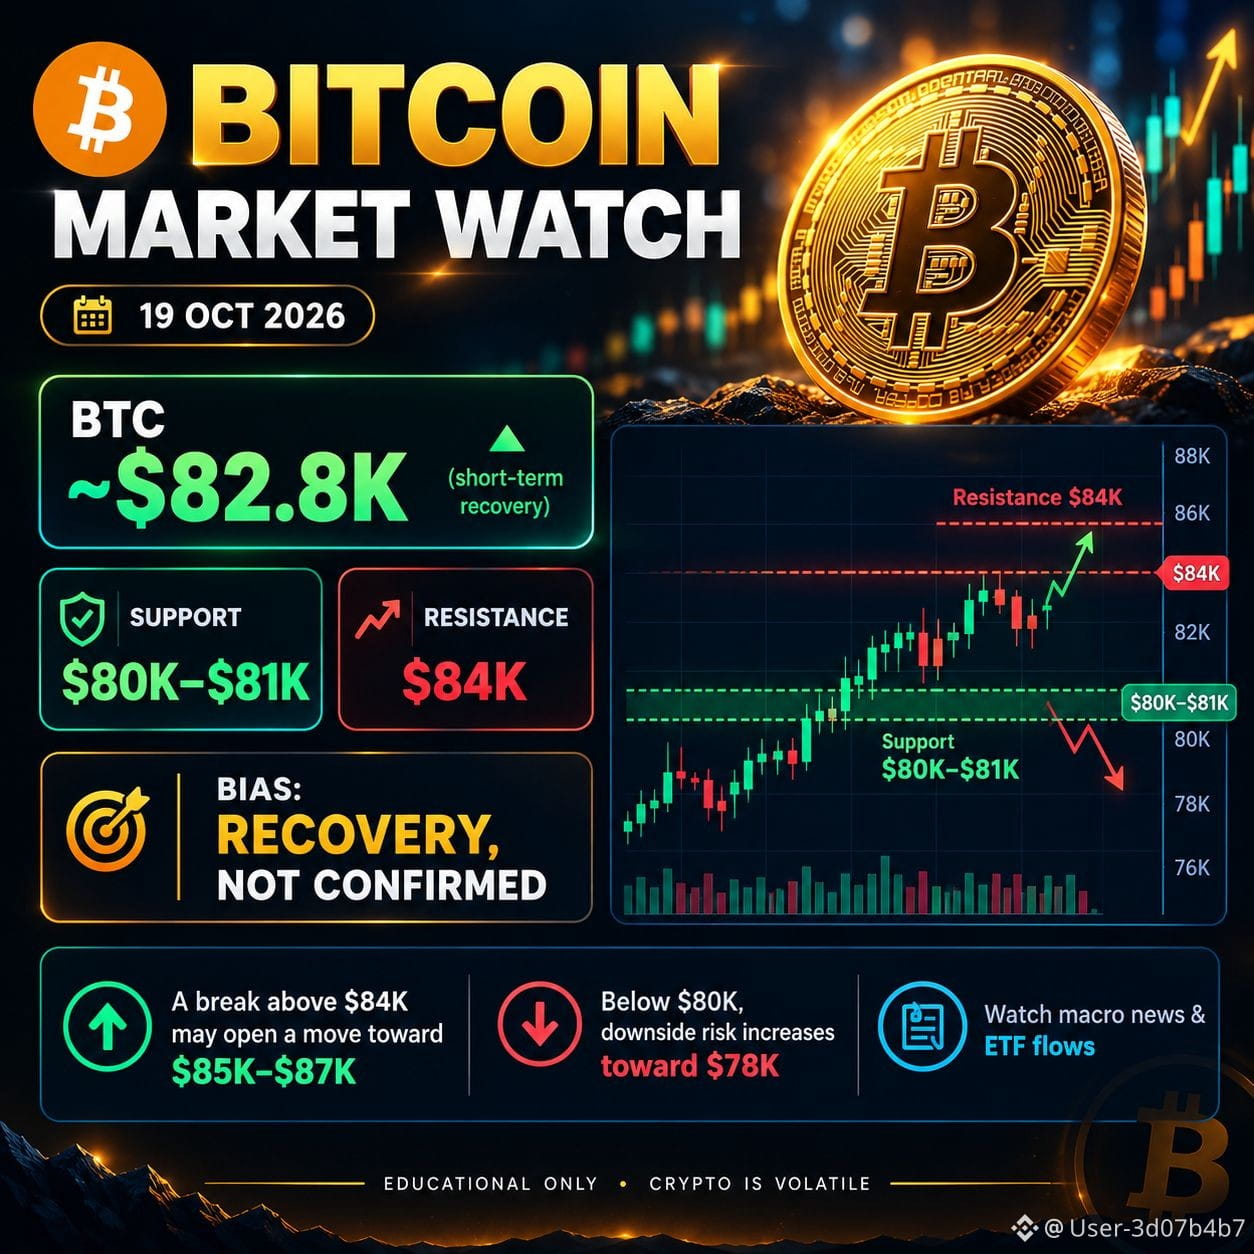
$BTC : ~$82.8K | Support: $80K–$81K | Resistance: $84K
The short-term outlook is a recovery, but confirmation above $84K is important. A breakout could open the way toward $85K–$87K, while a drop below $80K would increase downside risk.
Educational purposes only — crypto is volatile.
#ADPJobsSurge #BinaceHODLerMMT #PrivacyCoinSurge
{spot}(BTCUSDT)
$BTC : ~$82.8K | Support: $80K–$81K | Resistance: $84K
The short-term outlook is a recovery, but confirmation above $84K is important. A breakout could open the way toward $85K–$87K, while a drop below $80K would increase downside risk.
Educational purposes only — crypto is volatile.
#ADPJobsSurge #BinaceHODLerMMT #PrivacyCoinSurge
The short-term outlook is a recovery, but confirmation above $84K is important. A breakout could open the way toward $85K–$87K, while a drop below $80K would increase downside risk.
Educational purposes only — crypto is volatile.
#ADPJobsSurge #BinaceHODLerMMT #PrivacyCoinSurge
87

·
--
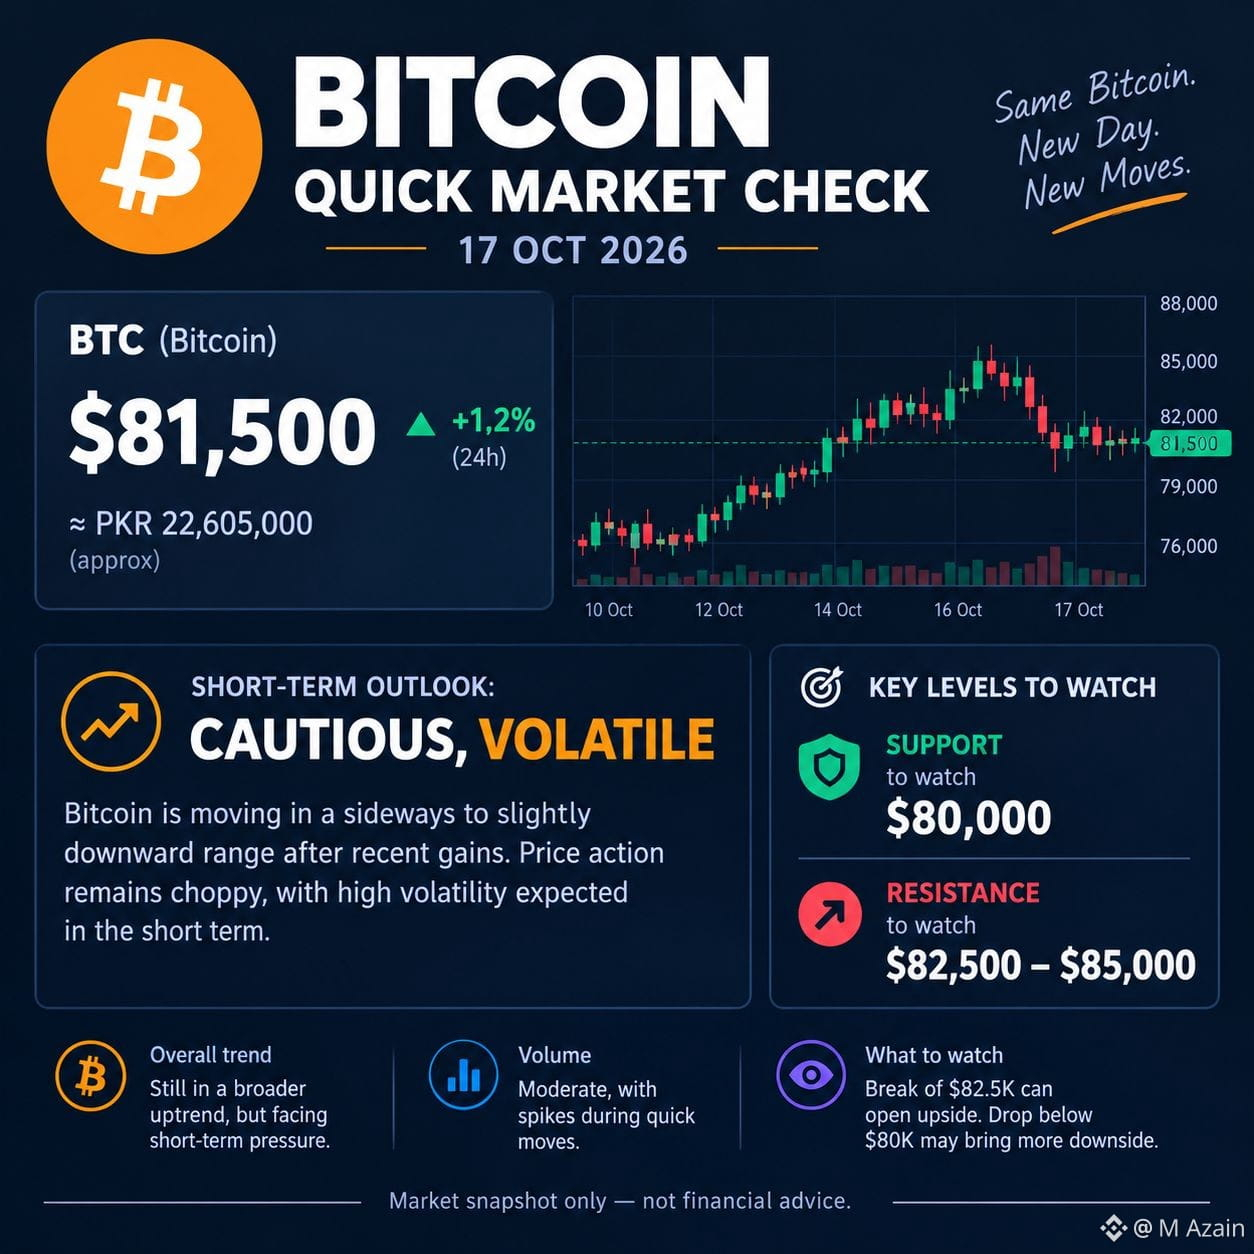
$BTC Price: Approximately $81,500 per Bitcoin.
Market trend: Volatile; Bitcoin recently dropped near $80,000 before recovering.
Key levels: $80,000 is an important level to watch; $82,500 is a nearby resistance level.
Outlook: Uncertain. The price could rise or fall, so short-term predictions are unreliable.
{spot}(BTCUSDT)
#ADPJosurge #BinaceHODLerMMT #PrivacyCoinSurge
$BTC Price: Approximately $81,500 per Bitcoin.
Market trend: Volatile; Bitcoin recently dropped near $80,000 before recovering.
Key levels: $80,000 is an important level to watch; $82,500 is a nearby resistance level.
Outlook: Uncertain. The price could rise or fall, so short-term predictions are unreliable.
#ADPJosurge #BinaceHODLerMMT #PrivacyCoinSurge
Market trend: Volatile; Bitcoin recently dropped near $80,000 before recovering.
Key levels: $80,000 is an important level to watch; $82,500 is a nearby resistance level.
Outlook: Uncertain. The price could rise or fall, so short-term predictions are unreliable.
#ADPJosurge #BinaceHODLerMMT #PrivacyCoinSurge
495

$TRUMP token’s market cap went over $2.1 billion, with the price at $2.11, up 23% in the last day. Trading volume in 24 hours was about $2.7 million, according to Foresight News. They also warned that meme coins like this can be very risky and don’t always have real value.
#TRUMP #BinaceHODLerMMT
#ADPJobsSurge
{spot}(TRUMPUSDT)
$TRUMP token’s market cap went over $2.1 billion, with the price at $2.11, up 23% in the last day. Trading volume in 24 hours was about $2.7 million, according to Foresight News. They also warned that meme coins like this can be very risky and don’t always have real value.
#TRUMP #BinaceHODLerMMT
#ADPJobsSurge
#TRUMP #BinaceHODLerMMT
#ADPJobsSurge
133
Log in to explore more content
Join global crypto users on Binance Square
⚡️ Get latest and useful information about crypto.
💬 Trusted by the world’s largest crypto exchange.
👍 Discover real insights from verified creators.
Email / Phone number
Trending Topics
1
#BinanceWithdrawalScamWarning
16,586 views
440 Discussing
2
#USMidtermElections
568,456 views
3,007 Discussing
3
#USOctoberNFP-AreRateCutsStillPossible
24,886 views
407 Discussing
4
#AppleEarningsAhead-CanStockHitNewHigh
8,234 views
294 Discussing
5
#Verify1to1BinanceReserves
23,133 views
328 Discussing
6
#BinanceRestores28FiatWithdrawals
107,082 views
960 Discussing
7
#StrategyRepurchases$208MSTRCAdds811Bitcoin
4,293 views
15 Discussing
8
#FATFLaunchesReviewOfCryptoHubsMoneyLaunderingControls
515 views
9 Discussing
9
#BinanceProcesses$4.65BWithdrawals
100,296 views
358 Discussing
10
#HKMALaunchesSAGEAgenticFinanceProject
2,997 views
154 Discussing