
#btcusd
btcusd
3M views
3,720 Discussing
Hot
Latest

BITCOIN IS AT A CRITICAL TURNING POINT WHAT COMES NEXT? 🚨⚠️
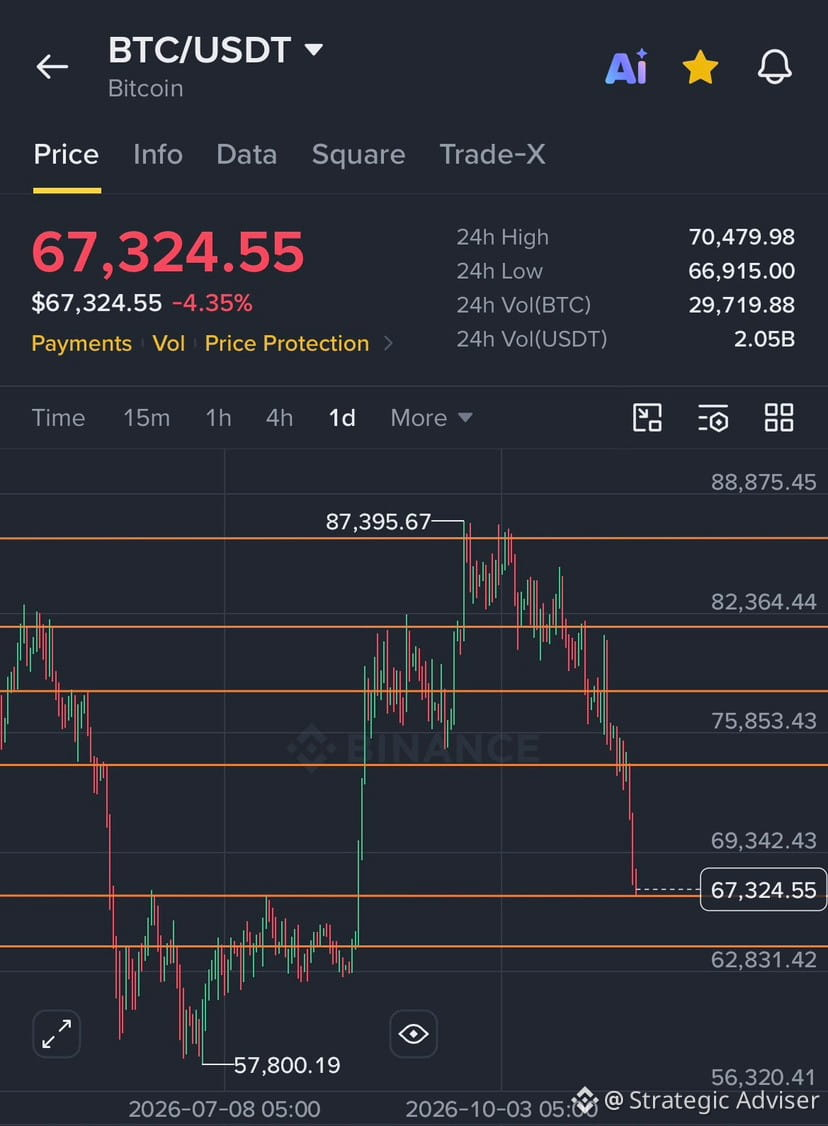
If you look at Bitcoin’s daily chart, BTC is already down around 30% from $87K and continues to decline. It’s possible that BTC could reach $64K if it fails to hold the $66K area. The last major support zone is between $62K and $64K.
Although the PPI data wasn’t bad, the market is still continuously dropping despite that.
Many people are now expecting Bitcoin to drop to $20K, $30K, or even $40K. Personally, I think such a massive decline could take time. Anything is possible in this market, but I believe BTC should find support around $62K / $64K and then experience a corrective pump of around 5%–10%.
The reason is simple: the market needs to stabilize before another major move. A corrective pump could also create another opportunity to trap traders. From a technical perspective, this scenario makes sense because after such aggressive drops, markets usually experience corrective movements.
I’m still bearish myself, but what concerns me is that we haven’t seen a proper corrective move yet. The bigger question is: from which price area will Bitcoin bounce and start liquidating short positions?
Another important thing I’m watching is the Bull Market Support Band on the daily and weekly charts. Its position relative to the $62K $64K support zone will be crucial. If Bitcoin approaches this area, I’ll be watching closely to see whether the band acts as resistance or whether BTC can reclaim it and turn it into support. This could help us understand whether the market is preparing for a corrective recovery or another leg down.
Anyway, I’m keeping a close eye on every market movement. Anyone who needs personal guidance can let me know.
#BTCUSD #USPPIMissMayEaseBTCPressure #cryptocurrency
BITCOIN IS AT A CRITICAL TURNING POINT WHAT COMES NEXT? 🚨⚠️
If you look at Bitcoin’s daily chart, BTC is already down around 30% from $87K and continues to decline. It’s possible that BTC could reach $64K if it fails to hold the $66K area. The last major support zone is between $62K and $64K.
Although the PPI data wasn’t bad, the market is still continuously dropping despite that.
Many people are now expecting Bitcoin to drop to $20K, $30K, or even $40K. Personally, I think such a massive decline could take time. Anything is possible in this market, but I believe BTC should find support around $62K / $64K and then experience a corrective pump of around 5%–10%.
The reason is simple: the market needs to stabilize before another major move. A corrective pump could also create another opportunity to trap traders. From a technical perspective, this scenario makes sense because after such aggressive drops, markets usually experience corrective movements.
I’m still bearish myself, but what concerns me is that we haven’t seen a proper corrective move yet. The bigger question is: from which price area will Bitcoin bounce and start liquidating short positions?
Another important thing I’m watching is the Bull Market Support Band on the daily and weekly charts. Its position relative to the $62K $64K support zone will be crucial. If Bitcoin approaches this area, I’ll be watching closely to see whether the band acts as resistance or whether BTC can reclaim it and turn it into support. This could help us understand whether the market is preparing for a corrective recovery or another leg down.
Anyway, I’m keeping a close eye on every market movement. Anyone who needs personal guidance can let me know.
#BTCUSD #USPPIMissMayEaseBTCPressure #cryptocurrency
If you look at Bitcoin’s daily chart, BTC is already down around 30% from $87K and continues to decline. It’s possible that BTC could reach $64K if it fails to hold the $66K area. The last major support zone is between $62K and $64K.
Although the PPI data wasn’t bad, the market is still continuously dropping despite that.
Many people are now expecting Bitcoin to drop to $20K, $30K, or even $40K. Personally, I think such a massive decline could take time. Anything is possible in this market, but I believe BTC should find support around $62K / $64K and then experience a corrective pump of around 5%–10%.
The reason is simple: the market needs to stabilize before another major move. A corrective pump could also create another opportunity to trap traders. From a technical perspective, this scenario makes sense because after such aggressive drops, markets usually experience corrective movements.
I’m still bearish myself, but what concerns me is that we haven’t seen a proper corrective move yet. The bigger question is: from which price area will Bitcoin bounce and start liquidating short positions?
Another important thing I’m watching is the Bull Market Support Band on the daily and weekly charts. Its position relative to the $62K $64K support zone will be crucial. If Bitcoin approaches this area, I’ll be watching closely to see whether the band acts as resistance or whether BTC can reclaim it and turn it into support. This could help us understand whether the market is preparing for a corrective recovery or another leg down.
Anyway, I’m keeping a close eye on every market movement. Anyone who needs personal guidance can let me know.
#BTCUSD #USPPIMissMayEaseBTCPressure #cryptocurrency
BTC King BD:
❤️❤️❤️❤️❤️
1
796

🚨 BITCOIN (BTC) — BEARS ARE TAKING CONTROL! 📉
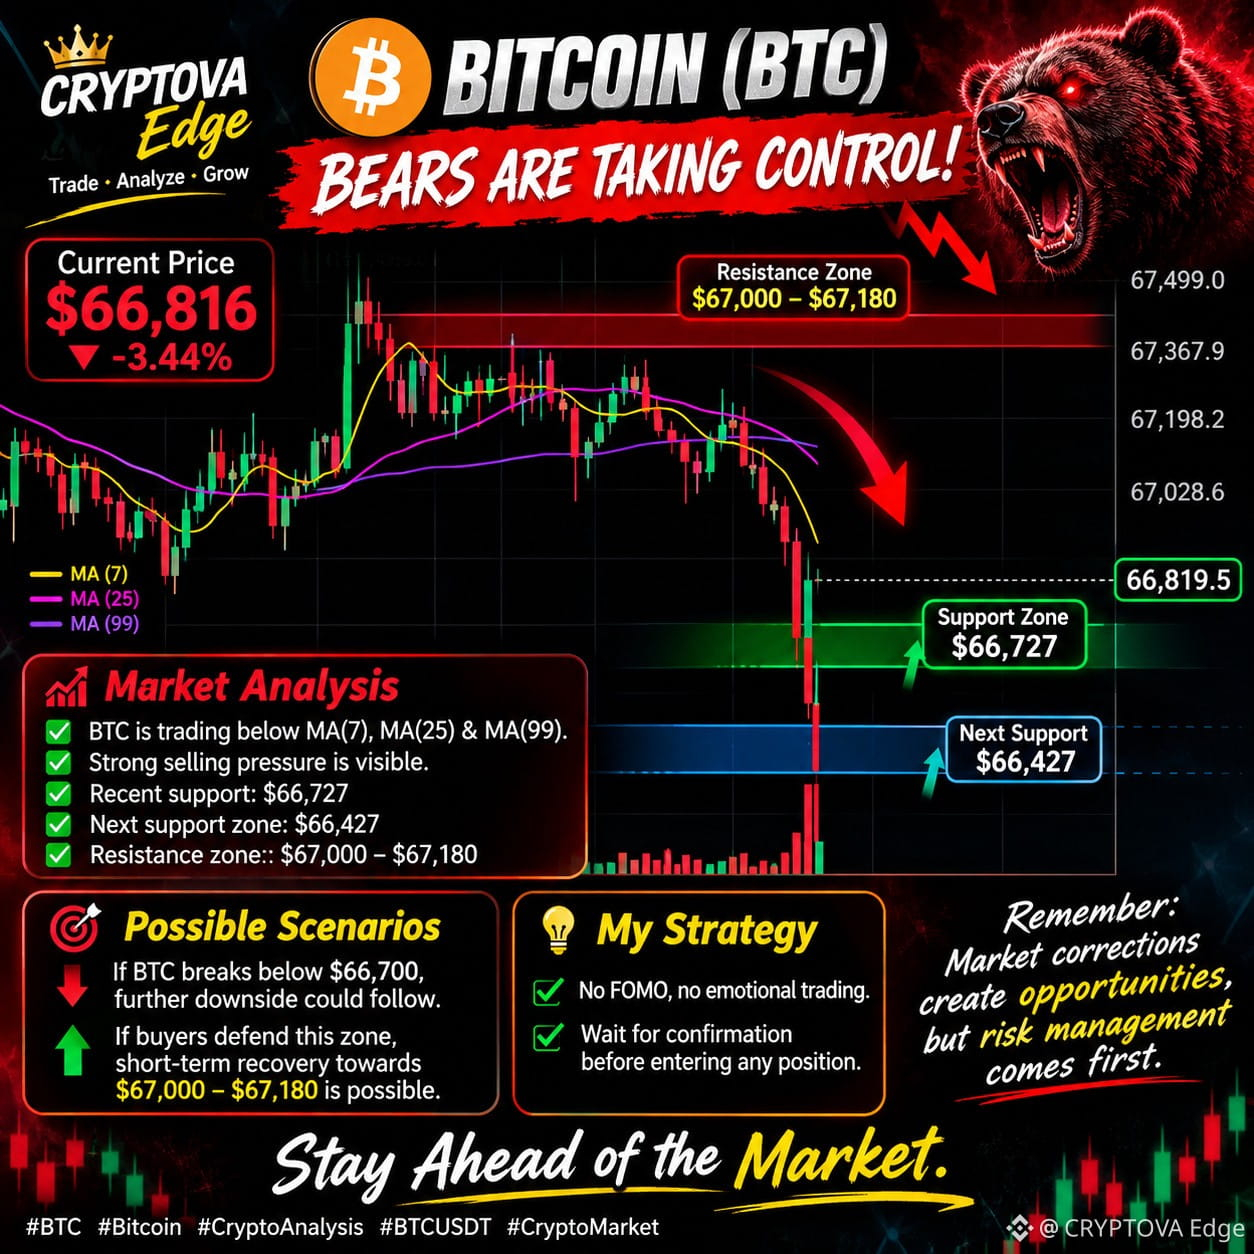
Bitcoin is currently trading around $66,816, down approximately 3.44%.
🔴 Market Analysis (5M Chart)
• BTC is trading below MA(7), MA(25) & MA(99). • Strong selling pressure is visible. • Recent support: $66,727 • Next support zone: $66,427 • Resistance zone: $67,000 – $67,180
📉 Possible Scenarios: If BTC breaks below $66,700, further downside could follow.
If buyers defend this zone, a short-term recovery towards $67,000–$67,180 is possible.
⚠️ My Strategy: No FOMO, no emotional trading. Wait for confirmation before entering any position.
Remember: Market corrections create opportunities, but risk management comes first.
🔥 CRYPTOVA Edge | Stay Ahead of the Market.
#BTC #Bitcoin #CryptoAnalysis #BTCUSD T #CryptoMarket
🚨 BITCOIN (BTC) — BEARS ARE TAKING CONTROL! 📉
Bitcoin is currently trading around $66,816, down approximately 3.44%.
🔴 Market Analysis (5M Chart)
• BTC is trading below MA(7), MA(25) & MA(99). • Strong selling pressure is visible. • Recent support: $66,727 • Next support zone: $66,427 • Resistance zone: $67,000 – $67,180
📉 Possible Scenarios: If BTC breaks below $66,700, further downside could follow.
If buyers defend this zone, a short-term recovery towards $67,000–$67,180 is possible.
⚠️ My Strategy: No FOMO, no emotional trading. Wait for confirmation before entering any position.
Remember: Market corrections create opportunities, but risk management comes first.
🔥 CRYPTOVA Edge | Stay Ahead of the Market.
#BTC #Bitcoin #CryptoAnalysis #BTCUSD T #CryptoMarket
Bitcoin is currently trading around $66,816, down approximately 3.44%.
🔴 Market Analysis (5M Chart)
• BTC is trading below MA(7), MA(25) & MA(99). • Strong selling pressure is visible. • Recent support: $66,727 • Next support zone: $66,427 • Resistance zone: $67,000 – $67,180
📉 Possible Scenarios: If BTC breaks below $66,700, further downside could follow.
If buyers defend this zone, a short-term recovery towards $67,000–$67,180 is possible.
⚠️ My Strategy: No FOMO, no emotional trading. Wait for confirmation before entering any position.
Remember: Market corrections create opportunities, but risk management comes first.
🔥 CRYPTOVA Edge | Stay Ahead of the Market.
#BTC #Bitcoin #CryptoAnalysis #BTCUSD T #CryptoMarket
1
81

·
--
#BTCUSD long-term buy plan
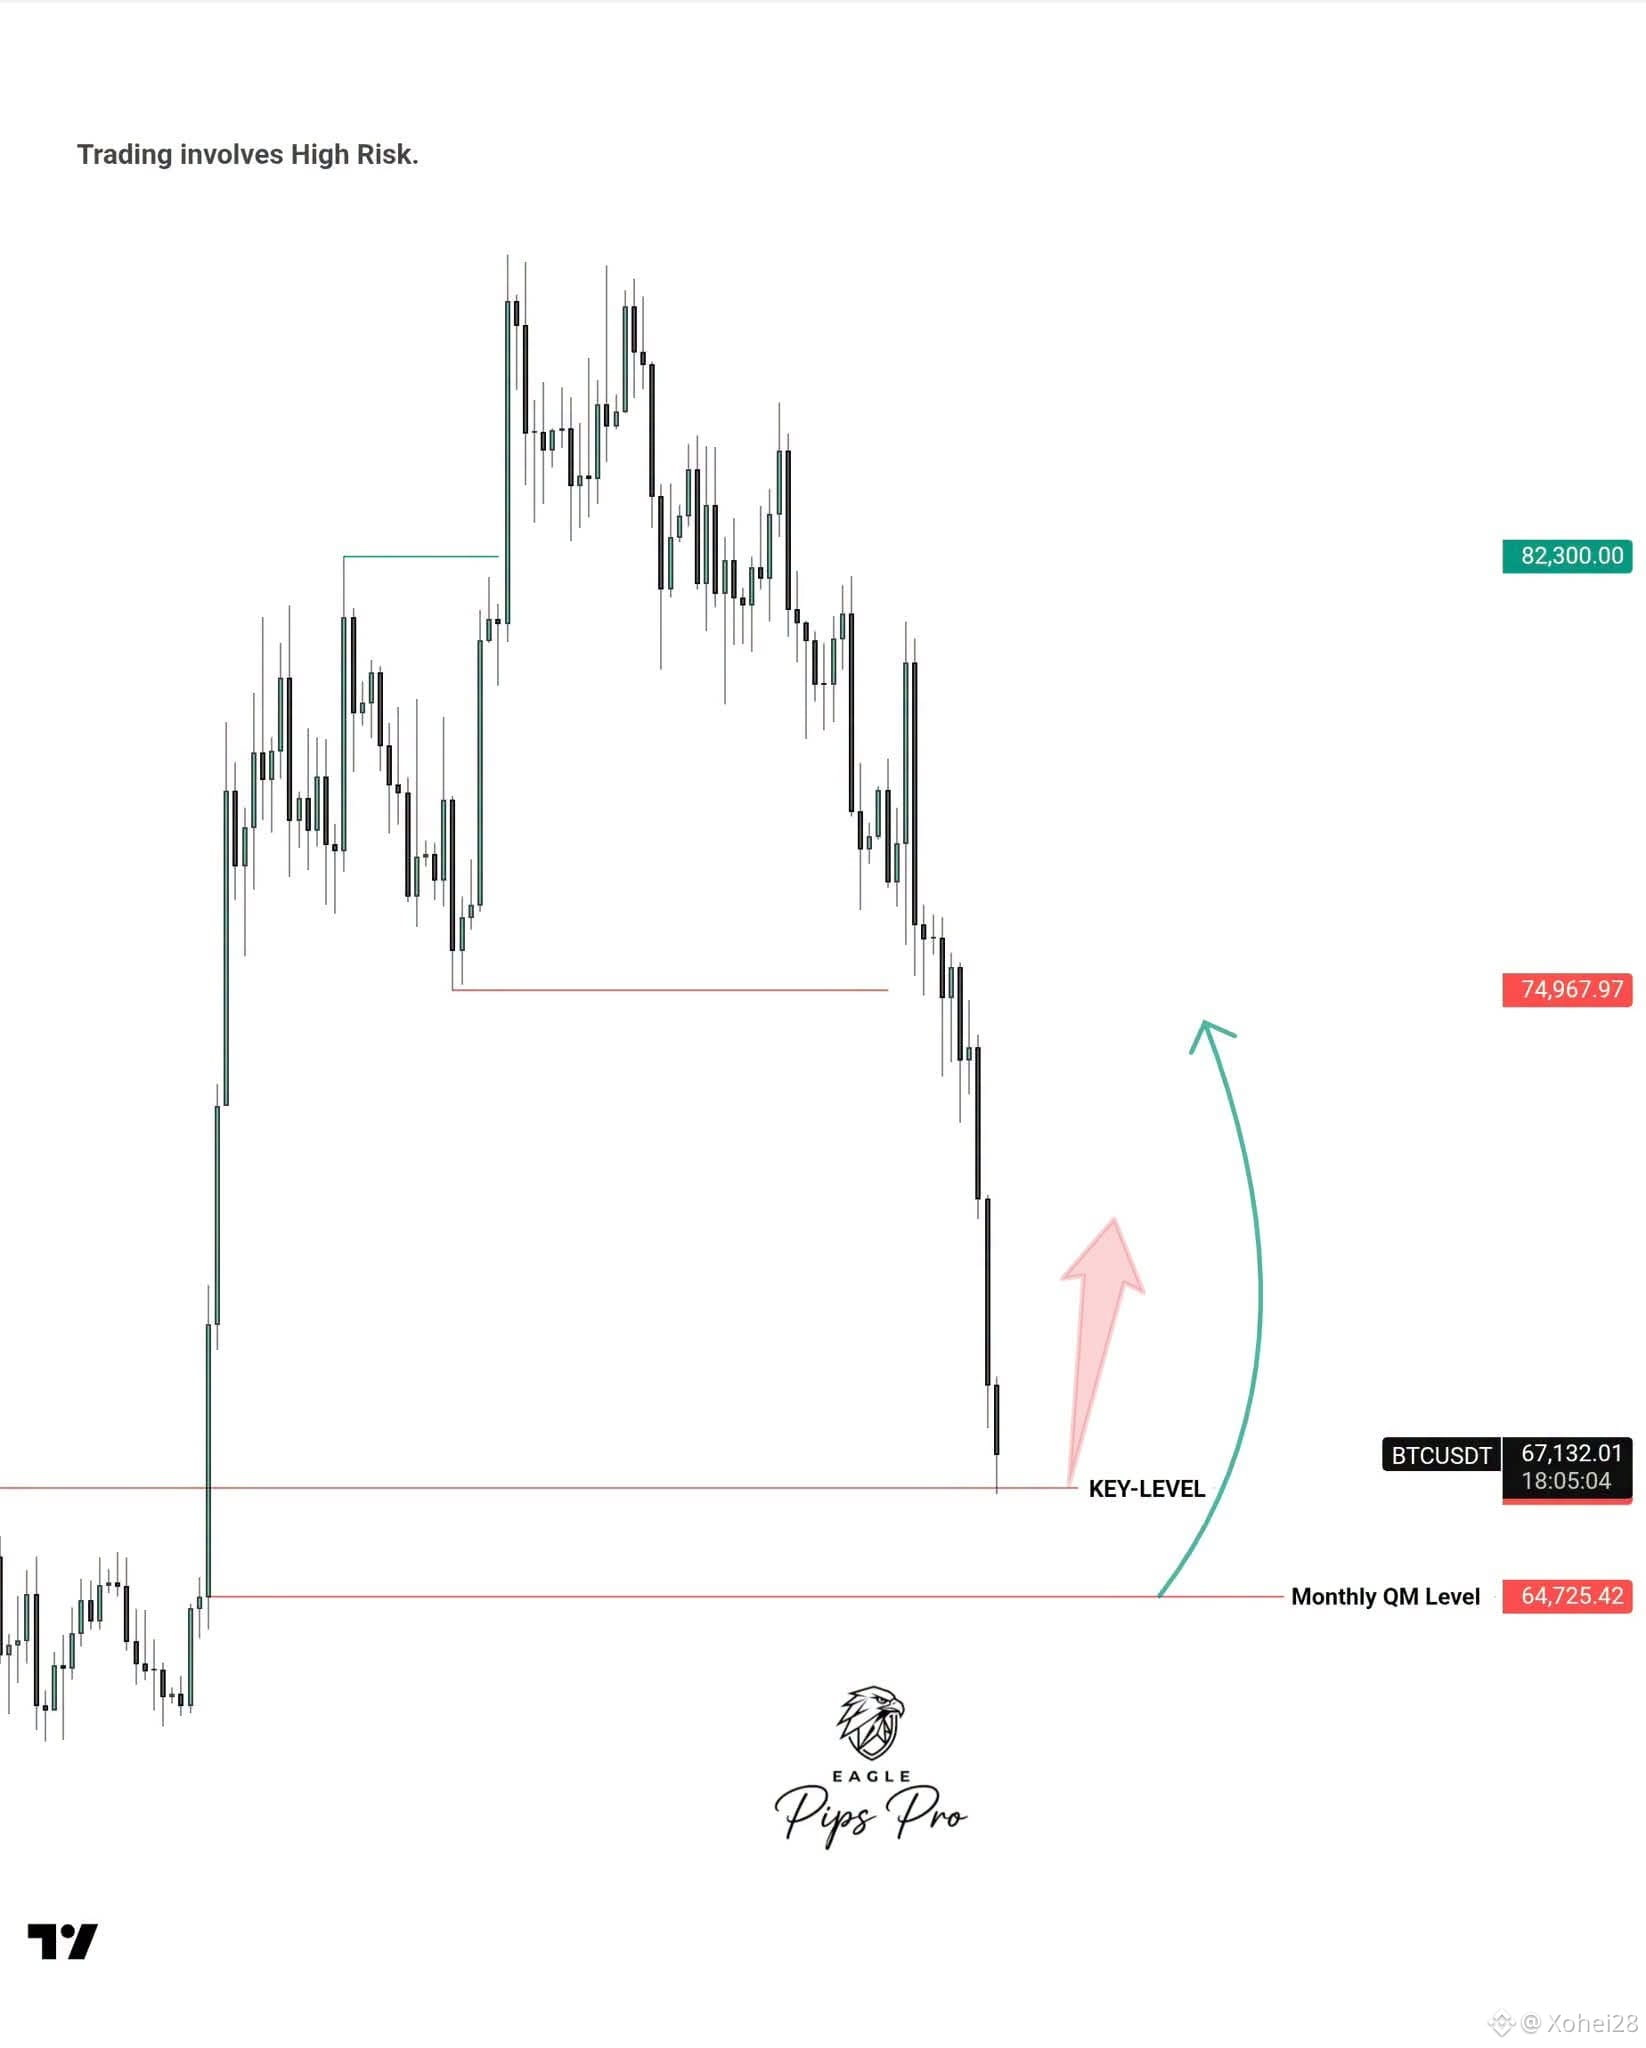
Bitcoin dumped straight into the key level just under 65K. I'm starting buys there for the long term. If price drops deeper, the monthly QM level at 64725 is my second entry.
Buy 67000
Buy 64725
TP1 74968 | TP2 82300
This is a swing trade, so be patient and size small. Would you buy here or wait for the monthly level?
#bitcoin #BTC $BTC
#BTCUSD long-term buy plan
Bitcoin dumped straight into the key level just under 65K. I'm starting buys there for the long term. If price drops deeper, the monthly QM level at 64725 is my second entry.
Buy 67000
Buy 64725
TP1 74968 | TP2 82300
This is a swing trade, so be patient and size small. Would you buy here or wait for the monthly level?
#bitcoin #BTC $BTC
Bitcoin dumped straight into the key level just under 65K. I'm starting buys there for the long term. If price drops deeper, the monthly QM level at 64725 is my second entry.
Buy 67000
Buy 64725
TP1 74968 | TP2 82300
This is a swing trade, so be patient and size small. Would you buy here or wait for the monthly level?
#bitcoin #BTC $BTC
3
191

·
--
Bearish
🚨 $BTC MARKET UPDATE | CRITICAL SUPPORT ZONE! 📉📈
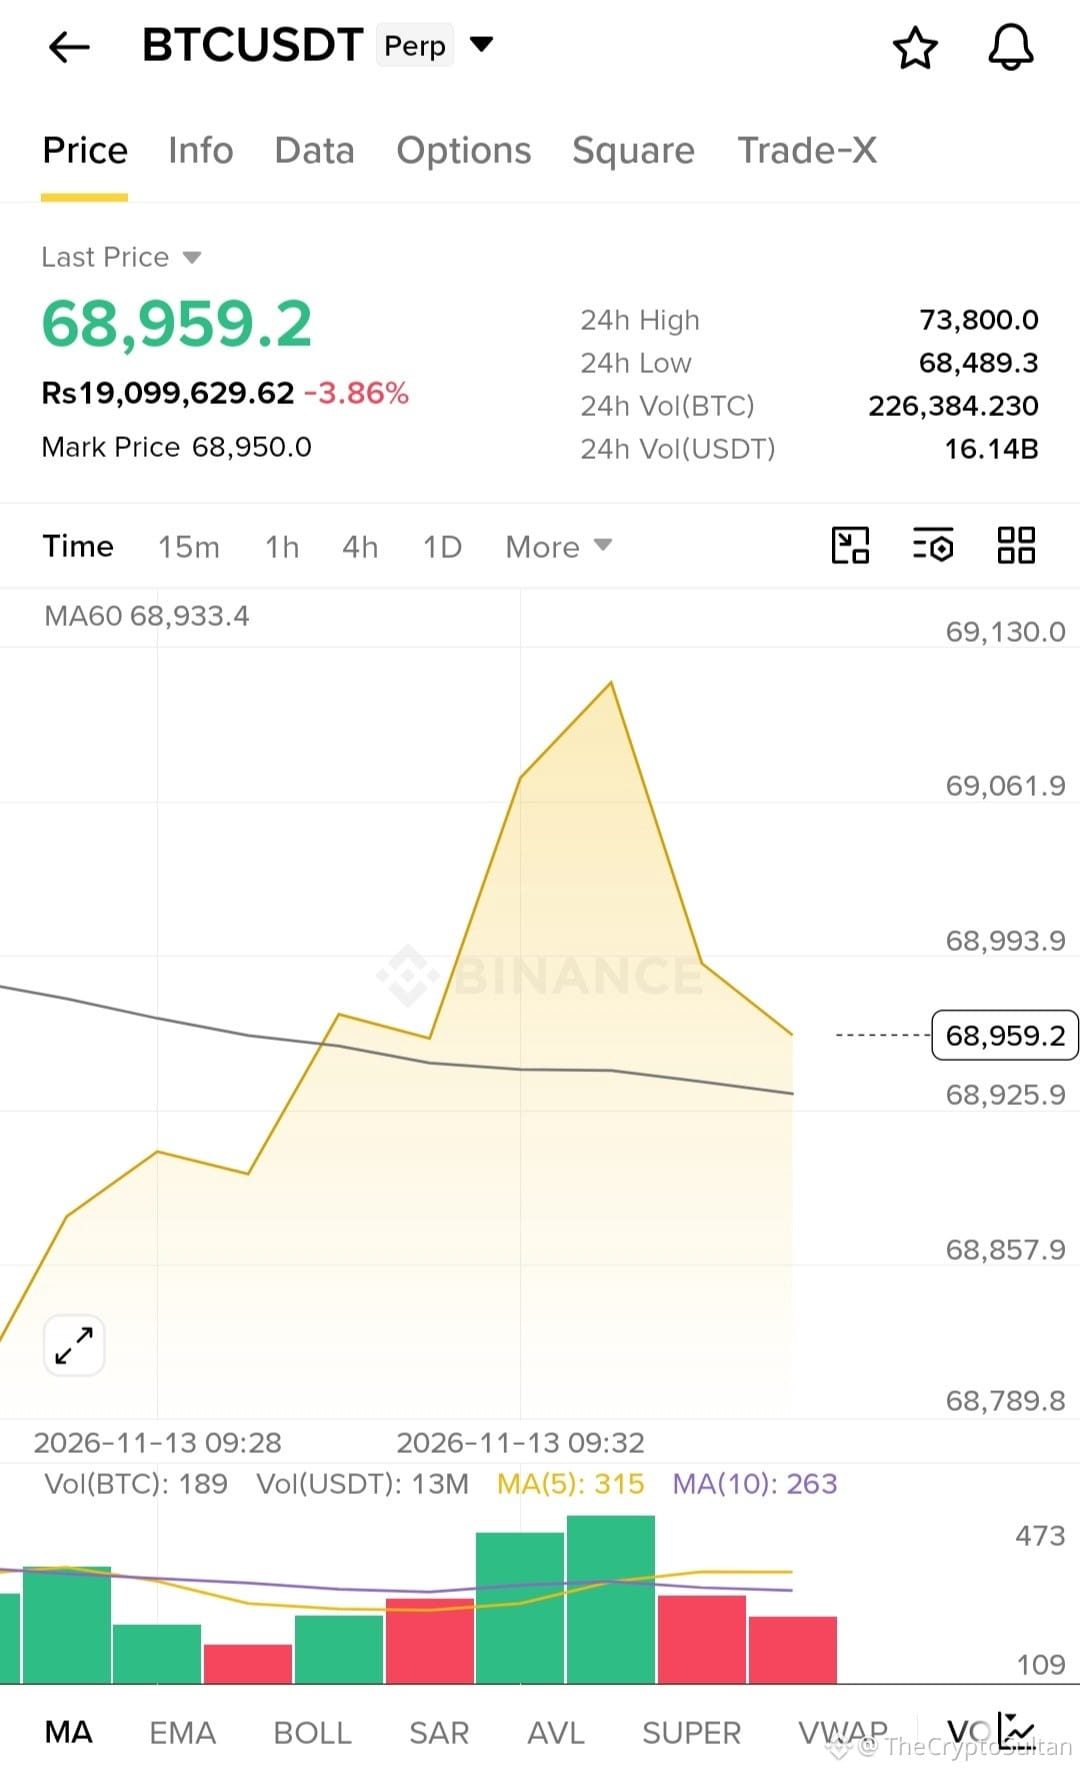
Bitcoin is currently trading around $68,959, down approximately 3.86% in the last 24 hours.
BTC is testing the important MA60 support near $68,933. Buyers are attempting to defend this level, but market volatility remains high.
📊 Key Levels to Watch:
🟢 Immediate Support: $68,933
🟢 Strong Support: $68,489
🔴 Immediate Resistance: $68,994
🔴 Major Resistance: $69,062–$69,130
🚀 Bullish Scenario: A strong recovery above $69,000 could bring fresh buying momentum.
⚠️ Bearish Scenario: Losing the $68,900 support may trigger another downside move toward $68,489.
My Strategy: Watch the support and resistance levels carefully. Wait for confirmation before entering any trade and manage your risk wisely.
Stay alert, traders! Smart decisions matter more than emotional trades. DYOR! 🔥
#bitcoin #BTCUSD #cryptotrading
🚨 $BTC MARKET UPDATE | CRITICAL SUPPORT ZONE! 📉📈
Bitcoin is currently trading around $68,959, down approximately 3.86% in the last 24 hours.
BTC is testing the important MA60 support near $68,933. Buyers are attempting to defend this level, but market volatility remains high.
📊 Key Levels to Watch:
🟢 Immediate Support: $68,933
🟢 Strong Support: $68,489
🔴 Immediate Resistance: $68,994
🔴 Major Resistance: $69,062–$69,130
🚀 Bullish Scenario: A strong recovery above $69,000 could bring fresh buying momentum.
⚠️ Bearish Scenario: Losing the $68,900 support may trigger another downside move toward $68,489.
My Strategy: Watch the support and resistance levels carefully. Wait for confirmation before entering any trade and manage your risk wisely.
Stay alert, traders! Smart decisions matter more than emotional trades. DYOR! 🔥
#bitcoin #BTCUSD #cryptotrading
Bitcoin is currently trading around $68,959, down approximately 3.86% in the last 24 hours.
BTC is testing the important MA60 support near $68,933. Buyers are attempting to defend this level, but market volatility remains high.
📊 Key Levels to Watch:
🟢 Immediate Support: $68,933
🟢 Strong Support: $68,489
🔴 Immediate Resistance: $68,994
🔴 Major Resistance: $69,062–$69,130
🚀 Bullish Scenario: A strong recovery above $69,000 could bring fresh buying momentum.
⚠️ Bearish Scenario: Losing the $68,900 support may trigger another downside move toward $68,489.
My Strategy: Watch the support and resistance levels carefully. Wait for confirmation before entering any trade and manage your risk wisely.
Stay alert, traders! Smart decisions matter more than emotional trades. DYOR! 🔥
#bitcoin #BTCUSD #cryptotrading
64

$BTC
{future}(BTCUSDT)
₿ BITCOIN (BTC) LATEST MARKET ANALYSIS
November 12, 2026 | BTC/USD

BEARISH MARKET TREND
Current Bitcoin price: Approximately $73,341
* 24-hour change: -0.39%
* 7-day change: -3.43%
* Market capitalization: $1.48 trillion. CoinGlass +1
### 📊 Bitcoin price chart
### 🎯 Important price levels
| Level | Price |
| ------------ | ------- |
| Resistance 1 | $74,012 |
| Resistance 2 | $76,230 |
| Support 1 | $72,160 |
| Support 2 | $70,000 |
The Cryptonomist +1
### Market outlook
Bearish
Short-term outlook
Bitcoin is facing selling pressure. A recovery above $74,000 could improve bullish momentum, while a break below $72,160 could bring further downside risk. Oversold signals mean a temporary bounce is also possible. The Cryptonomist +1
Conclusion: Watch the $72,160 support and $74,000 resistance before making a trading decision.
⚠️ Educational market analysis only. Not financial advice. Cryptocurrency trading carries significant risk.
#Bitcoin #BTC #CryptoAnalysis #BitcoinTrading #CryptoMarket #BTCUSD
$BTC
₿ BITCOIN (BTC) LATEST MARKET ANALYSIS
November 12, 2026 | BTC/USD

BEARISH MARKET TREND
Current Bitcoin price: Approximately $73,341
* 24-hour change: -0.39%
* 7-day change: -3.43%
* Market capitalization: $1.48 trillion. CoinGlass +1
### 📊 Bitcoin price chart
### 🎯 Important price levels
| Level | Price |
| ------------ | ------- |
| Resistance 1 | $74,012 |
| Resistance 2 | $76,230 |
| Support 1 | $72,160 |
| Support 2 | $70,000 |
The Cryptonomist +1
### Market outlook
Bearish
Short-term outlook
Bitcoin is facing selling pressure. A recovery above $74,000 could improve bullish momentum, while a break below $72,160 could bring further downside risk. Oversold signals mean a temporary bounce is also possible. The Cryptonomist +1
Conclusion: Watch the $72,160 support and $74,000 resistance before making a trading decision.
⚠️ Educational market analysis only. Not financial advice. Cryptocurrency trading carries significant risk.
#Bitcoin #BTC #CryptoAnalysis #BitcoinTrading #CryptoMarket #BTCUSD
₿ BITCOIN (BTC) LATEST MARKET ANALYSIS
November 12, 2026 | BTC/USD

BEARISH MARKET TREND
Current Bitcoin price: Approximately $73,341
* 24-hour change: -0.39%
* 7-day change: -3.43%
* Market capitalization: $1.48 trillion. CoinGlass +1
### 📊 Bitcoin price chart
### 🎯 Important price levels
| Level | Price |
| ------------ | ------- |
| Resistance 1 | $74,012 |
| Resistance 2 | $76,230 |
| Support 1 | $72,160 |
| Support 2 | $70,000 |
The Cryptonomist +1
### Market outlook
Bearish
Short-term outlook
Bitcoin is facing selling pressure. A recovery above $74,000 could improve bullish momentum, while a break below $72,160 could bring further downside risk. Oversold signals mean a temporary bounce is also possible. The Cryptonomist +1
Conclusion: Watch the $72,160 support and $74,000 resistance before making a trading decision.
⚠️ Educational market analysis only. Not financial advice. Cryptocurrency trading carries significant risk.
#Bitcoin #BTC #CryptoAnalysis #BitcoinTrading #CryptoMarket #BTCUSD

85

·
--
🚨⚠️ Bitcoin Update — Potential Drop, But Watch the Short Liquidity! 📉💰
I still have a bearish outlook on Bitcoin due to the ongoing negative signals in the market. But there’s an important thing we shouldn’t ignore: significant short liquidation liquidity above $74,000! 💲💸
📊 Key BTC Levels
💰 Current price: $68,900
💵 Key weekly close: $70,000
🚀 First resistance: $73,300
🚀 Second resistance: $75,100
If BTC closes the week above $70,000, we may see an attempt to move up toward the resistance zones before a potential drop again.
⚠️ Bearish Scenario
If Bitcoin loses the $68,900 level, the next target could be $64,000, a potential support zone and an important area for accumulation.
💲 My View
I think Bitcoin may first target some short liquidity above the current price before another downward move. This could help rebalance the market. 🤑💰
👀 What do you expect?
Will BTC collect liquidity above $74,000, or break below $68,900 and head toward $64,000?
💬 Share your predictions with us!
#Bitcoin #BTCUSD #CryptoTrading #Cryptocurrency #BitcoinAnalysis #CoinPulse
⚠️ Market analysis, not financial advice. Manage your trading risk wisely.
🚨⚠️ Bitcoin Update — Potential Drop, But Watch the Short Liquidity! 📉💰
I still have a bearish outlook on Bitcoin due to the ongoing negative signals in the market. But there’s an important thing we shouldn’t ignore: significant short liquidation liquidity above $74,000! 💲💸
📊 Key BTC Levels
💰 Current price: $68,900
💵 Key weekly close: $70,000
🚀 First resistance: $73,300
🚀 Second resistance: $75,100
If BTC closes the week above $70,000, we may see an attempt to move up toward the resistance zones before a potential drop again.
⚠️ Bearish Scenario
If Bitcoin loses the $68,900 level, the next target could be $64,000, a potential support zone and an important area for accumulation.
💲 My View
I think Bitcoin may first target some short liquidity above the current price before another downward move. This could help rebalance the market. 🤑💰
👀 What do you expect?
Will BTC collect liquidity above $74,000, or break below $68,900 and head toward $64,000?
💬 Share your predictions with us!
#Bitcoin #BTCUSD #CryptoTrading #Cryptocurrency #BitcoinAnalysis #CoinPulse
⚠️ Market analysis, not financial advice. Manage your trading risk wisely.
I still have a bearish outlook on Bitcoin due to the ongoing negative signals in the market. But there’s an important thing we shouldn’t ignore: significant short liquidation liquidity above $74,000! 💲💸
📊 Key BTC Levels
💰 Current price: $68,900
💵 Key weekly close: $70,000
🚀 First resistance: $73,300
🚀 Second resistance: $75,100
If BTC closes the week above $70,000, we may see an attempt to move up toward the resistance zones before a potential drop again.
⚠️ Bearish Scenario
If Bitcoin loses the $68,900 level, the next target could be $64,000, a potential support zone and an important area for accumulation.
💲 My View
I think Bitcoin may first target some short liquidity above the current price before another downward move. This could help rebalance the market. 🤑💰
👀 What do you expect?
Will BTC collect liquidity above $74,000, or break below $68,900 and head toward $64,000?
💬 Share your predictions with us!
#Bitcoin #BTCUSD #CryptoTrading #Cryptocurrency #BitcoinAnalysis #CoinPulse
⚠️ Market analysis, not financial advice. Manage your trading risk wisely.
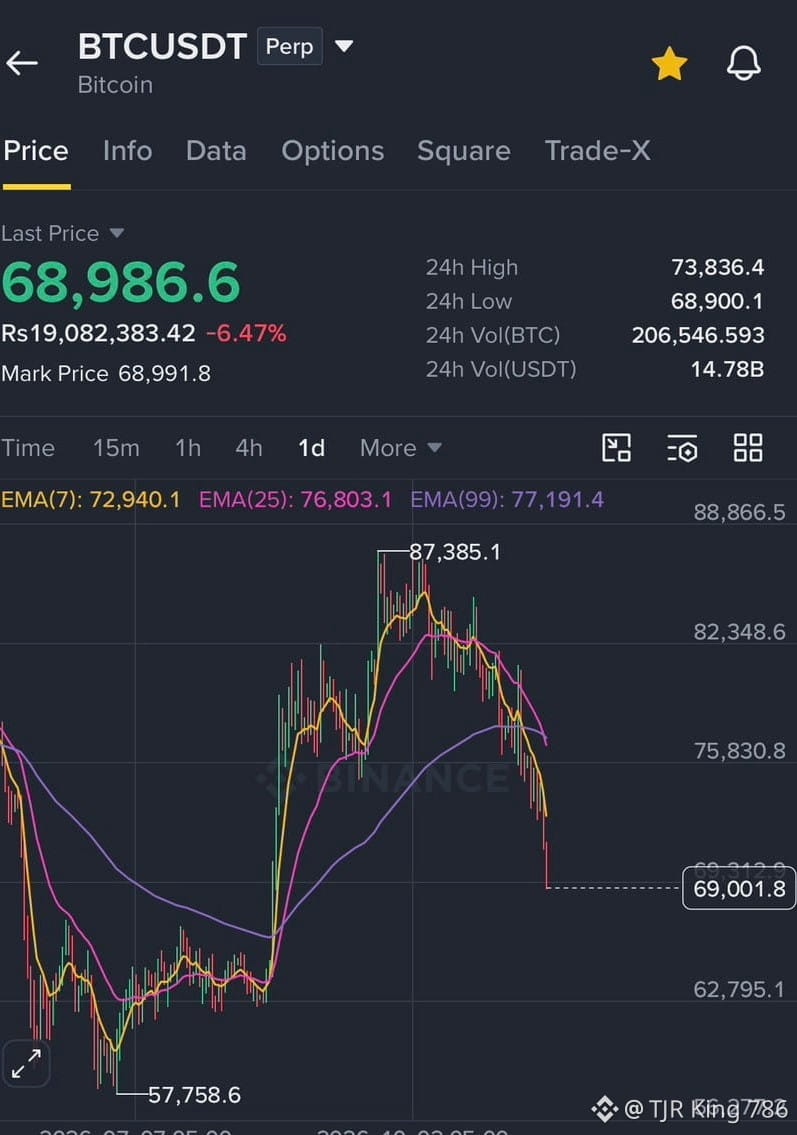
93

{future}(BTCUSDT)
🚀 BTC/USDT – The Market Never Sleeps!
Bitcoin continues to attract attention as traders watch for the next big move. 📊 Stay focused, analyze market trends, manage your risk, and wait for the right opportunity.
💎 Trade smart. Stay disciplined. Think long-term!
#BTC #BTCUSD #bitcoin #CryptoTrading #BİNANCE
🚀 BTC/USDT – The Market Never Sleeps!
Bitcoin continues to attract attention as traders watch for the next big move. 📊 Stay focused, analyze market trends, manage your risk, and wait for the right opportunity.
💎 Trade smart. Stay disciplined. Think long-term!
#BTC #BTCUSD #bitcoin #CryptoTrading #BİNANCE
Bitcoin continues to attract attention as traders watch for the next big move. 📊 Stay focused, analyze market trends, manage your risk, and wait for the right opportunity.
💎 Trade smart. Stay disciplined. Think long-term!
#BTC #BTCUSD #bitcoin #CryptoTrading #BİNANCE
63

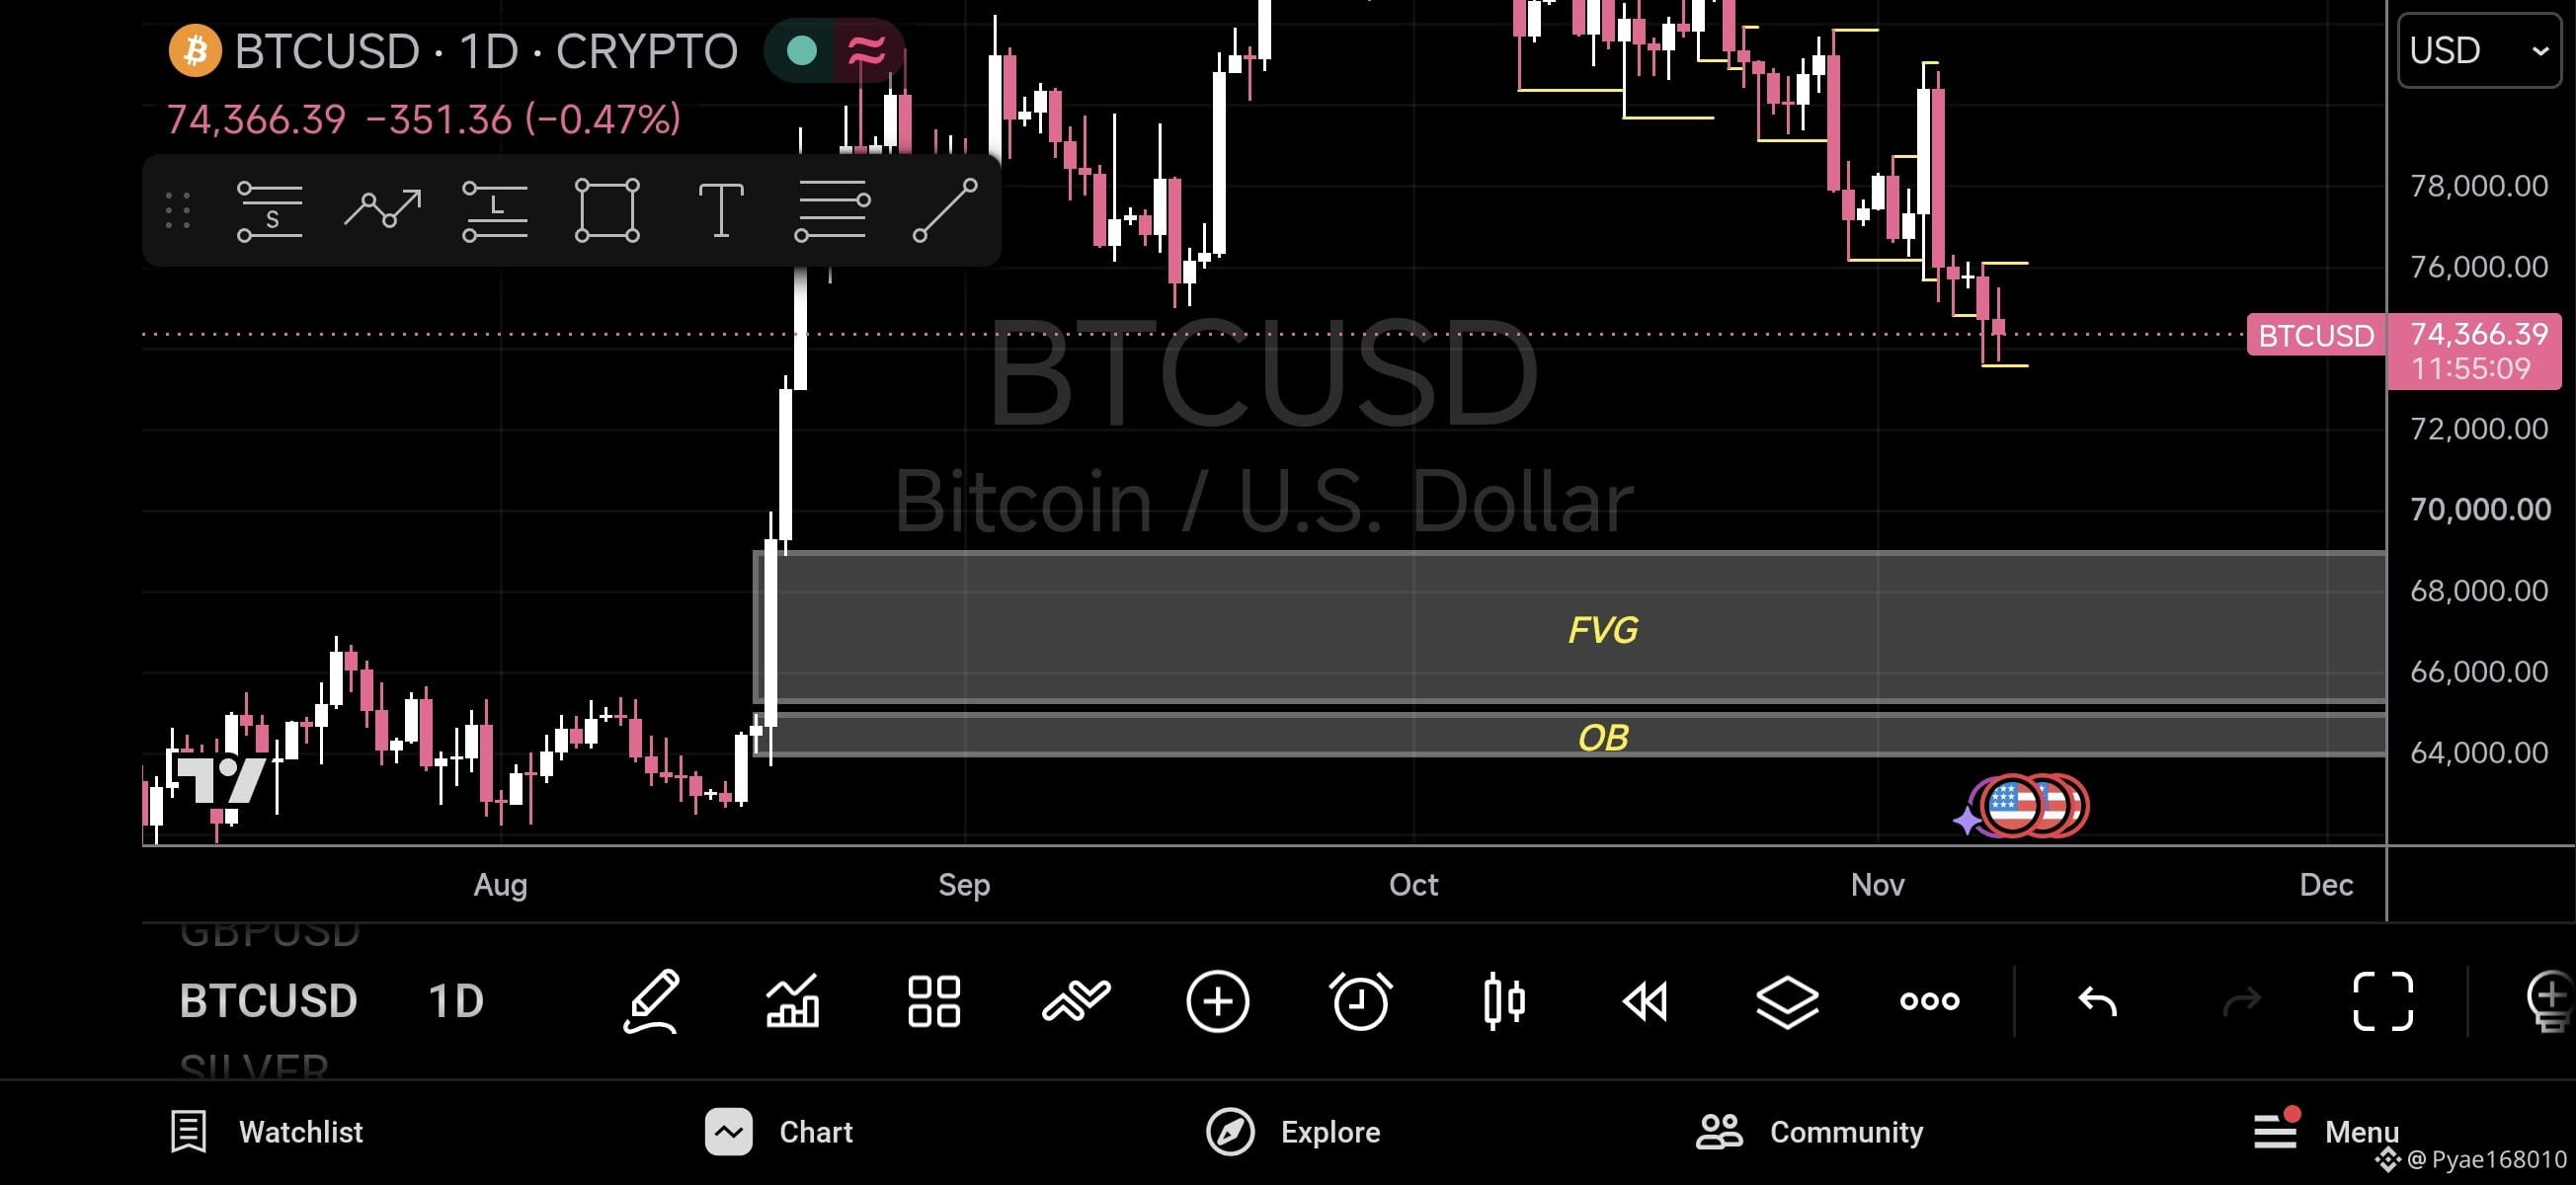
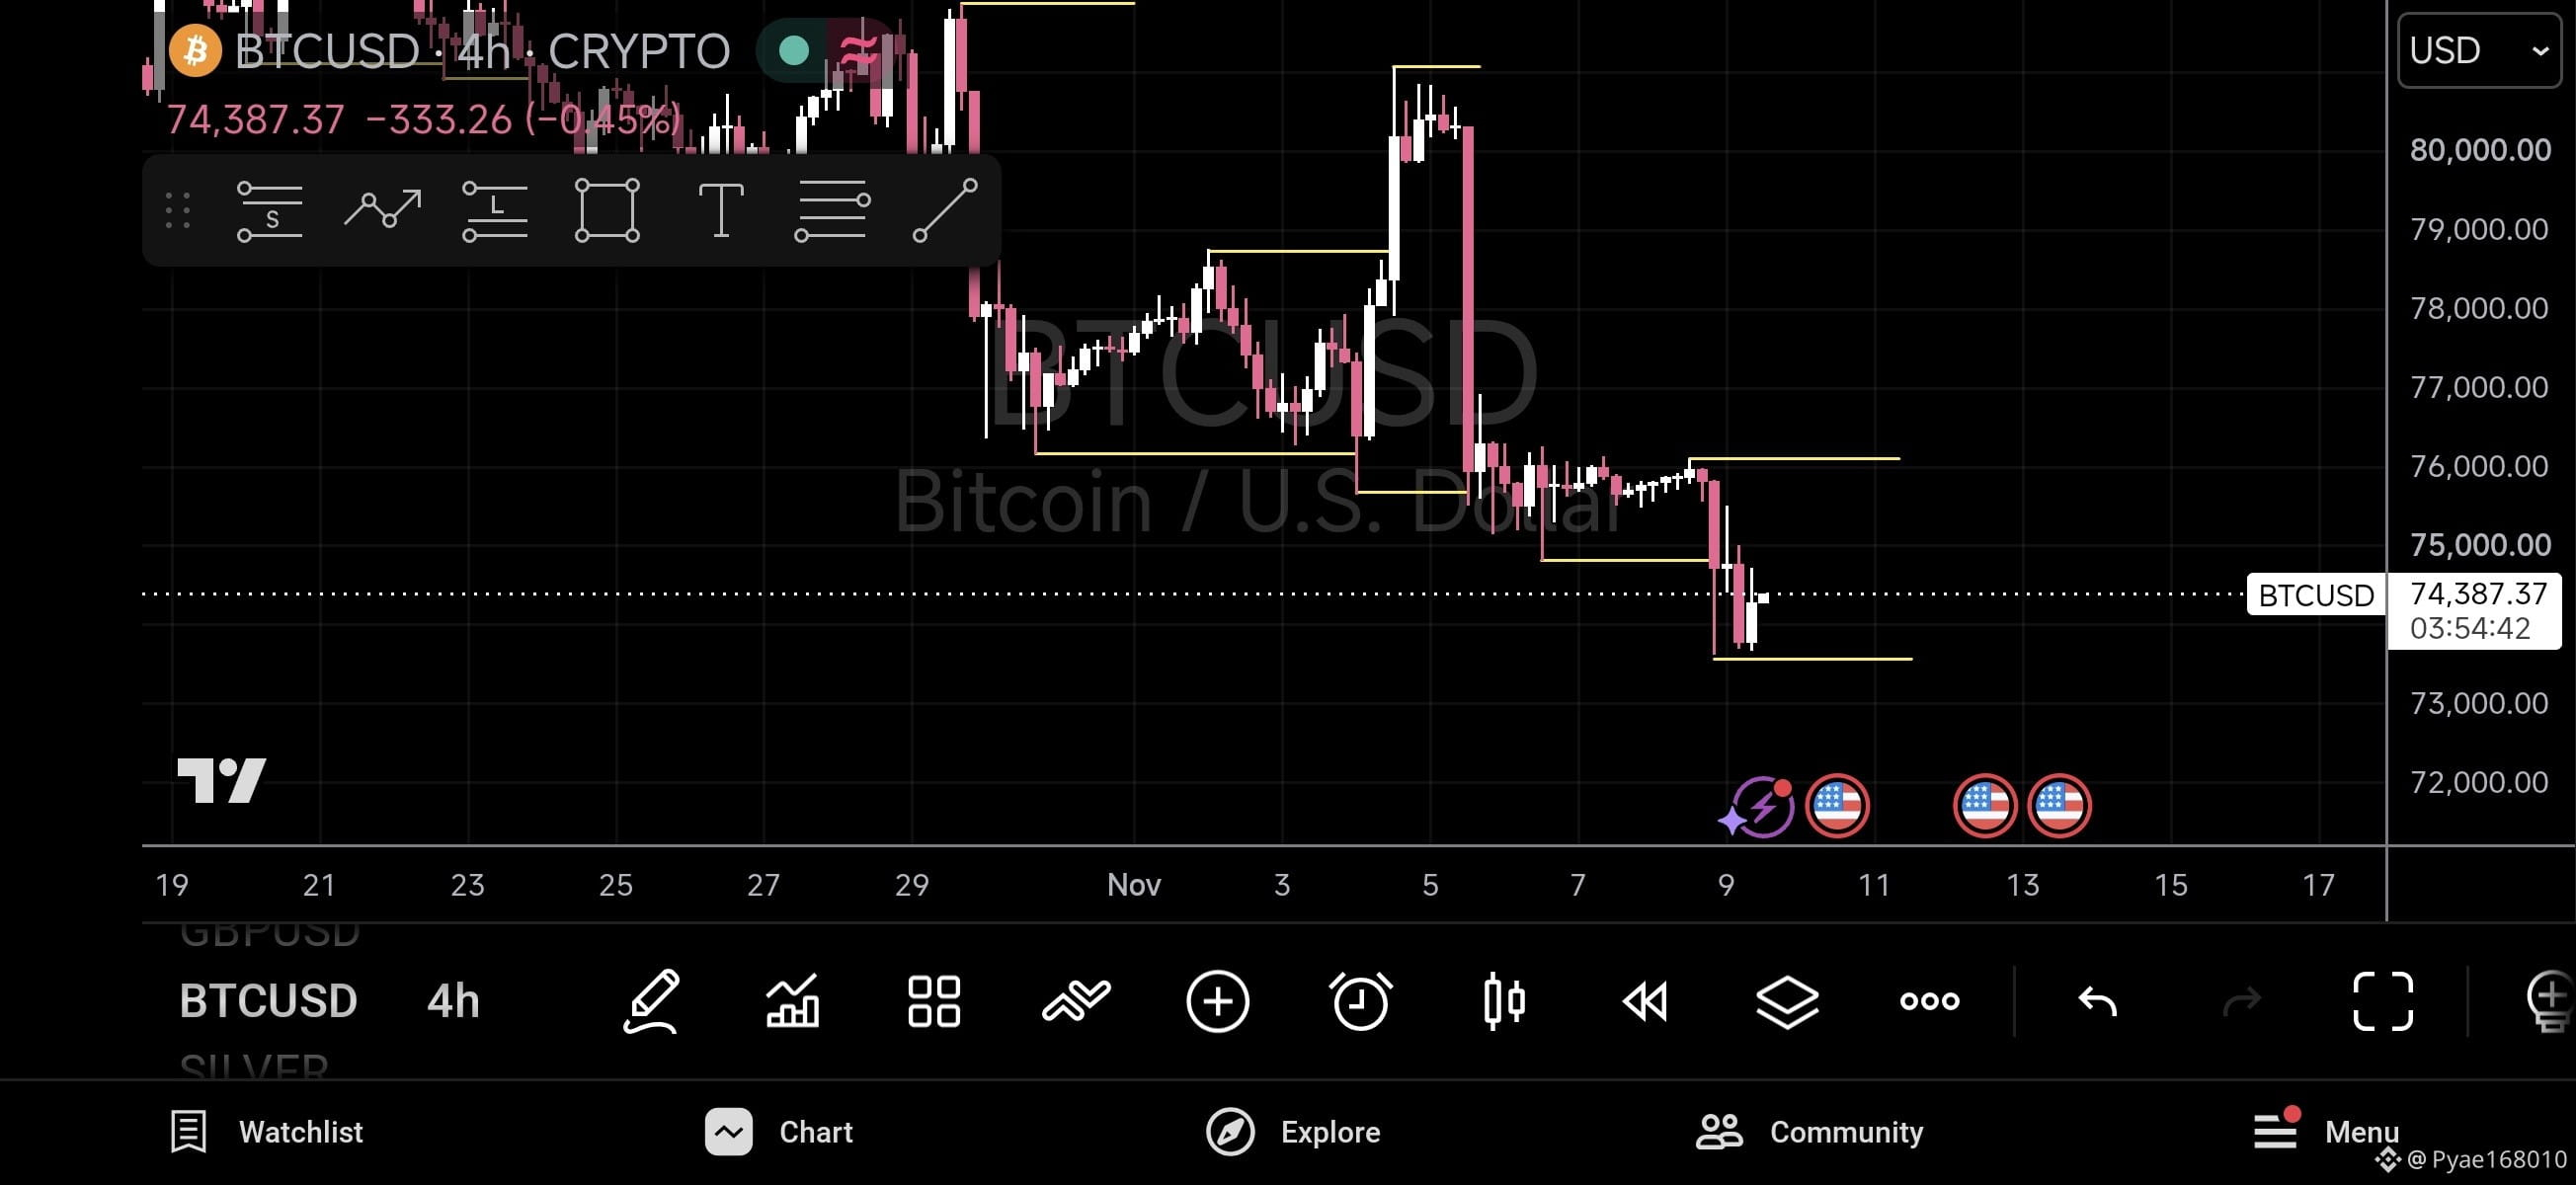
Current Market Outlook:
If BTC breaks below the latest 4H FTL, price could potentially move lower towards the marked 4H FVG and OB zones.
On the other hand, if BTC breaks above the latest 4H FTH, we could see a potential bullish reversal and an upward move.
For now, I'm staying patient and waiting for confirmation before taking any position.
No prediction. Just patience, structure, and confirmation. 📉📈
#BTCUSD #bitcoin #smc #PriceActionAnalysis #cryptotrading
Current Market Outlook:
If BTC breaks below the latest 4H FTL, price could potentially move lower towards the marked 4H FVG and OB zones.
On the other hand, if BTC breaks above the latest 4H FTH, we could see a potential bullish reversal and an upward move.
For now, I'm staying patient and waiting for confirmation before taking any position.
No prediction. Just patience, structure, and confirmation. 📉📈
#BTCUSD #bitcoin #smc #PriceActionAnalysis #cryptotrading
If BTC breaks below the latest 4H FTL, price could potentially move lower towards the marked 4H FVG and OB zones.
On the other hand, if BTC breaks above the latest 4H FTH, we could see a potential bullish reversal and an upward move.
For now, I'm staying patient and waiting for confirmation before taking any position.
No prediction. Just patience, structure, and confirmation. 📉📈
#BTCUSD #bitcoin #smc #PriceActionAnalysis #cryptotrading
105

·
--
Article
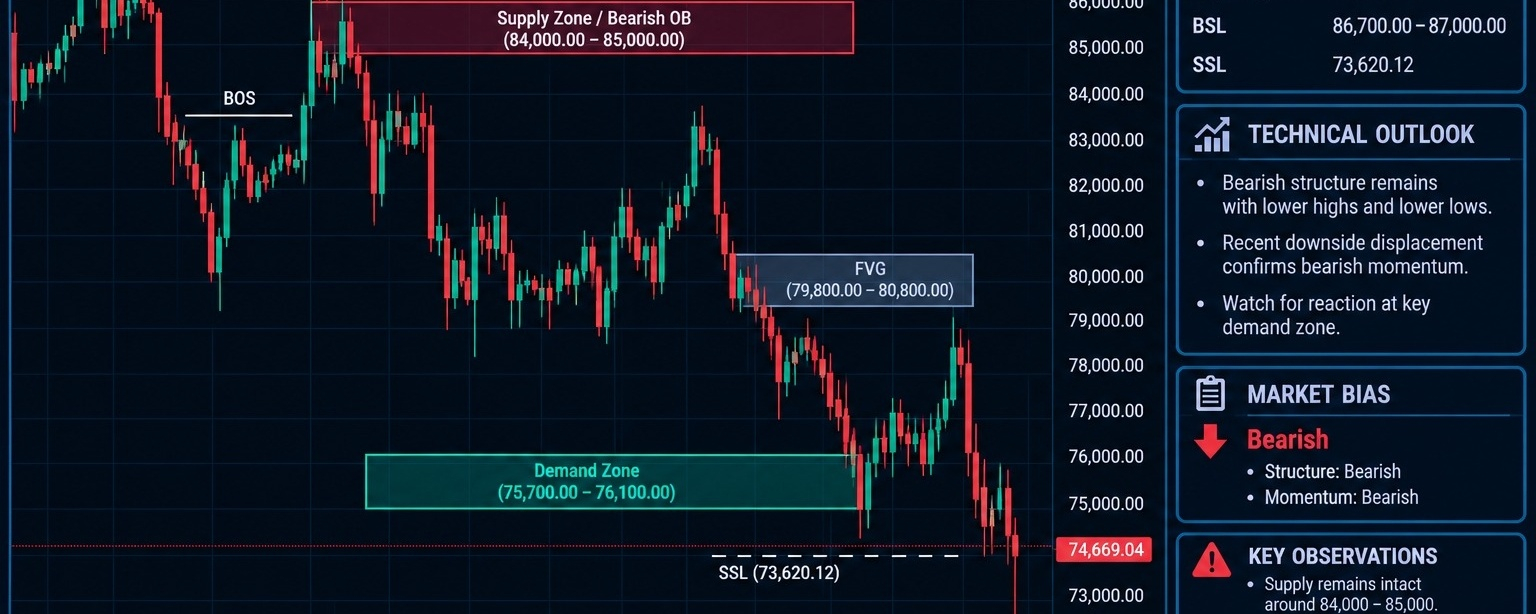
BTCUSD — Bitcoin / U.S. Dollar Technical Analysis (09)H4 Bias: Bearish
Structure State: Bearish market structure with successive lower highs and lower lows, strong downside displacement, and price trading below the 75,700–76,100 demand region.
Market Structure
$BTC experienced a significant bullish expansion before reaching the 86,700–87,000 buy-side liquidity region. The subsequent rejection from the 84,000–85,000 supply region initiated a broader bearish structural sequence.
A bearish break of structure developed, followed by continued downside movement and the formation of lower highs and lower lows. Price later consolidated through the 79,800–80,800 imbalance region before another bearish displacement extended the decline toward the 75,700–76,100 demand area.
The latest candles show price trading around 74,669.04, below the marked demand zone and near the 73,620.12 sell-side liquidity reference.
The prevailing market structure and momentum remain bearish. The previous demand region may now act as an important overhead resistance area if price attempts to recover.
Key Resistance
Supply Zone: 84,000.00–85,000.00 — major bearish supply and order-block region.
FVG: 79,800.00–80,800.00 — overhead bearish imbalance.
Former Demand: 75,700.00–76,100.00 — previous demand region, now vulnerable to acting as resistance.
Key Support
Key Support: 73,620.12 — immediate sell-side liquidity reference.
Current Price Region: 74,669.04 — trading below the marked demand area.
Demand Zone: 75,700.00–76,100.00 — previous structural demand region.
FVG — Fair Value Gap
A bearish fair value gap is identified around 79,800.00–80,800.00. This region represents an overhead imbalance following the downside displacement.
Any corrective recovery toward this region should be monitored for rejection and renewed selling pressure.
Order Block (OB)
The 84,000.00–85,000.00 supply region represents the primary bearish order block. It remains the major overhead resistance following the previous buy-side liquidity interaction.
The 75,700.00–76,100.00 demand region was the principal bullish reaction area, but price is currently trading below it. Its ability to regain support status requires a confirmed reclaim.
Liquidity Map
Buy-side liquidity (BSL): 86,700.00–87,000.00.
Sell-side liquidity (SSL): 73,620.12.
Intermediate resistance liquidity: Around 79,800.00–80,800.00.
Previous demand: 75,700.00–76,100.00.
Trade Scenarios
Bearish continuation: Continued acceptance below the 75,700.00–76,100.00 demand region would preserve the bearish outlook. A confirmed breakdown below 73,620.12 would indicate further downside liquidity delivery.
Bullish recovery: A sustained reclaim of 75,700.00–76,100.00 would improve the short-term recovery scenario. A broader bullish reversal would require stronger structural confirmation and a reclaim of higher resistance.
Trendline
The broader market structure is characterized by lower highs and lower lows. The repeated bearish displacement confirms the prevailing downward momentum. A sustained break of the lower-high sequence would be required to challenge the bearish trend.
Invalidation
The chart identifies no explicit numerical bullish invalidation level. The bearish structural interpretation would weaken if price reclaimed the former demand region and subsequently established bullish displacement and a confirmed structural shift.
Professional Summary
Primary bias: Bearish.
Major supply: 84,000.00–85,000.00.
FVG: 79,800.00–80,800.00.
Former demand: 75,700.00–76,100.00.
Immediate liquidity reference: 73,620.12.
Bearish trigger: Continued acceptance below 75,700.00–76,100.00.
Breakdown confirmation: H4 acceptance below 73,620.12.
Recovery trigger: Sustained reclaim above 76,100.00.
Risk consideration: Price is trading below the marked demand region. A breakdown below 73,620.12 should be confirmed through sustained price acceptance rather than an isolated liquidity sweep.
#bitcoin #BTC #BTCTechnicalAnalysis #BTCUSD
BTCUSD — Bitcoin / U.S. Dollar Technical Analysis (09)
H4 Bias: Bearish
Structure State: Bearish market structure with successive lower highs and lower lows, strong downside displacement, and price trading below the 75,700–76,100 demand region.
Market Structure
$BTC experienced a significant bullish expansion before reaching the 86,700–87,000 buy-side liquidity region. The subsequent rejection from the 84,000–85,000 supply region initiated a broader bearish structural sequence.
A bearish break of structure developed, followed by continued downside movement and the formation of lower highs and lower lows. Price later consolidated through the 79,800–80,800 imbalance region before another bearish displacement extended the decline toward the 75,700–76,100 demand area.
The latest candles show price trading around 74,669.04, below the marked demand zone and near the 73,620.12 sell-side liquidity reference.
The prevailing market structure and momentum remain bearish. The previous demand region may now act as an important overhead resistance area if price attempts to recover.
Key Resistance
Supply Zone: 84,000.00–85,000.00 — major bearish supply and order-block region.
FVG: 79,800.00–80,800.00 — overhead bearish imbalance.
Former Demand: 75,700.00–76,100.00 — previous demand region, now vulnerable to acting as resistance.
Key Support
Key Support: 73,620.12 — immediate sell-side liquidity reference.
Current Price Region: 74,669.04 — trading below the marked demand area.
Demand Zone: 75,700.00–76,100.00 — previous structural demand region.
FVG — Fair Value Gap
A bearish fair value gap is identified around 79,800.00–80,800.00. This region represents an overhead imbalance following the downside displacement.
Any corrective recovery toward this region should be monitored for rejection and renewed selling pressure.
Order Block (OB)
The 84,000.00–85,000.00 supply region represents the primary bearish order block. It remains the major overhead resistance following the previous buy-side liquidity interaction.
The 75,700.00–76,100.00 demand region was the principal bullish reaction area, but price is currently trading below it. Its ability to regain support status requires a confirmed reclaim.
Liquidity Map
Buy-side liquidity (BSL): 86,700.00–87,000.00.
Sell-side liquidity (SSL): 73,620.12.
Intermediate resistance liquidity: Around 79,800.00–80,800.00.
Previous demand: 75,700.00–76,100.00.
Trade Scenarios
Bearish continuation: Continued acceptance below the 75,700.00–76,100.00 demand region would preserve the bearish outlook. A confirmed breakdown below 73,620.12 would indicate further downside liquidity delivery.
Bullish recovery: A sustained reclaim of 75,700.00–76,100.00 would improve the short-term recovery scenario. A broader bullish reversal would require stronger structural confirmation and a reclaim of higher resistance.
Trendline
The broader market structure is characterized by lower highs and lower lows. The repeated bearish displacement confirms the prevailing downward momentum. A sustained break of the lower-high sequence would be required to challenge the bearish trend.
Invalidation
The chart identifies no explicit numerical bullish invalidation level. The bearish structural interpretation would weaken if price reclaimed the former demand region and subsequently established bullish displacement and a confirmed structural shift.
Professional Summary
Primary bias: Bearish.
Major supply: 84,000.00–85,000.00.
FVG: 79,800.00–80,800.00.
Former demand: 75,700.00–76,100.00.
Immediate liquidity reference: 73,620.12.
Bearish trigger: Continued acceptance below 75,700.00–76,100.00.
Breakdown confirmation: H4 acceptance below 73,620.12.
Recovery trigger: Sustained reclaim above 76,100.00.
Risk consideration: Price is trading below the marked demand region. A breakdown below 73,620.12 should be confirmed through sustained price acceptance rather than an isolated liquidity sweep.
#bitcoin #BTC #BTCTechnicalAnalysis #BTCUSD
Structure State: Bearish market structure with successive lower highs and lower lows, strong downside displacement, and price trading below the 75,700–76,100 demand region.
Market Structure
$BTC experienced a significant bullish expansion before reaching the 86,700–87,000 buy-side liquidity region. The subsequent rejection from the 84,000–85,000 supply region initiated a broader bearish structural sequence.
A bearish break of structure developed, followed by continued downside movement and the formation of lower highs and lower lows. Price later consolidated through the 79,800–80,800 imbalance region before another bearish displacement extended the decline toward the 75,700–76,100 demand area.
The latest candles show price trading around 74,669.04, below the marked demand zone and near the 73,620.12 sell-side liquidity reference.
The prevailing market structure and momentum remain bearish. The previous demand region may now act as an important overhead resistance area if price attempts to recover.
Key Resistance
Supply Zone: 84,000.00–85,000.00 — major bearish supply and order-block region.
FVG: 79,800.00–80,800.00 — overhead bearish imbalance.
Former Demand: 75,700.00–76,100.00 — previous demand region, now vulnerable to acting as resistance.
Key Support
Key Support: 73,620.12 — immediate sell-side liquidity reference.
Current Price Region: 74,669.04 — trading below the marked demand area.
Demand Zone: 75,700.00–76,100.00 — previous structural demand region.
FVG — Fair Value Gap
A bearish fair value gap is identified around 79,800.00–80,800.00. This region represents an overhead imbalance following the downside displacement.
Any corrective recovery toward this region should be monitored for rejection and renewed selling pressure.
Order Block (OB)
The 84,000.00–85,000.00 supply region represents the primary bearish order block. It remains the major overhead resistance following the previous buy-side liquidity interaction.
The 75,700.00–76,100.00 demand region was the principal bullish reaction area, but price is currently trading below it. Its ability to regain support status requires a confirmed reclaim.
Liquidity Map
Buy-side liquidity (BSL): 86,700.00–87,000.00.
Sell-side liquidity (SSL): 73,620.12.
Intermediate resistance liquidity: Around 79,800.00–80,800.00.
Previous demand: 75,700.00–76,100.00.
Trade Scenarios
Bearish continuation: Continued acceptance below the 75,700.00–76,100.00 demand region would preserve the bearish outlook. A confirmed breakdown below 73,620.12 would indicate further downside liquidity delivery.
Bullish recovery: A sustained reclaim of 75,700.00–76,100.00 would improve the short-term recovery scenario. A broader bullish reversal would require stronger structural confirmation and a reclaim of higher resistance.
Trendline
The broader market structure is characterized by lower highs and lower lows. The repeated bearish displacement confirms the prevailing downward momentum. A sustained break of the lower-high sequence would be required to challenge the bearish trend.
Invalidation
The chart identifies no explicit numerical bullish invalidation level. The bearish structural interpretation would weaken if price reclaimed the former demand region and subsequently established bullish displacement and a confirmed structural shift.
Professional Summary
Primary bias: Bearish.
Major supply: 84,000.00–85,000.00.
FVG: 79,800.00–80,800.00.
Former demand: 75,700.00–76,100.00.
Immediate liquidity reference: 73,620.12.
Bearish trigger: Continued acceptance below 75,700.00–76,100.00.
Breakdown confirmation: H4 acceptance below 73,620.12.
Recovery trigger: Sustained reclaim above 76,100.00.
Risk consideration: Price is trading below the marked demand region. A breakdown below 73,620.12 should be confirmed through sustained price acceptance rather than an isolated liquidity sweep.
#bitcoin #BTC #BTCTechnicalAnalysis #BTCUSD
68

·
--
₿ BITCOIN DAILY UPDATE 🚀
$BTC November 8, 2026
Bitcoin (BTC) continues to attract market attention as traders watch key support and resistance levels.
📊 Market Outlook: 🟢 Bullish above $77,000 🔴 Bearish below $75,000 🟡 Key resistance: $76,000–$77,000 🎯 Next target: $78,000–$80,000
Stay alert, manage your risk, and trade smart!
💎 Patience is the key to success in crypto.
#BinanceReopensWithdrawalsForHYPE&APT #BitcoinUpdate #CryptoMarket #Trading #BTCUSD
₿ BITCOIN DAILY UPDATE 🚀
$BTC November 8, 2026
Bitcoin (BTC) continues to attract market attention as traders watch key support and resistance levels.
📊 Market Outlook: 🟢 Bullish above $77,000 🔴 Bearish below $75,000 🟡 Key resistance: $76,000–$77,000 🎯 Next target: $78,000–$80,000
Stay alert, manage your risk, and trade smart!
💎 Patience is the key to success in crypto.
#BinanceReopensWithdrawalsForHYPE&APT #BitcoinUpdate #CryptoMarket #Trading #BTCUSD
$BTC November 8, 2026
Bitcoin (BTC) continues to attract market attention as traders watch key support and resistance levels.
📊 Market Outlook: 🟢 Bullish above $77,000 🔴 Bearish below $75,000 🟡 Key resistance: $76,000–$77,000 🎯 Next target: $78,000–$80,000
Stay alert, manage your risk, and trade smart!
💎 Patience is the key to success in crypto.
#BinanceReopensWithdrawalsForHYPE&APT #BitcoinUpdate #CryptoMarket #Trading #BTCUSD

1
78

🌍 BITCOIN $BTC – GLOBAL MARKET ANALYSIS
📅 November 6, 2026
₿ Is Bitcoin Preparing for Its Next Major Move?
Bitcoin is showing mixed signals in the international crypto market. Global economic conditions and institutional demand could play a major role in determining its next direction.
📊 Key Market Factors
🇺🇸 US Federal Reserve policy and interest rates
💵 Dollar strength and Treasury yields
🏦 Institutional investment and Bitcoin ETF flows
📉 Global liquidity and market sentiment
🎯 Important BTC Price Levels
🟢 Resistance: $81,319 – $84,800
🔴 Support: $75,000 – $73,188
📈 Bullish Scenario: A strong breakout above $81,319 could open the door toward $84,800.
📉 Bearish Scenario: Losing $75,000 could increase selling pressure toward $73,188.
🔥 My Market Outlook: CAUTIOUSLY BEARISH
I believe traders should wait for confirmation before entering major positions. Global economic news and institutional buying activity will be important signals to watch.
💬 What is your BTC prediction?
Will Bitcoin reach $85K or drop toward $73K?
Share your thoughts below! 👇
⚠️ This analysis is for educational purposes only and is not financial advice. Always manage your risk.
#Bitcoin #BTC #GlobalCryptoMarket #CryptoAnalysis #BinanceSquare #BTCUSD #CryptoTrading. #MarketPrediction
🌍 BITCOIN $BTC – GLOBAL MARKET ANALYSIS
📅 November 6, 2026
₿ Is Bitcoin Preparing for Its Next Major Move?
Bitcoin is showing mixed signals in the international crypto market. Global economic conditions and institutional demand could play a major role in determining its next direction.
📊 Key Market Factors
🇺🇸 US Federal Reserve policy and interest rates
💵 Dollar strength and Treasury yields
🏦 Institutional investment and Bitcoin ETF flows
📉 Global liquidity and market sentiment
🎯 Important BTC Price Levels
🟢 Resistance: $81,319 – $84,800
🔴 Support: $75,000 – $73,188
📈 Bullish Scenario: A strong breakout above $81,319 could open the door toward $84,800.
📉 Bearish Scenario: Losing $75,000 could increase selling pressure toward $73,188.
🔥 My Market Outlook: CAUTIOUSLY BEARISH
I believe traders should wait for confirmation before entering major positions. Global economic news and institutional buying activity will be important signals to watch.
💬 What is your BTC prediction?
Will Bitcoin reach $85K or drop toward $73K?
Share your thoughts below! 👇
⚠️ This analysis is for educational purposes only and is not financial advice. Always manage your risk.
#Bitcoin #BTC #GlobalCryptoMarket #CryptoAnalysis #BinanceSquare #BTCUSD #CryptoTrading. #MarketPrediction
📅 November 6, 2026
₿ Is Bitcoin Preparing for Its Next Major Move?
Bitcoin is showing mixed signals in the international crypto market. Global economic conditions and institutional demand could play a major role in determining its next direction.
📊 Key Market Factors
🇺🇸 US Federal Reserve policy and interest rates
💵 Dollar strength and Treasury yields
🏦 Institutional investment and Bitcoin ETF flows
📉 Global liquidity and market sentiment
🎯 Important BTC Price Levels
🟢 Resistance: $81,319 – $84,800
🔴 Support: $75,000 – $73,188
📈 Bullish Scenario: A strong breakout above $81,319 could open the door toward $84,800.
📉 Bearish Scenario: Losing $75,000 could increase selling pressure toward $73,188.
🔥 My Market Outlook: CAUTIOUSLY BEARISH
I believe traders should wait for confirmation before entering major positions. Global economic news and institutional buying activity will be important signals to watch.
💬 What is your BTC prediction?
Will Bitcoin reach $85K or drop toward $73K?
Share your thoughts below! 👇
⚠️ This analysis is for educational purposes only and is not financial advice. Always manage your risk.
#Bitcoin #BTC #GlobalCryptoMarket #CryptoAnalysis #BinanceSquare #BTCUSD #CryptoTrading. #MarketPrediction
69

·
--
📉🔥 Bitcoin dropped exactly as we expected! 🔥📉
From $80,800 ➡️ to $76,450 💥
Down -5.38% in one day!! 😱
✅ Our prediction: a drop to $78,500
✅ What happened: it fell to $76,450 and even lower!
🎯 How far could it drop now?
1️⃣ $75,700 = first support level 🛡️
2️⃣ $73,000 = the strong bottom where we'll buy 💰
3️⃣ $70,000 = if it breaks below that, God help us 😅
💡 My advice:
❌ Don't buy now
✅ Get your money ready and wait for $73,000
🚀 The bounce from there will be strong!
What do you think? 🤔
Will it stop at $73,000 or continue down to $70,000?
Share your opinion in the comments 👇👇
#Bitcoin #BTC #Cryptocurrencies #Trading #Crypto
#Bitcoin #Crypto #BTCUSD $SOL $BNB
📉🔥 Bitcoin dropped exactly as we expected! 🔥📉
From $80,800 ➡️ to $76,450 💥
Down -5.38% in one day!! 😱
✅ Our prediction: a drop to $78,500
✅ What happened: it fell to $76,450 and even lower!
🎯 How far could it drop now?
1️⃣ $75,700 = first support level 🛡️
2️⃣ $73,000 = the strong bottom where we'll buy 💰
3️⃣ $70,000 = if it breaks below that, God help us 😅
💡 My advice:
❌ Don't buy now
✅ Get your money ready and wait for $73,000
🚀 The bounce from there will be strong!
What do you think? 🤔
Will it stop at $73,000 or continue down to $70,000?
Share your opinion in the comments 👇👇
#Bitcoin #BTC #Cryptocurrencies #Trading #Crypto
#Bitcoin #Crypto #BTCUSD $SOL $BNB
From $80,800 ➡️ to $76,450 💥
Down -5.38% in one day!! 😱
✅ Our prediction: a drop to $78,500
✅ What happened: it fell to $76,450 and even lower!
🎯 How far could it drop now?
1️⃣ $75,700 = first support level 🛡️
2️⃣ $73,000 = the strong bottom where we'll buy 💰
3️⃣ $70,000 = if it breaks below that, God help us 😅
💡 My advice:
❌ Don't buy now
✅ Get your money ready and wait for $73,000
🚀 The bounce from there will be strong!
What do you think? 🤔
Will it stop at $73,000 or continue down to $70,000?
Share your opinion in the comments 👇👇
#Bitcoin #BTC #Cryptocurrencies #Trading #Crypto
#Bitcoin #Crypto #BTCUSD $SOL $BNB

3
720
·
--
Article
Bitcoin Technical Analysis (Nov 06)H4 Bias: Bearish
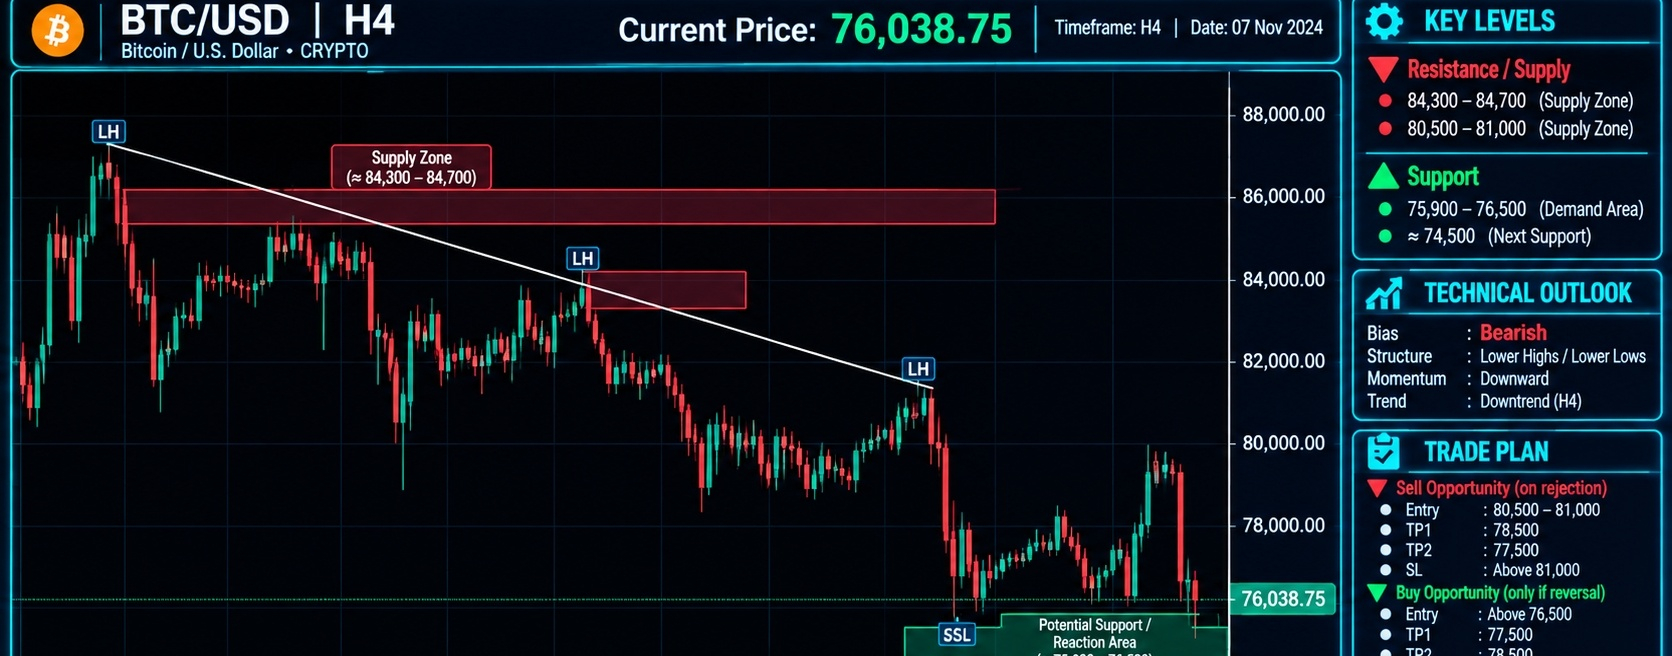
Structure State: Persistent bearish market structure with successive lower highs and lower lows beneath a descending trendline. Price has experienced a strong bearish break of structure below 80,000, followed by a sell-side liquidity sweep near 75,900–76,500 and a reaction from the potential support region.
Market Structure
$BTC maintains a clear bearish H4 structure following rejection from the 84,300–84,700 major supply region. The earlier recovery failed to establish sustained bullish continuation, and the market subsequently developed a sequence of lower highs and lower lows.
The descending trendline connecting the successive lower highs confirms the prevailing bearish direction. Price initially consolidated around the 80,000–81,000 region before developing another lower high near 81,500–82,000.
The subsequent bearish displacement produced a significant break of structure below 80,000, accelerating the decline toward the 75,900–76,500 potential support region.
The latest candles indicate a test of this lower support area, with price trading around 76,038.75 following the recent sell-side liquidity sweep. Although a temporary reaction is possible, the broader H4 structure remains bearish while price stays beneath the nearest supply region at 80,500–81,000.
Key Resistance
Resistance 1: 80,500–81,000 — immediate supply and potential bearish rejection region.Resistance 2: 84,300–84,700 — major supply and previous lower-high region.
Key Support
Support 1: 75,900–76,500 — immediate demand and potential reaction area.Support 2: Around 74,500 — next lower support region and potential downside liquidity reference.
FVG — Fair Value Gap
The chart does not identify a clearly confirmed unfilled FVG. The bearish displacement through the 80,000 region remains the primary imbalance reference. The immediate 80,500–81,000 supply region should be monitored during corrective recoveries, without automatically treating the entire zone as a confirmed fair value gap.
Order Block (OB)
The 80,500–81,000 region represents the nearest bearish supply and potential order-block area. The higher 84,300–84,700 region is the major supply zone associated with the broader bearish structure. The 75,900–76,500 region is the immediate potential demand area, where buyers would need to establish sustained bullish displacement to challenge the prevailing downside sequence.
Liquidity Map
Buy-side liquidity (BSL): Above 80,500–81,000, with major liquidity around 84,300–84,700.Sell-side liquidity (SSL): Around 75,900–76,500, where the recent downside sweep occurred.Lower liquidity reference: Around 74,500.Liquidity consideration: The latest downside sweep places BTCUSD near an important potential reaction area. A recovery from this region would remain corrective until price establishes a confirmed bullish change of character.
Trade Scenarios
Bearish continuation: Failure to reclaim 80,500–81,000 would preserve the bearish structure. A confirmed H4 breakdown beneath 75,900 would expose the next lower support region around 74,500.
Bullish recovery: A sustained reclaim above 81,000 would weaken the immediate bearish continuation scenario and provide room for a broader recovery. A stronger structural improvement would require a confirmed break above the descending trendline and subsequent acceptance above the 84,300–84,700 supply region.
Trendline
The descending trendline connecting the lower highs remains intact and confirms the broader bearish structure. The recent lower high near 81,500–82,000 reinforces the continued dominance of sellers. A sustained trendline breakout accompanied by a bullish change of character would be necessary to establish a meaningful recovery.
Invalidation
A sustained H4 close above 81,000 would weaken the immediate bearish outlook. A broader reclaim above 84,700 would invalidate the prevailing bearish thesis.
Professional Summary
Primary bias: Bearish.Immediate supply: 80,500–81,000.Major supply: 84,300–84,700.Immediate demand: 75,900–76,500.Lower support: Around 74,500.Recent SSL sweep: 75,900–76,500.Bearish trigger: Confirmed H4 breakdown below 75,900.Recovery trigger: Sustained reclaim above 81,000.Structural invalidation: Sustained acceptance above 84,700.
Risk consideration: BTCUSD is trading close to the lower boundary of its bearish structure following a significant downside liquidity sweep. A reaction from 75,900–76,500 is possible, but sustained bullish recovery requires a meaningful structural reclaim rather than a temporary bounce from support.
#BTC #bitcoin #BTCUSD #BTCTechnicalAnalysis
Bitcoin Technical Analysis (Nov 06)
H4 Bias: Bearish
Structure State: Persistent bearish market structure with successive lower highs and lower lows beneath a descending trendline. Price has experienced a strong bearish break of structure below 80,000, followed by a sell-side liquidity sweep near 75,900–76,500 and a reaction from the potential support region.
Market Structure
$BTC maintains a clear bearish H4 structure following rejection from the 84,300–84,700 major supply region. The earlier recovery failed to establish sustained bullish continuation, and the market subsequently developed a sequence of lower highs and lower lows.
The descending trendline connecting the successive lower highs confirms the prevailing bearish direction. Price initially consolidated around the 80,000–81,000 region before developing another lower high near 81,500–82,000.
The subsequent bearish displacement produced a significant break of structure below 80,000, accelerating the decline toward the 75,900–76,500 potential support region.
The latest candles indicate a test of this lower support area, with price trading around 76,038.75 following the recent sell-side liquidity sweep. Although a temporary reaction is possible, the broader H4 structure remains bearish while price stays beneath the nearest supply region at 80,500–81,000.
Key Resistance
Resistance 1: 80,500–81,000 — immediate supply and potential bearish rejection region.Resistance 2: 84,300–84,700 — major supply and previous lower-high region.
Key Support
Support 1: 75,900–76,500 — immediate demand and potential reaction area.Support 2: Around 74,500 — next lower support region and potential downside liquidity reference.
FVG — Fair Value Gap
The chart does not identify a clearly confirmed unfilled FVG. The bearish displacement through the 80,000 region remains the primary imbalance reference. The immediate 80,500–81,000 supply region should be monitored during corrective recoveries, without automatically treating the entire zone as a confirmed fair value gap.
Order Block (OB)
The 80,500–81,000 region represents the nearest bearish supply and potential order-block area. The higher 84,300–84,700 region is the major supply zone associated with the broader bearish structure. The 75,900–76,500 region is the immediate potential demand area, where buyers would need to establish sustained bullish displacement to challenge the prevailing downside sequence.
Liquidity Map
Buy-side liquidity (BSL): Above 80,500–81,000, with major liquidity around 84,300–84,700.Sell-side liquidity (SSL): Around 75,900–76,500, where the recent downside sweep occurred.Lower liquidity reference: Around 74,500.Liquidity consideration: The latest downside sweep places BTCUSD near an important potential reaction area. A recovery from this region would remain corrective until price establishes a confirmed bullish change of character.
Trade Scenarios
Bearish continuation: Failure to reclaim 80,500–81,000 would preserve the bearish structure. A confirmed H4 breakdown beneath 75,900 would expose the next lower support region around 74,500.
Bullish recovery: A sustained reclaim above 81,000 would weaken the immediate bearish continuation scenario and provide room for a broader recovery. A stronger structural improvement would require a confirmed break above the descending trendline and subsequent acceptance above the 84,300–84,700 supply region.
Trendline
The descending trendline connecting the lower highs remains intact and confirms the broader bearish structure. The recent lower high near 81,500–82,000 reinforces the continued dominance of sellers. A sustained trendline breakout accompanied by a bullish change of character would be necessary to establish a meaningful recovery.
Invalidation
A sustained H4 close above 81,000 would weaken the immediate bearish outlook. A broader reclaim above 84,700 would invalidate the prevailing bearish thesis.
Professional Summary
Primary bias: Bearish.Immediate supply: 80,500–81,000.Major supply: 84,300–84,700.Immediate demand: 75,900–76,500.Lower support: Around 74,500.Recent SSL sweep: 75,900–76,500.Bearish trigger: Confirmed H4 breakdown below 75,900.Recovery trigger: Sustained reclaim above 81,000.Structural invalidation: Sustained acceptance above 84,700.
Risk consideration: BTCUSD is trading close to the lower boundary of its bearish structure following a significant downside liquidity sweep. A reaction from 75,900–76,500 is possible, but sustained bullish recovery requires a meaningful structural reclaim rather than a temporary bounce from support.
#BTC #bitcoin #BTCUSD #BTCTechnicalAnalysis
Structure State: Persistent bearish market structure with successive lower highs and lower lows beneath a descending trendline. Price has experienced a strong bearish break of structure below 80,000, followed by a sell-side liquidity sweep near 75,900–76,500 and a reaction from the potential support region.
Market Structure
$BTC maintains a clear bearish H4 structure following rejection from the 84,300–84,700 major supply region. The earlier recovery failed to establish sustained bullish continuation, and the market subsequently developed a sequence of lower highs and lower lows.
The descending trendline connecting the successive lower highs confirms the prevailing bearish direction. Price initially consolidated around the 80,000–81,000 region before developing another lower high near 81,500–82,000.
The subsequent bearish displacement produced a significant break of structure below 80,000, accelerating the decline toward the 75,900–76,500 potential support region.
The latest candles indicate a test of this lower support area, with price trading around 76,038.75 following the recent sell-side liquidity sweep. Although a temporary reaction is possible, the broader H4 structure remains bearish while price stays beneath the nearest supply region at 80,500–81,000.
Key Resistance
Resistance 1: 80,500–81,000 — immediate supply and potential bearish rejection region.Resistance 2: 84,300–84,700 — major supply and previous lower-high region.
Key Support
Support 1: 75,900–76,500 — immediate demand and potential reaction area.Support 2: Around 74,500 — next lower support region and potential downside liquidity reference.
FVG — Fair Value Gap
The chart does not identify a clearly confirmed unfilled FVG. The bearish displacement through the 80,000 region remains the primary imbalance reference. The immediate 80,500–81,000 supply region should be monitored during corrective recoveries, without automatically treating the entire zone as a confirmed fair value gap.
Order Block (OB)
The 80,500–81,000 region represents the nearest bearish supply and potential order-block area. The higher 84,300–84,700 region is the major supply zone associated with the broader bearish structure. The 75,900–76,500 region is the immediate potential demand area, where buyers would need to establish sustained bullish displacement to challenge the prevailing downside sequence.
Liquidity Map
Buy-side liquidity (BSL): Above 80,500–81,000, with major liquidity around 84,300–84,700.Sell-side liquidity (SSL): Around 75,900–76,500, where the recent downside sweep occurred.Lower liquidity reference: Around 74,500.Liquidity consideration: The latest downside sweep places BTCUSD near an important potential reaction area. A recovery from this region would remain corrective until price establishes a confirmed bullish change of character.
Trade Scenarios
Bearish continuation: Failure to reclaim 80,500–81,000 would preserve the bearish structure. A confirmed H4 breakdown beneath 75,900 would expose the next lower support region around 74,500.
Bullish recovery: A sustained reclaim above 81,000 would weaken the immediate bearish continuation scenario and provide room for a broader recovery. A stronger structural improvement would require a confirmed break above the descending trendline and subsequent acceptance above the 84,300–84,700 supply region.
Trendline
The descending trendline connecting the lower highs remains intact and confirms the broader bearish structure. The recent lower high near 81,500–82,000 reinforces the continued dominance of sellers. A sustained trendline breakout accompanied by a bullish change of character would be necessary to establish a meaningful recovery.
Invalidation
A sustained H4 close above 81,000 would weaken the immediate bearish outlook. A broader reclaim above 84,700 would invalidate the prevailing bearish thesis.
Professional Summary
Primary bias: Bearish.Immediate supply: 80,500–81,000.Major supply: 84,300–84,700.Immediate demand: 75,900–76,500.Lower support: Around 74,500.Recent SSL sweep: 75,900–76,500.Bearish trigger: Confirmed H4 breakdown below 75,900.Recovery trigger: Sustained reclaim above 81,000.Structural invalidation: Sustained acceptance above 84,700.
Risk consideration: BTCUSD is trading close to the lower boundary of its bearish structure following a significant downside liquidity sweep. A reaction from 75,900–76,500 is possible, but sustained bullish recovery requires a meaningful structural reclaim rather than a temporary bounce from support.
#BTC #bitcoin #BTCUSD #BTCTechnicalAnalysis
107

·
--
The market is entering a key period in which economic data, corporate earnings, and institutional flows could significantly influence Bitcoin's price.
🔍 Smart investors are watching: • Global liquidity • Interest rate decisions • Bitcoin ETFs • Institutional adoption
Are we seeing the buildup to the next big move?
#Bitcoin #CryptoMarket #BinanceSquare #Investing #BTCUSD
The market is entering a key period in which economic data, corporate earnings, and institutional flows could significantly influence Bitcoin's price.
🔍 Smart investors are watching: • Global liquidity • Interest rate decisions • Bitcoin ETFs • Institutional adoption
Are we seeing the buildup to the next big move?
#Bitcoin #CryptoMarket #BinanceSquare #Investing #BTCUSD
🔍 Smart investors are watching: • Global liquidity • Interest rate decisions • Bitcoin ETFs • Institutional adoption
Are we seeing the buildup to the next big move?
#Bitcoin #CryptoMarket #BinanceSquare #Investing #BTCUSD
37

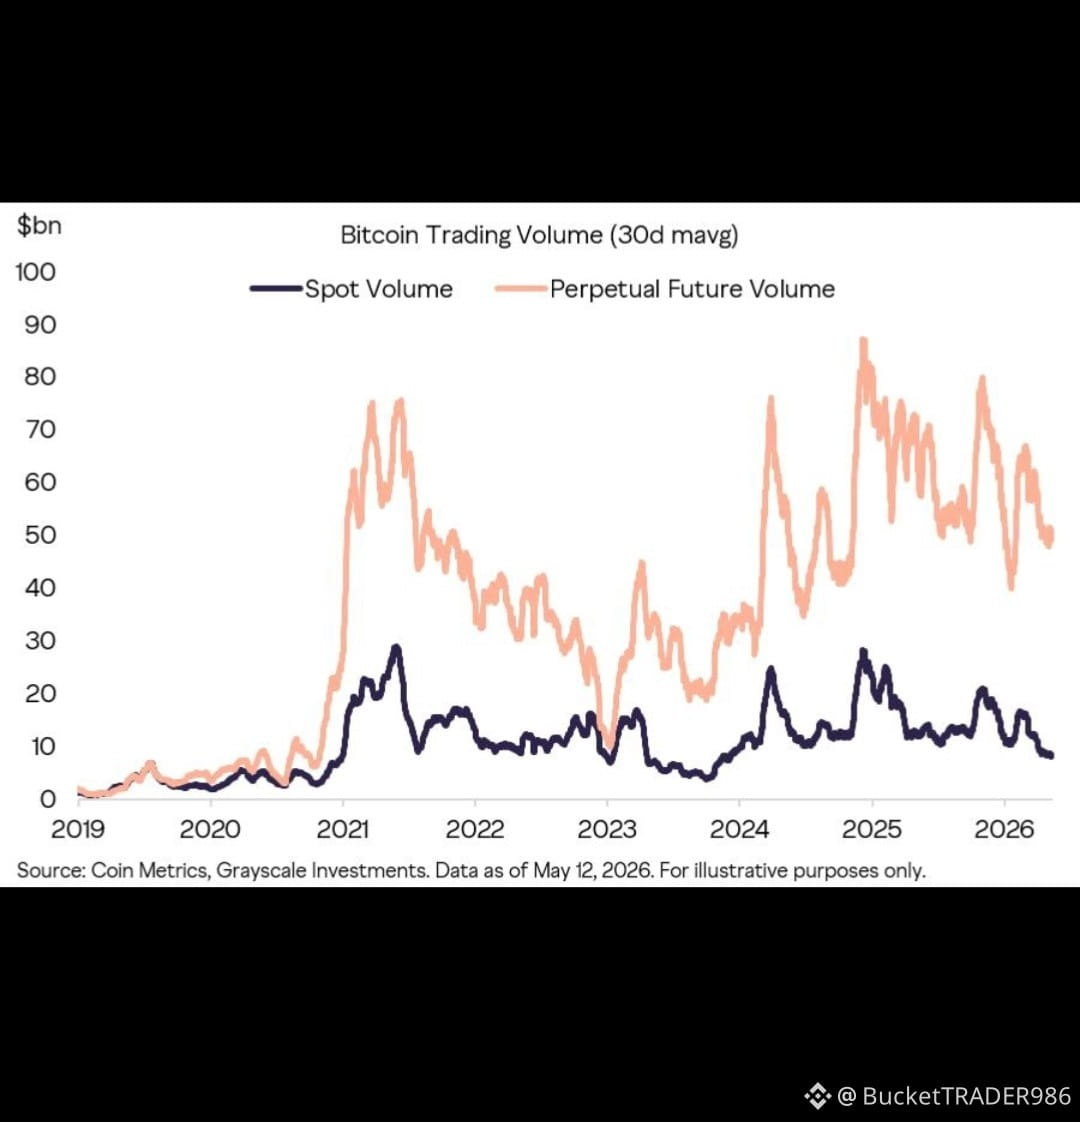
📊 BTC MARKET UPDATE | VOLUME ANALYSIS
Bitcoin's trading activity remains stronger than its pre-pump levels, despite the recent market pullback.
According to Glassnode's data, BTC trading volume has stayed above its previous baseline, suggesting that market participation and trader interest remain active.
🔥 Key Takeaways:
- Trading volume remains above pre-pump levels.
- Market participation is still active.
- Recent price corrections have not eliminated trading interest.
- A strong volume-supported breakout could signal renewed bullish momentum.
🎯 My Focus: Watching BTC price action, volume confirmation, and key resistance levels.
The market is giving signals. Let confirmation lead the decision.
Stay disciplined. Trade smart. DYOR.
#Bitcoin #BTC #Binance #CryptoMarket #BTCAnalysis #BitcoinUpdate #TradingVolume #Glassnode #BullishMomentum. #cryptotrading #BTCUSD T #dyor
📊 BTC MARKET UPDATE | VOLUME ANALYSIS
Bitcoin's trading activity remains stronger than its pre-pump levels, despite the recent market pullback.
According to Glassnode's data, BTC trading volume has stayed above its previous baseline, suggesting that market participation and trader interest remain active.
🔥 Key Takeaways:
- Trading volume remains above pre-pump levels.
- Market participation is still active.
- Recent price corrections have not eliminated trading interest.
- A strong volume-supported breakout could signal renewed bullish momentum.
🎯 My Focus: Watching BTC price action, volume confirmation, and key resistance levels.
The market is giving signals. Let confirmation lead the decision.
Stay disciplined. Trade smart. DYOR.
#Bitcoin #BTC #Binance #CryptoMarket #BTCAnalysis #BitcoinUpdate #TradingVolume #Glassnode #BullishMomentum. #cryptotrading #BTCUSD T #dyor
Bitcoin's trading activity remains stronger than its pre-pump levels, despite the recent market pullback.
According to Glassnode's data, BTC trading volume has stayed above its previous baseline, suggesting that market participation and trader interest remain active.
🔥 Key Takeaways:
- Trading volume remains above pre-pump levels.
- Market participation is still active.
- Recent price corrections have not eliminated trading interest.
- A strong volume-supported breakout could signal renewed bullish momentum.
🎯 My Focus: Watching BTC price action, volume confirmation, and key resistance levels.
The market is giving signals. Let confirmation lead the decision.
Stay disciplined. Trade smart. DYOR.
#Bitcoin #BTC #Binance #CryptoMarket #BTCAnalysis #BitcoinUpdate #TradingVolume #Glassnode #BullishMomentum. #cryptotrading #BTCUSD T #dyor
68

·
--
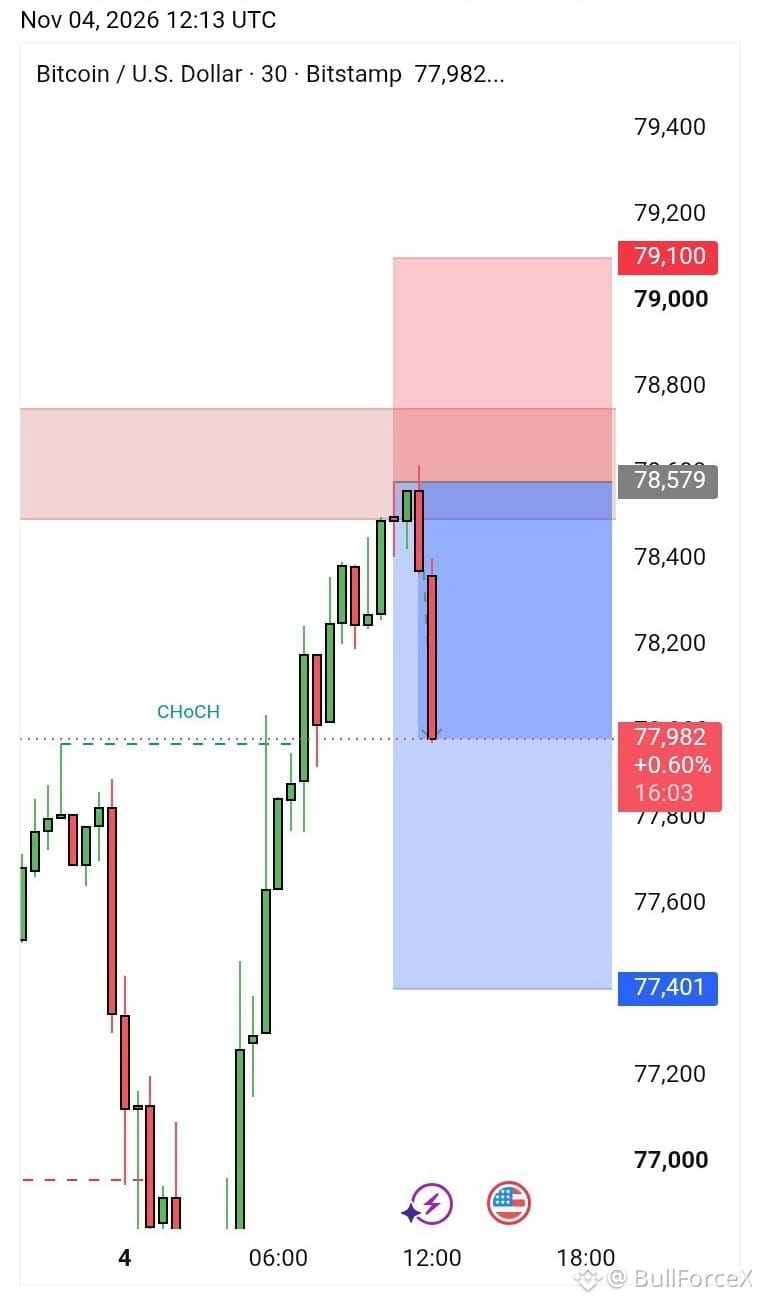
🚨 #BTCUSD SELL UPDATE 📉
🔥 77,982 REACHED! ✅ TP2 HIT! 🏆
💰 SELL from 78,579 → 77,982
📈 Running PROFIT! 💵
🎯 TP1: 78,300 HIT ✅
🎯 TP2: 78,000 HIT ✅
🎯 TP3: 77,700 — Next Target 👀
📊 Strong bearish momentum continues
{future}(BTCUSDT)
🚨 #BTCUSD SELL UPDATE 📉
🔥 77,982 REACHED! ✅ TP2 HIT! 🏆
💰 SELL from 78,579 → 77,982
📈 Running PROFIT! 💵
🎯 TP1: 78,300 HIT ✅
🎯 TP2: 78,000 HIT ✅
🎯 TP3: 77,700 — Next Target 👀
📊 Strong bearish momentum continues
🔥 77,982 REACHED! ✅ TP2 HIT! 🏆
💰 SELL from 78,579 → 77,982
📈 Running PROFIT! 💵
🎯 TP1: 78,300 HIT ✅
🎯 TP2: 78,000 HIT ✅
🎯 TP3: 77,700 — Next Target 👀
📊 Strong bearish momentum continues
6
192

·
--
🚨 BREAKING CRYPTO NEWS 🚨
🇺🇸 US MIDTERM ELECTIONS SHAKE THE CRYPTO MARKET!
Bitcoin is facing fresh market pressure as investors closely watch the US midterm elections.
📉 BTC is trading near $77,000.
⚠️ What's affecting the market?
🔹 US election uncertainty
🔹 Bitcoin ETF outflows
🔹 Concerns surrounding crypto security
🔹 The future of US crypto regulations
🔥 The big question:
Will Bitcoin recover and push toward $80,000, or could another correction be coming?
📊 KEY LEVELS TO WATCH:
🔸 $75,000 — Important support zone
🔸 $77,000 — Current market area
🔸 $80,000 — Major psychological level
👇 YOUR OPINION MATTERS!
Are you buying the dip or waiting for confirmation?
🚀 BULLISH or 📉 BEARISH?
#Bitcoin #BTC #CryptoNews #BinanceSquare #CryptoMarket #Trading #BTCUSD
🚨 BREAKING CRYPTO NEWS 🚨
🇺🇸 US MIDTERM ELECTIONS SHAKE THE CRYPTO MARKET!
Bitcoin is facing fresh market pressure as investors closely watch the US midterm elections.
📉 BTC is trading near $77,000.
⚠️ What's affecting the market?
🔹 US election uncertainty
🔹 Bitcoin ETF outflows
🔹 Concerns surrounding crypto security
🔹 The future of US crypto regulations
🔥 The big question:
Will Bitcoin recover and push toward $80,000, or could another correction be coming?
📊 KEY LEVELS TO WATCH:
🔸 $75,000 — Important support zone
🔸 $77,000 — Current market area
🔸 $80,000 — Major psychological level
👇 YOUR OPINION MATTERS!
Are you buying the dip or waiting for confirmation?
🚀 BULLISH or 📉 BEARISH?
#Bitcoin #BTC #CryptoNews #BinanceSquare #CryptoMarket #Trading #BTCUSD
🇺🇸 US MIDTERM ELECTIONS SHAKE THE CRYPTO MARKET!
Bitcoin is facing fresh market pressure as investors closely watch the US midterm elections.
📉 BTC is trading near $77,000.
⚠️ What's affecting the market?
🔹 US election uncertainty
🔹 Bitcoin ETF outflows
🔹 Concerns surrounding crypto security
🔹 The future of US crypto regulations
🔥 The big question:
Will Bitcoin recover and push toward $80,000, or could another correction be coming?
📊 KEY LEVELS TO WATCH:
🔸 $75,000 — Important support zone
🔸 $77,000 — Current market area
🔸 $80,000 — Major psychological level
👇 YOUR OPINION MATTERS!
Are you buying the dip or waiting for confirmation?
🚀 BULLISH or 📉 BEARISH?
#Bitcoin #BTC #CryptoNews #BinanceSquare #CryptoMarket #Trading #BTCUSD

70
·
--
Bullish
🚨 BREAKING CRYPTO NEWS: BITCOIN RECOVERS $78,000! 🚀
Bitcoin (BTC) is showing signs of recovery after a major market selloff.
📉 BTC dropped near $75,600 amid uncertainty surrounding the US midterm elections.
📈 Bitcoin has now reclaimed the $78,000 level.
🔥 What's driving the market?
• US election uncertainty
• Changing expectations around crypto regulations
• Institutional investment flows
• Market recovery after heavy selling pressure
👀 Key Levels to Watch:
🔹 Support: $76,000 – $77,000
🔹 Resistance: $78,500 – $80,000
Will Bitcoin break above $80K or face another correction?
👇 What do you think?
BULLISH 🚀 or BEARISH 📉?
#Bitcoin #BTC #CryptoNews #BinanceSquare #CryptoMarket #BTCUSD
🚨 BREAKING CRYPTO NEWS: BITCOIN RECOVERS $78,000! 🚀
Bitcoin (BTC) is showing signs of recovery after a major market selloff.
📉 BTC dropped near $75,600 amid uncertainty surrounding the US midterm elections.
📈 Bitcoin has now reclaimed the $78,000 level.
🔥 What's driving the market?
• US election uncertainty
• Changing expectations around crypto regulations
• Institutional investment flows
• Market recovery after heavy selling pressure
👀 Key Levels to Watch:
🔹 Support: $76,000 – $77,000
🔹 Resistance: $78,500 – $80,000
Will Bitcoin break above $80K or face another correction?
👇 What do you think?
BULLISH 🚀 or BEARISH 📉?
#Bitcoin #BTC #CryptoNews #BinanceSquare #CryptoMarket #BTCUSD
Bitcoin (BTC) is showing signs of recovery after a major market selloff.
📉 BTC dropped near $75,600 amid uncertainty surrounding the US midterm elections.
📈 Bitcoin has now reclaimed the $78,000 level.
🔥 What's driving the market?
• US election uncertainty
• Changing expectations around crypto regulations
• Institutional investment flows
• Market recovery after heavy selling pressure
👀 Key Levels to Watch:
🔹 Support: $76,000 – $77,000
🔹 Resistance: $78,500 – $80,000
Will Bitcoin break above $80K or face another correction?
👇 What do you think?
BULLISH 🚀 or BEARISH 📉?
#Bitcoin #BTC #CryptoNews #BinanceSquare #CryptoMarket #BTCUSD

61

·
--
Bearish
#BTCUSD trend movements
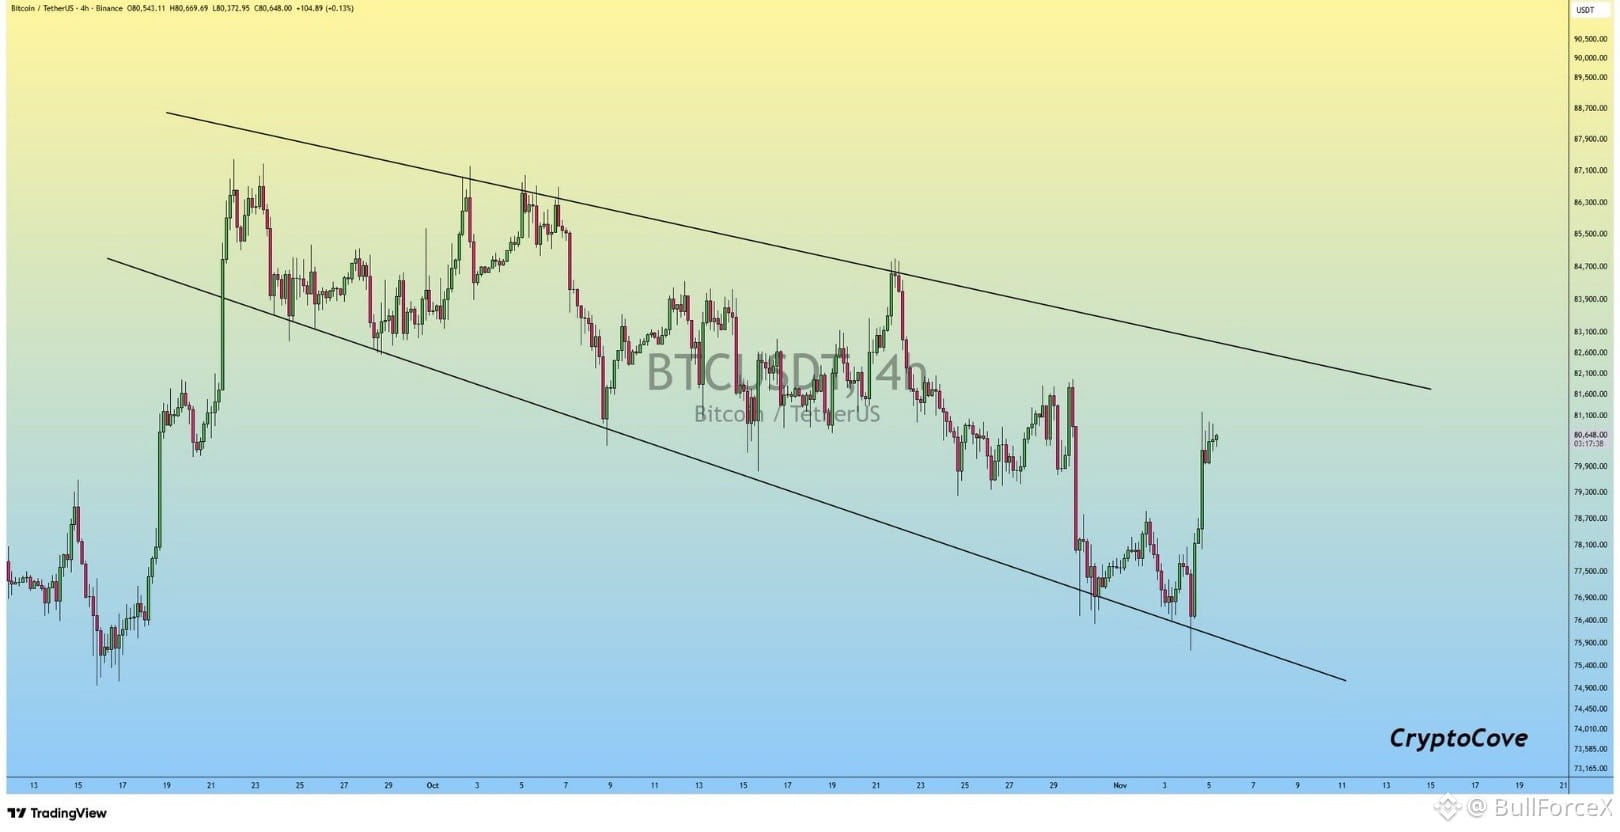
Big move on BTCUSD: it broke the descending channel. What now?
BTCUSD moved within the descending channel, which formed when the price touched the channel borders 9 times and has been valid since 21 September.
Current situation
BTCUSD broke through the lower boundary of the descending channel.
Possible scenario
Analysts recommend opening a Sell order with a stop loss near the lower channel border.
I will publish our next post on price channels at 8:00 a.m. UTC tomorrow. Come back to discover more trading insights.
Share your thoughts in the comments section if it's available for you.$BTC
#BTCUSD trend movements
Big move on BTCUSD: it broke the descending channel. What now?
BTCUSD moved within the descending channel, which formed when the price touched the channel borders 9 times and has been valid since 21 September.
Current situation
BTCUSD broke through the lower boundary of the descending channel.
Possible scenario
Analysts recommend opening a Sell order with a stop loss near the lower channel border.
I will publish our next post on price channels at 8:00 a.m. UTC tomorrow. Come back to discover more trading insights.
Share your thoughts in the comments section if it's available for you.$BTC
Big move on BTCUSD: it broke the descending channel. What now?
BTCUSD moved within the descending channel, which formed when the price touched the channel borders 9 times and has been valid since 21 September.
Current situation
BTCUSD broke through the lower boundary of the descending channel.
Possible scenario
Analysts recommend opening a Sell order with a stop loss near the lower channel border.
I will publish our next post on price channels at 8:00 a.m. UTC tomorrow. Come back to discover more trading insights.
Share your thoughts in the comments section if it's available for you.$BTC
1
98
Log in to explore more content
Join global crypto users on Binance Square
⚡️ Get latest and useful information about crypto.
💬 Trusted by the world’s largest crypto exchange.
👍 Discover real insights from verified creators.
Email / Phone number
Trending Topics
1
#WhoWillSucceedJensenHuangatNvidia?
81,433 views
1,099 Discussing
2
#WhatWillDriveCryptoandStocks’NextRebound?
431,655 views
3,003 Discussing
3
#BitcoinActiveSupplyInProfitDropsBelow45%
21,738 views
326 Discussing
4
#KavaSaysAbnormalActivityLimitedToKavaLend
8,507 views
166 Discussing
5
#USSpotXRPETFsSeeLargestWeeklyOutflowIn8Months
7,720 views
155 Discussing
6
#USPPIMissMayEaseBTCPressure
206,752 views
2,036 Discussing
7
#WORPTLetsTouristsConvertCryptoToThaiBaht
2,550 views
49 Discussing
8
#TONStrategyReports$23.97MQ3NetLoss
3,193 views
41 Discussing
9
#PolkadotCommunityApprovesNewStrategyWith97%Vote
18,626 views
242 Discussing
10
#dYdXPlansV9.9UpgradeToShiftUSDCToInjective
11,380 views
193 Discussing