

#btcfallsbelow200weekma
btcfallsbelow200weekma
207,809 views
972 Discussing
Hot
Latest

·
--
Bearish
#BTCFallsBelow200WeekMA
Bitcoin has officially crossed below its 200-week Moving Average (MA), a historically significant macro baseline that has rarely been breached in past cycles. For long-term crypto investors, this indicator represents the ultimate "line in the sand" during major market capitulations. Here is what you need to know about this technical shift:
Why It Matters
Historical Floor Broken: Historically, the 200-week MA has acted as an ironclad support level during previous bear markets (like 2015, 2018, and 2020), marking the absolute bottom of the cycle.
Shift in Momentum: Falling and closing below this line suggests that the current macro downtrend is experiencing unprecedented selling pressure, pushing BTC into deep undervaluation territory.
Overextended Market: Indicators like the MVRV Z-Score and RSI are screaming "oversold," mirroring conditions only seen during past cyclical bottoms.
Is This a Generational Buying Opportunity?
While technical analysts warn that temporary "wicks" or prolonged consolidation below this line can happen before a true reversal, history suggests this zone offers an asymmetric risk-to-reward ratio for long-term accumulators.
Are we looking at the ultimate bear market capitulation, or is this time truly different for crypto?
📉 Stay disciplined, manage your risk, and keep your eyes on the macro charts.
#Bitcoin #BTC #Crypto #TechnicalAnalysis #BearMarket #BTCFallsBelow200WeekMA
$BTC
{future}(BTCUSDT)
#BTCFallsBelow200WeekMA
Bitcoin has officially crossed below its 200-week Moving Average (MA), a historically significant macro baseline that has rarely been breached in past cycles. For long-term crypto investors, this indicator represents the ultimate "line in the sand" during major market capitulations. Here is what you need to know about this technical shift:
Why It Matters
Historical Floor Broken: Historically, the 200-week MA has acted as an ironclad support level during previous bear markets (like 2015, 2018, and 2020), marking the absolute bottom of the cycle.
Shift in Momentum: Falling and closing below this line suggests that the current macro downtrend is experiencing unprecedented selling pressure, pushing BTC into deep undervaluation territory.
Overextended Market: Indicators like the MVRV Z-Score and RSI are screaming "oversold," mirroring conditions only seen during past cyclical bottoms.
Is This a Generational Buying Opportunity?
While technical analysts warn that temporary "wicks" or prolonged consolidation below this line can happen before a true reversal, history suggests this zone offers an asymmetric risk-to-reward ratio for long-term accumulators.
Are we looking at the ultimate bear market capitulation, or is this time truly different for crypto?
📉 Stay disciplined, manage your risk, and keep your eyes on the macro charts.
#Bitcoin #BTC #Crypto #TechnicalAnalysis #BearMarket #BTCFallsBelow200WeekMA
$BTC
Bitcoin has officially crossed below its 200-week Moving Average (MA), a historically significant macro baseline that has rarely been breached in past cycles. For long-term crypto investors, this indicator represents the ultimate "line in the sand" during major market capitulations. Here is what you need to know about this technical shift:
Why It Matters
Historical Floor Broken: Historically, the 200-week MA has acted as an ironclad support level during previous bear markets (like 2015, 2018, and 2020), marking the absolute bottom of the cycle.
Shift in Momentum: Falling and closing below this line suggests that the current macro downtrend is experiencing unprecedented selling pressure, pushing BTC into deep undervaluation territory.
Overextended Market: Indicators like the MVRV Z-Score and RSI are screaming "oversold," mirroring conditions only seen during past cyclical bottoms.
Is This a Generational Buying Opportunity?
While technical analysts warn that temporary "wicks" or prolonged consolidation below this line can happen before a true reversal, history suggests this zone offers an asymmetric risk-to-reward ratio for long-term accumulators.
Are we looking at the ultimate bear market capitulation, or is this time truly different for crypto?
📉 Stay disciplined, manage your risk, and keep your eyes on the macro charts.
#Bitcoin #BTC #Crypto #TechnicalAnalysis #BearMarket #BTCFallsBelow200WeekMA
$BTC

71

Bitcoin Tests Critical Support
$BTC trading below the 200-week MA is raising concerns among investors. Historically, this level has acted as a major support during bear markets, making the current price action closely watched.
Altcoin update: $XRP remains stable, while $BNB continues to attract buying interest despite market pressure.
{future}(BTCUSDT)
#BTCFallsBelow200WeekMA #BTC #XRP #BNB #CryptoMarket
Bitcoin Tests Critical Support
$BTC trading below the 200-week MA is raising concerns among investors. Historically, this level has acted as a major support during bear markets, making the current price action closely watched.
Altcoin update: $XRP remains stable, while $BNB continues to attract buying interest despite market pressure.
#BTCFallsBelow200WeekMA #BTC #XRP #BNB #CryptoMarket
$BTC trading below the 200-week MA is raising concerns among investors. Historically, this level has acted as a major support during bear markets, making the current price action closely watched.
Altcoin update: $XRP remains stable, while $BNB continues to attract buying interest despite market pressure.
#BTCFallsBelow200WeekMA #BTC #XRP #BNB #CryptoMarket
1
143

·
--
#btcfallsbelow200weekma
📉 #BTCFallsBelow200WeekMA — History Says +113% in the Next Year
$BTC just closed below the 200-week moving average (~$62,358) for the first time in nearly two years. Currently trading ~$60,400 , down 5% on the week.
What history tells us: Per Kraken's chief economist, when BTC dips below the 200W MA:
💥Median return in the following year: +113%
💥Median time to breakeven: just 2 days
💥This has happened only ~10% of trading days since mid-2017
Supporting signals:
💥OG holders (5+ years) selling at 19-month lows — just 962 BTC/day
💥ETF outflows pace is narrowing after a record $6B 30-day drain
💥$10.6B options expiry Friday with a $60K put wall creating a magnetic floor
{future}(BTCUSDT)
The flip side:
💥Deutsche Bank cites Fed hawkishness & rotation into AI as headwinds
💥10x Research warns of a possible drop to $55K
💥Retail trading volumes have collapsed
🎯 The verdict: The 200-week MA is the most respected support level in Bitcoin history. Every dip below it has historically been one of the best risk/reward entries in all of crypto. The question is whether this time is different.
NFA — DYOR.
#btcfallsbelow200weekma
📉 #BTCFallsBelow200WeekMA — History Says +113% in the Next Year
$BTC just closed below the 200-week moving average (~$62,358) for the first time in nearly two years. Currently trading ~$60,400 , down 5% on the week.
What history tells us: Per Kraken's chief economist, when BTC dips below the 200W MA:
💥Median return in the following year: +113%
💥Median time to breakeven: just 2 days
💥This has happened only ~10% of trading days since mid-2017
Supporting signals:
💥OG holders (5+ years) selling at 19-month lows — just 962 BTC/day
💥ETF outflows pace is narrowing after a record $6B 30-day drain
💥$10.6B options expiry Friday with a $60K put wall creating a magnetic floor
The flip side:
💥Deutsche Bank cites Fed hawkishness & rotation into AI as headwinds
💥10x Research warns of a possible drop to $55K
💥Retail trading volumes have collapsed
🎯 The verdict: The 200-week MA is the most respected support level in Bitcoin history. Every dip below it has historically been one of the best risk/reward entries in all of crypto. The question is whether this time is different.
NFA — DYOR.
📉 #BTCFallsBelow200WeekMA — History Says +113% in the Next Year
$BTC just closed below the 200-week moving average (~$62,358) for the first time in nearly two years. Currently trading ~$60,400 , down 5% on the week.
What history tells us: Per Kraken's chief economist, when BTC dips below the 200W MA:
💥Median return in the following year: +113%
💥Median time to breakeven: just 2 days
💥This has happened only ~10% of trading days since mid-2017
Supporting signals:
💥OG holders (5+ years) selling at 19-month lows — just 962 BTC/day
💥ETF outflows pace is narrowing after a record $6B 30-day drain
💥$10.6B options expiry Friday with a $60K put wall creating a magnetic floor
The flip side:
💥Deutsche Bank cites Fed hawkishness & rotation into AI as headwinds
💥10x Research warns of a possible drop to $55K
💥Retail trading volumes have collapsed
🎯 The verdict: The 200-week MA is the most respected support level in Bitcoin history. Every dip below it has historically been one of the best risk/reward entries in all of crypto. The question is whether this time is different.
NFA — DYOR.
1
4
4.4k

📉 Bitcoin has fallen below its 200-week moving average, and many investors are asking the same question:
Is this a warning sign or a long-term opportunity?
Market cycles have always been part of Bitcoin's journey.
Some investors see fear.
Others see potential.
No one knows what happens next, but moments like these often test patience more than prediction.
How are you approaching the current market?
🟢 Buying more
🔵 Holding
🟠 Waiting for confirmation
🔴 Staying on the sidelines
👇 Share your strategy.
#BTCFallsBelow200WeekMA
#BTCBreaksBelowRainbowChartFloor
#Bitcoin❗
#crypto
#BİNANCE
$BTC
{spot}(BTCUSDT)
📉 Bitcoin has fallen below its 200-week moving average, and many investors are asking the same question:
Is this a warning sign or a long-term opportunity?
Market cycles have always been part of Bitcoin's journey.
Some investors see fear.
Others see potential.
No one knows what happens next, but moments like these often test patience more than prediction.
How are you approaching the current market?
🟢 Buying more
🔵 Holding
🟠 Waiting for confirmation
🔴 Staying on the sidelines
👇 Share your strategy.
#BTCFallsBelow200WeekMA
#BTCBreaksBelowRainbowChartFloor
#Bitcoin❗
#crypto
#BİNANCE
$BTC
Is this a warning sign or a long-term opportunity?
Market cycles have always been part of Bitcoin's journey.
Some investors see fear.
Others see potential.
No one knows what happens next, but moments like these often test patience more than prediction.
How are you approaching the current market?
🟢 Buying more
🔵 Holding
🟠 Waiting for confirmation
🔴 Staying on the sidelines
👇 Share your strategy.
#BTCFallsBelow200WeekMA
#BTCBreaksBelowRainbowChartFloor
#Bitcoin❗
#crypto
#BİNANCE
$BTC
Buying more
56%
Holding
6%
Waiting for confirmation
25%
Staying on the sidelines
13%
16 votes • Voting closed
421

Bitcoin briefly slipped below its 200-week moving average during the recent selloff, but has since recovered above that key long-term support level. For now, the recovery matters more than the breakdown, and traders are watching to see if BTC can build momentum from here.#BTCFallsBelow200WeekMA
Bitcoin briefly slipped below its 200-week moving average during the recent selloff, but has since recovered above that key long-term support level. For now, the recovery matters more than the breakdown, and traders are watching to see if BTC can build momentum from here.#BTCFallsBelow200WeekMA
47

·
--
#BTCFallsBelow200WeekMA
Bitcoin falling below its 200-week moving average has captured the attention of traders and investors across the crypto market. Historically, this level has been viewed as a key long-term support zone, making its breakdown a significant event for market sentiment.
While short-term volatility may increase, experienced investors know that every major correction in Bitcoin's history has also created opportunities for long-term accumulation. Market cycles come and go, but innovation, adoption, and institutional interest continue to shape the future of digital assets.
The coming weeks will be crucial as traders watch whether Bitcoin can reclaim this important level or if further downside pressure emerges. Risk management remains essential, but history has shown that resilience is one of Bitcoin's defining characteristics.
#Bitcoin #BTC #Crypto #CryptoMarket #Trading #Investing #Blockchain #MarketUpdate #BullRun #DigitalAssets
#Bitcoin #BTC #Crypto #CryptoMarket #Trading #Investing #Blockchain #MarketUpdate #BullRun #DigitalAssets
#BTCFallsBelow200WeekMA
Bitcoin falling below its 200-week moving average has captured the attention of traders and investors across the crypto market. Historically, this level has been viewed as a key long-term support zone, making its breakdown a significant event for market sentiment.
While short-term volatility may increase, experienced investors know that every major correction in Bitcoin's history has also created opportunities for long-term accumulation. Market cycles come and go, but innovation, adoption, and institutional interest continue to shape the future of digital assets.
The coming weeks will be crucial as traders watch whether Bitcoin can reclaim this important level or if further downside pressure emerges. Risk management remains essential, but history has shown that resilience is one of Bitcoin's defining characteristics.
#Bitcoin #BTC #Crypto #CryptoMarket #Trading #Investing #Blockchain #MarketUpdate #BullRun #DigitalAssets
#Bitcoin #BTC #Crypto #CryptoMarket #Trading #Investing #Blockchain #MarketUpdate #BullRun #DigitalAssets
Bitcoin falling below its 200-week moving average has captured the attention of traders and investors across the crypto market. Historically, this level has been viewed as a key long-term support zone, making its breakdown a significant event for market sentiment.
While short-term volatility may increase, experienced investors know that every major correction in Bitcoin's history has also created opportunities for long-term accumulation. Market cycles come and go, but innovation, adoption, and institutional interest continue to shape the future of digital assets.
The coming weeks will be crucial as traders watch whether Bitcoin can reclaim this important level or if further downside pressure emerges. Risk management remains essential, but history has shown that resilience is one of Bitcoin's defining characteristics.
#Bitcoin #BTC #Crypto #CryptoMarket #Trading #Investing #Blockchain #MarketUpdate #BullRun #DigitalAssets
#Bitcoin #BTC #Crypto #CryptoMarket #Trading #Investing #Blockchain #MarketUpdate #BullRun #DigitalAssets
1
139

#BTCFallsBelow200WeekMA #BTCFallsBelow200WeekMA
Bitcoin has recently slipped below its closely watched 200-week moving average (200WMA), a technical level that many traders consider a key indicator of long-term market health. BTC fell below $61,000, marking the first break of this support zone since the 2022 bear market.
Why the 200-week MA matters
The 200WMA has historically acted as a major support level during previous Bitcoin bear markets.
A break below it is often viewed as a sign of prolonged weakness and can trigger additional selling pressure from technical traders.
Historically, Bitcoin has spent limited periods below this level before eventually recovering, though past performance does not guarantee future results.
What's driving the decline?
Continued outflows from Bitcoin ETFs and broader risk-off sentiment.
Investors shifting capital toward booming AI and technology sectors.
Reduced expectations for near-term interest-rate cuts after strong U.S. economic data.
What traders are watching
The area around $60,000–$62,000 remains a critical support zone.
A sustained move below that range could open the door to deeper downside targets.
Conversely, reclaiming the 200-week MA would be seen as a constructive signal for market sentiment.
📉 Market takeaway: Falling below the 200-week moving average is a significant technical event for Bitcoin, but traders are focused on whether the breakdown becomes sustained or turns into another temporary deviation below long-term support.
#BTCFallsBelow200WeekMA #BTCFallsBelow200WeekMA
Bitcoin has recently slipped below its closely watched 200-week moving average (200WMA), a technical level that many traders consider a key indicator of long-term market health. BTC fell below $61,000, marking the first break of this support zone since the 2022 bear market.
Why the 200-week MA matters
The 200WMA has historically acted as a major support level during previous Bitcoin bear markets.
A break below it is often viewed as a sign of prolonged weakness and can trigger additional selling pressure from technical traders.
Historically, Bitcoin has spent limited periods below this level before eventually recovering, though past performance does not guarantee future results.
What's driving the decline?
Continued outflows from Bitcoin ETFs and broader risk-off sentiment.
Investors shifting capital toward booming AI and technology sectors.
Reduced expectations for near-term interest-rate cuts after strong U.S. economic data.
What traders are watching
The area around $60,000–$62,000 remains a critical support zone.
A sustained move below that range could open the door to deeper downside targets.
Conversely, reclaiming the 200-week MA would be seen as a constructive signal for market sentiment.
📉 Market takeaway: Falling below the 200-week moving average is a significant technical event for Bitcoin, but traders are focused on whether the breakdown becomes sustained or turns into another temporary deviation below long-term support.
Bitcoin has recently slipped below its closely watched 200-week moving average (200WMA), a technical level that many traders consider a key indicator of long-term market health. BTC fell below $61,000, marking the first break of this support zone since the 2022 bear market.
Why the 200-week MA matters
The 200WMA has historically acted as a major support level during previous Bitcoin bear markets.
A break below it is often viewed as a sign of prolonged weakness and can trigger additional selling pressure from technical traders.
Historically, Bitcoin has spent limited periods below this level before eventually recovering, though past performance does not guarantee future results.
What's driving the decline?
Continued outflows from Bitcoin ETFs and broader risk-off sentiment.
Investors shifting capital toward booming AI and technology sectors.
Reduced expectations for near-term interest-rate cuts after strong U.S. economic data.
What traders are watching
The area around $60,000–$62,000 remains a critical support zone.
A sustained move below that range could open the door to deeper downside targets.
Conversely, reclaiming the 200-week MA would be seen as a constructive signal for market sentiment.
📉 Market takeaway: Falling below the 200-week moving average is a significant technical event for Bitcoin, but traders are focused on whether the breakdown becomes sustained or turns into another temporary deviation below long-term support.
41

·
--
$BTC is crashing 💀 below the 200 Week MA
#BTCFallsBelow200WeekMA
Whales are cashing out 💰💰 while newbies are crying 😭
The question is: Is this the bottom of the year or are we seeing 50K?
Type "bottom"🟢 if you're stacking now
Type "scam"🔴 if you're scared and selling
Personally: I stacked with all my might 👑
What about you? Drop a comment
#BTCFallsBelow200WeekMA #BinancePickAndWinVn #صراع_الملوك
$BTC is crashing 💀 below the 200 Week MA
#BTCFallsBelow200WeekMA
Whales are cashing out 💰💰 while newbies are crying 😭
The question is: Is this the bottom of the year or are we seeing 50K?
Type "bottom"🟢 if you're stacking now
Type "scam"🔴 if you're scared and selling
Personally: I stacked with all my might 👑
What about you? Drop a comment
#BTCFallsBelow200WeekMA #BinancePickAndWinVn #صراع_الملوك
#BTCFallsBelow200WeekMA
Whales are cashing out 💰💰 while newbies are crying 😭
The question is: Is this the bottom of the year or are we seeing 50K?
Type "bottom"🟢 if you're stacking now
Type "scam"🔴 if you're scared and selling
Personally: I stacked with all my might 👑
What about you? Drop a comment
#BTCFallsBelow200WeekMA #BinancePickAndWinVn #صراع_الملوك
2
1
6
134

·
--
Bearish
#BTCFallsBelow200WeekMA
🚨 BTC has slipped below the 200-week EMA — a level many long-term investors watch closely.
Historically, this zone has often acted as a major support area during deep market corrections. A break below it can signal fear and weak momentum, but it can also create opportunities for patient investors.
Key things to watch next:
• Weekly candle close below or above the 200W EMA
• Volume during the breakdown
• Whether BTC quickly reclaims this level
• Broader market sentiment and macro news
$BTC
No panic, no blind buying — risk management matters most.
Are we seeing a temporary deviation or the start of a deeper correction? 👀
#BTC #Bitcoin #Crypto #BTCAnalysis #CryptoMarket #BinanceSquare #TechnicalAnalysis
#BTCFallsBelow200WeekMA
🚨 BTC has slipped below the 200-week EMA — a level many long-term investors watch closely.
Historically, this zone has often acted as a major support area during deep market corrections. A break below it can signal fear and weak momentum, but it can also create opportunities for patient investors.
Key things to watch next:
• Weekly candle close below or above the 200W EMA
• Volume during the breakdown
• Whether BTC quickly reclaims this level
• Broader market sentiment and macro news
$BTC
No panic, no blind buying — risk management matters most.
Are we seeing a temporary deviation or the start of a deeper correction? 👀
#BTC #Bitcoin #Crypto #BTCAnalysis #CryptoMarket #BinanceSquare #TechnicalAnalysis
🚨 BTC has slipped below the 200-week EMA — a level many long-term investors watch closely.
Historically, this zone has often acted as a major support area during deep market corrections. A break below it can signal fear and weak momentum, but it can also create opportunities for patient investors.
Key things to watch next:
• Weekly candle close below or above the 200W EMA
• Volume during the breakdown
• Whether BTC quickly reclaims this level
• Broader market sentiment and macro news
$BTC
No panic, no blind buying — risk management matters most.
Are we seeing a temporary deviation or the start of a deeper correction? 👀
#BTC #Bitcoin #Crypto #BTCAnalysis #CryptoMarket #BinanceSquare #TechnicalAnalysis
149
Market Faces Pressure as $BTC Weakens
Bitcoin falling below the 200-week moving average signals growing bearish sentiment in the market. Traders are monitoring whether BTC can reclaim this key level or face further downside.
Among altcoins, $LINK and $ADA are showing resilience, while overall market sentiment remains cautious.
{spot}(BTCUSDT)
#BTCFallsBelow200WeekMA #BitcoinNews #LINK #ADA #Altcoins
Market Faces Pressure as $BTC Weakens
Bitcoin falling below the 200-week moving average signals growing bearish sentiment in the market. Traders are monitoring whether BTC can reclaim this key level or face further downside.
Among altcoins, $LINK and $ADA are showing resilience, while overall market sentiment remains cautious.
#BTCFallsBelow200WeekMA #BitcoinNews #LINK #ADA #Altcoins
Bitcoin falling below the 200-week moving average signals growing bearish sentiment in the market. Traders are monitoring whether BTC can reclaim this key level or face further downside.
Among altcoins, $LINK and $ADA are showing resilience, while overall market sentiment remains cautious.
#BTCFallsBelow200WeekMA #BitcoinNews #LINK #ADA #Altcoins
1
38

·
--
Bearish
#BTCFallsBelow200WeekMA
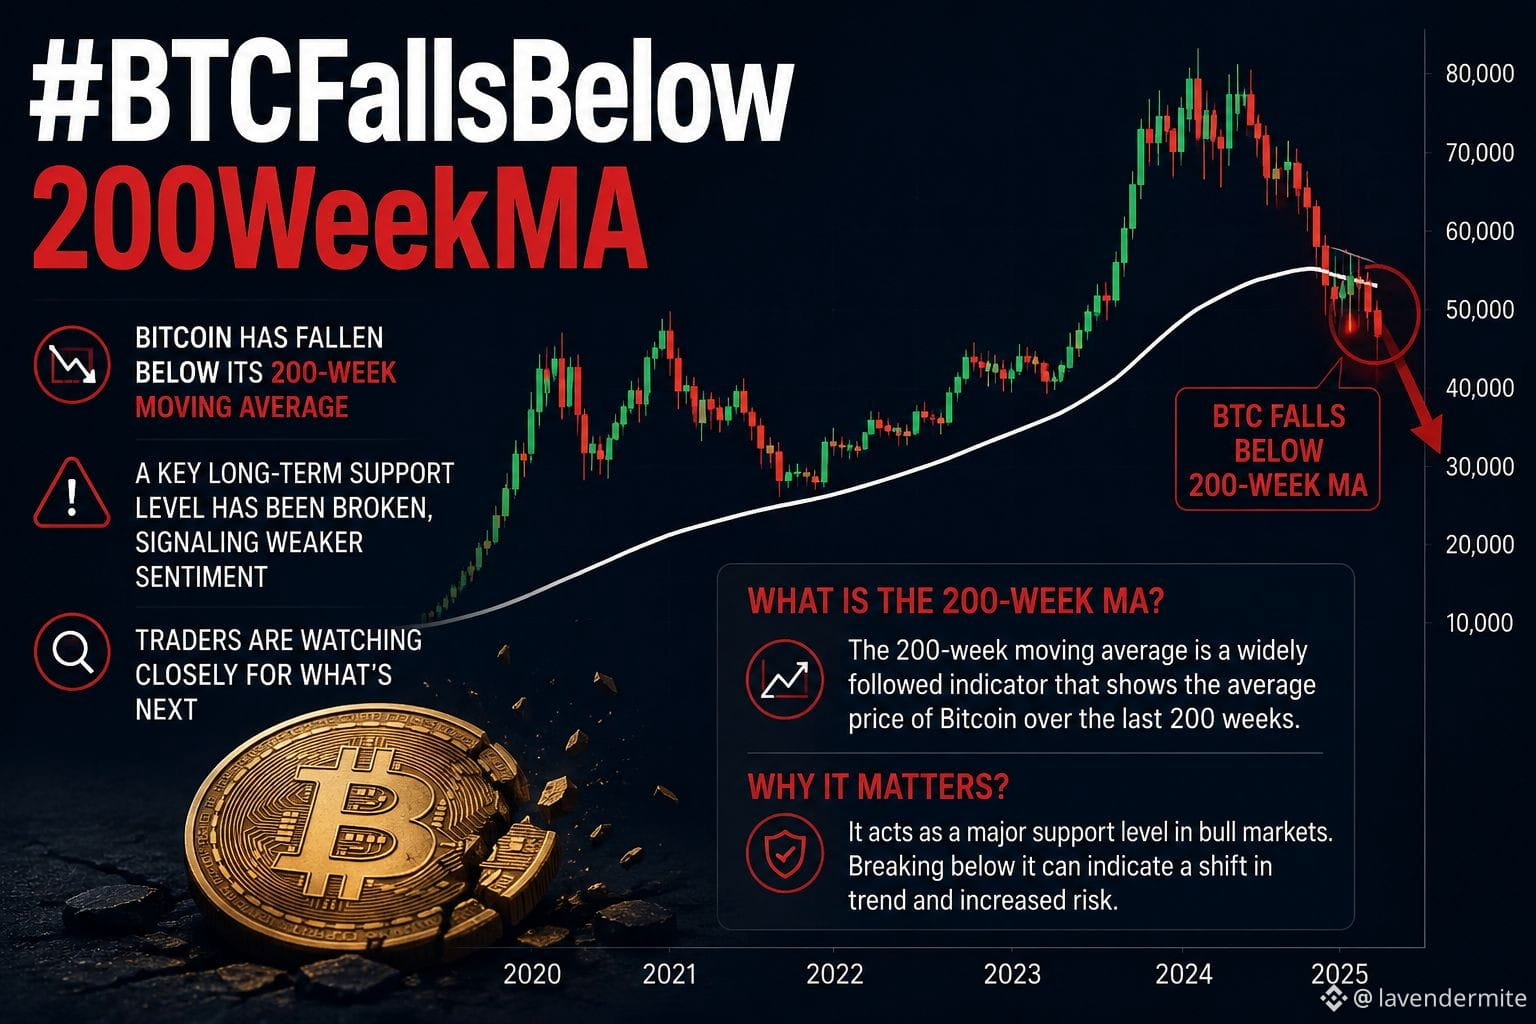
Bitcoin has dropped below its 200-week moving average, a level widely watched by long-term investors. The break signals increased market pressure and weaker sentiment, with BTC struggling to hold key support. Traders are closely monitoring price action, as a sustained move below this indicator could lead to further volatility and downside risk in the crypto market.
#BTC #bitcoin $BTC
#BTCFallsBelow200WeekMA
Bitcoin has dropped below its 200-week moving average, a level widely watched by long-term investors. The break signals increased market pressure and weaker sentiment, with BTC struggling to hold key support. Traders are closely monitoring price action, as a sustained move below this indicator could lead to further volatility and downside risk in the crypto market.
#BTC #bitcoin $BTC
Bitcoin has dropped below its 200-week moving average, a level widely watched by long-term investors. The break signals increased market pressure and weaker sentiment, with BTC struggling to hold key support. Traders are closely monitoring price action, as a sustained move below this indicator could lead to further volatility and downside risk in the crypto market.
#BTC #bitcoin $BTC
1
132

·
--
Bullish
#BTCFallsBelow200WeekMA
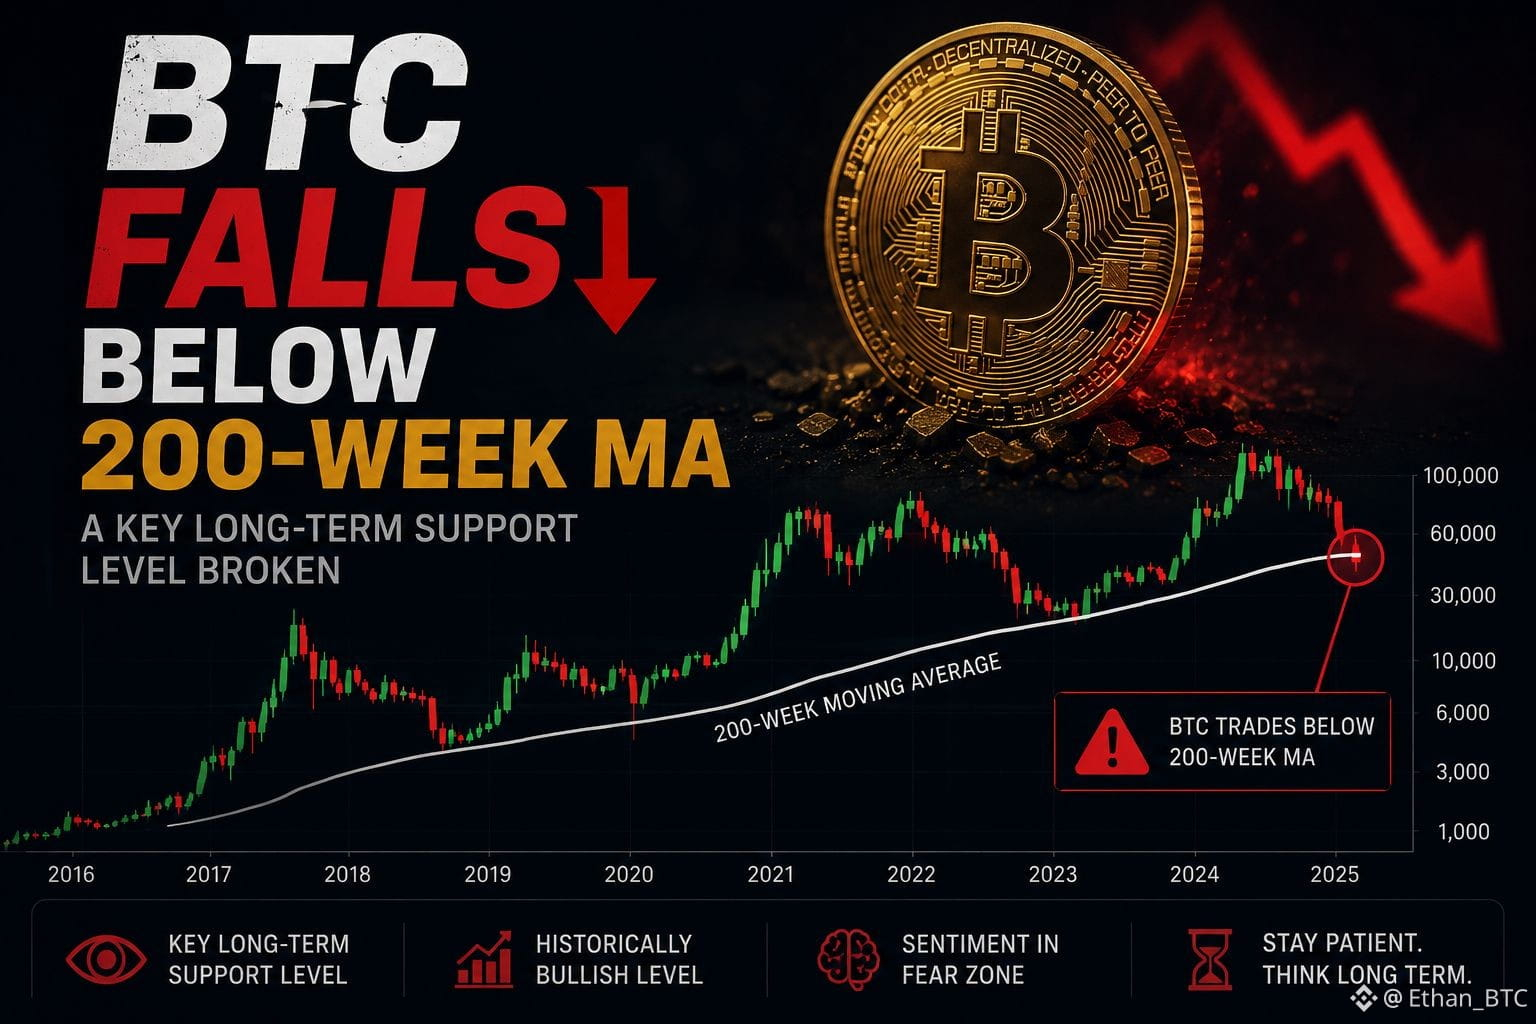
Seeing Bitcoin trade below its 200-week moving average is one of those moments that grabs everyone's attention. Historically, this level has been viewed as a major long-term support zone, so whenever price dips below it, fear tends to spike.
Personally, I try to zoom out during periods like this. Extreme sentiment often creates opportunities, and market structure matters more to me than daily headlines. Whether this turns out to be a brief deviation or something deeper, risk management is what counts.
Volatility is part of crypto. Staying patient is usually harder than staying bullish.
#Bitcoin #btc #CryptoMarket #Trading
#BTCFallsBelow200WeekMA
Seeing Bitcoin trade below its 200-week moving average is one of those moments that grabs everyone's attention. Historically, this level has been viewed as a major long-term support zone, so whenever price dips below it, fear tends to spike.
Personally, I try to zoom out during periods like this. Extreme sentiment often creates opportunities, and market structure matters more to me than daily headlines. Whether this turns out to be a brief deviation or something deeper, risk management is what counts.
Volatility is part of crypto. Staying patient is usually harder than staying bullish.
#Bitcoin #btc #CryptoMarket #Trading
Seeing Bitcoin trade below its 200-week moving average is one of those moments that grabs everyone's attention. Historically, this level has been viewed as a major long-term support zone, so whenever price dips below it, fear tends to spike.
Personally, I try to zoom out during periods like this. Extreme sentiment often creates opportunities, and market structure matters more to me than daily headlines. Whether this turns out to be a brief deviation or something deeper, risk management is what counts.
Volatility is part of crypto. Staying patient is usually harder than staying bullish.
#Bitcoin #btc #CryptoMarket #Trading
1
139

·
--
The 200-week headline is loud, but the cleaner signal is acceptance$BTC is near 60,872 USDT after a -3.30% 24h move, and the 200-week SMA on Binance is about 62,449 USDT. That makes the trend headline technically true, but not complete.
A wick below a famous line is fear. Acceptance below it is information. The difference is whether BTC can reclaim the 62.4K area, or keeps treating it as resistance into the US session.
My read: do not over-weight the rainbow chart meme while futures funding is already slightly negative at -0.000215%. The market is less one-sided than the headline sounds.
Keepable rule: level breaks matter most after the first failed reclaim.
#BTCFallsBelow200WeekMA #BTCBreaksBelowRainbowChartFloor #OilSupplySurges
The 200-week headline is loud, but the cleaner signal is acceptance
$BTC is near 60,872 USDT after a -3.30% 24h move, and the 200-week SMA on Binance is about 62,449 USDT. That makes the trend headline technically true, but not complete.
A wick below a famous line is fear. Acceptance below it is information. The difference is whether BTC can reclaim the 62.4K area, or keeps treating it as resistance into the US session.
My read: do not over-weight the rainbow chart meme while futures funding is already slightly negative at -0.000215%. The market is less one-sided than the headline sounds.
Keepable rule: level breaks matter most after the first failed reclaim.
#BTCFallsBelow200WeekMA #BTCBreaksBelowRainbowChartFloor #OilSupplySurges
A wick below a famous line is fear. Acceptance below it is information. The difference is whether BTC can reclaim the 62.4K area, or keeps treating it as resistance into the US session.
My read: do not over-weight the rainbow chart meme while futures funding is already slightly negative at -0.000215%. The market is less one-sided than the headline sounds.
Keepable rule: level breaks matter most after the first failed reclaim.
#BTCFallsBelow200WeekMA #BTCBreaksBelowRainbowChartFloor #OilSupplySurges
80

#BTCFallsBelow200WeekMA
🚨 #BTCFallsBelow200WeekMA
Bitcoin has slipped below its 200-week moving average, a level many traders consider a key long-term support zone. While this may trigger short-term fear and volatility, experienced investors often view major support tests as opportunities to reassess market structure rather than panic.
📉 Bearish sentiment is rising, but history shows that BTC has often recovered strongly after periods of extreme pessimism. Watch volume, macroeconomic factors, and on-chain metrics closely before making trading decisions.
⚡ Risk management remains essential in uncertain market conditions.
#BTC #Bitcoin #Crypto #Trading #BinanceSquare #CryptoNews #MarketAnalysis #HODL #Investing #Bullrun $BTC
{spot}(BTCUSDT)
$SPCXB $MUB #SKHynixADRListing #BTCFallsBelow200WeekMA #BTCBreaksBelowRainbowChartFloor
#BTCFallsBelow200WeekMA
🚨 #BTCFallsBelow200WeekMA
Bitcoin has slipped below its 200-week moving average, a level many traders consider a key long-term support zone. While this may trigger short-term fear and volatility, experienced investors often view major support tests as opportunities to reassess market structure rather than panic.
📉 Bearish sentiment is rising, but history shows that BTC has often recovered strongly after periods of extreme pessimism. Watch volume, macroeconomic factors, and on-chain metrics closely before making trading decisions.
⚡ Risk management remains essential in uncertain market conditions.
#BTC #Bitcoin #Crypto #Trading #BinanceSquare #CryptoNews #MarketAnalysis #HODL #Investing #Bullrun $BTC
$SPCXB $MUB #SKHynixADRListing #BTCFallsBelow200WeekMA #BTCBreaksBelowRainbowChartFloor
🚨 #BTCFallsBelow200WeekMA
Bitcoin has slipped below its 200-week moving average, a level many traders consider a key long-term support zone. While this may trigger short-term fear and volatility, experienced investors often view major support tests as opportunities to reassess market structure rather than panic.
📉 Bearish sentiment is rising, but history shows that BTC has often recovered strongly after periods of extreme pessimism. Watch volume, macroeconomic factors, and on-chain metrics closely before making trading decisions.
⚡ Risk management remains essential in uncertain market conditions.
#BTC #Bitcoin #Crypto #Trading #BinanceSquare #CryptoNews #MarketAnalysis #HODL #Investing #Bullrun $BTC
$SPCXB $MUB #SKHynixADRListing #BTCFallsBelow200WeekMA #BTCBreaksBelowRainbowChartFloor

164
·
--
#SKHynixADRListing
#TrumpCancelsHousingBillWithCBDCBan
#BTCFallsBelow200WeekMA
Fear is back.
Retail is panicking.
Smart money is watching.
BTC below the 200W MA has historically been rare and often marked high-reward zones for long-term investors.
Are you buying, waiting, or selling here?
🟢 Buying
🟡 Waiting
🔴 Selling
$BTC $TSLAB $MUB
#SKHynixADRListing
#TrumpCancelsHousingBillWithCBDCBan
#BTCFallsBelow200WeekMA
Fear is back.
Retail is panicking.
Smart money is watching.
BTC below the 200W MA has historically been rare and often marked high-reward zones for long-term investors.
Are you buying, waiting, or selling here?
🟢 Buying
🟡 Waiting
🔴 Selling
$BTC $TSLAB $MUB
#TrumpCancelsHousingBillWithCBDCBan
#BTCFallsBelow200WeekMA
Fear is back.
Retail is panicking.
Smart money is watching.
BTC below the 200W MA has historically been rare and often marked high-reward zones for long-term investors.
Are you buying, waiting, or selling here?
🟢 Buying
🟡 Waiting
🔴 Selling
$BTC $TSLAB $MUB
247
·
--
The scary BTC headline is a positioning headline first$BTC below the 200-week and rainbow-floor headlines look dramatic, but the cleaner read is liquidation pressure meeting weak risk appetite. Spot BTC is near 59,536 USDT after a -4.20% 24h move, while BTC perpetual funding on Binance is slightly negative at -0.0066%. That means the next tell is not the meme level itself. It is whether BTC can reclaim the 59.1K-59.5K breakdown zone without funding snapping back positive too fast. If price bounces while shorts stay paid, the move is healthier. If price bounces only because leverage crowds back in, the headline risk remains. The takeaway: after a breakdown headline, watch the funding reaction before the candle color. #BTCFallsBelow200WeekMA #BTCBreaksBelowRainbowChartFloor #NasdaqDrops2.2%
The scary BTC headline is a positioning headline first
$BTC below the 200-week and rainbow-floor headlines look dramatic, but the cleaner read is liquidation pressure meeting weak risk appetite. Spot BTC is near 59,536 USDT after a -4.20% 24h move, while BTC perpetual funding on Binance is slightly negative at -0.0066%. That means the next tell is not the meme level itself. It is whether BTC can reclaim the 59.1K-59.5K breakdown zone without funding snapping back positive too fast. If price bounces while shorts stay paid, the move is healthier. If price bounces only because leverage crowds back in, the headline risk remains. The takeaway: after a breakdown headline, watch the funding reaction before the candle color. #BTCFallsBelow200WeekMA #BTCBreaksBelowRainbowChartFloor #NasdaqDrops2.2%
172

🚨 Crypto History in the Making: Is This the Final Dip or More Bloodshed to Come?
The crypto market is experiencing extreme fear right now, breaking major historical milestones that no one expected.
📊 What is Happening on the Charts?
1️⃣ Bitcoin has officially dropped below its ultimate line of defense—the #BTCFallsBelow200WeekMA, traditionally considered the absolute market macro bottom.
2️⃣ The famous Bitcoin Rainbow Chart has broken below its lowest band, signaling maximum panic in the space.
3️⃣ This isn't just a crypto crash. Globally, the US tech stock market (#NasdaqDrops2.2%) and even Gold (#GoldDipsBelow$4000) have dipped simultaneously as capital flies to safety.
💡 Smart Move for Spot Traders:
History shows that when maximum panic hits and retail traders sell out of fear, it becomes an accumulation zone for long-term players. For spot traders, this isn't the time to panic sell, but a strategic opportunity to build positions using a disciplined Dollar-Cost Averaging (DCA) strategy.
Avoid high-leverage futures trading in this chaos, stay calm, and let the market find its true floor.
What's your take on this macro crash? Will we bounce from here or go lower? Let me know your thoughts in the comments below! 👇
#BTCFallsBelow200WeekMA #BTCBreaksBelowRainbowChart #GoldDipsBelow$4000 #NasdaqDrops2.2% #Bitcoin #Solana #Crypto
🚨 Crypto History in the Making: Is This the Final Dip or More Bloodshed to Come?
The crypto market is experiencing extreme fear right now, breaking major historical milestones that no one expected.
📊 What is Happening on the Charts?
1️⃣ Bitcoin has officially dropped below its ultimate line of defense—the #BTCFallsBelow200WeekMA, traditionally considered the absolute market macro bottom.
2️⃣ The famous Bitcoin Rainbow Chart has broken below its lowest band, signaling maximum panic in the space.
3️⃣ This isn't just a crypto crash. Globally, the US tech stock market (#NasdaqDrops2.2%) and even Gold (#GoldDipsBelow$4000) have dipped simultaneously as capital flies to safety.
💡 Smart Move for Spot Traders:
History shows that when maximum panic hits and retail traders sell out of fear, it becomes an accumulation zone for long-term players. For spot traders, this isn't the time to panic sell, but a strategic opportunity to build positions using a disciplined Dollar-Cost Averaging (DCA) strategy.
Avoid high-leverage futures trading in this chaos, stay calm, and let the market find its true floor.
What's your take on this macro crash? Will we bounce from here or go lower? Let me know your thoughts in the comments below! 👇
#BTCFallsBelow200WeekMA #BTCBreaksBelowRainbowChart #GoldDipsBelow$4000 #NasdaqDrops2.2% #Bitcoin #Solana #Crypto
The crypto market is experiencing extreme fear right now, breaking major historical milestones that no one expected.
📊 What is Happening on the Charts?
1️⃣ Bitcoin has officially dropped below its ultimate line of defense—the #BTCFallsBelow200WeekMA, traditionally considered the absolute market macro bottom.
2️⃣ The famous Bitcoin Rainbow Chart has broken below its lowest band, signaling maximum panic in the space.
3️⃣ This isn't just a crypto crash. Globally, the US tech stock market (#NasdaqDrops2.2%) and even Gold (#GoldDipsBelow$4000) have dipped simultaneously as capital flies to safety.
💡 Smart Move for Spot Traders:
History shows that when maximum panic hits and retail traders sell out of fear, it becomes an accumulation zone for long-term players. For spot traders, this isn't the time to panic sell, but a strategic opportunity to build positions using a disciplined Dollar-Cost Averaging (DCA) strategy.
Avoid high-leverage futures trading in this chaos, stay calm, and let the market find its true floor.
What's your take on this macro crash? Will we bounce from here or go lower? Let me know your thoughts in the comments below! 👇
#BTCFallsBelow200WeekMA #BTCBreaksBelowRainbowChart #GoldDipsBelow$4000 #NasdaqDrops2.2% #Bitcoin #Solana #Crypto
1
247

·
--
#BTCFallsBelow200WeekMA
Guys, it's hard to believe that $BTC is trading below 📉 the 200-week moving average, and even though several analysts 👤👤👤 mentioned it, this is one of those moments that grabs everyone's ATTENTION 👀👀👀🕵🏼♂️.
Honestly, folks, we can tell you that historically, this level has been considered a key support or floor in the long run, so every time the price dips 📉, fear 😱 😨 😱 😨 tends to spike 😬😬😬😬.
Stay very ALERT 👀👀👀🕵🏼♂️ and protect your capital 💲.
{future}(BTCUSDT)
#BTCFallsBelow200WeekMA
Guys, it's hard to believe that $BTC is trading below 📉 the 200-week moving average, and even though several analysts 👤👤👤 mentioned it, this is one of those moments that grabs everyone's ATTENTION 👀👀👀🕵🏼♂️.
Honestly, folks, we can tell you that historically, this level has been considered a key support or floor in the long run, so every time the price dips 📉, fear 😱 😨 😱 😨 tends to spike 😬😬😬😬.
Stay very ALERT 👀👀👀🕵🏼♂️ and protect your capital 💲.
Guys, it's hard to believe that $BTC is trading below 📉 the 200-week moving average, and even though several analysts 👤👤👤 mentioned it, this is one of those moments that grabs everyone's ATTENTION 👀👀👀🕵🏼♂️.
Honestly, folks, we can tell you that historically, this level has been considered a key support or floor in the long run, so every time the price dips 📉, fear 😱 😨 😱 😨 tends to spike 😬😬😬😬.
Stay very ALERT 👀👀👀🕵🏼♂️ and protect your capital 💲.
1
327

·
--
#btcfallsbelow200weekma
Bitcoin Falls Below 200-Week MA 🚨 What Does It Mean?
Bitcoin has dropped below its 200-week Moving Average (MA) — a level many investors closely watch during major market cycles.
Why is this important? 👇
The 200-week MA has historically acted as a strong long-term support zone for Bitcoin.
In previous bear markets:
📉 BTC touched this level before major recoveries
📈 Long-term investors used it to track market strength
🔍 It often signals periods of extreme fear in the market
What could this mean now?
• Market sentiment remains weak
• Volatility may stay high in the short term
• Investors are watching macro events closely
• Long-term trend structure is being tested
But history shows one thing:
Bitcoin cycles have always challenged market confidence before major trend shifts.
The big question is…
Is this another accumulation zone… or a warning sign for deeper correction? 🤔
Crypto markets remain highly unpredictable, and moments like this often define the next phase.
Stay informed. Watch the data. Manage risk wisely. ⚡
#Bitcoin #BTC #CryptoMarket #BinanceSquare #CryptoNews #Blockchain #MarketUpdate
{spot}(SOLUSDT)
{spot}(BNBUSDT)
{spot}(BTCUSDT)
#btcfallsbelow200weekma
Bitcoin Falls Below 200-Week MA 🚨 What Does It Mean?
Bitcoin has dropped below its 200-week Moving Average (MA) — a level many investors closely watch during major market cycles.
Why is this important? 👇
The 200-week MA has historically acted as a strong long-term support zone for Bitcoin.
In previous bear markets:
📉 BTC touched this level before major recoveries
📈 Long-term investors used it to track market strength
🔍 It often signals periods of extreme fear in the market
What could this mean now?
• Market sentiment remains weak
• Volatility may stay high in the short term
• Investors are watching macro events closely
• Long-term trend structure is being tested
But history shows one thing:
Bitcoin cycles have always challenged market confidence before major trend shifts.
The big question is…
Is this another accumulation zone… or a warning sign for deeper correction? 🤔
Crypto markets remain highly unpredictable, and moments like this often define the next phase.
Stay informed. Watch the data. Manage risk wisely. ⚡
#Bitcoin #BTC #CryptoMarket #BinanceSquare #CryptoNews #Blockchain #MarketUpdate
Bitcoin Falls Below 200-Week MA 🚨 What Does It Mean?
Bitcoin has dropped below its 200-week Moving Average (MA) — a level many investors closely watch during major market cycles.
Why is this important? 👇
The 200-week MA has historically acted as a strong long-term support zone for Bitcoin.
In previous bear markets:
📉 BTC touched this level before major recoveries
📈 Long-term investors used it to track market strength
🔍 It often signals periods of extreme fear in the market
What could this mean now?
• Market sentiment remains weak
• Volatility may stay high in the short term
• Investors are watching macro events closely
• Long-term trend structure is being tested
But history shows one thing:
Bitcoin cycles have always challenged market confidence before major trend shifts.
The big question is…
Is this another accumulation zone… or a warning sign for deeper correction? 🤔
Crypto markets remain highly unpredictable, and moments like this often define the next phase.
Stay informed. Watch the data. Manage risk wisely. ⚡
#Bitcoin #BTC #CryptoMarket #BinanceSquare #CryptoNews #Blockchain #MarketUpdate

6
22
30.1k

·
--
#btcfallsbelow200weekma BTC Falls Below 200-Week Moving Average, Raising Concerns Across Crypto Markets
Bitcoin has slipped below its widely watched 200-week moving average (MA), a key technical indicator often viewed as a long-term support level for the cryptocurrency. Historically, the 200-week MA has acted as a crucial floor during major market downturns, making the latest move a significant development for traders and investors.
The break below this level has sparked concerns that Bitcoin could face additional downside pressure if market sentiment continues to weaken. Analysts closely monitor the 200-week moving average because it has historically marked periods of undervaluation and long-term buying opportunities. However, a sustained move below this indicator may signal increased uncertainty and volatility in the broader crypto market.
Several factors are contributing to the recent weakness, including profit-taking by investors, macroeconomic uncertainty, and cautious sentiment across risk assets. As Bitcoin remains the largest cryptocurrency by market capitalization, its price movements often influence the direction of altcoins and the overall digital asset market.
Despite the bearish signal, some long-term investors view the decline as a potential accumulation opportunity. Market participants will now watch closely to see whether Bitcoin can reclaim the 200-week moving average or if further downside movement is ahead. The coming weeks could prove critical in determining the next major trend for the cryptocurrency market.
#bitcoin #cryptonews
#btcfallsbelow200weekma BTC Falls Below 200-Week Moving Average, Raising Concerns Across Crypto Markets
Bitcoin has slipped below its widely watched 200-week moving average (MA), a key technical indicator often viewed as a long-term support level for the cryptocurrency. Historically, the 200-week MA has acted as a crucial floor during major market downturns, making the latest move a significant development for traders and investors.
The break below this level has sparked concerns that Bitcoin could face additional downside pressure if market sentiment continues to weaken. Analysts closely monitor the 200-week moving average because it has historically marked periods of undervaluation and long-term buying opportunities. However, a sustained move below this indicator may signal increased uncertainty and volatility in the broader crypto market.
Several factors are contributing to the recent weakness, including profit-taking by investors, macroeconomic uncertainty, and cautious sentiment across risk assets. As Bitcoin remains the largest cryptocurrency by market capitalization, its price movements often influence the direction of altcoins and the overall digital asset market.
Despite the bearish signal, some long-term investors view the decline as a potential accumulation opportunity. Market participants will now watch closely to see whether Bitcoin can reclaim the 200-week moving average or if further downside movement is ahead. The coming weeks could prove critical in determining the next major trend for the cryptocurrency market.
#bitcoin #cryptonews
Bitcoin has slipped below its widely watched 200-week moving average (MA), a key technical indicator often viewed as a long-term support level for the cryptocurrency. Historically, the 200-week MA has acted as a crucial floor during major market downturns, making the latest move a significant development for traders and investors.
The break below this level has sparked concerns that Bitcoin could face additional downside pressure if market sentiment continues to weaken. Analysts closely monitor the 200-week moving average because it has historically marked periods of undervaluation and long-term buying opportunities. However, a sustained move below this indicator may signal increased uncertainty and volatility in the broader crypto market.
Several factors are contributing to the recent weakness, including profit-taking by investors, macroeconomic uncertainty, and cautious sentiment across risk assets. As Bitcoin remains the largest cryptocurrency by market capitalization, its price movements often influence the direction of altcoins and the overall digital asset market.
Despite the bearish signal, some long-term investors view the decline as a potential accumulation opportunity. Market participants will now watch closely to see whether Bitcoin can reclaim the 200-week moving average or if further downside movement is ahead. The coming weeks could prove critical in determining the next major trend for the cryptocurrency market.
#bitcoin #cryptonews

7
954
Log in to explore more content
Join global crypto users on Binance Square
⚡️ Get latest and useful information about crypto.
💬 Trusted by the world’s largest crypto exchange.
👍 Discover real insights from verified creators.
Email / Phone number
Trending Topics
1
#EarningsSeason
321,129 views
2,530 Discussing
2
#BitwiseLaunchesFirstSpotNEARETF
28,583 views
549 Discussing
3
#USJobOpeningsFallToFiveMonthLow
34,336 views
423 Discussing
4
#ECBToTestAIAgentsInDigitalEuroPayments
26,732 views
550 Discussing
5
#JapanFSABacksFourthStablecoinTradeSettlementPilot
30,750 views
582 Discussing
6
#BitgetHackerFailsToMoveStolenFunds
46,508 views
635 Discussing
7
#BitMineETHHoldingsTop6Million
38,097 views
722 Discussing
8
#StrategyAdds1666BTCHoldingsReach847666
31,306 views
502 Discussing
9
#NvidiaApproves$150BBuyback
5,514 views
75 Discussing
10
#OpenAIDelaysGPT6.1OverSafetyIssues
47,073 views
895 Discussing