
#btcdefi
btcdefi
46,256 views
185 Discussing
Hot
Latest


·
--
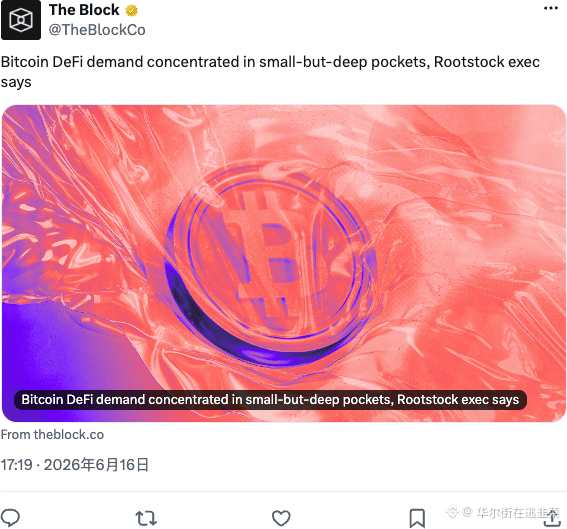
Don't get fooled by on-chain data, BTC DeFi isn't lacking demand; it's that the money is stuck in small, deep pools.
The folks at Rootstock pointed it out: the real cash flow comes from hardcore veterans, not much volume but crazy sticky, while retail traders haven't even entered the arena.
This is actually a signal of undervaluation; infrastructure projects are currently lying low, waiting for the floodgates to open for maximum elasticity. #BTCDeFi $BTC $RIF
{future}(RIFUSDT)
{future}(BTCUSDT)
Don't get fooled by on-chain data, BTC DeFi isn't lacking demand; it's that the money is stuck in small, deep pools.
The folks at Rootstock pointed it out: the real cash flow comes from hardcore veterans, not much volume but crazy sticky, while retail traders haven't even entered the arena.
This is actually a signal of undervaluation; infrastructure projects are currently lying low, waiting for the floodgates to open for maximum elasticity. #BTCDeFi $BTC $RIF
The folks at Rootstock pointed it out: the real cash flow comes from hardcore veterans, not much volume but crazy sticky, while retail traders haven't even entered the arena.
This is actually a signal of undervaluation; infrastructure projects are currently lying low, waiting for the floodgates to open for maximum elasticity. #BTCDeFi $BTC $RIF
143

·
--
Bitcoin is Becoming a Smart Contract Platform 🧡⚡
Bitcoin isn’t just digital gold anymore. Innovations like BitVM and scalable L2s are bringing complex DeFi, lending, and smart contracts directly to the Bitcoin network.
#BitcoinL2 #BitVM #BTCDeFi #SmartContracts .
Bitcoin is Becoming a Smart Contract Platform 🧡⚡
Bitcoin isn’t just digital gold anymore. Innovations like BitVM and scalable L2s are bringing complex DeFi, lending, and smart contracts directly to the Bitcoin network.
#BitcoinL2 #BitVM #BTCDeFi #SmartContracts .
Bitcoin isn’t just digital gold anymore. Innovations like BitVM and scalable L2s are bringing complex DeFi, lending, and smart contracts directly to the Bitcoin network.
#BitcoinL2 #BitVM #BTCDeFi #SmartContracts .
78

·
--
$PORTAL Just now I touched 0.02019 in about four hours, then in two hours it pulled back to 0.01865. I won’t talk about “sentiment,” I’ll just say whether this move was clean or messy.
Market signals: This coin has been ranging on the 4-hour timeframe for quite a while. Two times it poked into 0.01731 and 0.01734, but neither broke through. Then one big bullish candle on strong volume: it jumped from 0.01839 straight to 0.02019, setting a new 24-hour high. Now we’re in the second hour of the pullback.
Structurally, after the double-bottom, it broke out on increased volume—this is a textbook bottom-activation pattern. I recognize this chart. Long consolidation isn’t bad; what’s “long” is the exchange of positions—once the chips are swapped, it can finally move.
Market sentiment: Funding rate is 0.005%. Essentially zero. Don’t underestimate this number. If this rally were pushed by long futures squeezing, the funding rate would already look ugly. The mood isn’t heated. The pullback is just a normal one—not a distribution/selling event. Mark price is 0.01866; price is moving right along the mark price without any basis abnormality, which suggests spot is driving the move—not futures traders gambling.
In the last 24 hours there were 75,046 trades. Spread over a 3.6 million U market cap, that’s roughly 50 U per trade on average—retail-sized orders. Retail hasn’t run, and institutions aren’t chasing. This kind of rally is the most comfortable.
As for sentiment: I’ve seen it hot and I’ve seen it cold. At this “temperature,” it’s suitable to hold.
Whale activity: There’s something very eye-catching in the data. Before the rise, there was a 4-hour candle that suddenly dumped from 0.01900 down to 0.01767, with 1.8 million U in成交量, and it’s the largest among the 30 candles. This order isn’t something retail can do—that kind of move is meant to scare.
After that, the pin-ticks into 0.01731 and 0.01734 happened twice. Once the pins went down, they didn’t go further. When the pin finished, the breakout candle came through and then followed with proactive buying of 607,000 U, overwhelming the proactive sell orders. This isn’t retail doing this—it’s the main force sweeping.
The sequence—scare, probe, then break—was completed in three steps. The big players tested the bottom before the breakout; it’s the same old playbook, but it works.
Volume-price structure: In 24 hours, total成交额 is 3.6 million U, up 3.78%. I counted the volume rhythm: the biggest is the dump candle; the two pin-ticks were each a bit over 1 million U; then the breakout candle was about 1.1 million U. After that, the pullback lasted two hours, with volume shrinking from 610,000 U down to 290,000 U. Rally on increased volume, pullback on reduced volume—volume and price don’t lie. That’s the pattern I want to see.
One more number: 24-hour weighted average price is 0.01856, while the current price is 0.01865—price is trading above the average line. In one day, most people who executed trades are in profit. People in profit can hold; someone is there to catch the selling when it gets dumped.
Candlestick details: In that breakout candle, the real body is from 0.01839 to 0.01915. The upper wick is from 0.01915 to 0.02019—the upper wick is longer than the body. Above 0.0195 there’s overhead supply; when price surged up, someone sold.
But note this: the pullback only went as far as 0.01863 and stopped—it didn’t even reach the midpoint of the bullish body. On the current 4-hour candle,成交量 is 290,000 U, with 6,025 trades—the smallest among the 30 candles. It closed as a small doji/cross. The pullback momentum is used up; sellers can’t sell with force anymore. Next, it’s just a question of who loses patience first.
Two words about the project’s foundation. Portal Network builds DeFi on Bitcoin: a cross-chain DEX with zero-knowledge anonymous trading—no bridge, no wrapping, atomic swaps. It emphasizes running DeFi on BTC and avoiding the risks of the centralized exchange setup. This story can still be told this year. But a story doesn’t decide the chart— the chart decides the price. I only look at what’s in front of me: double-bottom, breakout on volume, and a pullback on shrinking volume.
Nini’s plan: Current price is 0.01865. The level 0.01828 below is the start of the long bullish candle; further down, 0.01731 and 0.01734 are the double-bottom. The new-high resistance is 0.02019. My view: slightly bullish. If you’re going to do it, wait for a retest around 0.0183 with a light position; target 0.02019, and if it breaks, look to 0.021. Don’t chase; wait for the pullback.
When volume pushes through 0.02019, I’ll follow. If it breaks down below 0.01776, be cautious. If it breaks below 0.0173 and the double-bottom is invalidated, leave—no need to overthink.
If you need a tailored strategy, you can find Nini.
$PORTAL #BTCDeFi #DeFi
$PORTAL Just now I touched 0.02019 in about four hours, then in two hours it pulled back to 0.01865. I won’t talk about “sentiment,” I’ll just say whether this move was clean or messy.
Market signals: This coin has been ranging on the 4-hour timeframe for quite a while. Two times it poked into 0.01731 and 0.01734, but neither broke through. Then one big bullish candle on strong volume: it jumped from 0.01839 straight to 0.02019, setting a new 24-hour high. Now we’re in the second hour of the pullback.
Structurally, after the double-bottom, it broke out on increased volume—this is a textbook bottom-activation pattern. I recognize this chart. Long consolidation isn’t bad; what’s “long” is the exchange of positions—once the chips are swapped, it can finally move.
Market sentiment: Funding rate is 0.005%. Essentially zero. Don’t underestimate this number. If this rally were pushed by long futures squeezing, the funding rate would already look ugly. The mood isn’t heated. The pullback is just a normal one—not a distribution/selling event. Mark price is 0.01866; price is moving right along the mark price without any basis abnormality, which suggests spot is driving the move—not futures traders gambling.
In the last 24 hours there were 75,046 trades. Spread over a 3.6 million U market cap, that’s roughly 50 U per trade on average—retail-sized orders. Retail hasn’t run, and institutions aren’t chasing. This kind of rally is the most comfortable.
As for sentiment: I’ve seen it hot and I’ve seen it cold. At this “temperature,” it’s suitable to hold.
Whale activity: There’s something very eye-catching in the data. Before the rise, there was a 4-hour candle that suddenly dumped from 0.01900 down to 0.01767, with 1.8 million U in成交量, and it’s the largest among the 30 candles. This order isn’t something retail can do—that kind of move is meant to scare.
After that, the pin-ticks into 0.01731 and 0.01734 happened twice. Once the pins went down, they didn’t go further. When the pin finished, the breakout candle came through and then followed with proactive buying of 607,000 U, overwhelming the proactive sell orders. This isn’t retail doing this—it’s the main force sweeping.
The sequence—scare, probe, then break—was completed in three steps. The big players tested the bottom before the breakout; it’s the same old playbook, but it works.
Volume-price structure: In 24 hours, total成交额 is 3.6 million U, up 3.78%. I counted the volume rhythm: the biggest is the dump candle; the two pin-ticks were each a bit over 1 million U; then the breakout candle was about 1.1 million U. After that, the pullback lasted two hours, with volume shrinking from 610,000 U down to 290,000 U. Rally on increased volume, pullback on reduced volume—volume and price don’t lie. That’s the pattern I want to see.
One more number: 24-hour weighted average price is 0.01856, while the current price is 0.01865—price is trading above the average line. In one day, most people who executed trades are in profit. People in profit can hold; someone is there to catch the selling when it gets dumped.
Candlestick details: In that breakout candle, the real body is from 0.01839 to 0.01915. The upper wick is from 0.01915 to 0.02019—the upper wick is longer than the body. Above 0.0195 there’s overhead supply; when price surged up, someone sold.
But note this: the pullback only went as far as 0.01863 and stopped—it didn’t even reach the midpoint of the bullish body. On the current 4-hour candle,成交量 is 290,000 U, with 6,025 trades—the smallest among the 30 candles. It closed as a small doji/cross. The pullback momentum is used up; sellers can’t sell with force anymore. Next, it’s just a question of who loses patience first.
Two words about the project’s foundation. Portal Network builds DeFi on Bitcoin: a cross-chain DEX with zero-knowledge anonymous trading—no bridge, no wrapping, atomic swaps. It emphasizes running DeFi on BTC and avoiding the risks of the centralized exchange setup. This story can still be told this year. But a story doesn’t decide the chart— the chart decides the price. I only look at what’s in front of me: double-bottom, breakout on volume, and a pullback on shrinking volume.
Nini’s plan: Current price is 0.01865. The level 0.01828 below is the start of the long bullish candle; further down, 0.01731 and 0.01734 are the double-bottom. The new-high resistance is 0.02019. My view: slightly bullish. If you’re going to do it, wait for a retest around 0.0183 with a light position; target 0.02019, and if it breaks, look to 0.021. Don’t chase; wait for the pullback.
When volume pushes through 0.02019, I’ll follow. If it breaks down below 0.01776, be cautious. If it breaks below 0.0173 and the double-bottom is invalidated, leave—no need to overthink.
If you need a tailored strategy, you can find Nini.
$PORTAL #BTCDeFi #DeFi
Market signals: This coin has been ranging on the 4-hour timeframe for quite a while. Two times it poked into 0.01731 and 0.01734, but neither broke through. Then one big bullish candle on strong volume: it jumped from 0.01839 straight to 0.02019, setting a new 24-hour high. Now we’re in the second hour of the pullback.
Structurally, after the double-bottom, it broke out on increased volume—this is a textbook bottom-activation pattern. I recognize this chart. Long consolidation isn’t bad; what’s “long” is the exchange of positions—once the chips are swapped, it can finally move.
Market sentiment: Funding rate is 0.005%. Essentially zero. Don’t underestimate this number. If this rally were pushed by long futures squeezing, the funding rate would already look ugly. The mood isn’t heated. The pullback is just a normal one—not a distribution/selling event. Mark price is 0.01866; price is moving right along the mark price without any basis abnormality, which suggests spot is driving the move—not futures traders gambling.
In the last 24 hours there were 75,046 trades. Spread over a 3.6 million U market cap, that’s roughly 50 U per trade on average—retail-sized orders. Retail hasn’t run, and institutions aren’t chasing. This kind of rally is the most comfortable.
As for sentiment: I’ve seen it hot and I’ve seen it cold. At this “temperature,” it’s suitable to hold.
Whale activity: There’s something very eye-catching in the data. Before the rise, there was a 4-hour candle that suddenly dumped from 0.01900 down to 0.01767, with 1.8 million U in成交量, and it’s the largest among the 30 candles. This order isn’t something retail can do—that kind of move is meant to scare.
After that, the pin-ticks into 0.01731 and 0.01734 happened twice. Once the pins went down, they didn’t go further. When the pin finished, the breakout candle came through and then followed with proactive buying of 607,000 U, overwhelming the proactive sell orders. This isn’t retail doing this—it’s the main force sweeping.
The sequence—scare, probe, then break—was completed in three steps. The big players tested the bottom before the breakout; it’s the same old playbook, but it works.
Volume-price structure: In 24 hours, total成交额 is 3.6 million U, up 3.78%. I counted the volume rhythm: the biggest is the dump candle; the two pin-ticks were each a bit over 1 million U; then the breakout candle was about 1.1 million U. After that, the pullback lasted two hours, with volume shrinking from 610,000 U down to 290,000 U. Rally on increased volume, pullback on reduced volume—volume and price don’t lie. That’s the pattern I want to see.
One more number: 24-hour weighted average price is 0.01856, while the current price is 0.01865—price is trading above the average line. In one day, most people who executed trades are in profit. People in profit can hold; someone is there to catch the selling when it gets dumped.
Candlestick details: In that breakout candle, the real body is from 0.01839 to 0.01915. The upper wick is from 0.01915 to 0.02019—the upper wick is longer than the body. Above 0.0195 there’s overhead supply; when price surged up, someone sold.
But note this: the pullback only went as far as 0.01863 and stopped—it didn’t even reach the midpoint of the bullish body. On the current 4-hour candle,成交量 is 290,000 U, with 6,025 trades—the smallest among the 30 candles. It closed as a small doji/cross. The pullback momentum is used up; sellers can’t sell with force anymore. Next, it’s just a question of who loses patience first.
Two words about the project’s foundation. Portal Network builds DeFi on Bitcoin: a cross-chain DEX with zero-knowledge anonymous trading—no bridge, no wrapping, atomic swaps. It emphasizes running DeFi on BTC and avoiding the risks of the centralized exchange setup. This story can still be told this year. But a story doesn’t decide the chart— the chart decides the price. I only look at what’s in front of me: double-bottom, breakout on volume, and a pullback on shrinking volume.
Nini’s plan: Current price is 0.01865. The level 0.01828 below is the start of the long bullish candle; further down, 0.01731 and 0.01734 are the double-bottom. The new-high resistance is 0.02019. My view: slightly bullish. If you’re going to do it, wait for a retest around 0.0183 with a light position; target 0.02019, and if it breaks, look to 0.021. Don’t chase; wait for the pullback.
When volume pushes through 0.02019, I’ll follow. If it breaks down below 0.01776, be cautious. If it breaks below 0.0173 and the double-bottom is invalidated, leave—no need to overthink.
If you need a tailored strategy, you can find Nini.
$PORTAL #BTCDeFi #DeFi
84

·
--
Listen up, degens! I'm seeing *heavy* bids coming in for $CORE. That 42% pump last month? Just the warm-up. Non-custodial BTC staking is LIVE and they're shifting to buybacks, not burns. Forget the FUD about validator issues, they squared it away quick. Volume is sending! 🚀💎 Are you filling your bags or staying poor? #CORE #BTCDefi
Listen up, degens! I'm seeing *heavy* bids coming in for $CORE. That 42% pump last month? Just the warm-up. Non-custodial BTC staking is LIVE and they're shifting to buybacks, not burns. Forget the FUD about validator issues, they squared it away quick. Volume is sending! 🚀💎 Are you filling your bags or staying poor? #CORE #BTCDefi
1
51

$ZESTUSDT Quick Analysis @ $0.28446
Zest Protocol ($ZEST) adds plenty of flavor with an impressive +18.62% bounce. The Bitcoin-native lending protocol continues to build momentum following major exchange spot listings.
Zest lets Bitcoin liquidity providers earn yield directly on the Bitcoin layer-1 network without relying on dangerous wrapping architectures or bridges. With on-chain lending TVL climbing close to $100M, the platform is carving out a strong corner in the Bitcoin DeFi framework.
TA Snapshot
Immediate Resistance: Facing a stiff selling wall at the $0.30000 psychological mark.
Support Base: Strong support holding at the $0.25500 level.
Momentum: RSI is in a healthy uptrend around 62, leaving room for further movement before hitting exhaustion.
DYOR | NFA
#zest #ZestProtocol #BTCDeFi #zestusdt #TrendingTopic $ZEST @EliteDaily
📹 We Live-stream a Bitcoin Footprint Chart every US (NY) session, it runs from ⏰️ 9h30 am EST/ (14h30 GMT) Set an Alarm, be disciplined! 🇺🇲🇬🇧🇩🇪
{future}(ZESTUSDT)
Move with the market - move with us!
$ZESTUSDT Quick Analysis @ $0.28446
Zest Protocol ($ZEST ) adds plenty of flavor with an impressive +18.62% bounce. The Bitcoin-native lending protocol continues to build momentum following major exchange spot listings.
Zest lets Bitcoin liquidity providers earn yield directly on the Bitcoin layer-1 network without relying on dangerous wrapping architectures or bridges. With on-chain lending TVL climbing close to $100M, the platform is carving out a strong corner in the Bitcoin DeFi framework.
TA Snapshot
Immediate Resistance: Facing a stiff selling wall at the $0.30000 psychological mark.
Support Base: Strong support holding at the $0.25500 level.
Momentum: RSI is in a healthy uptrend around 62, leaving room for further movement before hitting exhaustion.
DYOR | NFA
#zest #ZestProtocol #BTCDeFi #zestusdt #TrendingTopic $ZEST @EliteDailySignals
📹 We Live-stream a Bitcoin Footprint Chart every US (NY) session, it runs from ⏰️ 9h30 am EST/ (14h30 GMT) Set an Alarm, be disciplined! 🇺🇲🇬🇧🇩🇪
Move with the market - move with us!
Zest Protocol ($ZEST ) adds plenty of flavor with an impressive +18.62% bounce. The Bitcoin-native lending protocol continues to build momentum following major exchange spot listings.
Zest lets Bitcoin liquidity providers earn yield directly on the Bitcoin layer-1 network without relying on dangerous wrapping architectures or bridges. With on-chain lending TVL climbing close to $100M, the platform is carving out a strong corner in the Bitcoin DeFi framework.
TA Snapshot
Immediate Resistance: Facing a stiff selling wall at the $0.30000 psychological mark.
Support Base: Strong support holding at the $0.25500 level.
Momentum: RSI is in a healthy uptrend around 62, leaving room for further movement before hitting exhaustion.
DYOR | NFA
#zest #ZestProtocol #BTCDeFi #zestusdt #TrendingTopic $ZEST @EliteDailySignals
📹 We Live-stream a Bitcoin Footprint Chart every US (NY) session, it runs from ⏰️ 9h30 am EST/ (14h30 GMT) Set an Alarm, be disciplined! 🇺🇲🇬🇧🇩🇪
Move with the market - move with us!

1
2
320

·
--
Article
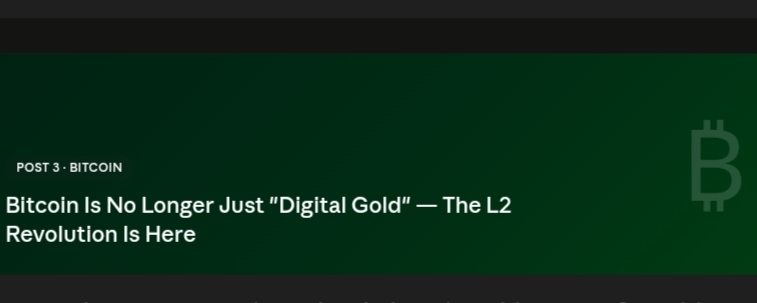
Bitcoin Is No Longer Just "Digital Gold" — The Layer 2 Revolution Is HereFor years, Bitcoin was simple: buy it, hold it, store value.
That story is changing fast in 2026.
Layer 2 networks are turning Bitcoin into a full DeFi platform — with smart contracts, fast transactions, and on-chain apps. Here are the L2s leading the charge:
⚡ Lightning Network — instant, near-free Bitcoin payments
🔷 Stacks (STX) — smart contracts and DeFi, anchored to Bitcoin
🔗 Rootstock (RSK) — Ethereum-style contracts on Bitcoin PoW, $160M+ TVL
🚀 Merlin Chain — ZK-rollup tech making Bitcoin faster and cheaper
What this means for you as a BTC holder:
→ Your Bitcoin could be used as DeFi collateral
→ Earn yield on BTC without leaving the Bitcoin ecosystem
→ Access dApps and games — all secured by Bitcoin's network
Bitcoin maximalists and DeFi degens might finally agree on something. 👀
Which Bitcoin L2 are you watching? 👇
#Bitcoin #BitcoinL2 #LightningNetwork #BTCDeFi #Crypto2026
Bitcoin Is No Longer Just "Digital Gold" — The Layer 2 Revolution Is Here
For years, Bitcoin was simple: buy it, hold it, store value.
That story is changing fast in 2026.
Layer 2 networks are turning Bitcoin into a full DeFi platform — with smart contracts, fast transactions, and on-chain apps. Here are the L2s leading the charge:
⚡ Lightning Network — instant, near-free Bitcoin payments
🔷 Stacks (STX) — smart contracts and DeFi, anchored to Bitcoin
🔗 Rootstock (RSK) — Ethereum-style contracts on Bitcoin PoW, $160M+ TVL
🚀 Merlin Chain — ZK-rollup tech making Bitcoin faster and cheaper
What this means for you as a BTC holder:
→ Your Bitcoin could be used as DeFi collateral
→ Earn yield on BTC without leaving the Bitcoin ecosystem
→ Access dApps and games — all secured by Bitcoin's network
Bitcoin maximalists and DeFi degens might finally agree on something. 👀
Which Bitcoin L2 are you watching? 👇
#Bitcoin #BitcoinL2 #LightningNetwork #BTCDeFi #Crypto2026
That story is changing fast in 2026.
Layer 2 networks are turning Bitcoin into a full DeFi platform — with smart contracts, fast transactions, and on-chain apps. Here are the L2s leading the charge:
⚡ Lightning Network — instant, near-free Bitcoin payments
🔷 Stacks (STX) — smart contracts and DeFi, anchored to Bitcoin
🔗 Rootstock (RSK) — Ethereum-style contracts on Bitcoin PoW, $160M+ TVL
🚀 Merlin Chain — ZK-rollup tech making Bitcoin faster and cheaper
What this means for you as a BTC holder:
→ Your Bitcoin could be used as DeFi collateral
→ Earn yield on BTC without leaving the Bitcoin ecosystem
→ Access dApps and games — all secured by Bitcoin's network
Bitcoin maximalists and DeFi degens might finally agree on something. 👀
Which Bitcoin L2 are you watching? 👇
#Bitcoin #BitcoinL2 #LightningNetwork #BTCDeFi #Crypto2026
152

·
--
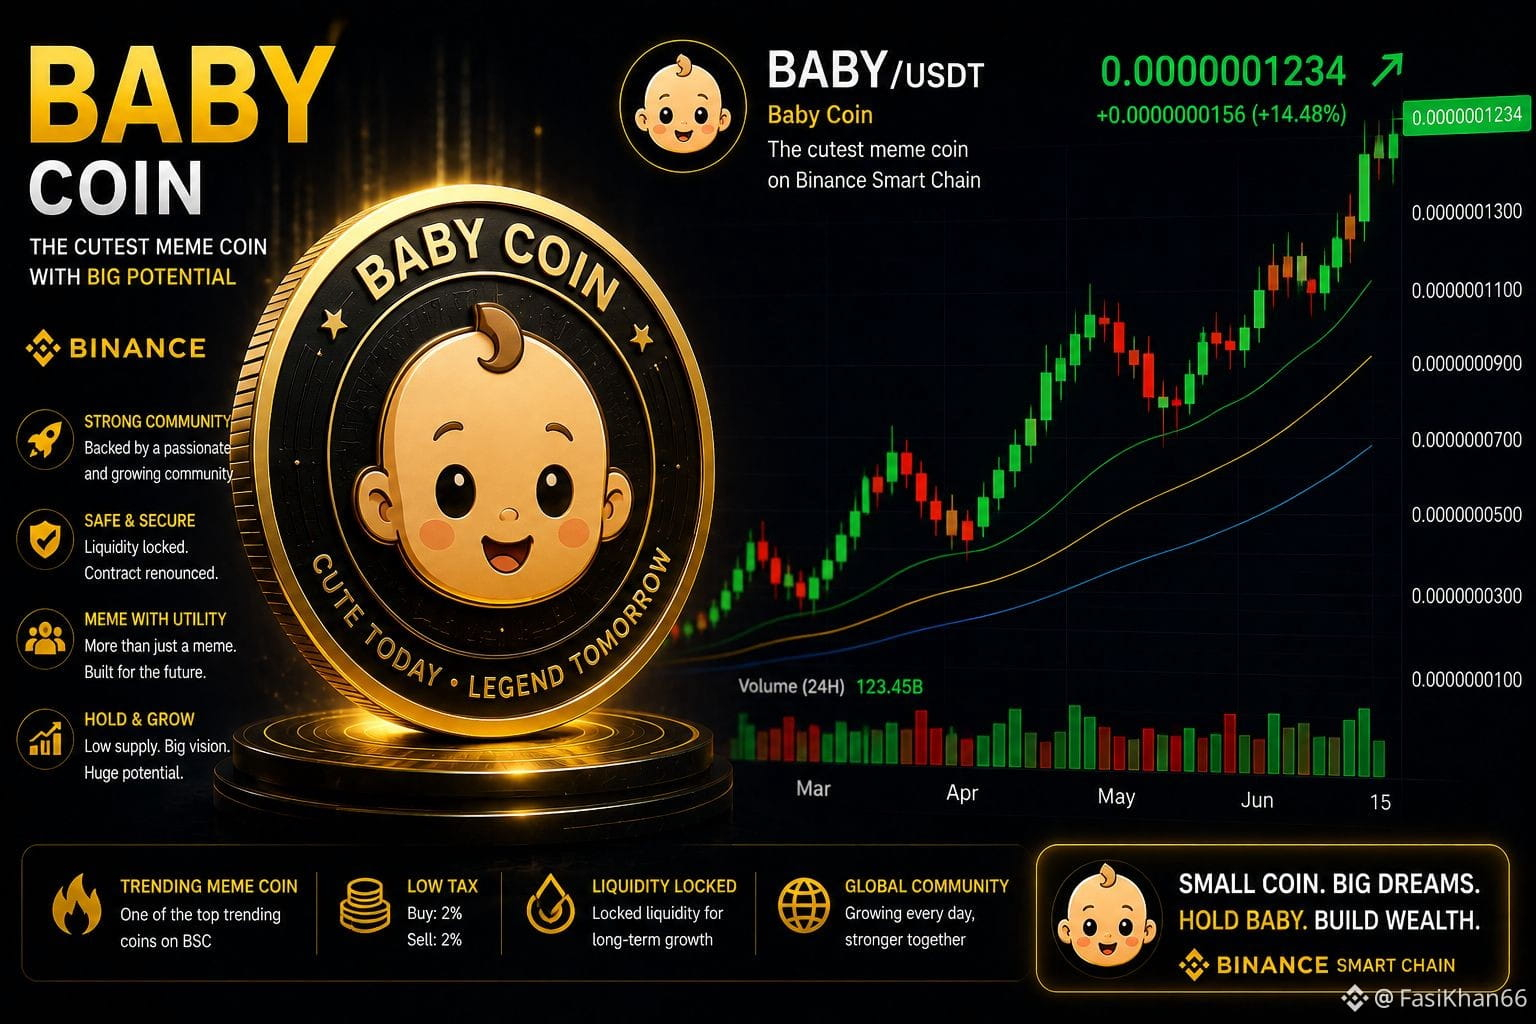
$BABY is down over 93% from its highs, but the tide might be turning.
{spot}(BABYUSDT)
With BTC DeFi narratives heating up and Binance launching a massive 30,000,000 $BABY Trading Tournament, this is a critical moment to watch .
Current Status:
· Price: Hovering around a critical support zone (~$0.0126). Heavy resistance above means bulls need a catalyst .
· Volume: Momentum has cooled, but that's often when the real players step in .
· The Opportunity: Will the exchange event spark a breakout, or will selling pressure continue?
What's your move on $BABY ? 📉📈
Trade smart. Stay sharp.
#baby #Binance #BTCDeFi #CryptoNewss #TradingCommunity
{spot}(KITEUSDT)
{spot}(BICOUSDT)
$BABY is down over 93% from its highs, but the tide might be turning.
With BTC DeFi narratives heating up and Binance launching a massive 30,000,000 $BABY Trading Tournament, this is a critical moment to watch .
Current Status:
· Price: Hovering around a critical support zone (~$0.0126). Heavy resistance above means bulls need a catalyst .
· Volume: Momentum has cooled, but that's often when the real players step in .
· The Opportunity: Will the exchange event spark a breakout, or will selling pressure continue?
What's your move on $BABY ? 📉📈
Trade smart. Stay sharp.
#baby #Binance #BTCDeFi #CryptoNewss #TradingCommunity
With BTC DeFi narratives heating up and Binance launching a massive 30,000,000 $BABY Trading Tournament, this is a critical moment to watch .
Current Status:
· Price: Hovering around a critical support zone (~$0.0126). Heavy resistance above means bulls need a catalyst .
· Volume: Momentum has cooled, but that's often when the real players step in .
· The Opportunity: Will the exchange event spark a breakout, or will selling pressure continue?
What's your move on $BABY ? 📉📈
Trade smart. Stay sharp.
#baby #Binance #BTCDeFi #CryptoNewss #TradingCommunity
198
·
--
$1000SATS $ORDI
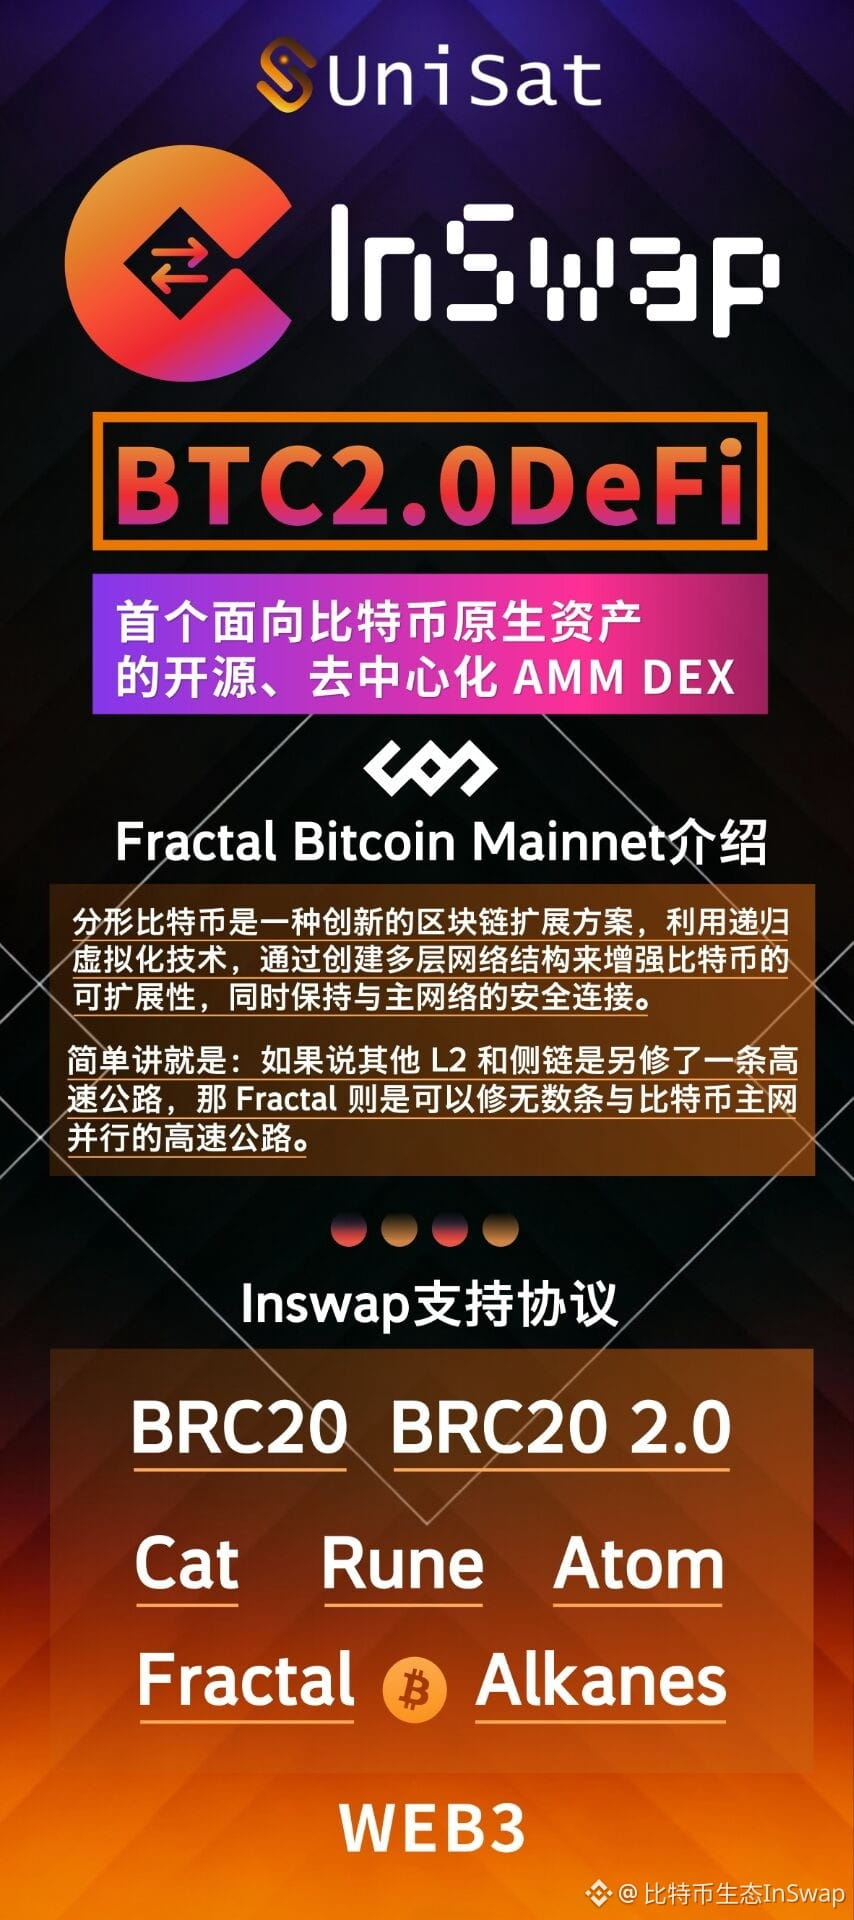
📢 Unisat brings a new breakthrough in Bitcoin native DeFi!
Fractal Bitcoin Mainnet is live—it's not your ordinary L2; it’s built through recursive virtualization creating multiple "parallel highways," securely connected to the Bitcoin mainnet, unleashing limitless scaling potential.
Inswap now supports:
· BRC20 / BRC20 2.0
· CAT, Rune, Atom
· Fractal, Alkanes
The first open-source, decentralized BTC native AMM DEX, stepping into the BTC 2.0 DeFi era!🚀
#Unisat #FractalBitcoin #BRC20 #BTCDeFi #BTC☀
$1000SATS $ORDI
📢 Unisat brings a new breakthrough in Bitcoin native DeFi!
Fractal Bitcoin Mainnet is live—it's not your ordinary L2; it’s built through recursive virtualization creating multiple "parallel highways," securely connected to the Bitcoin mainnet, unleashing limitless scaling potential.
Inswap now supports:
· BRC20 / BRC20 2.0
· CAT, Rune, Atom
· Fractal, Alkanes
The first open-source, decentralized BTC native AMM DEX, stepping into the BTC 2.0 DeFi era!🚀
#Unisat #FractalBitcoin #BRC20 #BTCDeFi #BTC☀
📢 Unisat brings a new breakthrough in Bitcoin native DeFi!
Fractal Bitcoin Mainnet is live—it's not your ordinary L2; it’s built through recursive virtualization creating multiple "parallel highways," securely connected to the Bitcoin mainnet, unleashing limitless scaling potential.
Inswap now supports:
· BRC20 / BRC20 2.0
· CAT, Rune, Atom
· Fractal, Alkanes
The first open-source, decentralized BTC native AMM DEX, stepping into the BTC 2.0 DeFi era!🚀
#Unisat #FractalBitcoin #BRC20 #BTCDeFi #BTC☀
6
3.8k

·
--
In-depth Analysis|What the August Bitcoin eCash hard fork means for BRC2.0?Recently, Bitcoin's core developers announced a hard fork for the Bitcoin network set for August 2026, launching the new chain eCash, marking the biggest divergence since BCH in 2017, shaking up the whole Bitcoin ecosystem. Many are wondering: Will this impact BRC2.0? This article breaks it down in plain terms!
🔥 First things first: Understand the core logic of the eCash fork
This fork doesn’t claim the official title of Bitcoin; it’s focused on solving Bitcoin’s scalability and programmability shortcomings, featuring two main highlights:
1. Tech-wise: Seven new Drivechain layer-2 sidechains have been added, supporting privacy transactions, DEX, DeFi, and on-chain identity scenarios, filling in the gaps in Bitcoin’s application, competing directly with the Lightning Network
In-depth Analysis|What the August Bitcoin eCash hard fork means for BRC2.0?
Recently, Bitcoin's core developers announced a hard fork for the Bitcoin network set for August 2026, launching the new chain eCash, marking the biggest divergence since BCH in 2017, shaking up the whole Bitcoin ecosystem. Many are wondering: Will this impact BRC2.0? This article breaks it down in plain terms!
🔥 First things first: Understand the core logic of the eCash fork
This fork doesn’t claim the official title of Bitcoin; it’s focused on solving Bitcoin’s scalability and programmability shortcomings, featuring two main highlights:
1. Tech-wise: Seven new Drivechain layer-2 sidechains have been added, supporting privacy transactions, DEX, DeFi, and on-chain identity scenarios, filling in the gaps in Bitcoin’s application, competing directly with the Lightning Network
🔥 First things first: Understand the core logic of the eCash fork
This fork doesn’t claim the official title of Bitcoin; it’s focused on solving Bitcoin’s scalability and programmability shortcomings, featuring two main highlights:
1. Tech-wise: Seven new Drivechain layer-2 sidechains have been added, supporting privacy transactions, DEX, DeFi, and on-chain identity scenarios, filling in the gaps in Bitcoin’s application, competing directly with the Lightning Network
2
495

·
--
Today, YALA price is hovering around $0.00045 - $0.00050. It has gone up +40% in many places in the last 24 hours, but overall it is still very low. Market cap is only around $130K, circulating supply is around 280-290 million. ATH was around $0.45, now it is down about 99% from there! Volume is coming in well ($100K+), but it is still a very small cap, high risk token. Bitcoin DeFi project, idea to generate yield on BTC with YU stablecoin.
What will happen in the future? A good pump can be seen in the short term if BTC rallies and the project gets an update/listing. In the long term, if the team delivers and adoption increases, some are hoping it can go up to $0.001 - $0.005 (around 2027-28). But to be honest, it's still very speculative. Like many small tokens, it can go to 0 at any time, or even 10-20x.
My advice: invest with very small amounts, not money to die with. Do DYOR, watch the charts, follow the news.
#YALA #YALAToken #CryptoBangladesh #BTCDeFi
Today, YALA price is hovering around $0.00045 - $0.00050. It has gone up +40% in many places in the last 24 hours, but overall it is still very low. Market cap is only around $130K, circulating supply is around 280-290 million. ATH was around $0.45, now it is down about 99% from there! Volume is coming in well ($100K+), but it is still a very small cap, high risk token. Bitcoin DeFi project, idea to generate yield on BTC with YU stablecoin.
What will happen in the future? A good pump can be seen in the short term if BTC rallies and the project gets an update/listing. In the long term, if the team delivers and adoption increases, some are hoping it can go up to $0.001 - $0.005 (around 2027-28). But to be honest, it's still very speculative. Like many small tokens, it can go to 0 at any time, or even 10-20x.
My advice: invest with very small amounts, not money to die with. Do DYOR, watch the charts, follow the news.
#YALA #YALAToken #CryptoBangladesh #BTCDeFi
What will happen in the future? A good pump can be seen in the short term if BTC rallies and the project gets an update/listing. In the long term, if the team delivers and adoption increases, some are hoping it can go up to $0.001 - $0.005 (around 2027-28). But to be honest, it's still very speculative. Like many small tokens, it can go to 0 at any time, or even 10-20x.
My advice: invest with very small amounts, not money to die with. Do DYOR, watch the charts, follow the news.
#YALA #YALAToken #CryptoBangladesh #BTCDeFi

235
Log in to explore more content
Join global crypto users on Binance Square
⚡️ Get latest and useful information about crypto.
💬 Trusted by the world’s largest crypto exchange.
👍 Discover real insights from verified creators.
Email / Phone number
Trending Topics
1
#AIStocksWhatNext
850,052 views
6,494 Discussing
2
#BitcoinRejectedAt$87,300Twice
0 views
0 Discussing
3
#BCHJumps28%OnCMEFuturesListing
7,699 views
450 Discussing
4
#WallStreetEarningsRevisionsTurnBearish
5,445 views
334 Discussing
5
#DollarIndexReclaims101
4,405 views
278 Discussing
6
#21SharesLaunchesEuropesFirstZcashETP
37,609 views
1,066 Discussing
7
#CardanoJoinsX402PaymentStandard
24,101 views
773 Discussing
8
#BitcoinTops$87KAtEightMonthHigh
12,055 views
131 Discussing
9
#ZECBreaksAbove$1600AtRecordHigh
8,491 views
107 Discussing
10
#BitwiseNEARStakingETPAssetsTop$100M
39,168 views
105 Discussing