
#btc70k
btc70k
31.5M views
28,384 Discussing
Bitcoin hitting the exciting $70k mark, let's dive into discussions, share insights, and celebrate this crypto high together. Come on in, let's talk Bitcoin!
Hot
Latest


·
--
Bitcoin (BTC) Surpasses 70,000 USDT with 0.09% Increase in 24 HoursOn Jun 04, 2024, 14:18 PM (UTC). According to Binance Market Data, Bitcoin (BTC) has crossed the 70,000 USDT benchmark and is now trading at 70,025.851563 USDT, with 0.09% increase in 24 hours.
Bitcoin (BTC) Surpasses 70,000 USDT with 0.09% Increase in 24 Hours
On Jun 04, 2024, 14:18 PM (UTC). According to Binance Market Data, Bitcoin (BTC) has crossed the 70,000 USDT benchmark and is now trading at 70,025.851563 USDT, with 0.09% increase in 24 hours.
4
1
10
12k

·
--
🚨 BITCOIN (BTC) – Is a Major Rebound Coming?
Bitcoin is currently facing strong selling pressure, but could this correction create an interesting opportunity for Spot investors?
BTC is trading around $64,400, and the next few trading sessions could be very important.
🔥 Why I'm Watching Bitcoin:
🔸 Bitcoin remains the leading cryptocurrency. 🔸 Strong institutional interest remains an important long-term factor. 🔸 Current market correction could create new opportunities. 🔸 A recovery in buying pressure could change market sentiment.
📊 Key Levels to Watch:
Support: $62,000
Resistance: $67,000
Next upside level: $70,000
🎯 My View: I'm watching for signs of a bullish reversal before expecting a stronger recovery.
Can Bitcoin recover and surprise the market again? 🚀
What's your BTC target?
#Bitcoin #BTC #Binance #SpotTrading #Crypto
#btc70k
🚨 BITCOIN (BTC) – Is a Major Rebound Coming?
Bitcoin is currently facing strong selling pressure, but could this correction create an interesting opportunity for Spot investors?
BTC is trading around $64,400, and the next few trading sessions could be very important.
🔥 Why I'm Watching Bitcoin:
🔸 Bitcoin remains the leading cryptocurrency. 🔸 Strong institutional interest remains an important long-term factor. 🔸 Current market correction could create new opportunities. 🔸 A recovery in buying pressure could change market sentiment.
📊 Key Levels to Watch:
Support: $62,000
Resistance: $67,000
Next upside level: $70,000
🎯 My View: I'm watching for signs of a bullish reversal before expecting a stronger recovery.
Can Bitcoin recover and surprise the market again? 🚀
What's your BTC target?
#Bitcoin #BTC #Binance #SpotTrading #Crypto
#btc70k
Bitcoin is currently facing strong selling pressure, but could this correction create an interesting opportunity for Spot investors?
BTC is trading around $64,400, and the next few trading sessions could be very important.
🔥 Why I'm Watching Bitcoin:
🔸 Bitcoin remains the leading cryptocurrency. 🔸 Strong institutional interest remains an important long-term factor. 🔸 Current market correction could create new opportunities. 🔸 A recovery in buying pressure could change market sentiment.
📊 Key Levels to Watch:
Support: $62,000
Resistance: $67,000
Next upside level: $70,000
🎯 My View: I'm watching for signs of a bullish reversal before expecting a stronger recovery.
Can Bitcoin recover and surprise the market again? 🚀
What's your BTC target?
#Bitcoin #BTC #Binance #SpotTrading #Crypto
#btc70k

91

·
--
Bearish
Bitcoin Under Pressure$
Bitcoin is facing another serious market test. The recent breakdown below $70K highlights growing uncertainty, weakening risk appetite, and increasing selling pressure.
The key question now is simple: Is this a temporary correction or the beginning of a deeper bearish phase?
The next few trading sessions could be critical f$or BTC.
#Bitcoin #btc70k #BTC #down #WhatWillDriveCryptoandStocks’NextRebound?
Bitcoin Under Pressure$
Bitcoin is facing another serious market test. The recent breakdown below $70K highlights growing uncertainty, weakening risk appetite, and increasing selling pressure.
The key question now is simple: Is this a temporary correction or the beginning of a deeper bearish phase?
The next few trading sessions could be critical f$or BTC.
#Bitcoin #btc70k #BTC #down #WhatWillDriveCryptoandStocks’NextRebound?
Bitcoin is facing another serious market test. The recent breakdown below $70K highlights growing uncertainty, weakening risk appetite, and increasing selling pressure.
The key question now is simple: Is this a temporary correction or the beginning of a deeper bearish phase?
The next few trading sessions could be critical f$or BTC.
#Bitcoin #btc70k #BTC #down #WhatWillDriveCryptoandStocks’NextRebound?
1
124

·
--
Bearish
i don't know what is happening right now but its dangerous in every way to enter .#btc70k which was expected to be drop at 70k dropped at 65000$ . i don't now what will happen next but i am sure its not the right time to take entry just some more time when it reaches 60k then i will make sure to enter every last penny i got. @idontnow $
i don't know what is happening right now but its dangerous in every way to enter .#btc70k which was expected to be drop at 70k dropped at 65000$ . i don't now what will happen next but i am sure its not the right time to take entry just some more time when it reaches 60k then i will make sure to enter every last penny i got. @beaware $
82

I will not sell my BTC don't panic Dump. is cleared wait for 70k loading from here ✨
#WhoWillSucceedJensenHuangatNvidia? #WhatWillDriveCryptoandStocks’NextRebound? #BitcoinActiveSupplyInProfitDropsBelow45% #USPPIMissMayEaseBTCPressure
#btc70k
I will not sell my BTC don't panic Dump. is cleared wait for 70k loading from here ✨
#WhoWillSucceedJensenHuangatNvidia? #WhatWillDriveCryptoandStocks’NextRebound? #BitcoinActiveSupplyInProfitDropsBelow45% #USPPIMissMayEaseBTCPressure
#btc70k
#WhoWillSucceedJensenHuangatNvidia? #WhatWillDriveCryptoandStocks’NextRebound? #BitcoinActiveSupplyInProfitDropsBelow45% #USPPIMissMayEaseBTCPressure
#btc70k
105

·
--

Article
Bitcoin’s Recent Dip: What It Means for InvestorsBitcoin Market Update (Today's Price & Overview)
According to recent crypto market data, here is the current status and price of Bitcoin (BTC):
Current Price (USD): Bitcoin is currently trading around $66,000 to $70,000 (fluctuating slightly depending on the exchange and live market movements).
In Bangladeshi Taka (BDT): At the current exchange rate, 1 Bitcoin is valued at approximately 8.3 million to 8.4 million BDT.
Recent Market Trends & Causes:
Downward Trend: The crypto market has recently experienced a downward trend, with Bitcoin dropping below the $70,000 mark.
Key Reasons: This is primarily driven by global economic conditions, inflation concerns, fears of interest rate hikes, and broader market sentiment making investors cau
tious.$BTC
{spot}(BTCUSDT)
#btc70k #BTC☀️ #BTC🔥🔥🔥🔥🔥 #BTC70K✈️ #BTC突破7万大关
Bitcoin’s Recent Dip: What It Means for Investors
Bitcoin Market Update (Today's Price & Overview)
According to recent crypto market data, here is the current status and price of Bitcoin (BTC):
Current Price (USD): Bitcoin is currently trading around $66,000 to $70,000 (fluctuating slightly depending on the exchange and live market movements).
In Bangladeshi Taka (BDT): At the current exchange rate, 1 Bitcoin is valued at approximately 8.3 million to 8.4 million BDT.
Recent Market Trends & Causes:
Downward Trend: The crypto market has recently experienced a downward trend, with Bitcoin dropping below the $70,000 mark.
Key Reasons: This is primarily driven by global economic conditions, inflation concerns, fears of interest rate hikes, and broader market sentiment making investors cau
tious.$BTC
#btc70k #BTC☀️ #BTC🔥🔥🔥🔥🔥 #BTC70K✈️ #BTC突破7万大关
According to recent crypto market data, here is the current status and price of Bitcoin (BTC):
Current Price (USD): Bitcoin is currently trading around $66,000 to $70,000 (fluctuating slightly depending on the exchange and live market movements).
In Bangladeshi Taka (BDT): At the current exchange rate, 1 Bitcoin is valued at approximately 8.3 million to 8.4 million BDT.
Recent Market Trends & Causes:
Downward Trend: The crypto market has recently experienced a downward trend, with Bitcoin dropping below the $70,000 mark.
Key Reasons: This is primarily driven by global economic conditions, inflation concerns, fears of interest rate hikes, and broader market sentiment making investors cau
tious.$BTC
#btc70k #BTC☀️ #BTC🔥🔥🔥🔥🔥 #BTC70K✈️ #BTC突破7万大关
132

·
--
$BTC Bitcoin Falls Below $70,000: Is This the Right Time to Buy BTC?
Bitcoin Market News | November 14, 2026
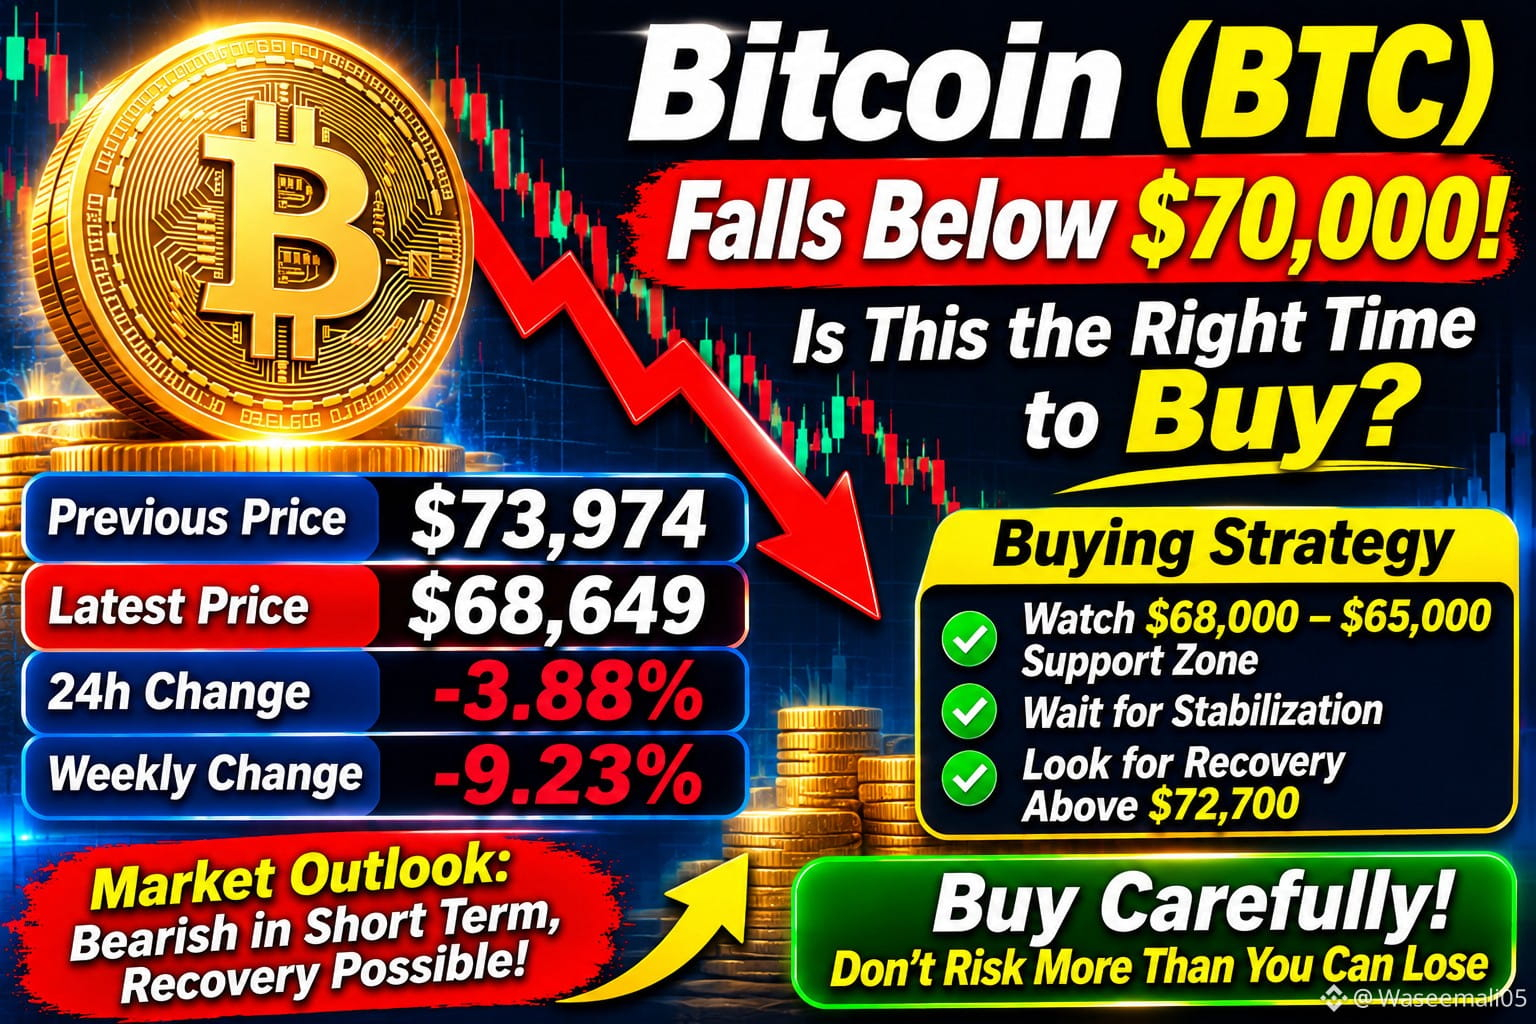
Bitcoin (BTC) is facing strong selling pressure after falling below the important $70,000 level.
- Previous price: Around $73,974
- Latest reported price: Around $68,649
- 24-hour decline: Approximately 3.88%
- Weekly decline: Approximately 9.23%
Why Is Bitcoin Falling?
Market uncertainty, ETF outflows, forced liquidations and concerns about interest rates have increased selling pressure.
Bitcoin Buying Strategy
- Watch $68,000–$65,000 as potential support areas.
- Avoid buying during a sharp downward move.
- Consider a small entry only after price stabilization.
- A recovery above $72,700 could improve the short-term outlook.
Final Prediction
Bitcoin currently has a bearish short-term trend. A rebound is possible, but another decline toward lower support levels cannot be ruled out.
Buy carefully. Never invest more than you can afford to lose.
This article is for educational purposes only, not financial advice.#USPPIMissMayEaseBTCPressure #btc70k #BTC走势分析 #WhatWillDriveCryptoandStocks’NextRebound? #BTC☀
{spot}(BTCUSDT)
$BTC Bitcoin Falls Below $70,000: Is This the Right Time to Buy BTC?
Bitcoin Market News | November 14, 2026
Bitcoin (BTC) is facing strong selling pressure after falling below the important $70,000 level.
- Previous price: Around $73,974
- Latest reported price: Around $68,649
- 24-hour decline: Approximately 3.88%
- Weekly decline: Approximately 9.23%
Why Is Bitcoin Falling?
Market uncertainty, ETF outflows, forced liquidations and concerns about interest rates have increased selling pressure.
Bitcoin Buying Strategy
- Watch $68,000–$65,000 as potential support areas.
- Avoid buying during a sharp downward move.
- Consider a small entry only after price stabilization.
- A recovery above $72,700 could improve the short-term outlook.
Final Prediction
Bitcoin currently has a bearish short-term trend. A rebound is possible, but another decline toward lower support levels cannot be ruled out.
Buy carefully. Never invest more than you can afford to lose.
This article is for educational purposes only, not financial advice.#USPPIMissMayEaseBTCPressure #btc70k #BTC走势分析 #WhatWillDriveCryptoandStocks’NextRebound? #BTC☀
Bitcoin Market News | November 14, 2026
Bitcoin (BTC) is facing strong selling pressure after falling below the important $70,000 level.
- Previous price: Around $73,974
- Latest reported price: Around $68,649
- 24-hour decline: Approximately 3.88%
- Weekly decline: Approximately 9.23%
Why Is Bitcoin Falling?
Market uncertainty, ETF outflows, forced liquidations and concerns about interest rates have increased selling pressure.
Bitcoin Buying Strategy
- Watch $68,000–$65,000 as potential support areas.
- Avoid buying during a sharp downward move.
- Consider a small entry only after price stabilization.
- A recovery above $72,700 could improve the short-term outlook.
Final Prediction
Bitcoin currently has a bearish short-term trend. A rebound is possible, but another decline toward lower support levels cannot be ruled out.
Buy carefully. Never invest more than you can afford to lose.
This article is for educational purposes only, not financial advice.#USPPIMissMayEaseBTCPressure #btc70k #BTC走势分析 #WhatWillDriveCryptoandStocks’NextRebound? #BTC☀
136

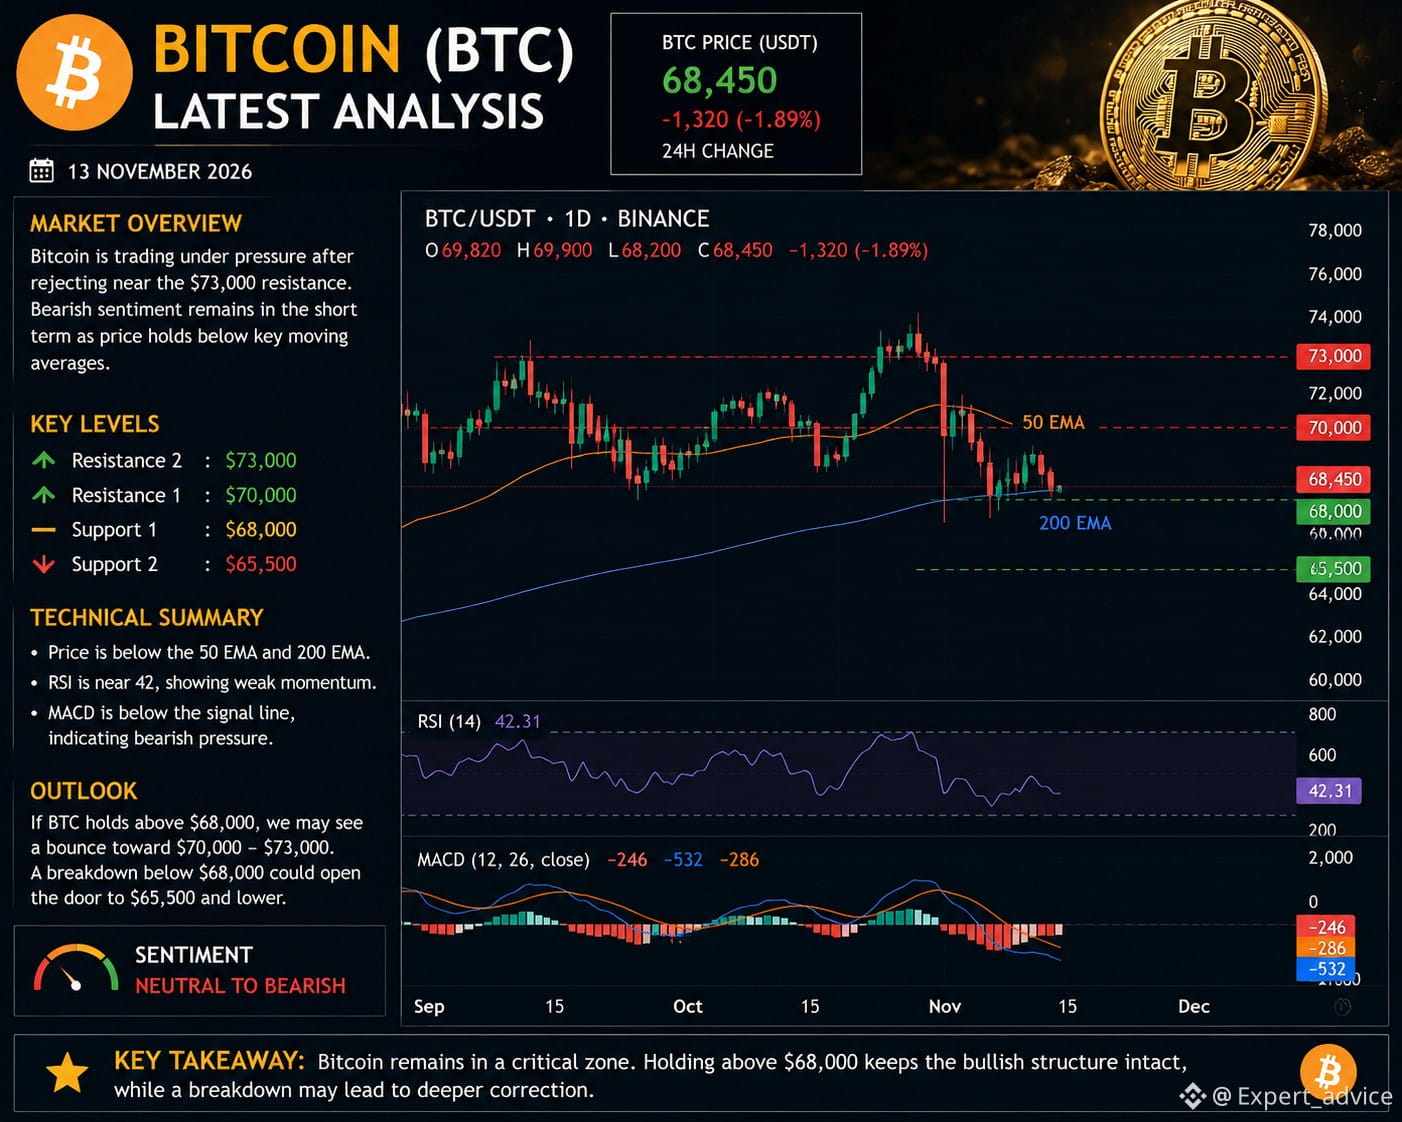
Bitcoin $BTC is facing strong selling pressure after falling below the $70,000 level. Market uncertainty, ETF outflows and liquidations are weighing on investor sentiment.
Support: $68,000 – $65,500
Resistance: $70,000 – $73,000
Outlook: Bearish unless BTC recovers above $70,000.
My view: Watch the $68,000 support closely. A breakdown could trigger further losses, while a recovery above $70,000 may bring buyers back.
{spot}(BTCUSDT)
#btc70k #BTC☀ #BTC🔥🔥🔥🔥🔥
#BTC走势分析
Bitcoin $BTC is facing strong selling pressure after falling below the $70,000 level. Market uncertainty, ETF outflows and liquidations are weighing on investor sentiment.
Support: $68,000 – $65,500
Resistance: $70,000 – $73,000
Outlook: Bearish unless BTC recovers above $70,000.
My view: Watch the $68,000 support closely. A breakdown could trigger further losses, while a recovery above $70,000 may bring buyers back.
#btc70k #BTC☀ #BTC🔥🔥🔥🔥🔥
#BTC走势分析
Support: $68,000 – $65,500
Resistance: $70,000 – $73,000
Outlook: Bearish unless BTC recovers above $70,000.
My view: Watch the $68,000 support closely. A breakdown could trigger further losses, while a recovery above $70,000 may bring buyers back.
#btc70k #BTC☀ #BTC🔥🔥🔥🔥🔥
#BTC走势分析
1
262

·
--
Article
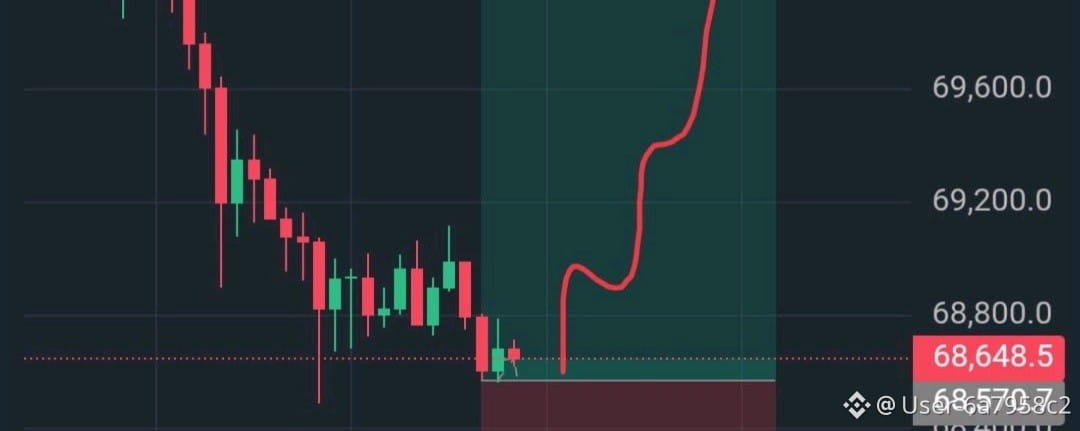
🚨do you guys think I made the right choice?👀I placed a trade on btc
I plan to hold until price goes us to 70k atleast
Hopefully th sells are short and I gain of their losses 🙏
Buy the dip? Yes or No
Bad idea? yes or no
#btc70k
#BTC☀️
#HoldForHugeProfits
{spot}(BTCUSDT)
🚨do you guys think I made the right choice?👀
I placed a trade on btc
I plan to hold until price goes us to 70k atleast
Hopefully th sells are short and I gain of their losses 🙏
Buy the dip? Yes or No
Bad idea? yes or no
#btc70k
#BTC☀️
#HoldForHugeProfits
I plan to hold until price goes us to 70k atleast
Hopefully th sells are short and I gain of their losses 🙏
Buy the dip? Yes or No
Bad idea? yes or no
#btc70k
#BTC☀️
#HoldForHugeProfits
1
32

·
--
Bullish
🚨 BITCOIN ($BTC )NEXT 24 HOURS PRICE PREDICTION! 📊
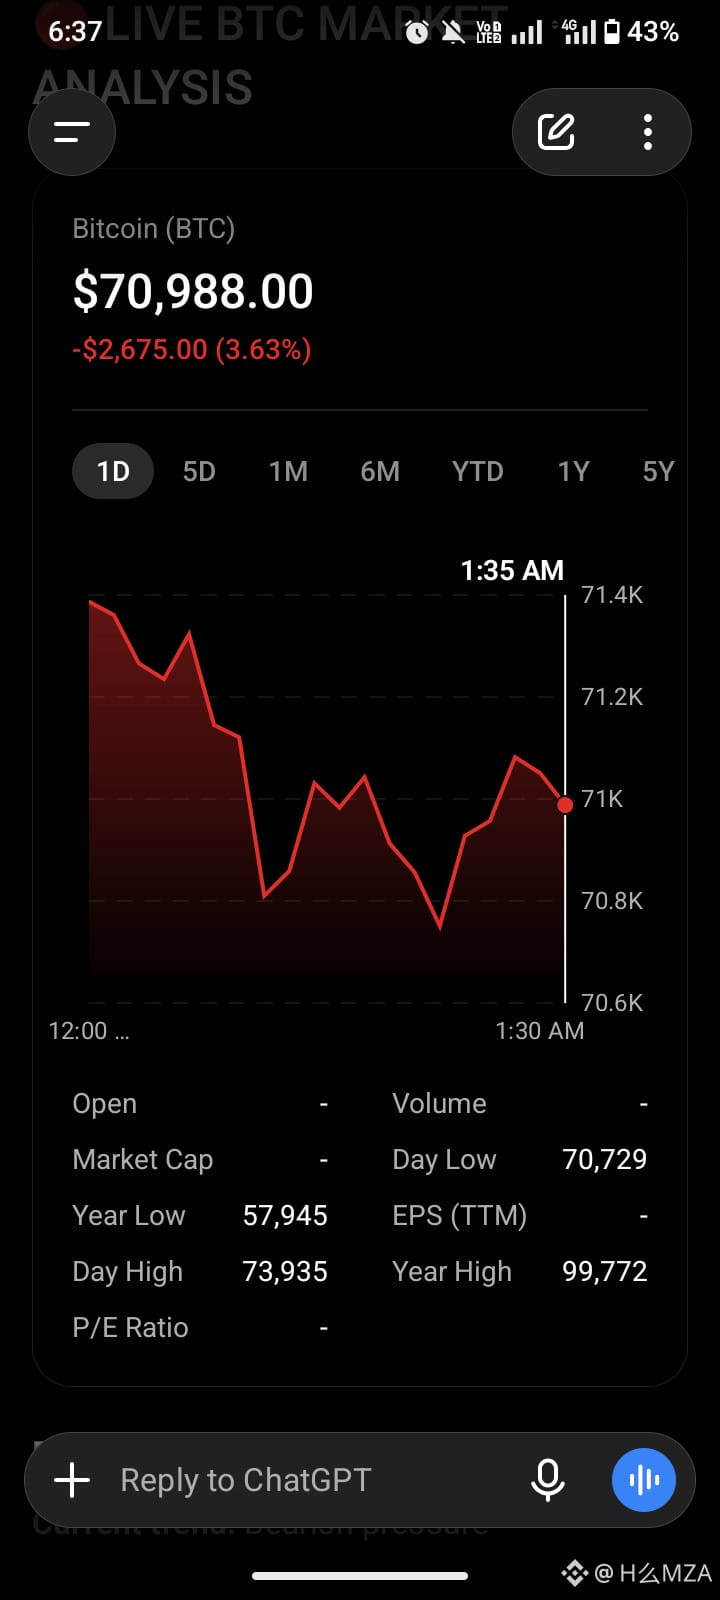
Bitcoin is currently facing strong selling pressure. The next 24 hours could be very important for $BTC traders!
📉 CURRENT MARKET OUTLOOK:
🔴 Trend: Bearish Pressure
🎯 IMPORTANT PRICE LEVELS:
🟢 Resistance 1: $72,352
🟢 Resistance 2: $73,247
🔴 Support 1: $70,150
🔴 Support 2: $69,621
📈 BULLISH SCENARIO:
If BTC breaks above $72,352 with strong buying volume, a recovery toward $73,247 could become possible.
📉 BEARISH SCENARIO:
If selling pressure continues BTC could test $70,150 and potentially $69,621.
🔥 MY MARKET VIEW:
Stay alert! Wait for confirmation before making any trading decisions.
👇 YOUR TURN:
Where will Bitcoin go in the next 24 hours?
🚀 $73K UP
📉 $69K DOWN
COMMENT YOUR PREDICTION!
Follow for daily crypto updates and technical analysis.
⚠️ Disclaimer: Educational content only. Not financial advice. These are possible scenarios, not guaranteed predictions.
#bitcoin #btc70k #CryptoAnalysis #BitcoinPrediction #CryptoCommunity
{spot}(BTCUSDT)
🚨 BITCOIN ($BTC )NEXT 24 HOURS PRICE PREDICTION! 📊
Bitcoin is currently facing strong selling pressure. The next 24 hours could be very important for $BTC traders!
📉 CURRENT MARKET OUTLOOK:
🔴 Trend: Bearish Pressure
🎯 IMPORTANT PRICE LEVELS:
🟢 Resistance 1: $72,352
🟢 Resistance 2: $73,247
🔴 Support 1: $70,150
🔴 Support 2: $69,621
📈 BULLISH SCENARIO:
If BTC breaks above $72,352 with strong buying volume, a recovery toward $73,247 could become possible.
📉 BEARISH SCENARIO:
If selling pressure continues BTC could test $70,150 and potentially $69,621.
🔥 MY MARKET VIEW:
Stay alert! Wait for confirmation before making any trading decisions.
👇 YOUR TURN:
Where will Bitcoin go in the next 24 hours?
🚀 $73K UP
📉 $69K DOWN
COMMENT YOUR PREDICTION!
Follow for daily crypto updates and technical analysis.
⚠️ Disclaimer: Educational content only. Not financial advice. These are possible scenarios, not guaranteed predictions.
#bitcoin #btc70k #CryptoAnalysis #BitcoinPrediction #CryptoCommunity
Bitcoin is currently facing strong selling pressure. The next 24 hours could be very important for $BTC traders!
📉 CURRENT MARKET OUTLOOK:
🔴 Trend: Bearish Pressure
🎯 IMPORTANT PRICE LEVELS:
🟢 Resistance 1: $72,352
🟢 Resistance 2: $73,247
🔴 Support 1: $70,150
🔴 Support 2: $69,621
📈 BULLISH SCENARIO:
If BTC breaks above $72,352 with strong buying volume, a recovery toward $73,247 could become possible.
📉 BEARISH SCENARIO:
If selling pressure continues BTC could test $70,150 and potentially $69,621.
🔥 MY MARKET VIEW:
Stay alert! Wait for confirmation before making any trading decisions.
👇 YOUR TURN:
Where will Bitcoin go in the next 24 hours?
🚀 $73K UP
📉 $69K DOWN
COMMENT YOUR PREDICTION!
Follow for daily crypto updates and technical analysis.
⚠️ Disclaimer: Educational content only. Not financial advice. These are possible scenarios, not guaranteed predictions.
#bitcoin #btc70k #CryptoAnalysis #BitcoinPrediction #CryptoCommunity
1
1
1.1k

·
--
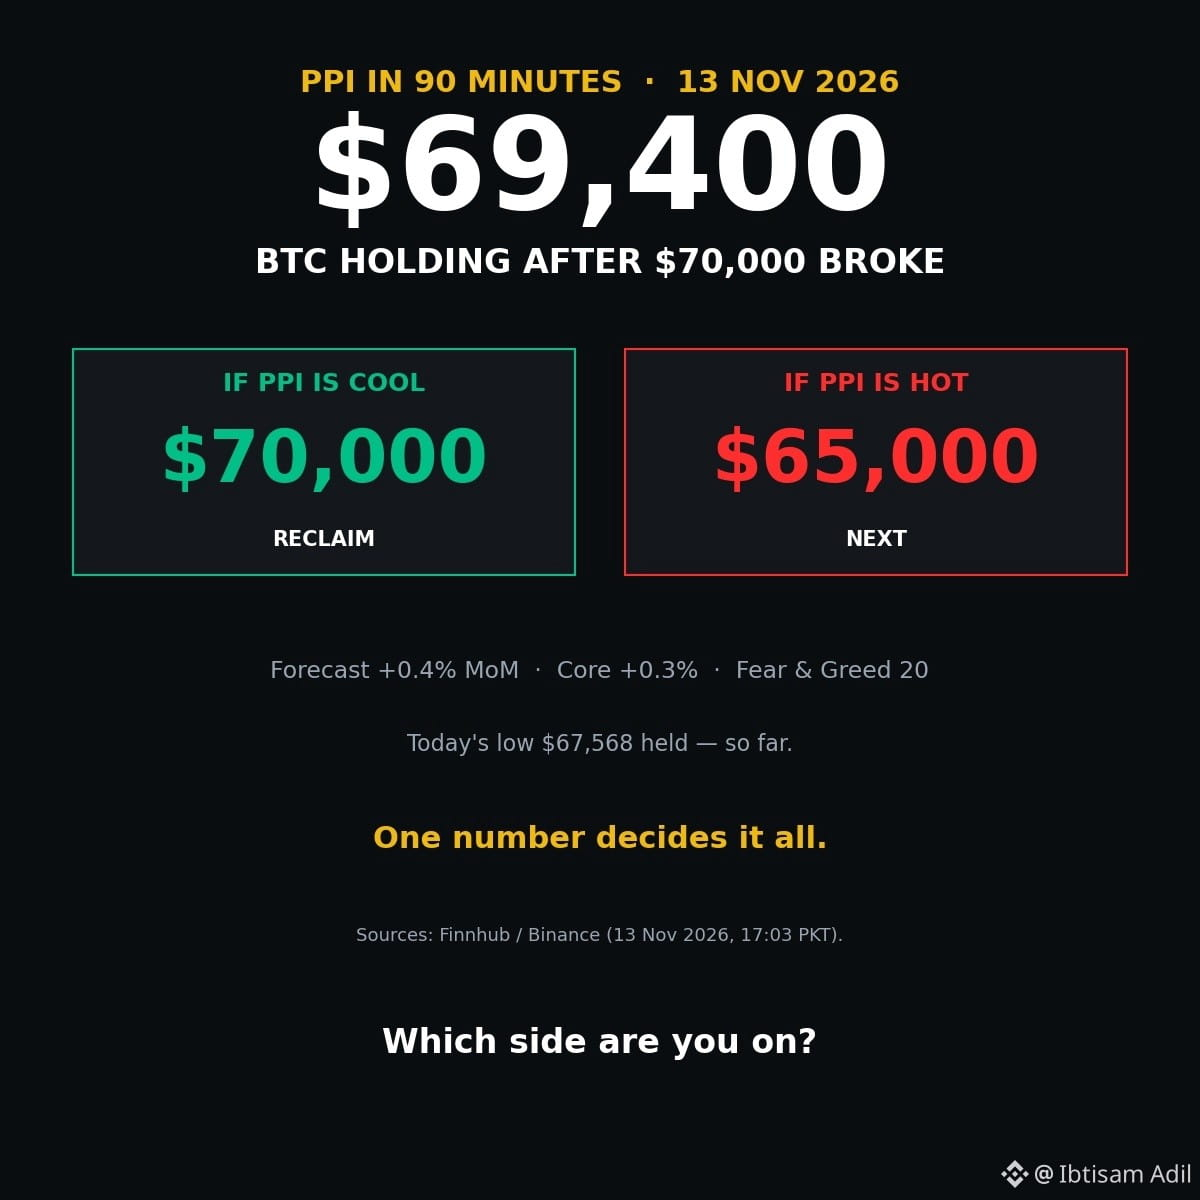
90 minutes to PPI. $BTC
{future}(BTCUSDT)
is sitting at $69,400 — below $70,000, above today's low of $67,568.
One number decides the next move. Cool print — $70,000 gets reclaimed. Hot print — $65,000 is next.
The whole market is holding its breath. Which side are you on?
#btc70k #CryptoNewss #BinanceSquareFamily #BinanceSquare
90 minutes to PPI. $BTC
is sitting at $69,400 — below $70,000, above today's low of $67,568.
One number decides the next move. Cool print — $70,000 gets reclaimed. Hot print — $65,000 is next.
The whole market is holding its breath. Which side are you on?
#btc70k #CryptoNewss #BinanceSquareFamily #BinanceSquare
is sitting at $69,400 — below $70,000, above today's low of $67,568.
One number decides the next move. Cool print — $70,000 gets reclaimed. Hot print — $65,000 is next.
The whole market is holding its breath. Which side are you on?
#btc70k #CryptoNewss #BinanceSquareFamily #BinanceSquare
85

·
--
Bearish
$BTC DAILY FVG TESTED
BUYERS START SHOWING INTEREST!
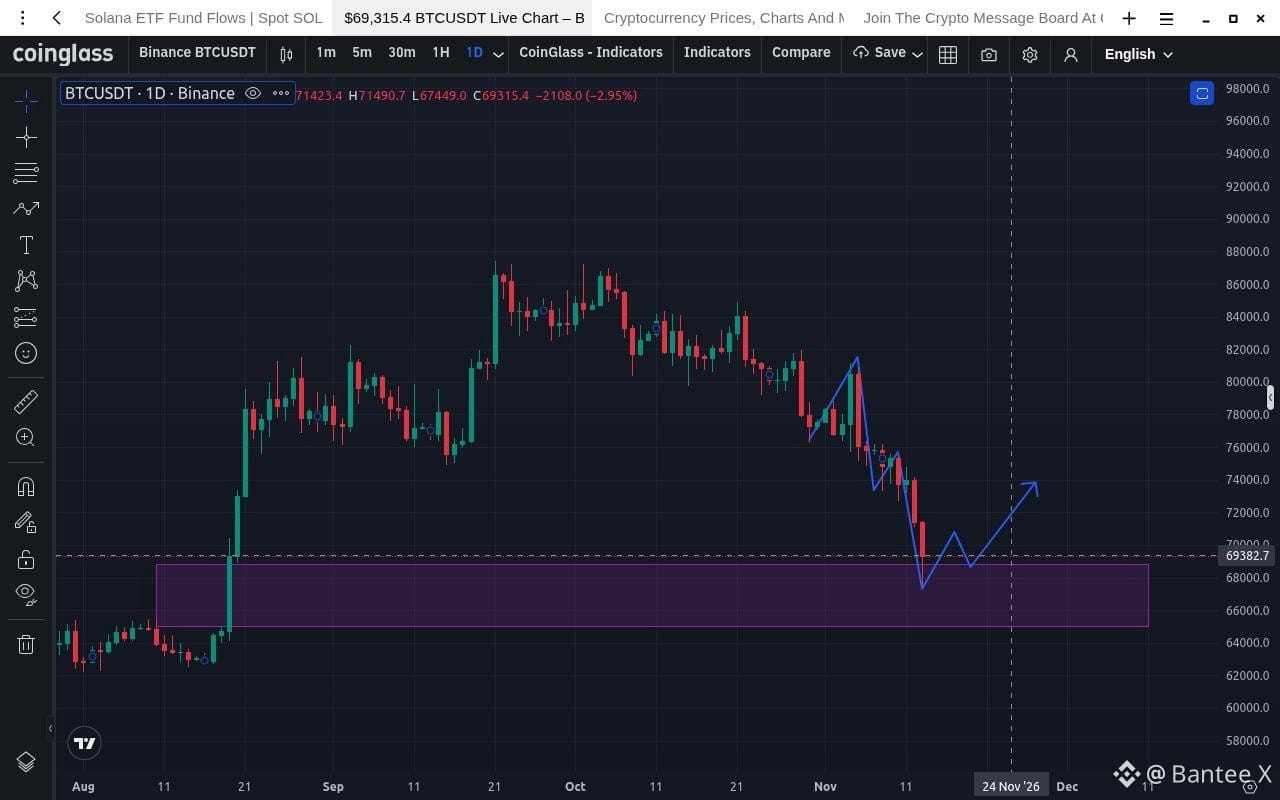
As discussed in our previous analysis, BTC has finally entered and tested the Daily FVG demand zone around $65K–$69K. We're now seeing early signs of buying momentum, making this an important area to watch for a potential recovery.
I'm planning a conditional LONG position, targeting $72,000+, where significant upside liquidity could attract price. My strict stop-loss will be placed below the recent low, around $67,000, subject to entry confirmation.
A strong bullish reaction and confirmation are essential before entering. If the support fails, I'll respect the stop-loss and avoid forcing the trade.
The opportunity is interesting, but risk management comes first. Let's see if BTC can turn this FVG into a launchpad for recovery! 👀
What's your view ? is $72K the next stop?
{future}(BTCUSDT)
#WhatWillDriveCryptoandStocks’NextRebound? #btc70k #TradeSignal
$BTC DAILY FVG TESTED
BUYERS START SHOWING INTEREST!
As discussed in our previous analysis, BTC has finally entered and tested the Daily FVG demand zone around $65K–$69K. We're now seeing early signs of buying momentum, making this an important area to watch for a potential recovery.
I'm planning a conditional LONG position, targeting $72,000+, where significant upside liquidity could attract price. My strict stop-loss will be placed below the recent low, around $67,000, subject to entry confirmation.
A strong bullish reaction and confirmation are essential before entering. If the support fails, I'll respect the stop-loss and avoid forcing the trade.
The opportunity is interesting, but risk management comes first. Let's see if BTC can turn this FVG into a launchpad for recovery! 👀
What's your view ? is $72K the next stop?
#WhatWillDriveCryptoandStocks’NextRebound? #btc70k #TradeSignal
BUYERS START SHOWING INTEREST!
As discussed in our previous analysis, BTC has finally entered and tested the Daily FVG demand zone around $65K–$69K. We're now seeing early signs of buying momentum, making this an important area to watch for a potential recovery.
I'm planning a conditional LONG position, targeting $72,000+, where significant upside liquidity could attract price. My strict stop-loss will be placed below the recent low, around $67,000, subject to entry confirmation.
A strong bullish reaction and confirmation are essential before entering. If the support fails, I'll respect the stop-loss and avoid forcing the trade.
The opportunity is interesting, but risk management comes first. Let's see if BTC can turn this FVG into a launchpad for recovery! 👀
What's your view ? is $72K the next stop?
#WhatWillDriveCryptoandStocks’NextRebound? #btc70k #TradeSignal
120
·
--
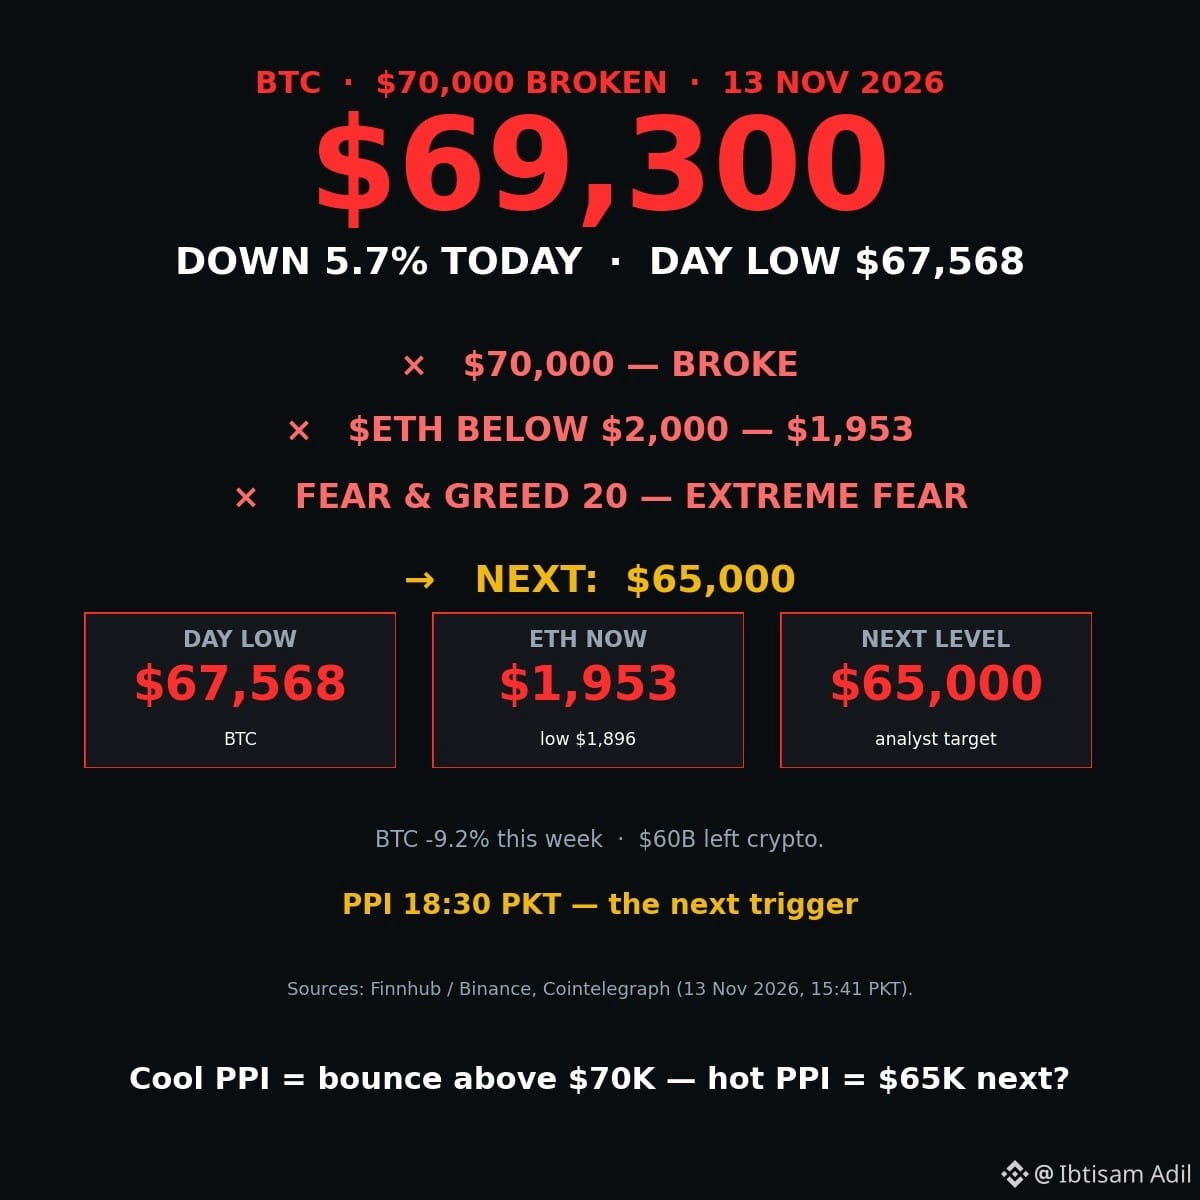
$70,000 is GONE. $BTC
{future}(BTCUSDT)
just broke it — $69,300 now, day low $67,568.
The last line didn't hold. Not the 50-week average. Not $73,000. Not $72,000. Not $70,000. Every level broke.
$ETH
{spot}(ETHUSDT)
is at $1,953 — below $2,000 too. Fear & Greed is 20. Extreme fear.
PPI drops at 18:30 PKT. That's the next trigger. Cool print = bounce back above $70,000. Hot print = $65,000 next. Pick a side.
#btc70k #ETH🔥🔥🔥🔥🔥🔥
$70,000 is GONE. $BTC
just broke it — $69,300 now, day low $67,568.
The last line didn't hold. Not the 50-week average. Not $73,000. Not $72,000. Not $70,000. Every level broke.
$ETH
is at $1,953 — below $2,000 too. Fear & Greed is 20. Extreme fear.
PPI drops at 18:30 PKT. That's the next trigger. Cool print = bounce back above $70,000. Hot print = $65,000 next. Pick a side.
#btc70k #ETH🔥🔥🔥🔥🔥🔥
just broke it — $69,300 now, day low $67,568.
The last line didn't hold. Not the 50-week average. Not $73,000. Not $72,000. Not $70,000. Every level broke.
$ETH
is at $1,953 — below $2,000 too. Fear & Greed is 20. Extreme fear.
PPI drops at 18:30 PKT. That's the next trigger. Cool print = bounce back above $70,000. Hot print = $65,000 next. Pick a side.
#btc70k #ETH🔥🔥🔥🔥🔥🔥
109

The price of BTC has fallen below the $70k psychological support level; the next targets are $68k, $66k, and $40k, respectively. $BTC #btc70k
The price of BTC has fallen below the $70k psychological support level; the next targets are $68k, $66k, and $40k, respectively. $BTC #btc70k
Tyra Oberle SKsd:
today btc is gonna touch back to 73k or more.
3
4
2.9k

·
--

Article
Bitcoin ($BTC) Price Analysis: Can BTC Reverse From the $71K–$72K Key Zone?$Bitcoin ($BTC) Price Analysis: Can BTC Reverse From the $71K–$72K Key Zone?
Bitcoin ($BTC) is approaching an important higher-timeframe price zone between $71,000 and $72,000, which could play a significant role in determining its next major market direction.
After recent selling pressure, Bitcoin is approaching an area where buyers may step in and attempt to create a bullish reversal. However, traders should not assume that the price will automatically bounce from this zone. Confirmation is essential.
Let's break down both possible scenarios and understand what traders should watch next.
1. Understanding the $71,000–$72,000 Key Zone
The $71K–$72K region is an important higher-timeframe area that deserves attention.
This zone may act as a potential support or demand area where buying interest could increase.
If Bitcoin enters this region and buyers successfully defend it, we could see:
Increased buying pressure.A bullish price reaction.A possible market structure shift.A potential upward recovery.New long trading opportunities after confirmation.
However, entering a support zone does not guarantee a reversal. Traders should wait for confirmation through price action and market structure.
2. Bullish Scenario: What If Bitcoin Holds This Zone?
The bullish scenario becomes more interesting if BTC respects the $71,000–$72,000 region.
Here is what traders should look for:
A. Strong Buying Reaction
Bitcoin should show signs of buying pressure after reaching the highlighted zone.
B. Bullish Market Structure Shift
A break above a relevant short-term lower high could indicate that buyers are gaining control.
C. Bullish Fair Value Gap (FVG)
A bullish FVG may develop during an upward move. This can help traders identify potential areas of interest for a retracement and continuation.
D. Confirmation Before Entering
Instead of entering blindly, traders should wait for a clear confirmation and identify a suitable stop-loss level.
If these conditions develop, Bitcoin could attempt a recovery toward higher price levels.
3. Bearish Scenario: What If the Support Zone Fails?
A professional trader should always prepare for both directions.
If Bitcoin fails to hold the $71K–$72K region, the bullish setup could become invalid.
A bearish scenario may develop if:
BTC breaks below the highlighted support region.Selling pressure continues.Price forms a bearish Fair Value Gap (FVG).A retest of the broken zone gets rejected.Sellers maintain control of the market structure.
In this situation, the previous support area could turn into resistance.
This could open the possibility of further downside movement.
Therefore, traders should avoid holding onto a bullish bias when market conditions change.
4. What Is Fair Value Gap (FVG)?
Fair Value Gap, commonly known as FVG, is a concept used in Smart Money Concepts (SMC) trading.
It represents an imbalance in price movement, often identified through a three-candle pattern.
A bullish FVG generally develops during strong upward movement, while a bearish FVG develops during strong downward movement.
Traders use these areas to identify potential price reactions and possible trading opportunities.
However, not every FVG gets filled or produces a successful trade. It should always be considered alongside market structure, liquidity and other confirmations.
5. My Trading Strategy for Bitcoin ($BTC)
My current focus is on observing the $71K–$72K region and understanding how Bitcoin reacts around it.
I am interested in potential long opportunities if the zone holds and bullish confirmation appears.
At the same time, I am keeping a bearish scenario in mind if the support fails and a bearish FVG develops.
My approach is simple:
Identify important higher-timeframe zones.Wait for price to reach the area.Observe buying and selling pressure.Look for market structure confirmation.Plan entry and stop-loss levels.Calculate risk before taking a trade.Avoid emotional decisions.
The objective is not to predict every market movement. It is to react to what the market actually shows.
6. Important Risk Management Rules
Cryptocurrency markets are highly volatile, and even a well-planned trade can fail.
Before entering any BTC trade, remember these important rules:
Never risk money you cannot afford to lose.Always define your stop-loss before entering.Avoid excessive leverage.Do not enter a trade simply because the price reaches a support zone.Maintain a proper risk-to-reward ratio.Never chase the market out of fear of missing an opportunity.Respect your trade invalidation level.
Capital protection should always come before profit.
7. Final Thoughts: What Should BTC Traders Watch?
Bitcoin is approaching an important technical area around $71,000–$72,000.
Two possibilities remain on the table:
Bullish Outlook: If BTC holds the zone and confirms buying strength, a potential bullish reversal could develop.
Bearish Outlook: If BTC loses the zone and forms bearish price action, the area could turn into resistance and further downside may follow.
For now, patience is more important than prediction.
The best trading opportunities often come from waiting for confirmation rather than entering based on expectations.
Remember: Trade the reaction, not the expectation.
Always have a plan, respect your invalidation levels, and manage your risk properly.
What is your view on Bitcoin?
Will $BTC create a bullish reversal, or will sellers push the price lower?
Share your analysis in the comments!
#Bitcoin #btc70k #BTC走势分析 #WhatWillDriveCryptoandStocks’NextRebound? #TradingCommunity
Bitcoin ($BTC) Price Analysis: Can BTC Reverse From the $71K–$72K Key Zone?$
Bitcoin ($BTC) Price Analysis: Can BTC Reverse From the $71K–$72K Key Zone?
Bitcoin ($BTC) is approaching an important higher-timeframe price zone between $71,000 and $72,000, which could play a significant role in determining its next major market direction.
After recent selling pressure, Bitcoin is approaching an area where buyers may step in and attempt to create a bullish reversal. However, traders should not assume that the price will automatically bounce from this zone. Confirmation is essential.
Let's break down both possible scenarios and understand what traders should watch next.
1. Understanding the $71,000–$72,000 Key Zone
The $71K–$72K region is an important higher-timeframe area that deserves attention.
This zone may act as a potential support or demand area where buying interest could increase.
If Bitcoin enters this region and buyers successfully defend it, we could see:
Increased buying pressure.A bullish price reaction.A possible market structure shift.A potential upward recovery.New long trading opportunities after confirmation.
However, entering a support zone does not guarantee a reversal. Traders should wait for confirmation through price action and market structure.
2. Bullish Scenario: What If Bitcoin Holds This Zone?
The bullish scenario becomes more interesting if BTC respects the $71,000–$72,000 region.
Here is what traders should look for:
A. Strong Buying Reaction
Bitcoin should show signs of buying pressure after reaching the highlighted zone.
B. Bullish Market Structure Shift
A break above a relevant short-term lower high could indicate that buyers are gaining control.
C. Bullish Fair Value Gap (FVG)
A bullish FVG may develop during an upward move. This can help traders identify potential areas of interest for a retracement and continuation.
D. Confirmation Before Entering
Instead of entering blindly, traders should wait for a clear confirmation and identify a suitable stop-loss level.
If these conditions develop, Bitcoin could attempt a recovery toward higher price levels.
3. Bearish Scenario: What If the Support Zone Fails?
A professional trader should always prepare for both directions.
If Bitcoin fails to hold the $71K–$72K region, the bullish setup could become invalid.
A bearish scenario may develop if:
BTC breaks below the highlighted support region.Selling pressure continues.Price forms a bearish Fair Value Gap (FVG).A retest of the broken zone gets rejected.Sellers maintain control of the market structure.
In this situation, the previous support area could turn into resistance.
This could open the possibility of further downside movement.
Therefore, traders should avoid holding onto a bullish bias when market conditions change.
4. What Is Fair Value Gap (FVG)?
Fair Value Gap, commonly known as FVG, is a concept used in Smart Money Concepts (SMC) trading.
It represents an imbalance in price movement, often identified through a three-candle pattern.
A bullish FVG generally develops during strong upward movement, while a bearish FVG develops during strong downward movement.
Traders use these areas to identify potential price reactions and possible trading opportunities.
However, not every FVG gets filled or produces a successful trade. It should always be considered alongside market structure, liquidity and other confirmations.
5. My Trading Strategy for Bitcoin ($BTC)
My current focus is on observing the $71K–$72K region and understanding how Bitcoin reacts around it.
I am interested in potential long opportunities if the zone holds and bullish confirmation appears.
At the same time, I am keeping a bearish scenario in mind if the support fails and a bearish FVG develops.
My approach is simple:
Identify important higher-timeframe zones.Wait for price to reach the area.Observe buying and selling pressure.Look for market structure confirmation.Plan entry and stop-loss levels.Calculate risk before taking a trade.Avoid emotional decisions.
The objective is not to predict every market movement. It is to react to what the market actually shows.
6. Important Risk Management Rules
Cryptocurrency markets are highly volatile, and even a well-planned trade can fail.
Before entering any BTC trade, remember these important rules:
Never risk money you cannot afford to lose.Always define your stop-loss before entering.Avoid excessive leverage.Do not enter a trade simply because the price reaches a support zone.Maintain a proper risk-to-reward ratio.Never chase the market out of fear of missing an opportunity.Respect your trade invalidation level.
Capital protection should always come before profit.
7. Final Thoughts: What Should BTC Traders Watch?
Bitcoin is approaching an important technical area around $71,000–$72,000.
Two possibilities remain on the table:
Bullish Outlook: If BTC holds the zone and confirms buying strength, a potential bullish reversal could develop.
Bearish Outlook: If BTC loses the zone and forms bearish price action, the area could turn into resistance and further downside may follow.
For now, patience is more important than prediction.
The best trading opportunities often come from waiting for confirmation rather than entering based on expectations.
Remember: Trade the reaction, not the expectation.
Always have a plan, respect your invalidation levels, and manage your risk properly.
What is your view on Bitcoin?
Will $BTC create a bullish reversal, or will sellers push the price lower?
Share your analysis in the comments!
#Bitcoin #btc70k #BTC走势分析 #WhatWillDriveCryptoandStocks’NextRebound? #TradingCommunity
Bitcoin ($BTC) is approaching an important higher-timeframe price zone between $71,000 and $72,000, which could play a significant role in determining its next major market direction.
After recent selling pressure, Bitcoin is approaching an area where buyers may step in and attempt to create a bullish reversal. However, traders should not assume that the price will automatically bounce from this zone. Confirmation is essential.
Let's break down both possible scenarios and understand what traders should watch next.
1. Understanding the $71,000–$72,000 Key Zone
The $71K–$72K region is an important higher-timeframe area that deserves attention.
This zone may act as a potential support or demand area where buying interest could increase.
If Bitcoin enters this region and buyers successfully defend it, we could see:
Increased buying pressure.A bullish price reaction.A possible market structure shift.A potential upward recovery.New long trading opportunities after confirmation.
However, entering a support zone does not guarantee a reversal. Traders should wait for confirmation through price action and market structure.
2. Bullish Scenario: What If Bitcoin Holds This Zone?
The bullish scenario becomes more interesting if BTC respects the $71,000–$72,000 region.
Here is what traders should look for:
A. Strong Buying Reaction
Bitcoin should show signs of buying pressure after reaching the highlighted zone.
B. Bullish Market Structure Shift
A break above a relevant short-term lower high could indicate that buyers are gaining control.
C. Bullish Fair Value Gap (FVG)
A bullish FVG may develop during an upward move. This can help traders identify potential areas of interest for a retracement and continuation.
D. Confirmation Before Entering
Instead of entering blindly, traders should wait for a clear confirmation and identify a suitable stop-loss level.
If these conditions develop, Bitcoin could attempt a recovery toward higher price levels.
3. Bearish Scenario: What If the Support Zone Fails?
A professional trader should always prepare for both directions.
If Bitcoin fails to hold the $71K–$72K region, the bullish setup could become invalid.
A bearish scenario may develop if:
BTC breaks below the highlighted support region.Selling pressure continues.Price forms a bearish Fair Value Gap (FVG).A retest of the broken zone gets rejected.Sellers maintain control of the market structure.
In this situation, the previous support area could turn into resistance.
This could open the possibility of further downside movement.
Therefore, traders should avoid holding onto a bullish bias when market conditions change.
4. What Is Fair Value Gap (FVG)?
Fair Value Gap, commonly known as FVG, is a concept used in Smart Money Concepts (SMC) trading.
It represents an imbalance in price movement, often identified through a three-candle pattern.
A bullish FVG generally develops during strong upward movement, while a bearish FVG develops during strong downward movement.
Traders use these areas to identify potential price reactions and possible trading opportunities.
However, not every FVG gets filled or produces a successful trade. It should always be considered alongside market structure, liquidity and other confirmations.
5. My Trading Strategy for Bitcoin ($BTC)
My current focus is on observing the $71K–$72K region and understanding how Bitcoin reacts around it.
I am interested in potential long opportunities if the zone holds and bullish confirmation appears.
At the same time, I am keeping a bearish scenario in mind if the support fails and a bearish FVG develops.
My approach is simple:
Identify important higher-timeframe zones.Wait for price to reach the area.Observe buying and selling pressure.Look for market structure confirmation.Plan entry and stop-loss levels.Calculate risk before taking a trade.Avoid emotional decisions.
The objective is not to predict every market movement. It is to react to what the market actually shows.
6. Important Risk Management Rules
Cryptocurrency markets are highly volatile, and even a well-planned trade can fail.
Before entering any BTC trade, remember these important rules:
Never risk money you cannot afford to lose.Always define your stop-loss before entering.Avoid excessive leverage.Do not enter a trade simply because the price reaches a support zone.Maintain a proper risk-to-reward ratio.Never chase the market out of fear of missing an opportunity.Respect your trade invalidation level.
Capital protection should always come before profit.
7. Final Thoughts: What Should BTC Traders Watch?
Bitcoin is approaching an important technical area around $71,000–$72,000.
Two possibilities remain on the table:
Bullish Outlook: If BTC holds the zone and confirms buying strength, a potential bullish reversal could develop.
Bearish Outlook: If BTC loses the zone and forms bearish price action, the area could turn into resistance and further downside may follow.
For now, patience is more important than prediction.
The best trading opportunities often come from waiting for confirmation rather than entering based on expectations.
Remember: Trade the reaction, not the expectation.
Always have a plan, respect your invalidation levels, and manage your risk properly.
What is your view on Bitcoin?
Will $BTC create a bullish reversal, or will sellers push the price lower?
Share your analysis in the comments!
#Bitcoin #btc70k #BTC走势分析 #WhatWillDriveCryptoandStocks’NextRebound? #TradingCommunity
80

·
--
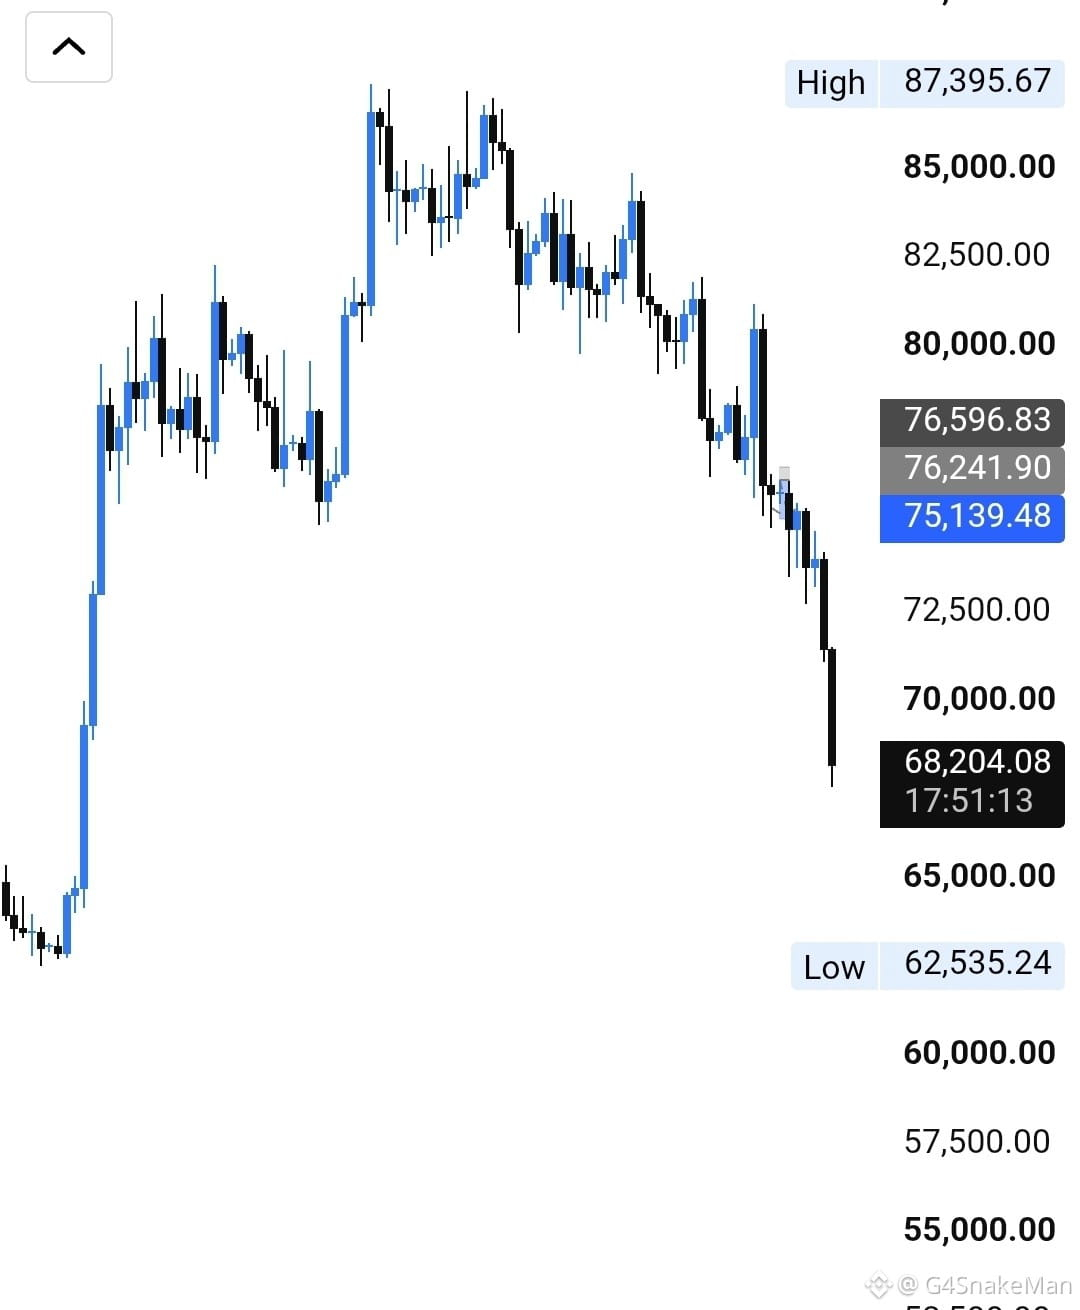
$BTC crashes below $70,000 for the first time since August — now trading at $68,172, down 7.3% in 24 hours.
Over $1.4B in leveraged positions wiped out in 24 hours, mostly longs, as US spot Bitcoin ETFs log a fifth straight day of outflows.
.
.
#btc70k
$BTC crashes below $70,000 for the first time since August — now trading at $68,172, down 7.3% in 24 hours.
Over $1.4B in leveraged positions wiped out in 24 hours, mostly longs, as US spot Bitcoin ETFs log a fifth straight day of outflows.
.
.
#btc70k
Over $1.4B in leveraged positions wiped out in 24 hours, mostly longs, as US spot Bitcoin ETFs log a fifth straight day of outflows.
.
.
#btc70k
55

·
--
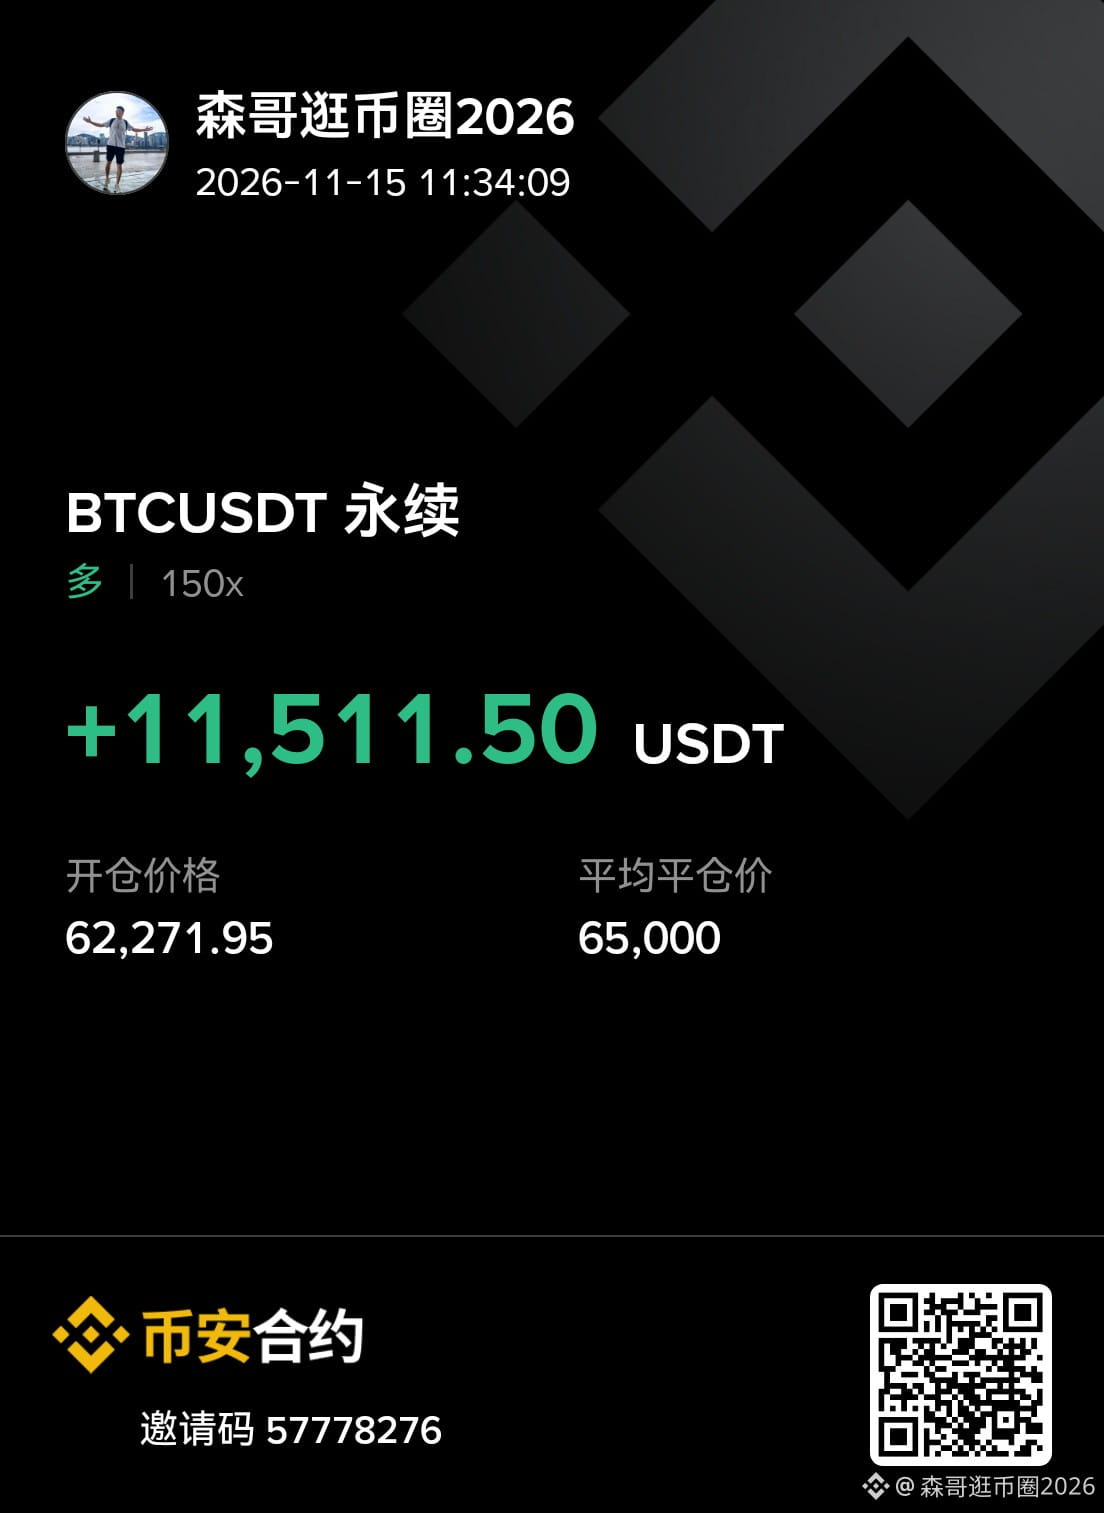
[https://www.binance.com/cn/futures/ref/57778276](https://www.binance.com/cn/futures/ref/57778276) I woke up this morning to Bitcoin at 62,200 and was stunned. I hurriedly took out my family heirloom of $10,000 and opened a long position worth over 200,000 USDT, setting take-profit at 65,000. That’s enough, that’s enough—the money for a vacation is covered. With the APEC meeting in Shenzhen, students get a 9-day autumn break, so I’m taking my three kids to Chaoshan.
It fell below 70,000, all the way to 62,000, and there still wasn’t a decent bounce. That’s impossible, so I opened another position without hesitation. Grab a wave and get out—that’s the simplest logic. #btc70k
https://www.binance.com/cn/futures/ref/57778276 I woke up this morning to Bitcoin at 62,200 and was stunned. I hurriedly took out my family heirloom of $10,000 and opened a long position worth over 200,000 USDT, setting take-profit at 65,000. That’s enough, that’s enough—the money for a vacation is covered. With the APEC meeting in Shenzhen, students get a 9-day autumn break, so I’m taking my three kids to Chaoshan.
It fell below 70,000, all the way to 62,000, and there still wasn’t a decent bounce. That’s impossible, so I opened another position without hesitation. Grab a wave and get out—that’s the simplest logic. #btc70k
It fell below 70,000, all the way to 62,000, and there still wasn’t a decent bounce. That’s impossible, so I opened another position without hesitation. Grab a wave and get out—that’s the simplest logic. #btc70k
撸网贷闯币圈:
本金少做ETH好点
3
3
1.9k

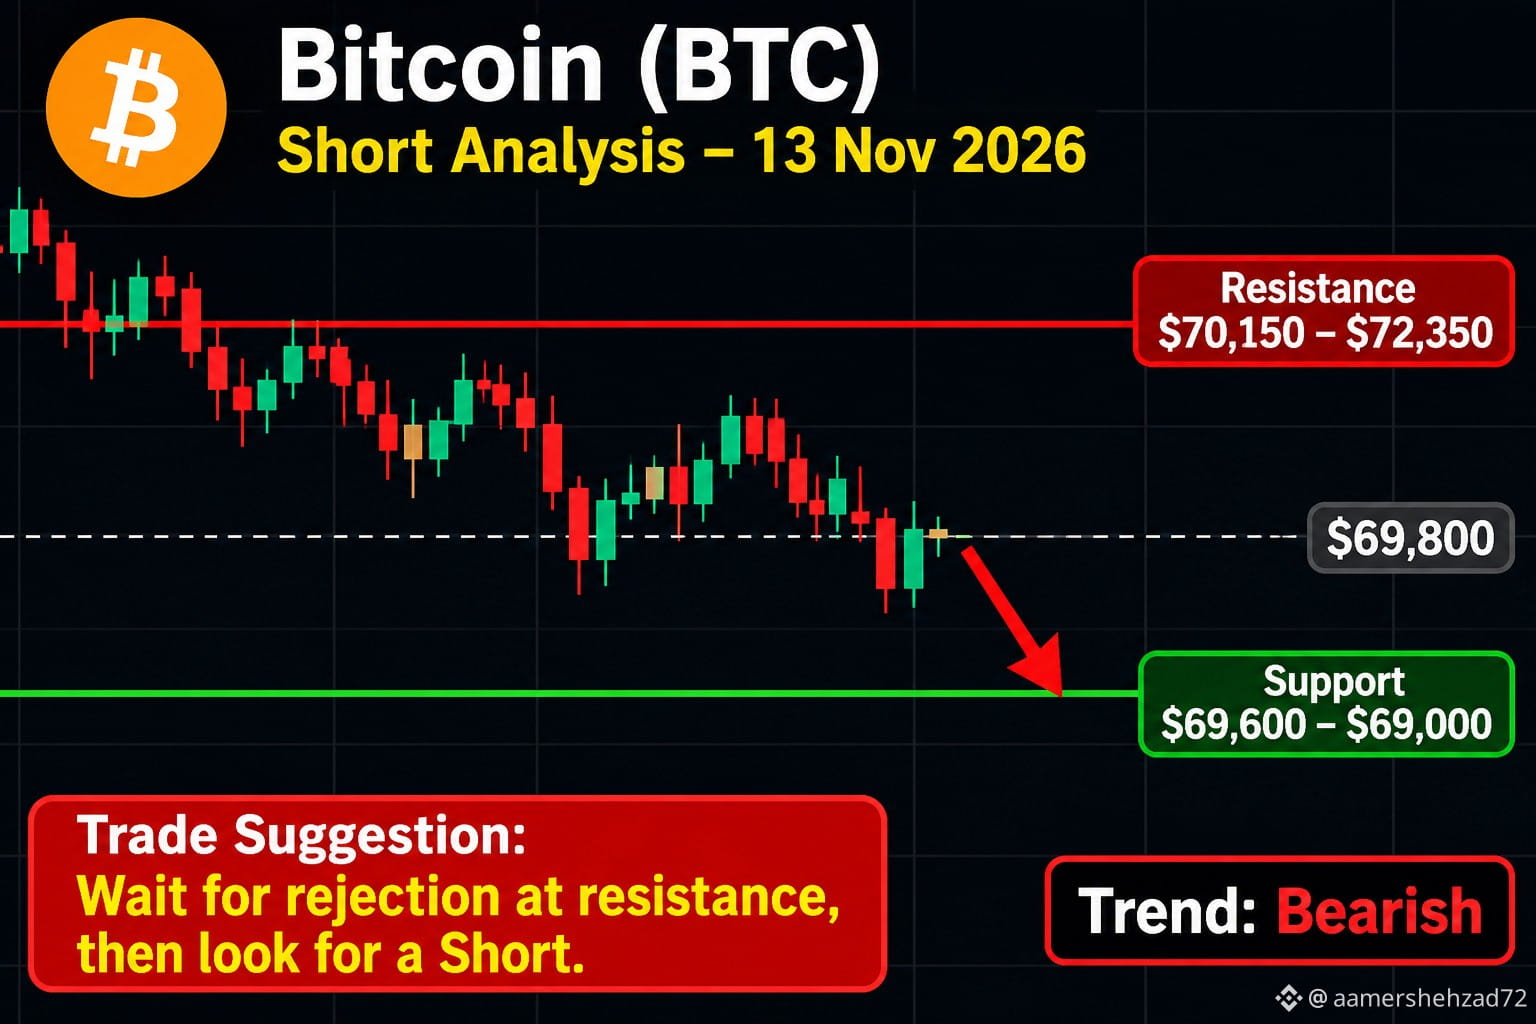
Bitcoin (BTC) Short Trading Analysis – 13 Nov 2026
🔴 Trend: BEARISH
Current Price: Around $69,100–$70,900
Resistance: $70,150 – $72,350
Support: $69,600 – $69,000
RSI: Oversold – a short-term bounce is possible.
⚠️ WAIT – Don't Enter Yet
Avoid buying immediately.
Look for a SHORT opportunity if BTC gets rejected at resistance.
Consider SHORT only after a confirmed breakdown below $69,000 and a successful retest.
Always use a Stop Loss.
#AnthropicRejectsIPODelayValuationinQuestion #btc70k #BitcoinDunyamiz #TradingCommunity
Bitcoin (BTC) Short Trading Analysis – 13 Nov 2026
🔴 Trend: BEARISH
Current Price: Around $69,100–$70,900
Resistance: $70,150 – $72,350
Support: $69,600 – $69,000
RSI: Oversold – a short-term bounce is possible.
⚠️ WAIT – Don't Enter Yet
Avoid buying immediately.
Look for a SHORT opportunity if BTC gets rejected at resistance.
Consider SHORT only after a confirmed breakdown below $69,000 and a successful retest.
Always use a Stop Loss.
#AnthropicRejectsIPODelayValuationinQuestion #btc70k #BitcoinDunyamiz #TradingCommunity
🔴 Trend: BEARISH
Current Price: Around $69,100–$70,900
Resistance: $70,150 – $72,350
Support: $69,600 – $69,000
RSI: Oversold – a short-term bounce is possible.
⚠️ WAIT – Don't Enter Yet
Avoid buying immediately.
Look for a SHORT opportunity if BTC gets rejected at resistance.
Consider SHORT only after a confirmed breakdown below $69,000 and a successful retest.
Always use a Stop Loss.
#AnthropicRejectsIPODelayValuationinQuestion #btc70k #BitcoinDunyamiz #TradingCommunity
80

·
--
Bitcoin Pullback to $69K:
Why This Is the Ultimate Altcoin Accumulation Phase
#btc70k #BTC #bullish $BTC
{spot}(BTCUSDT)
As Bitcoin retraces to the crucial $69,000 support level, market dynamics are shifting rapidly, presenting a golden window of opportunity for smart crypto traders. While a BTC dip often sparks short-term market anxiety, veteran investors recognize this cooling phase as the ultimate trigger for altcoin momentum. With capital rotating across promising projects, preparing to accumulate strong altcoins right now can yield massive upside potential before the next aggressive market breakout. Stay strategic, manage your risk wisely, and position your portfolio ahead of the upcoming alt season wave!
Bitcoin Pullback to $69K:
Why This Is the Ultimate Altcoin Accumulation Phase
#btc70k #BTC #bullish $BTC
As Bitcoin retraces to the crucial $69,000 support level, market dynamics are shifting rapidly, presenting a golden window of opportunity for smart crypto traders. While a BTC dip often sparks short-term market anxiety, veteran investors recognize this cooling phase as the ultimate trigger for altcoin momentum. With capital rotating across promising projects, preparing to accumulate strong altcoins right now can yield massive upside potential before the next aggressive market breakout. Stay strategic, manage your risk wisely, and position your portfolio ahead of the upcoming alt season wave!
Why This Is the Ultimate Altcoin Accumulation Phase
#btc70k #BTC #bullish $BTC
As Bitcoin retraces to the crucial $69,000 support level, market dynamics are shifting rapidly, presenting a golden window of opportunity for smart crypto traders. While a BTC dip often sparks short-term market anxiety, veteran investors recognize this cooling phase as the ultimate trigger for altcoin momentum. With capital rotating across promising projects, preparing to accumulate strong altcoins right now can yield massive upside potential before the next aggressive market breakout. Stay strategic, manage your risk wisely, and position your portfolio ahead of the upcoming alt season wave!

1
132

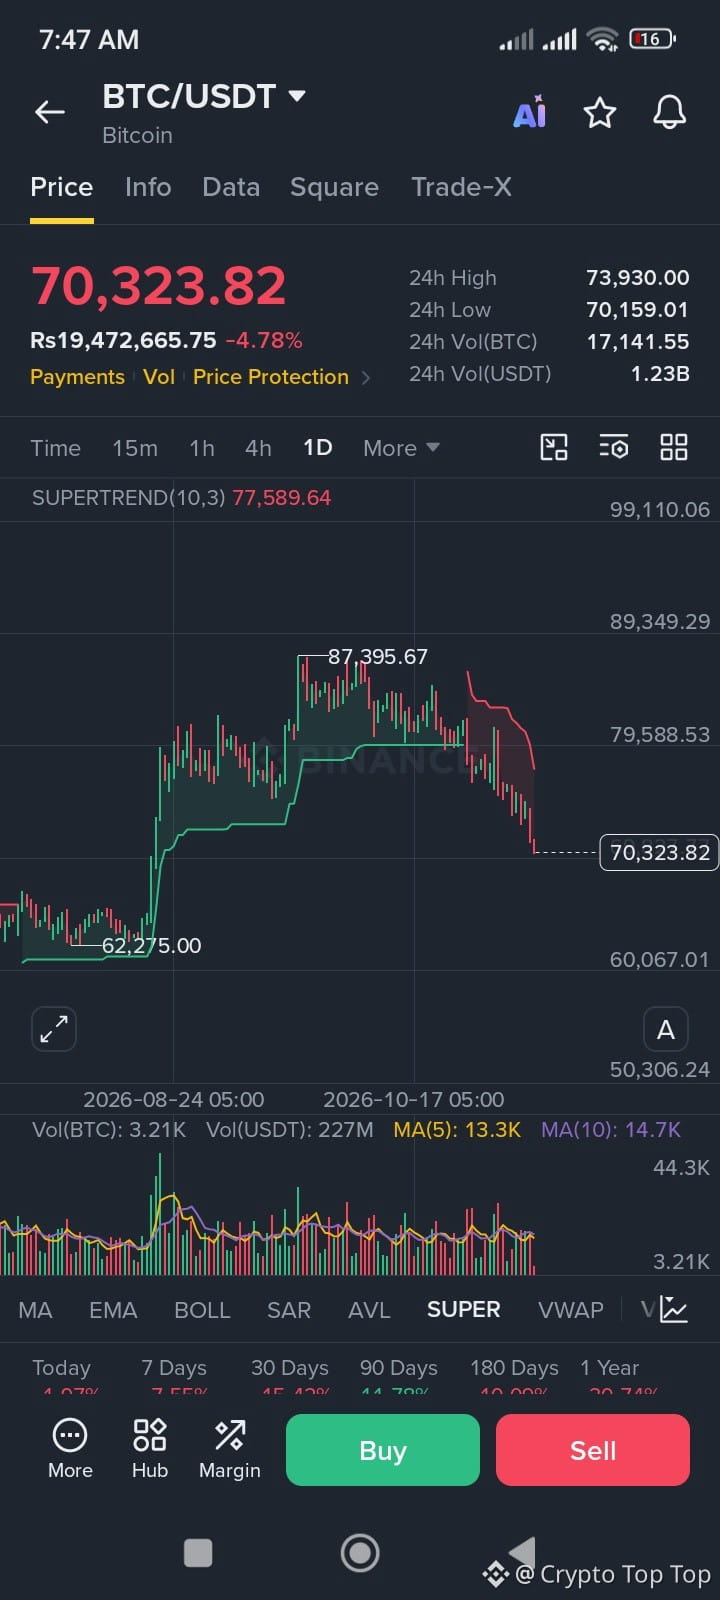
Bitcoin (\text{$BTC }) is currently trading at $70,323.82, down -4.78% on the daily timeframe as it tests crucial local support levels. Let's break down what the chart is showing us right now:
Key Market Stats:
Current Price: $70,323.82
24h High / Low: $73,930.00 / $70,159.01
24h Volume: 17,141.55 \text{ BTC} (\approx \$1.23\text{B} USDT) $ETH
Supertrend Indicator: Sitting at $77,589.64 (maintaining a bearish/resistance posture overhead).
Chart Breakdown & Technical Outlook:
Pullback from Recent Highs:
After hitting a peak structure near the $87,395.67 mark, \text{$BTC } has experienced a steady downward correction. The price action has broken below several local trend lines and is now heavily testing the $70,000 psychological support zone (hitting a 24h low of $70,159.01).
Supertrend Resistance:
The Supertrend indicator line is currently hovering around $77,589.64, indicating that the broader medium-term momentum remains under seller control until bulls can reclaim higher ground.
Volume and Volatility:
With over 1.23 Billion USDT traded in the last 24 hours, volatility is high. Buyers are attempting to defend the current region, but a failure to hold above $70,000 could invite deeper retests toward previous consolidation bases. #btc70k #CryptoTrading. #BinanceSquare #TechnicalAnalysis
Bitcoin (\text{$BTC }) is currently trading at $70,323.82, down -4.78% on the daily timeframe as it tests crucial local support levels. Let's break down what the chart is showing us right now:
Key Market Stats:
Current Price: $70,323.82
24h High / Low: $73,930.00 / $70,159.01
24h Volume: 17,141.55 \text{ BTC} (\approx \$1.23\text{B} USDT) $ETH
Supertrend Indicator: Sitting at $77,589.64 (maintaining a bearish/resistance posture overhead).
Chart Breakdown & Technical Outlook:
Pullback from Recent Highs:
After hitting a peak structure near the $87,395.67 mark, \text{$BTC } has experienced a steady downward correction. The price action has broken below several local trend lines and is now heavily testing the $70,000 psychological support zone (hitting a 24h low of $70,159.01).
Supertrend Resistance:
The Supertrend indicator line is currently hovering around $77,589.64, indicating that the broader medium-term momentum remains under seller control until bulls can reclaim higher ground.
Volume and Volatility:
With over 1.23 Billion USDT traded in the last 24 hours, volatility is high. Buyers are attempting to defend the current region, but a failure to hold above $70,000 could invite deeper retests toward previous consolidation bases. #btc70k #CryptoTrading. #BinanceSquare #TechnicalAnalysis
Key Market Stats:
Current Price: $70,323.82
24h High / Low: $73,930.00 / $70,159.01
24h Volume: 17,141.55 \text{ BTC} (\approx \$1.23\text{B} USDT) $ETH
Supertrend Indicator: Sitting at $77,589.64 (maintaining a bearish/resistance posture overhead).
Chart Breakdown & Technical Outlook:
Pullback from Recent Highs:
After hitting a peak structure near the $87,395.67 mark, \text{$BTC } has experienced a steady downward correction. The price action has broken below several local trend lines and is now heavily testing the $70,000 psychological support zone (hitting a 24h low of $70,159.01).
Supertrend Resistance:
The Supertrend indicator line is currently hovering around $77,589.64, indicating that the broader medium-term momentum remains under seller control until bulls can reclaim higher ground.
Volume and Volatility:
With over 1.23 Billion USDT traded in the last 24 hours, volatility is high. Buyers are attempting to defend the current region, but a failure to hold above $70,000 could invite deeper retests toward previous consolidation bases. #btc70k #CryptoTrading. #BinanceSquare #TechnicalAnalysis
74

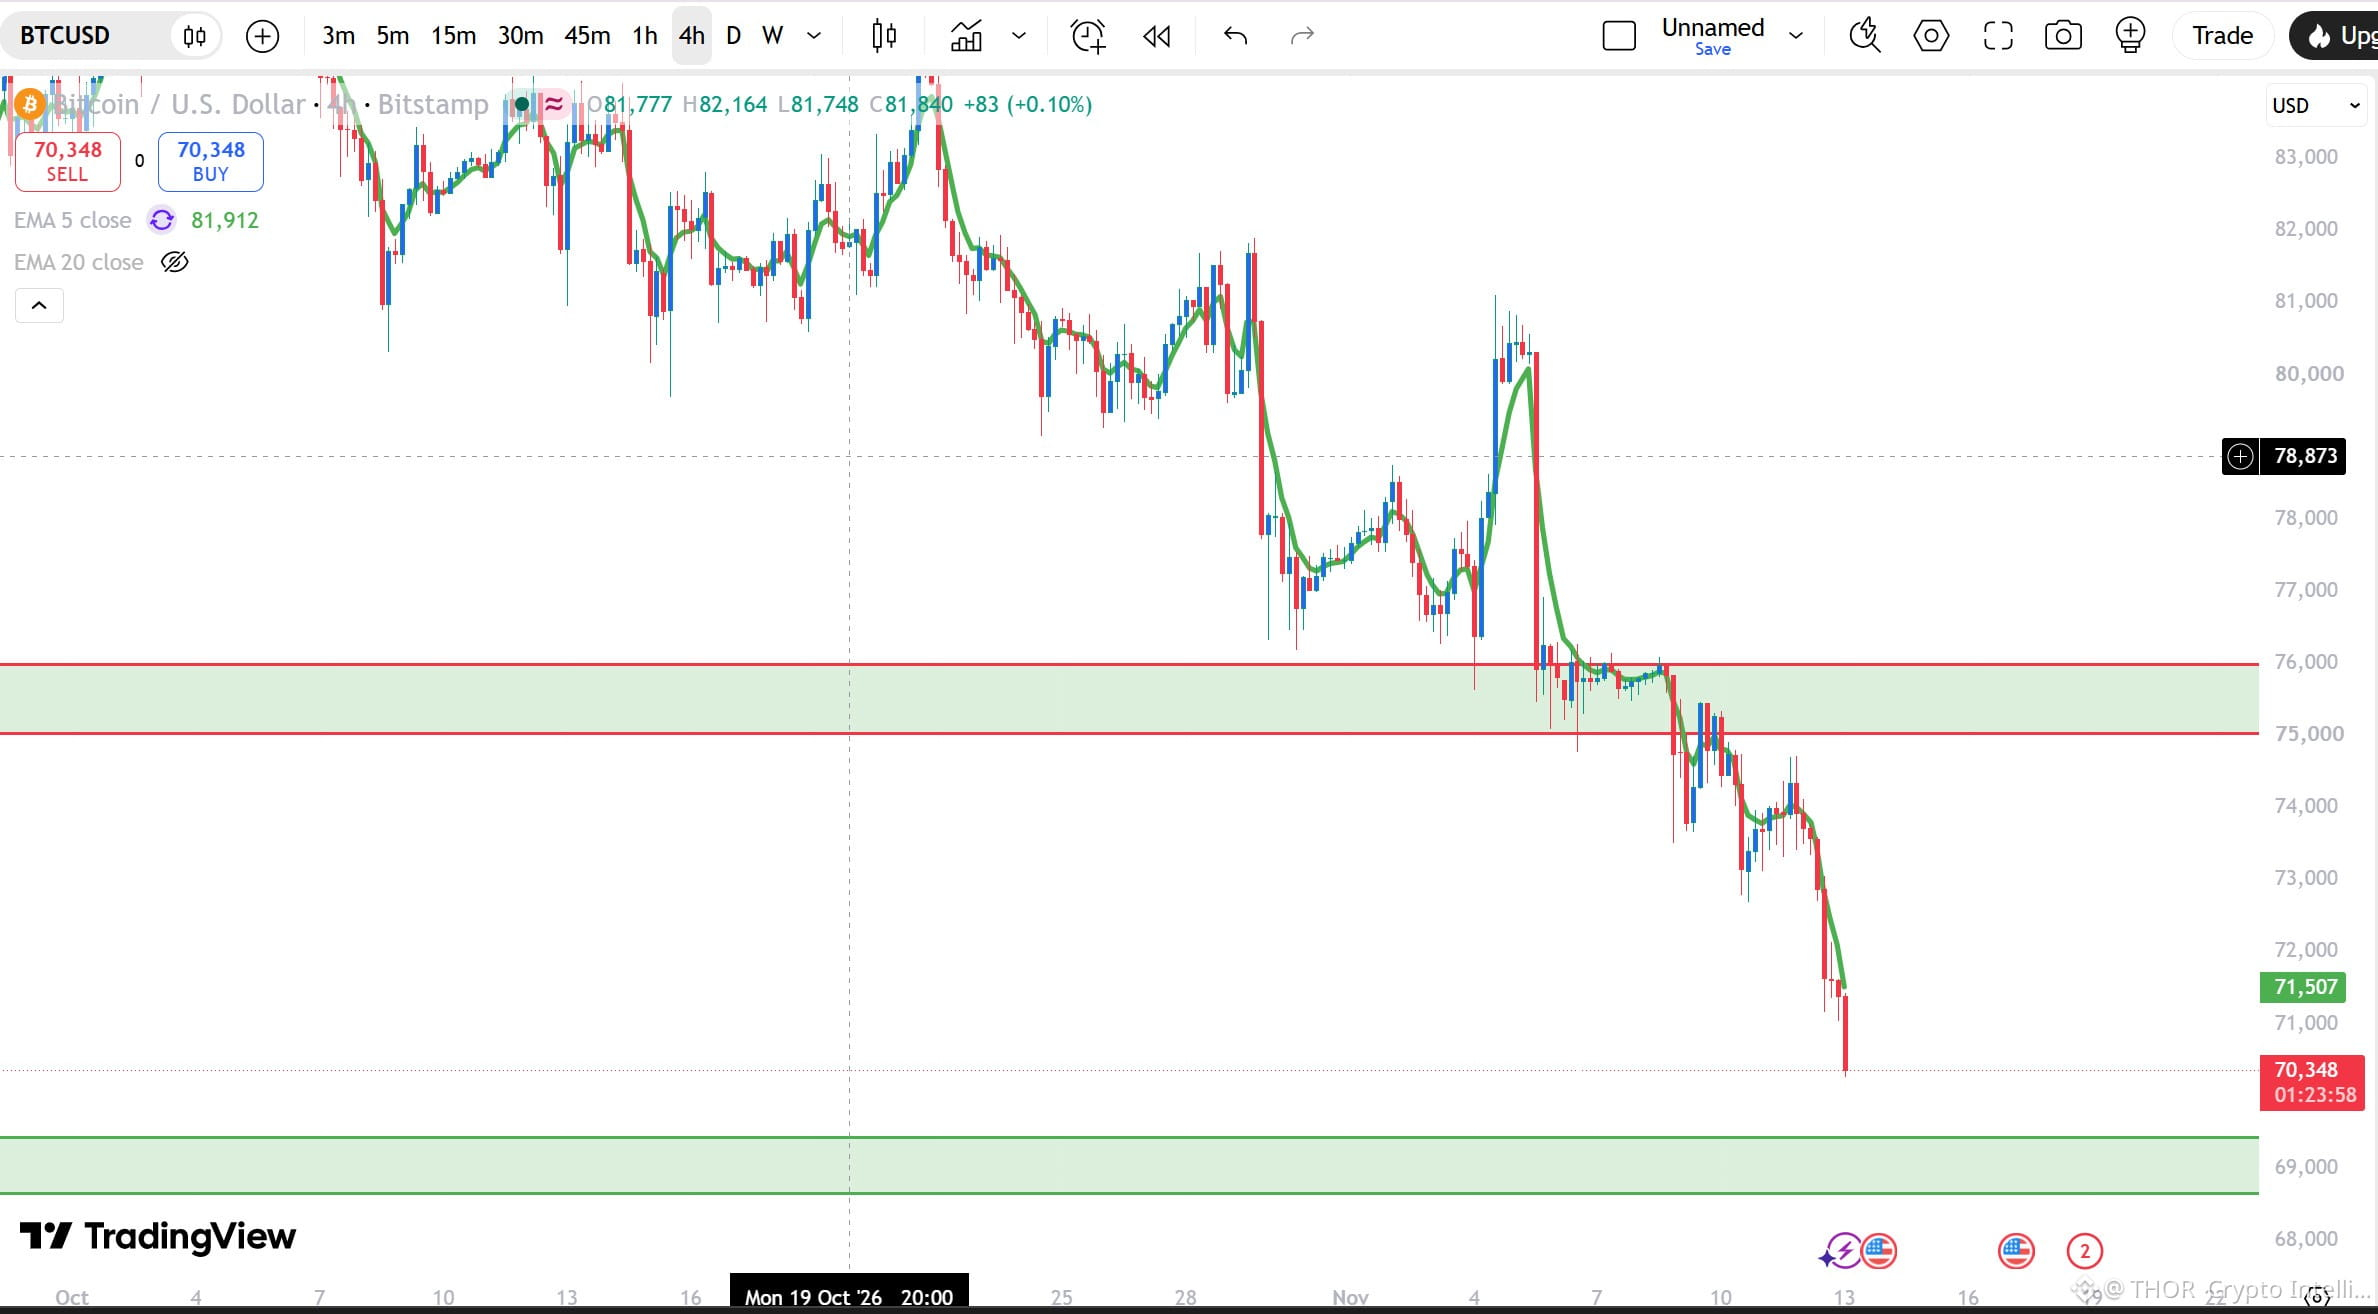
🚨 $BTC BREAKS $75K — SELLERS TAKE CONTROL!
#bitcoin has plunged to $70,348, losing the $75K–$76K support zone on the 4H chart.
⚡ THOR Levels
📍 Current: $70,348
🔴 EMA 5: $71,507
Resistance: $75K–$76K
🟢 Next support: $68.6K–$69.4K
🟢 Bull case: Reclaim $71.5K and recover momentum.
🔴 Bear case: Lose $69K → further downside risk.
⚠️ THOR Risk Alert: Strong bearish momentum. Avoid catching the falling knife.
⚡ THOR Signal: Bears remain in control until BTC reclaims broken support.
👇 What's next?
🟢 Bounce
🟡 Consolidation
🔴 Deeper correction
#AGT #Bard #PLAYUSDT #btc70k
{future}(BTCUSDT)
$BARD
{future}(BARDUSDT)
$PLAY
{future}(PLAYUSDT)
🚨 $BTC BREAKS $75K — SELLERS TAKE CONTROL!
#bitcoin has plunged to $70,348, losing the $75K–$76K support zone on the 4H chart.
⚡ THOR Levels
📍 Current: $70,348
🔴 EMA 5: $71,507
Resistance: $75K–$76K
🟢 Next support: $68.6K–$69.4K
🟢 Bull case: Reclaim $71.5K and recover momentum.
🔴 Bear case: Lose $69K → further downside risk.
⚠️ THOR Risk Alert: Strong bearish momentum. Avoid catching the falling knife.
⚡ THOR Signal: Bears remain in control until BTC reclaims broken support.
👇 What's next?
🟢 Bounce
🟡 Consolidation
🔴 Deeper correction
#AGT #Bard #PLAYUSDT #btc70k
$BARD
$PLAY
#bitcoin has plunged to $70,348, losing the $75K–$76K support zone on the 4H chart.
⚡ THOR Levels
📍 Current: $70,348
🔴 EMA 5: $71,507
Resistance: $75K–$76K
🟢 Next support: $68.6K–$69.4K
🟢 Bull case: Reclaim $71.5K and recover momentum.
🔴 Bear case: Lose $69K → further downside risk.
⚠️ THOR Risk Alert: Strong bearish momentum. Avoid catching the falling knife.
⚡ THOR Signal: Bears remain in control until BTC reclaims broken support.
👇 What's next?
🟢 Bounce
🟡 Consolidation
🔴 Deeper correction
#AGT #Bard #PLAYUSDT #btc70k
$BARD
$PLAY
341
Log in to explore more content
Join global crypto users on Binance Square
⚡️ Get latest and useful information about crypto.
💬 Trusted by the world’s largest crypto exchange.
👍 Discover real insights from verified creators.
Email / Phone number
Related Coins
Trending Topics
1
#CryptoSelloffTriggersMultipleWhaleLiquidations
231,108 views
2,016 Discussing
2
#HuangReportedlyConsidersReturnToNvidia
276 views
31 Discussing
3
#About64000BitcoinMiningMachinesReportedlyHijacked
0 views
12 Discussing
4
#USSpotXRPETFsSeeLargestWeeklyOutflowIn8Months
193,028 views
1,673 Discussing
5
#WillFOMCMinutesReinforceRateHikeExpectations?
67,293 views
838 Discussing
6
#BitcoinActiveSupplyInProfitDropsBelow45%
269,695 views
1,920 Discussing
7
#TONStrategyReports$23.97MQ3NetLoss
23,118 views
160 Discussing
8
#KavaSaysAbnormalActivityLimitedToKavaLend
178,124 views
1,099 Discussing
9
#WORPTLetsTouristsConvertCryptoToThaiBaht
70,617 views
462 Discussing
10
#WhoWillSucceedJensenHuangatNvidia?
395,344 views
2,227 Discussing