
#act
act
11.3M views
12,101 Discussing
Hot
Latest

·
--
🚨 $act: whales are cooking something big!
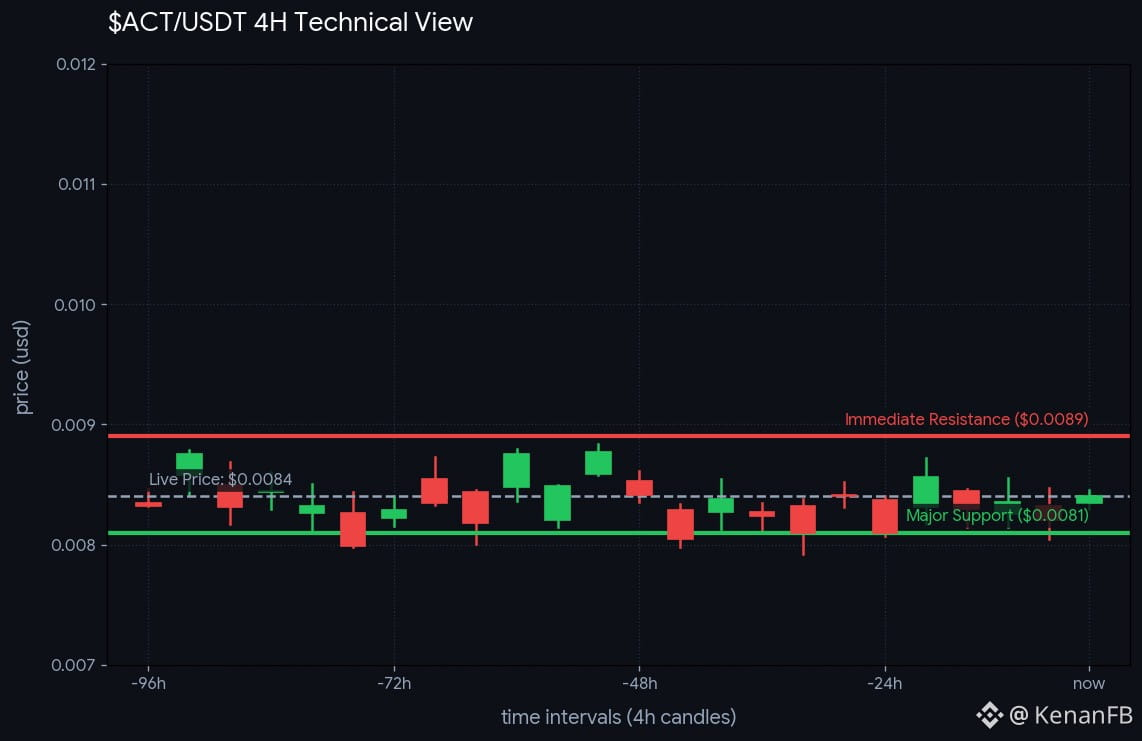
chart update on $act. this machine economy play is building massive steam behind the scenes. retail is completely blind to what the big players are setting up inside the accumulation zone.
price action looks clean as hell on the 4h timeframe. we just witnessed a brutal sweep of the weak hands, flushing out panic sellers right into the primary support line at $0.0081. now the order book is getting heavy on the buy side, showing massive absorption by high-net-worth desks. standard whale play before a massive vertical expansion.
current live market print is floating around $0.0084. the immediate mission for the bulls is clear: reclaim and flip the local resistance level at $0.0089 into solid ground. if the buying volume keeps accelerating at this pace, the next stop is an absolute blast straight to $0.0092. if you are looking to position for the potential breakout, the accumulation zone down to $0.0080 remains defense line number one.
if you're betting on this bounce, you can check the trading pair below to position yourself. do not chase the green candles later when the fomo kicks in. pack your bags early or get left behind.
are you buying this move or waiting for lower numbers? let me know below! 👇
$ACT
{future}(ACTUSDT)
no complex bs, just raw price action. if you're banking on this setup, showing love via the tip button keeps the next signals coming.
#act #aicrypto #memecoins #BinanceSquare
*disclaimer: market commentary based on current live data. not financial advice. always dyor.*
🚨 $act: whales are cooking something big!
chart update on $act. this machine economy play is building massive steam behind the scenes. retail is completely blind to what the big players are setting up inside the accumulation zone.
price action looks clean as hell on the 4h timeframe. we just witnessed a brutal sweep of the weak hands, flushing out panic sellers right into the primary support line at $0.0081. now the order book is getting heavy on the buy side, showing massive absorption by high-net-worth desks. standard whale play before a massive vertical expansion.
current live market print is floating around $0.0084. the immediate mission for the bulls is clear: reclaim and flip the local resistance level at $0.0089 into solid ground. if the buying volume keeps accelerating at this pace, the next stop is an absolute blast straight to $0.0092. if you are looking to position for the potential breakout, the accumulation zone down to $0.0080 remains defense line number one.
if you're betting on this bounce, you can check the trading pair below to position yourself. do not chase the green candles later when the fomo kicks in. pack your bags early or get left behind.
are you buying this move or waiting for lower numbers? let me know below! 👇
$ACT
no complex bs, just raw price action. if you're banking on this setup, showing love via the tip button keeps the next signals coming.
#act #aicrypto #memecoins #BinanceSquare
*disclaimer: market commentary based on current live data. not financial advice. always dyor.*
chart update on $act. this machine economy play is building massive steam behind the scenes. retail is completely blind to what the big players are setting up inside the accumulation zone.
price action looks clean as hell on the 4h timeframe. we just witnessed a brutal sweep of the weak hands, flushing out panic sellers right into the primary support line at $0.0081. now the order book is getting heavy on the buy side, showing massive absorption by high-net-worth desks. standard whale play before a massive vertical expansion.
current live market print is floating around $0.0084. the immediate mission for the bulls is clear: reclaim and flip the local resistance level at $0.0089 into solid ground. if the buying volume keeps accelerating at this pace, the next stop is an absolute blast straight to $0.0092. if you are looking to position for the potential breakout, the accumulation zone down to $0.0080 remains defense line number one.
if you're betting on this bounce, you can check the trading pair below to position yourself. do not chase the green candles later when the fomo kicks in. pack your bags early or get left behind.
are you buying this move or waiting for lower numbers? let me know below! 👇
$ACT
no complex bs, just raw price action. if you're banking on this setup, showing love via the tip button keeps the next signals coming.
#act #aicrypto #memecoins #BinanceSquare
*disclaimer: market commentary based on current live data. not financial advice. always dyor.*
387

·
--
Bullish
📊 Let’s LONG #ACT
💥 Leverage: Cross 20× $ACT
{future}(ACTUSDT)
✔️ Take Entries: 0.0116 - 0.01102
📈 Profit TARGET:
1) 0.01190
2) 0.01230
3) 0.01290
🔖 Stop Loss: 0.01090
📊 Let’s LONG #ACT
💥 Leverage: Cross 20× $ACT
✔️ Take Entries: 0.0116 - 0.01102
📈 Profit TARGET:
1) 0.01190
2) 0.01230
3) 0.01290
🔖 Stop Loss: 0.01090
💥 Leverage: Cross 20× $ACT
✔️ Take Entries: 0.0116 - 0.01102
📈 Profit TARGET:
1) 0.01190
2) 0.01230
3) 0.01290
🔖 Stop Loss: 0.01090
1
29

·
--
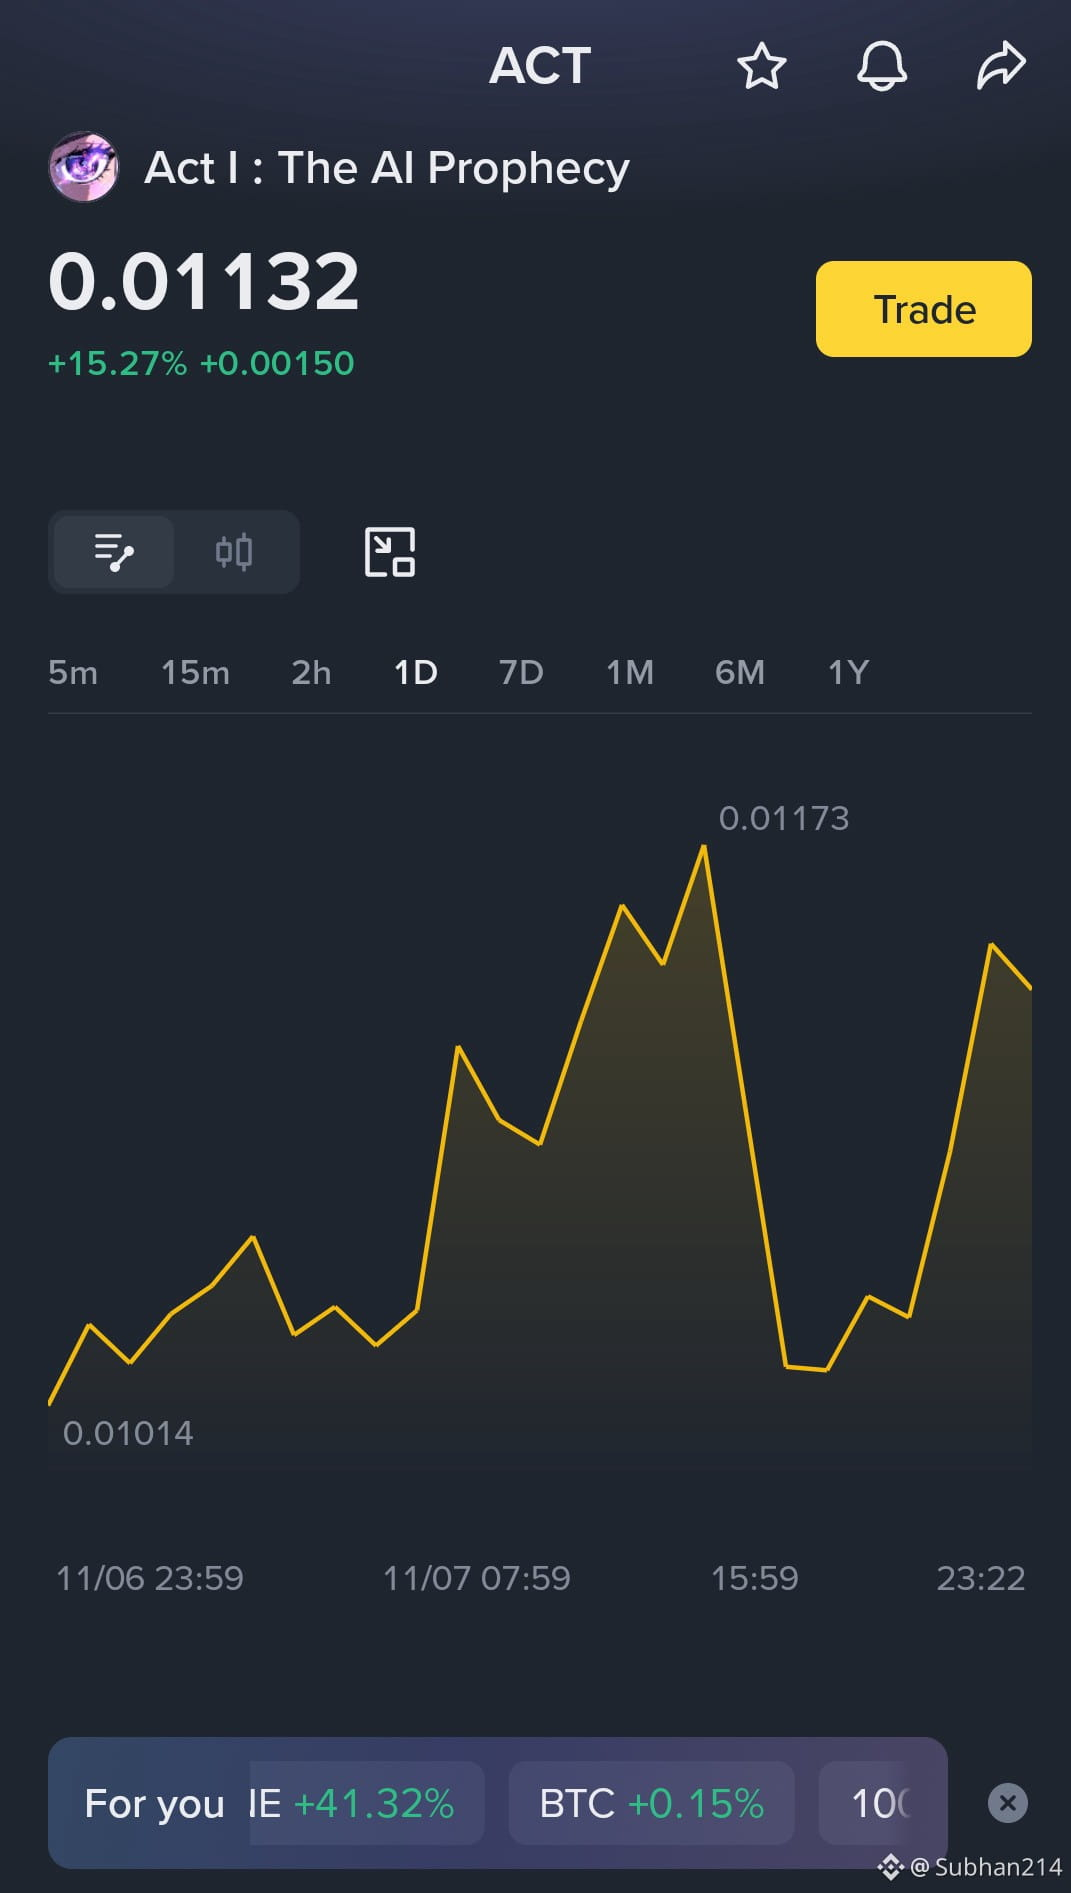
🚀 $ACT (Act I: The AI Prophecy) is pumping: +15.27%! 🚀
ACT is showing strong momentum on Binance today.
💰 Price: $0.01132
📈 24h change: +15.27%
🔺 24h High: 0.01173
🔻 24h Low: 0.01014
The chart bounced hard from the dip and is climbing again. The AI narrative is getting attention, but volatility is high, so wait for confirmation and manage your risk.
Do you think $ACT can break its 24h high of 0.01173? 👇
#ACT #AIProphecy #BinanceSquare #TopGainersNow
🚀 $ACT (Act I: The AI Prophecy) is pumping: +15.27%! 🚀
ACT is showing strong momentum on Binance today.
💰 Price: $0.01132
📈 24h change: +15.27%
🔺 24h High: 0.01173
🔻 24h Low: 0.01014
The chart bounced hard from the dip and is climbing again. The AI narrative is getting attention, but volatility is high, so wait for confirmation and manage your risk.
Do you think $ACT can break its 24h high of 0.01173? 👇
#ACT #AIProphecy #BinanceSquare #TopGainersNow
ACT is showing strong momentum on Binance today.
💰 Price: $0.01132
📈 24h change: +15.27%
🔺 24h High: 0.01173
🔻 24h Low: 0.01014
The chart bounced hard from the dip and is climbing again. The AI narrative is getting attention, but volatility is high, so wait for confirmation and manage your risk.
Do you think $ACT can break its 24h high of 0.01173? 👇
#ACT #AIProphecy #BinanceSquare #TopGainersNow
133

·
--
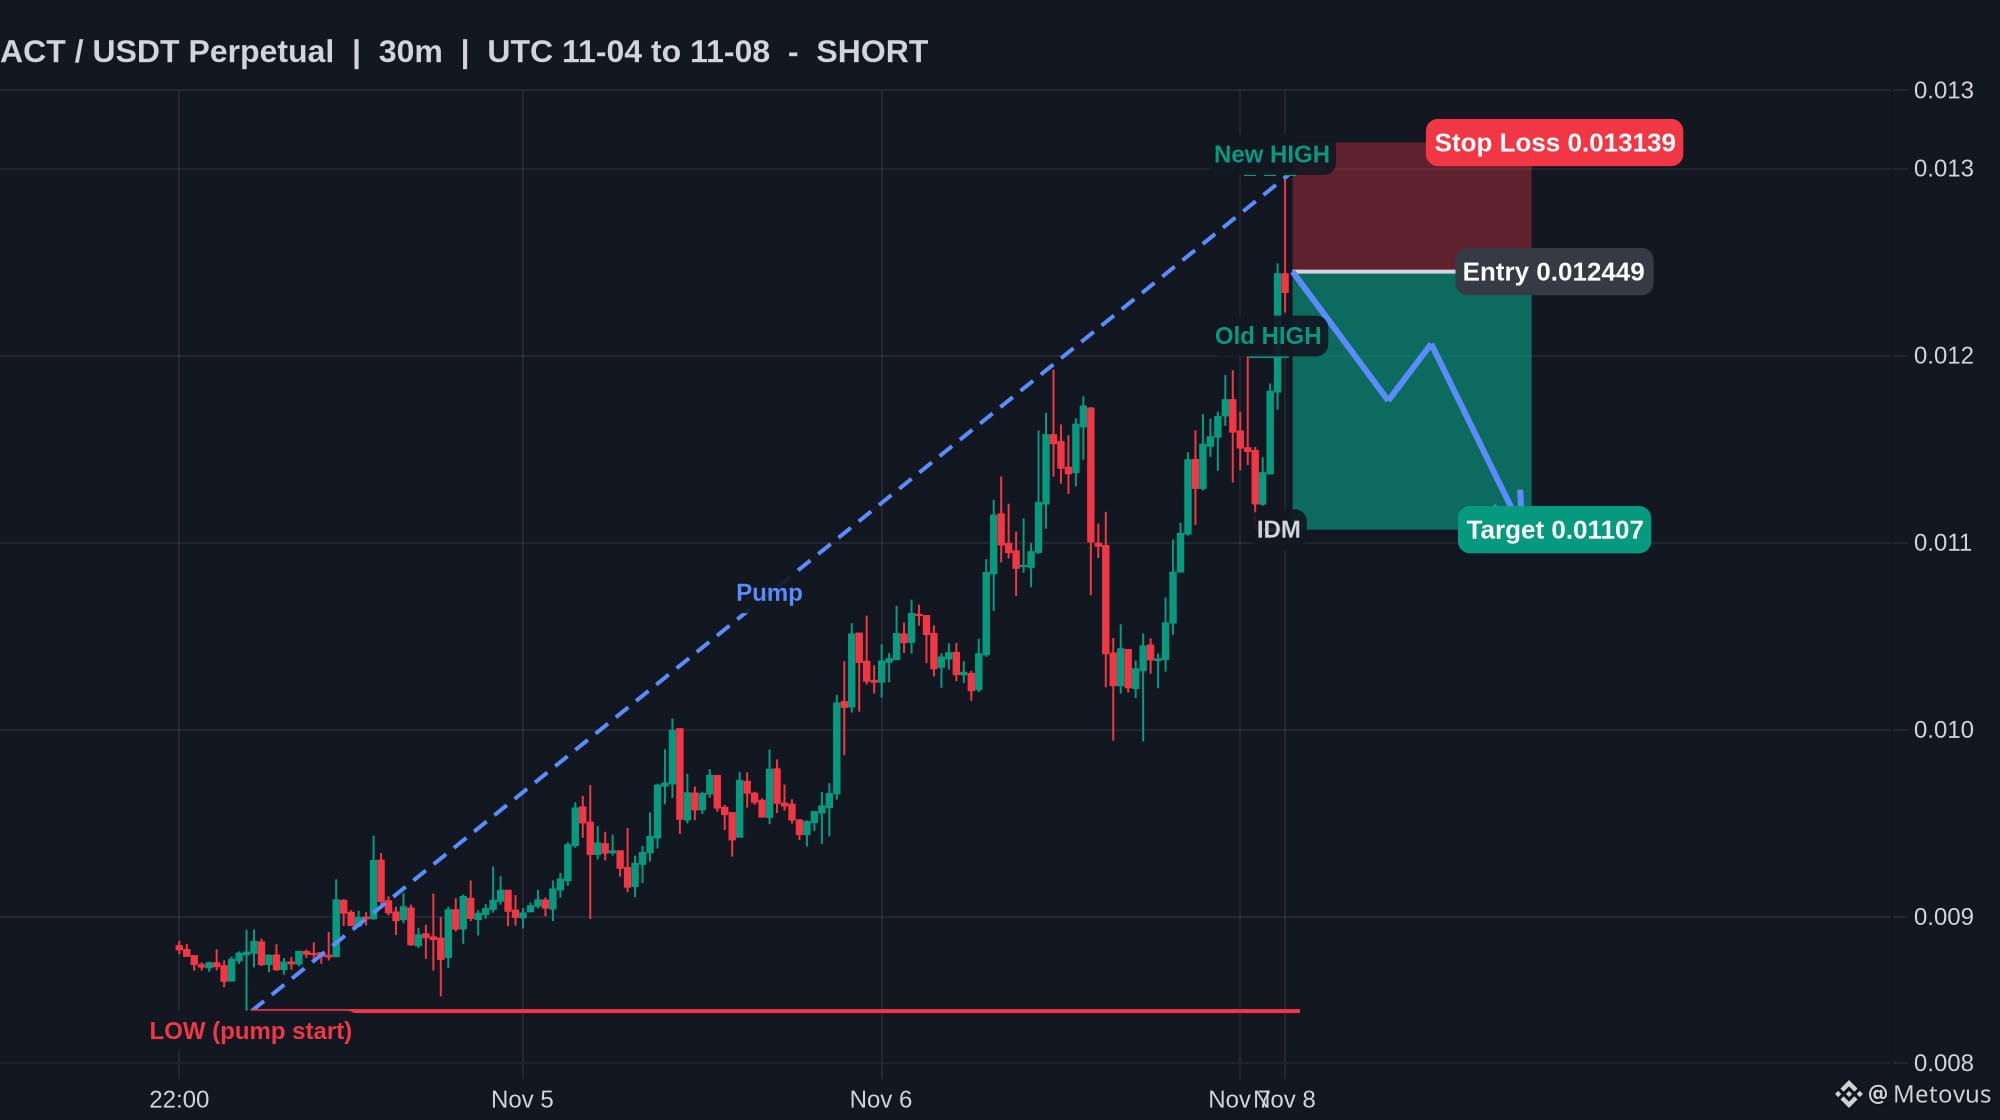
$ACT is up 17% and showing rejection at the highs. Here's why 👇
Pumps like this 53% leg in 3 days always bring in late buyers right where risk is highest.
Look at what happened around 0.011998: ACT got through by just 8.1%, tagged 0.012968 and fell back. Everyone who bought that breakout is sitting on a loss now.
Next stop for me is 0.01107. Nobody's touched it since $ACT the pullback (27% of the leg), so it's the obvious magnet. A move above 0.012968 proves me wrong.
📌 My ACT trade: short from 0.012449, stop at 0.013139, target 0.01107 (+11.1%, 1:2)
📊 24h Vol: $55.0M | 24h Chg: +16.9% | Funding: +0.0027%
Would you take this trade or sit it out? 👇
Follow for daily chart breakdowns 🔔
Not financial advice. Manage your risk.
#ACT #Crypto #Trading
$ACT is up 17% and showing rejection at the highs. Here's why 👇
Pumps like this 53% leg in 3 days always bring in late buyers right where risk is highest.
Look at what happened around 0.011998: ACT got through by just 8.1%, tagged 0.012968 and fell back. Everyone who bought that breakout is sitting on a loss now.
Next stop for me is 0.01107. Nobody's touched it since $ACT the pullback (27% of the leg), so it's the obvious magnet. A move above 0.012968 proves me wrong.
📌 My ACT trade: short from 0.012449, stop at 0.013139, target 0.01107 (+11.1%, 1:2)
📊 24h Vol: $55.0M | 24h Chg: +16.9% | Funding: +0.0027%
Would you take this trade or sit it out? 👇
Follow for daily chart breakdowns 🔔
Not financial advice. Manage your risk.
#ACT #Crypto #Trading
Pumps like this 53% leg in 3 days always bring in late buyers right where risk is highest.
Look at what happened around 0.011998: ACT got through by just 8.1%, tagged 0.012968 and fell back. Everyone who bought that breakout is sitting on a loss now.
Next stop for me is 0.01107. Nobody's touched it since $ACT the pullback (27% of the leg), so it's the obvious magnet. A move above 0.012968 proves me wrong.
📌 My ACT trade: short from 0.012449, stop at 0.013139, target 0.01107 (+11.1%, 1:2)
📊 24h Vol: $55.0M | 24h Chg: +16.9% | Funding: +0.0027%
Would you take this trade or sit it out? 👇
Follow for daily chart breakdowns 🔔
Not financial advice. Manage your risk.
#ACT #Crypto #Trading
1

·
--
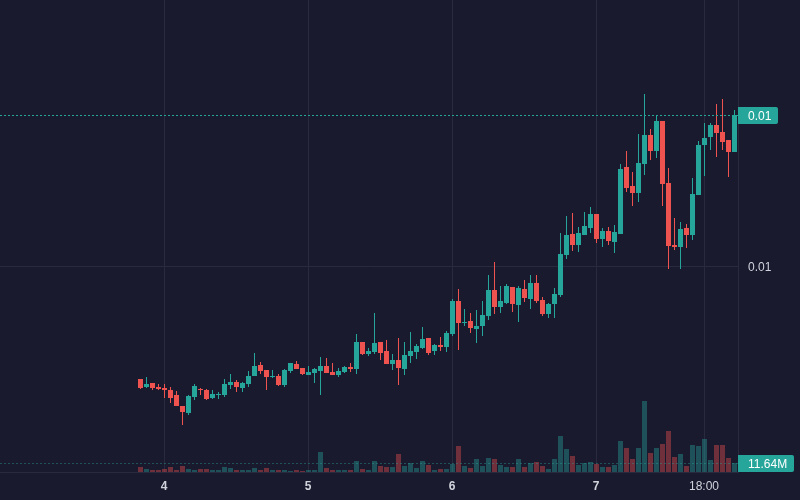
$ACT ACT is showing bullish movement: 11.20% (Crypto).
Volume: 7.64M | Last: $0.011820
Key signals: strong momentum, high volatility, high trader activity.
Bias Daily: BULLISH 🟢 | Weekly: BULLISH 🟢
ACT gained 7.2% over 24 hours driven by AI sector sentiment, though stalling momentum signals near-term consolidation.
**Macro AI sentiment (High)**: Broader political backing for artificial intelligence initiatives spearheaded by U.S. President Donald Trump lifted AI-themed meme tokens → ACT speculative demand accelerated.
- **Breakout volume spikes (Medium)**: Hourly spot volumes surged to $4.01M alongside +$312K net capital inflows → pushed prices above key moving averages toward $0.0117.
- **Trend continuation (Low)**: Short-term EMA 7 crossed above EMA 25, sustaining prices above the EMA 99 baseline.
#ACT #JobsReportRaisesHikeOdds #XRP #BinanceSquare #Crypto
$ACT ACT is showing bullish movement: 11.20% (Crypto).
Volume: 7.64M | Last: $0.011820
Key signals: strong momentum, high volatility, high trader activity.
Bias Daily: BULLISH 🟢 | Weekly: BULLISH 🟢
ACT gained 7.2% over 24 hours driven by AI sector sentiment, though stalling momentum signals near-term consolidation.
**Macro AI sentiment (High)**: Broader political backing for artificial intelligence initiatives spearheaded by U.S. President Donald Trump lifted AI-themed meme tokens → ACT speculative demand accelerated.
- **Breakout volume spikes (Medium)**: Hourly spot volumes surged to $4.01M alongside +$312K net capital inflows → pushed prices above key moving averages toward $0.0117.
- **Trend continuation (Low)**: Short-term EMA 7 crossed above EMA 25, sustaining prices above the EMA 99 baseline.
#ACT #JobsReportRaisesHikeOdds #XRP #BinanceSquare #Crypto
Volume: 7.64M | Last: $0.011820
Key signals: strong momentum, high volatility, high trader activity.
Bias Daily: BULLISH 🟢 | Weekly: BULLISH 🟢
ACT gained 7.2% over 24 hours driven by AI sector sentiment, though stalling momentum signals near-term consolidation.
**Macro AI sentiment (High)**: Broader political backing for artificial intelligence initiatives spearheaded by U.S. President Donald Trump lifted AI-themed meme tokens → ACT speculative demand accelerated.
- **Breakout volume spikes (Medium)**: Hourly spot volumes surged to $4.01M alongside +$312K net capital inflows → pushed prices above key moving averages toward $0.0117.
- **Trend continuation (Low)**: Short-term EMA 7 crossed above EMA 25, sustaining prices above the EMA 99 baseline.
#ACT #JobsReportRaisesHikeOdds #XRP #BinanceSquare #Crypto
10

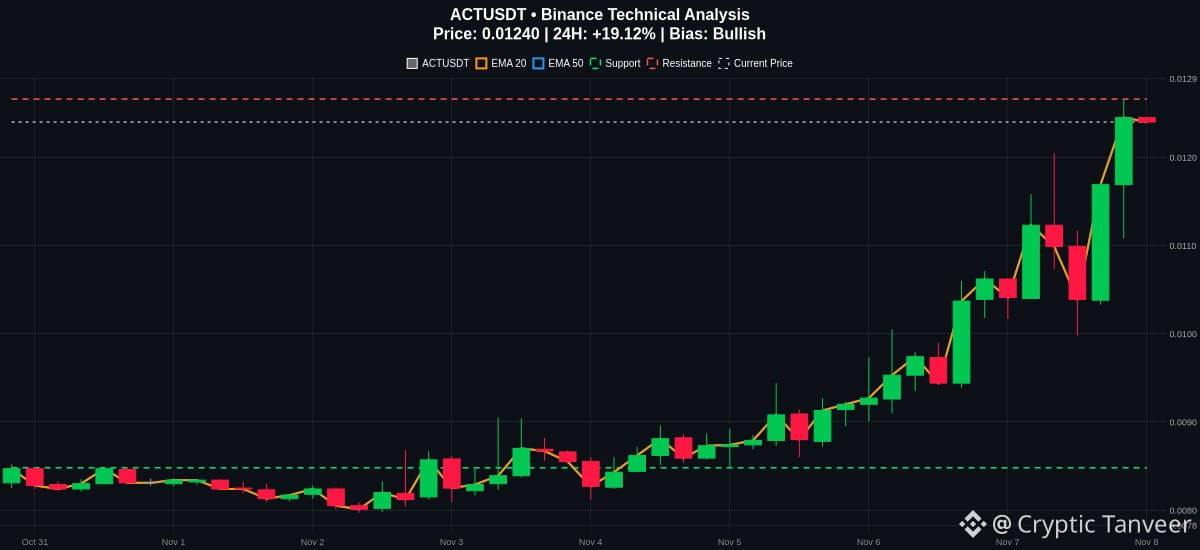
When a chart prints a 19 percent daily surge alongside a clean trend alignment, it demands a close look.
$ACT is currently trading at 0.0124, displaying strong momentum backed by a solidly bullish EMA structure. The EMA20 sits at 0.0103 while the EMA50 rests lower at 0.0094, showing clear separation that favors the current upside drive.
On the momentum side, the MACD shows positive expansion with the MACD line above the signal line. However, the RSI is currently registering at 74.47. While this indicates elevated conditions, it is not an automatic sell signal, though traders should remain aware of potential overextension risks if price stretches too far from the EMA20.
Immediate resistance is marked at 0.01266, while support rests down at 0.00848. If a pullback occurs, holding above the EMA layers will be key to sustaining the structure.
Invalidation of this bullish setup would come if price drops and breaks below the 0.00848 support level. Manage your risk carefully.
Are you looking for a retest of the moving averages or expecting a direct test of resistance?
#ACT #CryptoAnalysis #TechnicalAnalysis
Follow me for more update 📈
When a chart prints a 19 percent daily surge alongside a clean trend alignment, it demands a close look.
$ACT is currently trading at 0.0124, displaying strong momentum backed by a solidly bullish EMA structure. The EMA20 sits at 0.0103 while the EMA50 rests lower at 0.0094, showing clear separation that favors the current upside drive.
On the momentum side, the MACD shows positive expansion with the MACD line above the signal line. However, the RSI is currently registering at 74.47. While this indicates elevated conditions, it is not an automatic sell signal, though traders should remain aware of potential overextension risks if price stretches too far from the EMA20.
Immediate resistance is marked at 0.01266, while support rests down at 0.00848. If a pullback occurs, holding above the EMA layers will be key to sustaining the structure.
Invalidation of this bullish setup would come if price drops and breaks below the 0.00848 support level. Manage your risk carefully.
Are you looking for a retest of the moving averages or expecting a direct test of resistance?
#ACT #CryptoAnalysis #TechnicalAnalysis
Follow me for more update 📈
$ACT is currently trading at 0.0124, displaying strong momentum backed by a solidly bullish EMA structure. The EMA20 sits at 0.0103 while the EMA50 rests lower at 0.0094, showing clear separation that favors the current upside drive.
On the momentum side, the MACD shows positive expansion with the MACD line above the signal line. However, the RSI is currently registering at 74.47. While this indicates elevated conditions, it is not an automatic sell signal, though traders should remain aware of potential overextension risks if price stretches too far from the EMA20.
Immediate resistance is marked at 0.01266, while support rests down at 0.00848. If a pullback occurs, holding above the EMA layers will be key to sustaining the structure.
Invalidation of this bullish setup would come if price drops and breaks below the 0.00848 support level. Manage your risk carefully.
Are you looking for a retest of the moving averages or expecting a direct test of resistance?
#ACT #CryptoAnalysis #TechnicalAnalysis
Follow me for more update 📈
155

·
--
$ACT looks ready to go up from here
Volume is 5.5 times higher so big buyers are active
RSI is 60 so it is strong but not overheated
Up 10.6 percent today and still holding strong
🎯 Buy $ACT 0.01116 to 0.01157
Stop loss 0.01011
Targets 0.01356 / 0.01494 / 0.01701
Sitting inside the zone as I type this
Tap $ACT to buy
#ACT #TradingSignals
$ACT looks ready to go up from here
Volume is 5.5 times higher so big buyers are active
RSI is 60 so it is strong but not overheated
Up 10.6 percent today and still holding strong
🎯 Buy $ACT 0.01116 to 0.01157
Stop loss 0.01011
Targets 0.01356 / 0.01494 / 0.01701
Sitting inside the zone as I type this
Tap $ACT to buy
#ACT #TradingSignals
Volume is 5.5 times higher so big buyers are active
RSI is 60 so it is strong but not overheated
Up 10.6 percent today and still holding strong
🎯 Buy $ACT 0.01116 to 0.01157
Stop loss 0.01011
Targets 0.01356 / 0.01494 / 0.01701
Sitting inside the zone as I type this
Tap $ACT to buy
#ACT #TradingSignals
4

·
--
$ACT +11.80% | $牛来 +8.35% | $HFT +6.28%
#ACT rose to $0.0116, up +11.80% on $7.2 M of volume. The jump suggests buying interest is outpacing recent sell pressure.
#牛来 climbed to $0.0588, gaining +8.35% with $2.9 M traded. Its modest volume still supports the upward move.
#HFT ticked up to $0.00711000, +6.28% on $2.3 M volume. The steady flow hints at a gradual accumulation phase.
📊 Watching whether ACT’s higher volume can sustain its momentum may reveal the next short‑term leader.
#Write2Earn #Binance
$ACT +11.80% | $牛来 +8.35% | $HFT +6.28%
#ACT rose to $0.0116, up +11.80% on $7.2 M of volume. The jump suggests buying interest is outpacing recent sell pressure.
#牛来 climbed to $0.0588, gaining +8.35% with $2.9 M traded. Its modest volume still supports the upward move.
#HFT ticked up to $0.00711000, +6.28% on $2.3 M volume. The steady flow hints at a gradual accumulation phase.
📊 Watching whether ACT’s higher volume can sustain its momentum may reveal the next short‑term leader.
#Write2Earn #Binance
#ACT rose to $0.0116, up +11.80% on $7.2 M of volume. The jump suggests buying interest is outpacing recent sell pressure.
#牛来 climbed to $0.0588, gaining +8.35% with $2.9 M traded. Its modest volume still supports the upward move.
#HFT ticked up to $0.00711000, +6.28% on $2.3 M volume. The steady flow hints at a gradual accumulation phase.
📊 Watching whether ACT’s higher volume can sustain its momentum may reveal the next short‑term leader.
#Write2Earn #Binance
6

·
--
$ACT +10.89% | $牛来 +8.58% | $HFT +6.28%
#ACT is trading at $0.0115, up +10.89% with $7.2 M of volume, suggesting fresh buying pressure on the token.
$#牛来 sits at $0.0587, gaining +8.58% on $2.9 M of trade activity, a modest lift that may reflect renewed interest from its niche community.
#HFT moves to $0.00711000, up +6.28% with $2.3 M changing hands, indicating steady momentum despite its lower liquidity.
👀 Watch the relative volume gaps: ACT’s $7.2 M dwarfs the others, so any shift in that flow could quickly reshape the short‑term leaderboard.
#Write2Earn #Binance
$ACT +10.89% | $牛来 +8.58% | $HFT +6.28%
#ACT is trading at $0.0115, up +10.89% with $7.2 M of volume, suggesting fresh buying pressure on the token.
$#牛来 sits at $0.0587, gaining +8.58% on $2.9 M of trade activity, a modest lift that may reflect renewed interest from its niche community.
#HFT moves to $0.00711000, up +6.28% with $2.3 M changing hands, indicating steady momentum despite its lower liquidity.
👀 Watch the relative volume gaps: ACT’s $7.2 M dwarfs the others, so any shift in that flow could quickly reshape the short‑term leaderboard.
#Write2Earn #Binance
#ACT is trading at $0.0115, up +10.89% with $7.2 M of volume, suggesting fresh buying pressure on the token.
$#牛来 sits at $0.0587, gaining +8.58% on $2.9 M of trade activity, a modest lift that may reflect renewed interest from its niche community.
#HFT moves to $0.00711000, up +6.28% with $2.3 M changing hands, indicating steady momentum despite its lower liquidity.
👀 Watch the relative volume gaps: ACT’s $7.2 M dwarfs the others, so any shift in that flow could quickly reshape the short‑term leaderboard.
#Write2Earn #Binance
11

·
--
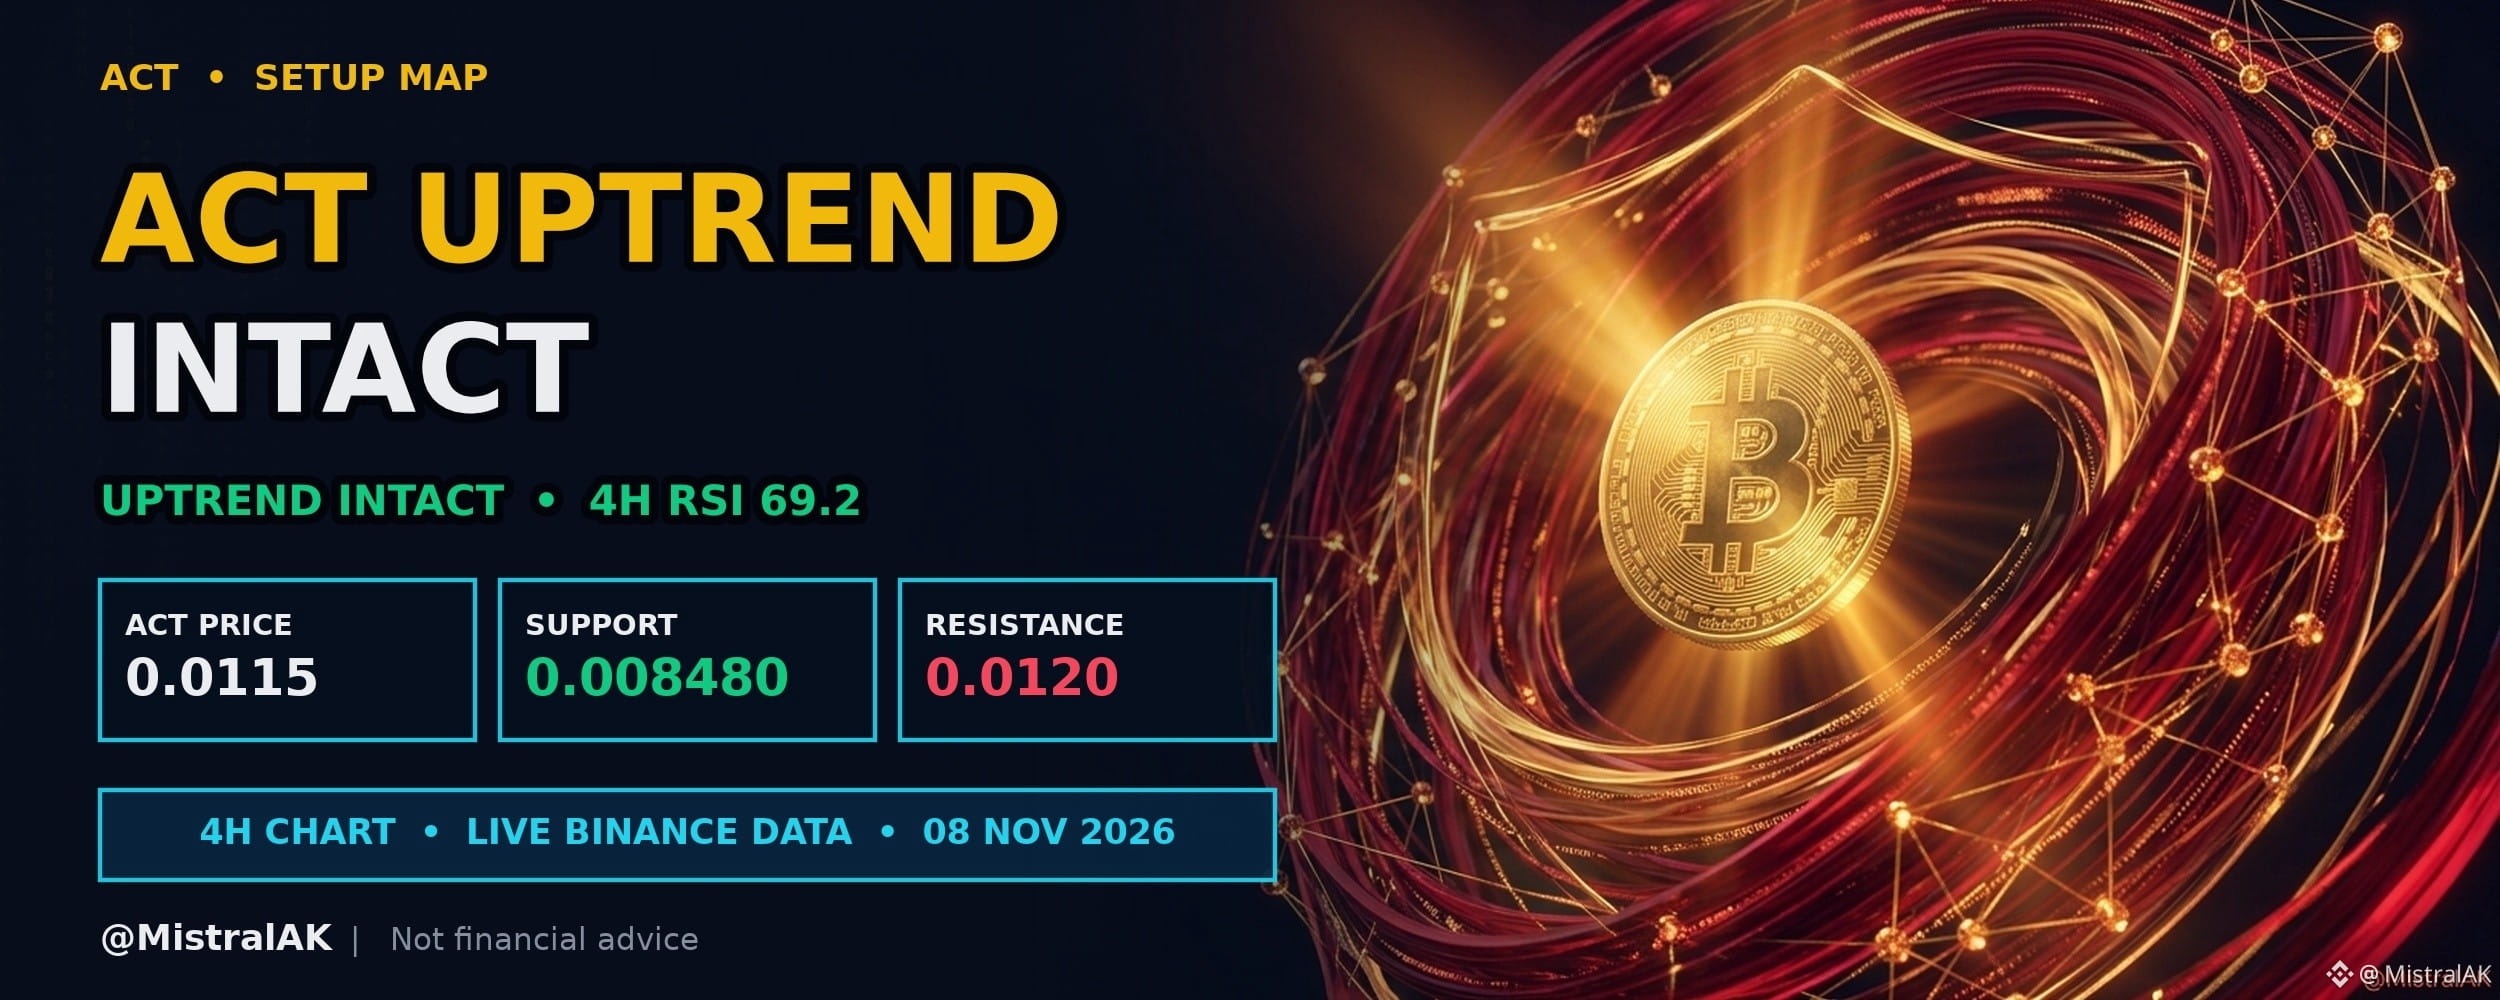
$ACT Price Sustains Advance Above Key Moving Averages
$ACT trades at 0.0115 USD, up 12.1% over the past 24 hours, with 4H RSI at 69.2 (neutral).
Price gained over the past twenty-four hours and trades above the twenty and fifty exponential moving averages. A balanced four-hour relative strength index leaves room for movement in either direction as moving average support is tested.
KEY LEVELS
▪️ Resistance: 0.0120 USD (20-candle 4H swing high)
▪️ Support: 0.008480 USD (20-candle 4H swing low)
▪️ EMA 20 / EMA 50: 0.0101 / 0.009315 USD (short-term trend filter)
WHAT WOULD CONFIRM STRENGTH
▪️ Price holding above EMA 20 (0.0101 USD) and EMA 50 (0.009315 USD)
▪️ A 4H close above 0.0120 USD to extend the range
WHAT WOULD INVALIDATE IT
▪️ A 4H close below EMA 50 (0.009315 USD)
▪️ A loss of 0.008480 USD would break the higher-low structure
Will the shorter exponential moving average hold as support, or will momentum turn lower from here?
Not financial advice. Always DYOR.
Like & Follow for Daily Trade Analytics & Insider News. @MistralAK
#ACT #HotTrends #TechnicalAnalysis
{spot}(ACTUSDT)
$ACT Price Sustains Advance Above Key Moving Averages
$ACT trades at 0.0115 USD, up 12.1% over the past 24 hours, with 4H RSI at 69.2 (neutral).
Price gained over the past twenty-four hours and trades above the twenty and fifty exponential moving averages. A balanced four-hour relative strength index leaves room for movement in either direction as moving average support is tested.
KEY LEVELS
▪️ Resistance: 0.0120 USD (20-candle 4H swing high)
▪️ Support: 0.008480 USD (20-candle 4H swing low)
▪️ EMA 20 / EMA 50: 0.0101 / 0.009315 USD (short-term trend filter)
WHAT WOULD CONFIRM STRENGTH
▪️ Price holding above EMA 20 (0.0101 USD) and EMA 50 (0.009315 USD)
▪️ A 4H close above 0.0120 USD to extend the range
WHAT WOULD INVALIDATE IT
▪️ A 4H close below EMA 50 (0.009315 USD)
▪️ A loss of 0.008480 USD would break the higher-low structure
Will the shorter exponential moving average hold as support, or will momentum turn lower from here?
Not financial advice. Always DYOR.
Like & Follow for Daily Trade Analytics & Insider News. @MistralAK
#ACT #HotTrends #TechnicalAnalysis
$ACT trades at 0.0115 USD, up 12.1% over the past 24 hours, with 4H RSI at 69.2 (neutral).
Price gained over the past twenty-four hours and trades above the twenty and fifty exponential moving averages. A balanced four-hour relative strength index leaves room for movement in either direction as moving average support is tested.
KEY LEVELS
▪️ Resistance: 0.0120 USD (20-candle 4H swing high)
▪️ Support: 0.008480 USD (20-candle 4H swing low)
▪️ EMA 20 / EMA 50: 0.0101 / 0.009315 USD (short-term trend filter)
WHAT WOULD CONFIRM STRENGTH
▪️ Price holding above EMA 20 (0.0101 USD) and EMA 50 (0.009315 USD)
▪️ A 4H close above 0.0120 USD to extend the range
WHAT WOULD INVALIDATE IT
▪️ A 4H close below EMA 50 (0.009315 USD)
▪️ A loss of 0.008480 USD would break the higher-low structure
Will the shorter exponential moving average hold as support, or will momentum turn lower from here?
Not financial advice. Always DYOR.
Like & Follow for Daily Trade Analytics & Insider News. @MistralAK
#ACT #HotTrends #TechnicalAnalysis
254

·
--
⚠️ Short Setup: $ACT (FUTURES) Distribution Pattern
📊 Market Context & Thesis:
Price broke firmly below the Asian session consolidation low. The breakdown indicates seller initiative, opening the door for continuation into European session lows.
• Funding: -0.0026% (Neutral) • Next: 3h 09m
• Open Interest (OI): $4.76M
• 24h Volume: $36.82M
• 24h Range: 0.009377 — 0.011925 (+6.4%)
🎯 Entry: 0.01013
🛑 Stop-Loss: 0.01043 (-2.96%)
✅ Take-Profit: 0.007968 (+21.34%)
⚖️ Risk/Reward: 1:7.2
🚫 Invalidation Rule: If a 1-hour candle closes above $0.01043 (+2.96%), this bearish thesis is invalidated. Cut position immediately.
⚖️ Risk Note: Moderate leverage recommended (3x–5x on Futures). Never risk more than 1–2% of total portfolio capital on a single setup.
📈 Strategy Track Record: WR 36% over 1390 trades
#ACT #TechnicalAnalysis #CryptoTrading #BinanceSquare
⚠️ Not financial advice. Always manage your risk.
⚠️ Short Setup: $ACT (FUTURES) Distribution Pattern
📊 Market Context & Thesis:
Price broke firmly below the Asian session consolidation low. The breakdown indicates seller initiative, opening the door for continuation into European session lows.
• Funding: -0.0026% (Neutral) • Next: 3h 09m
• Open Interest (OI): $4.76M
• 24h Volume: $36.82M
• 24h Range: 0.009377 — 0.011925 (+6.4%)
🎯 Entry: 0.01013
🛑 Stop-Loss: 0.01043 (-2.96%)
✅ Take-Profit: 0.007968 (+21.34%)
⚖️ Risk/Reward: 1:7.2
🚫 Invalidation Rule: If a 1-hour candle closes above $0.01043 (+2.96%), this bearish thesis is invalidated. Cut position immediately.
⚖️ Risk Note: Moderate leverage recommended (3x–5x on Futures). Never risk more than 1–2% of total portfolio capital on a single setup.
📈 Strategy Track Record: WR 36% over 1390 trades
#ACT #TechnicalAnalysis #CryptoTrading #BinanceSquare
⚠️ Not financial advice. Always manage your risk.
📊 Market Context & Thesis:
Price broke firmly below the Asian session consolidation low. The breakdown indicates seller initiative, opening the door for continuation into European session lows.
• Funding: -0.0026% (Neutral) • Next: 3h 09m
• Open Interest (OI): $4.76M
• 24h Volume: $36.82M
• 24h Range: 0.009377 — 0.011925 (+6.4%)
🎯 Entry: 0.01013
🛑 Stop-Loss: 0.01043 (-2.96%)
✅ Take-Profit: 0.007968 (+21.34%)
⚖️ Risk/Reward: 1:7.2
🚫 Invalidation Rule: If a 1-hour candle closes above $0.01043 (+2.96%), this bearish thesis is invalidated. Cut position immediately.
⚖️ Risk Note: Moderate leverage recommended (3x–5x on Futures). Never risk more than 1–2% of total portfolio capital on a single setup.
📈 Strategy Track Record: WR 36% over 1390 trades
#ACT #TechnicalAnalysis #CryptoTrading #BinanceSquare
⚠️ Not financial advice. Always manage your risk.
110


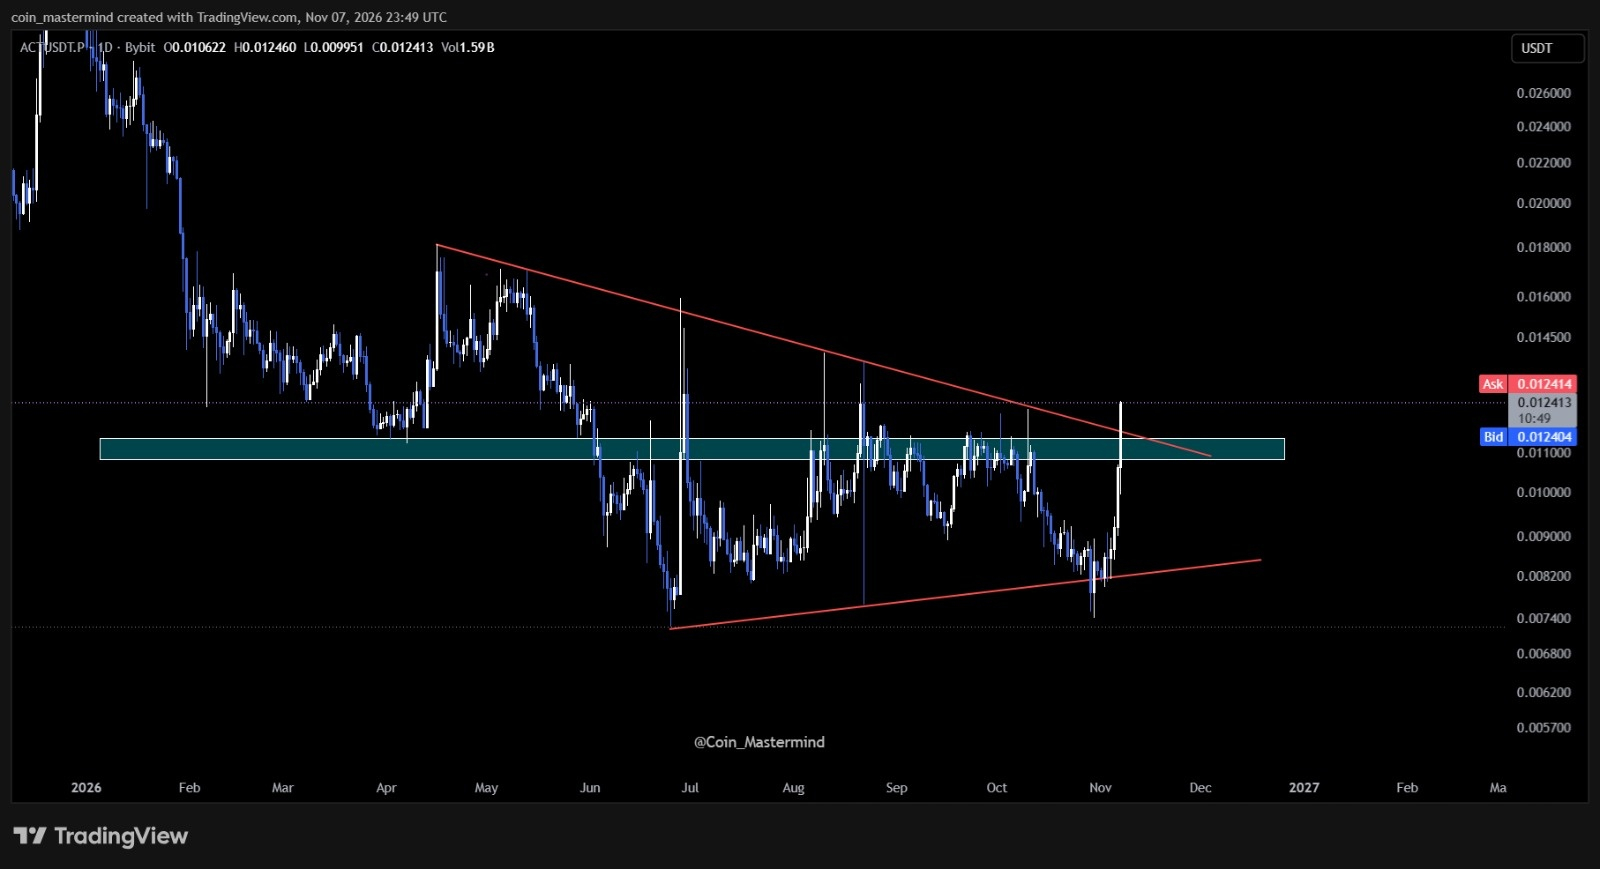
$ACT attempting a breakout! 🚀
📆 1D TF: Price is breaking out of a symmetrical triangle 🔺
Now watching for confirmation — a sustained breakout could open the door for further upside 📈
👀 Keep an eye on this setup!
#ACT #SymmetricalTriangle #BreakoutWatch
Not financial advice — DYOR!
$ACT attempting a breakout! 🚀
📆 1D TF: Price is breaking out of a symmetrical triangle 🔺
Now watching for confirmation — a sustained breakout could open the door for further upside 📈
👀 Keep an eye on this setup!
#ACT #SymmetricalTriangle #BreakoutWatch
Not financial advice — DYOR!
📆 1D TF: Price is breaking out of a symmetrical triangle 🔺
Now watching for confirmation — a sustained breakout could open the door for further upside 📈
👀 Keep an eye on this setup!
#ACT #SymmetricalTriangle #BreakoutWatch
Not financial advice — DYOR!
158

·
--
Bullish
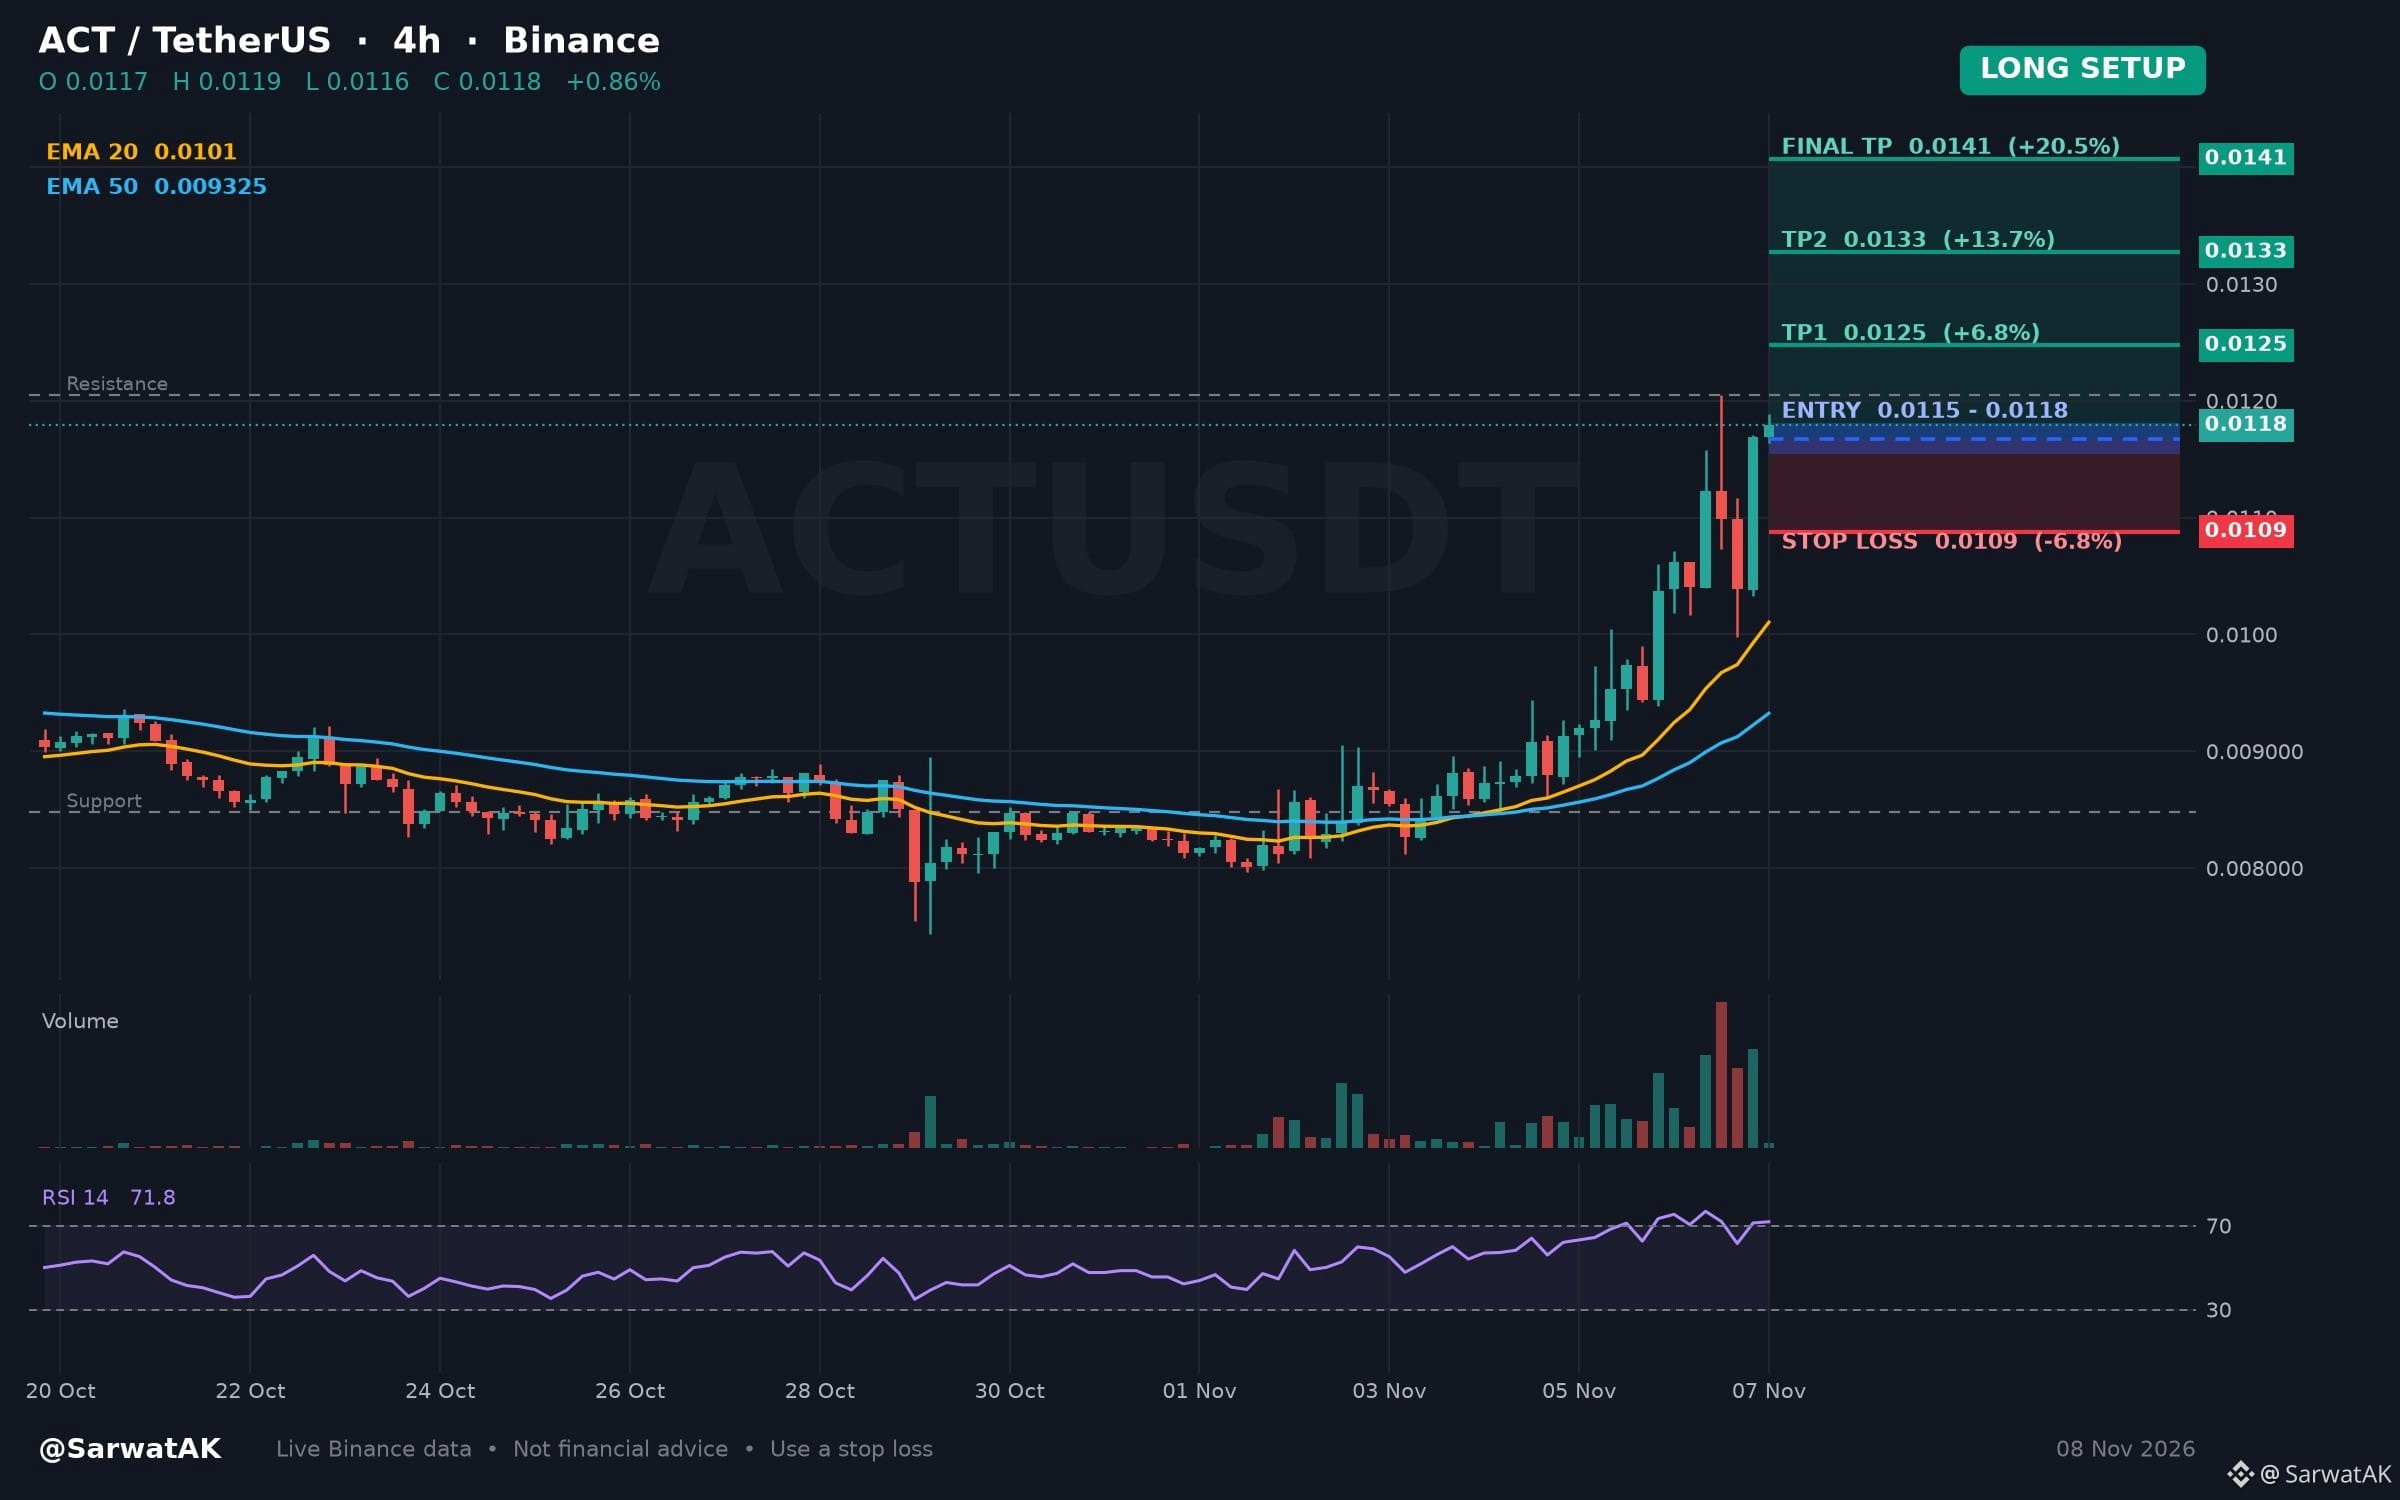
$ACT LONG SETUP ... NEXT TARGET 0.0141
Momentum Reaches Overbought Territory Following Recent Upside Expansion
Entry: 0.0115 - 0.0118 (Long)
TP1: 0.0125
TP2: 0.0133
Final TP: 0.0141
SL: 0.0109
Price action has moved upward over the past twenty-four hours, pushing the RSI into overbought territory on the four-hour chart. Market participants often watch for potential consolidation or cooling after such extended upward moves.
As long as 0.0115 holds, structure stays constructive
Must use stop loss while trading
Trade $ACT
Not financial advice. Always DYOR.
Like & Follow for Daily Trade Analytics & Insider News. @SarwatAK
#ACT #Overbought #TechnicalAnalysis
{spot}(ACTUSDT)
$ACT LONG SETUP ... NEXT TARGET 0.0141
Momentum Reaches Overbought Territory Following Recent Upside Expansion
Entry: 0.0115 - 0.0118 (Long)
TP1: 0.0125
TP2: 0.0133
Final TP: 0.0141
SL: 0.0109
Price action has moved upward over the past twenty-four hours, pushing the RSI into overbought territory on the four-hour chart. Market participants often watch for potential consolidation or cooling after such extended upward moves.
As long as 0.0115 holds, structure stays constructive
Must use stop loss while trading
Trade $ACT
Not financial advice. Always DYOR.
Like & Follow for Daily Trade Analytics & Insider News. @SarwatAK
#ACT #Overbought #TechnicalAnalysis
Momentum Reaches Overbought Territory Following Recent Upside Expansion
Entry: 0.0115 - 0.0118 (Long)
TP1: 0.0125
TP2: 0.0133
Final TP: 0.0141
SL: 0.0109
Price action has moved upward over the past twenty-four hours, pushing the RSI into overbought territory on the four-hour chart. Market participants often watch for potential consolidation or cooling after such extended upward moves.
As long as 0.0115 holds, structure stays constructive
Must use stop loss while trading
Trade $ACT
Not financial advice. Always DYOR.
Like & Follow for Daily Trade Analytics & Insider News. @SarwatAK
#ACT #Overbought #TechnicalAnalysis
161
·
--
$ACT ACT is showing bullish movement: 12.06% (Crypto).
Volume: 7.06M | Last: $0.011520
Key signals: strong momentum, high volatility, high trader activity.
Bias Daily: BULLISH 🟢 | Weekly: BULLISH 🟢
ACT rose 13.0% in 24h lifted by sector-wide AI sentiment and heavy volume before experiencing volatile pullbacks.
**Macro AI tailwinds (High)**: Broad political support for the AI sector renewed interest across AI-themed meme tokens → spurred market-wide risk appetite.
- **Volume-backed breakout (High)**: Surging trading volume above $4.0M pushed price from $0.0101 to $0.0117 peak → bullish momentum across short-term moving averages.
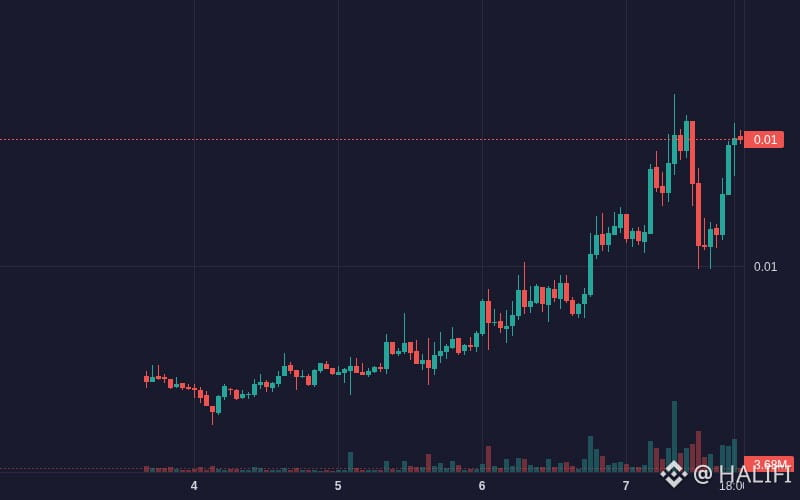
- **Whale net accumulation (Medium)**: Large net inflows peaked at +$123.5K during the rally → accelerated price gains before intraday consolidation.
#ACT #JobsReportRaisesHikeOdds #AKE #AKEUSDT #Crypto
$ACT ACT is showing bullish movement: 12.06% (Crypto).
Volume: 7.06M | Last: $0.011520
Key signals: strong momentum, high volatility, high trader activity.
Bias Daily: BULLISH 🟢 | Weekly: BULLISH 🟢
ACT rose 13.0% in 24h lifted by sector-wide AI sentiment and heavy volume before experiencing volatile pullbacks.
**Macro AI tailwinds (High)**: Broad political support for the AI sector renewed interest across AI-themed meme tokens → spurred market-wide risk appetite.
- **Volume-backed breakout (High)**: Surging trading volume above $4.0M pushed price from $0.0101 to $0.0117 peak → bullish momentum across short-term moving averages.
- **Whale net accumulation (Medium)**: Large net inflows peaked at +$123.5K during the rally → accelerated price gains before intraday consolidation.
#ACT #JobsReportRaisesHikeOdds #AKE #AKEUSDT #Crypto
Volume: 7.06M | Last: $0.011520
Key signals: strong momentum, high volatility, high trader activity.
Bias Daily: BULLISH 🟢 | Weekly: BULLISH 🟢
ACT rose 13.0% in 24h lifted by sector-wide AI sentiment and heavy volume before experiencing volatile pullbacks.
**Macro AI tailwinds (High)**: Broad political support for the AI sector renewed interest across AI-themed meme tokens → spurred market-wide risk appetite.
- **Volume-backed breakout (High)**: Surging trading volume above $4.0M pushed price from $0.0101 to $0.0117 peak → bullish momentum across short-term moving averages.
- **Whale net accumulation (Medium)**: Large net inflows peaked at +$123.5K during the rally → accelerated price gains before intraday consolidation.
#ACT #JobsReportRaisesHikeOdds #AKE #AKEUSDT #Crypto
13

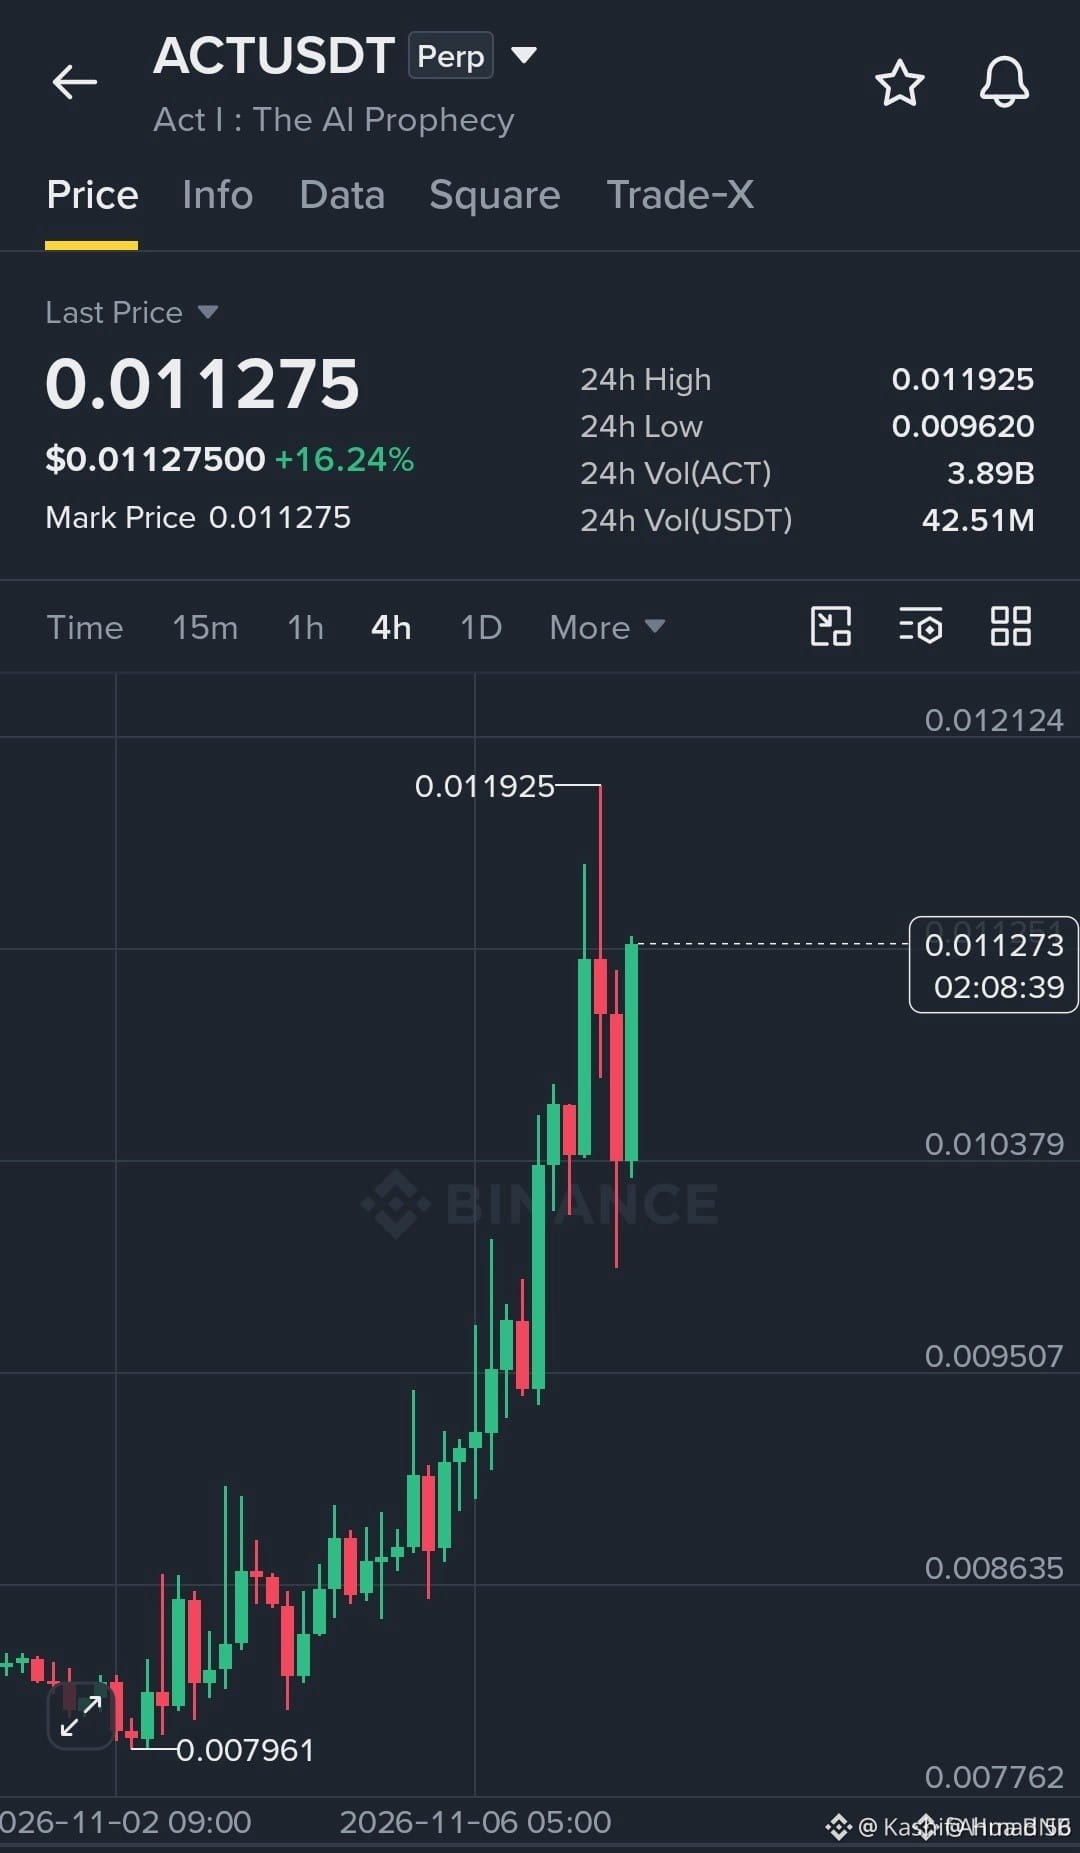
🚀 ACT/USDT — Is Another Bullish Breakout Coming? 🔥
ACT is showing impressive bullish momentum! 📈 Buyers are pushing the price higher, and the next resistance could decide its next big move.
💰 Current Price: $0.011275
🔥 24H Gain: +16.24%
📊 24H High: $0.011925
📉 24H Low: $0.009620
Key Levels to Watch:
🟢 Support Zone: $0.010400 – $0.010000
🔴 Resistance: $0.011925 – $0.012100
🎯 Potential Upside Targets:
- Target 1: $0.011925
- Target 2: $0.012500
- Target 3: $0.013000
🔥 A strong breakout above $0.011925 could open the door for another bullish move!
⚠️ Watch for confirmation before entering. Avoid FOMO buying and always manage your risk.
🚀 Are you holding ACT or waiting for a better entry?
💚 Follow me for more crypto opportunities and market updates!
#ACT #WillUS-IranTensionsBoostSafe-HavenDemand? #BinanceSquareFamily #Altcoins👀🚀 #CryptoTrading
$ACT
{spot}(ACTUSDT)
🚀 ACT/USDT — Is Another Bullish Breakout Coming? 🔥
ACT is showing impressive bullish momentum! 📈 Buyers are pushing the price higher, and the next resistance could decide its next big move.
💰 Current Price: $0.011275
🔥 24H Gain: +16.24%
📊 24H High: $0.011925
📉 24H Low: $0.009620
Key Levels to Watch:
🟢 Support Zone: $0.010400 – $0.010000
🔴 Resistance: $0.011925 – $0.012100
🎯 Potential Upside Targets:
- Target 1: $0.011925
- Target 2: $0.012500
- Target 3: $0.013000
🔥 A strong breakout above $0.011925 could open the door for another bullish move!
⚠️ Watch for confirmation before entering. Avoid FOMO buying and always manage your risk.
🚀 Are you holding ACT or waiting for a better entry?
💚 Follow me for more crypto opportunities and market updates!
#ACT #WillUS-IranTensionsBoostSafe-HavenDemand? #BinanceSquareFamily #Altcoins👀🚀 #CryptoTrading
$ACT
ACT is showing impressive bullish momentum! 📈 Buyers are pushing the price higher, and the next resistance could decide its next big move.
💰 Current Price: $0.011275
🔥 24H Gain: +16.24%
📊 24H High: $0.011925
📉 24H Low: $0.009620
Key Levels to Watch:
🟢 Support Zone: $0.010400 – $0.010000
🔴 Resistance: $0.011925 – $0.012100
🎯 Potential Upside Targets:
- Target 1: $0.011925
- Target 2: $0.012500
- Target 3: $0.013000
🔥 A strong breakout above $0.011925 could open the door for another bullish move!
⚠️ Watch for confirmation before entering. Avoid FOMO buying and always manage your risk.
🚀 Are you holding ACT or waiting for a better entry?
💚 Follow me for more crypto opportunities and market updates!
#ACT #WillUS-IranTensionsBoostSafe-HavenDemand? #BinanceSquareFamily #Altcoins👀🚀 #CryptoTrading
$ACT
112

Understanding Liquidity Through the $ACT Move
When a token pushes above a known resistance level while the hourly direction stays up and volume climbs above its recent baseline, the chart is teaching a basic liquidity lesson. Liquidity can be thought of as water flowing through a pipe: a wide pipe lets water move freely, while a narrow pipe creates pressure and slows the flow. In a crypto market, the pipe is the order book, and the water is trade size. A high 1.15824 or a surge in 6.9967e+06 signals that more traders are adding water, widening the pipe and allowing price to move with less friction.
The mechanism works through market versus limit orders. Market orders act like a sudden burst of water, forcing the price to slide to the next available limit order. If the limit order stack is thin, the price jumps quickly, creating a sharp move that can overshoot resistance. Conversely, a deep stack of limit orders cushions the impact, resulting in a smoother climb. Traders can observe the spread between 0.00998 and 0.01111 to gauge how much cushion exists.
To apply this insight, monitor the ratio of market to limit order flow and watch 1.15824 as a proxy for pipe width. If volume spikes but the price stalls near resistance, the pipe may still be narrow, suggesting a potential reversal. By treating liquidity as a physical flow, you gain a clearer picture of why the $ACT price rose and how long that move might last. 🙂
Probabilistic market research, not a recommendation or guaranteed return.
Which crypto concept becomes clearer when you look at an actual chart?
#ACT #CryptoEducation #CryptoLearning
Understanding Liquidity Through the $ACT Move
When a token pushes above a known resistance level while the hourly direction stays up and volume climbs above its recent baseline, the chart is teaching a basic liquidity lesson. Liquidity can be thought of as water flowing through a pipe: a wide pipe lets water move freely, while a narrow pipe creates pressure and slows the flow. In a crypto market, the pipe is the order book, and the water is trade size. A high 1.15824 or a surge in 6.9967e+06 signals that more traders are adding water, widening the pipe and allowing price to move with less friction.
The mechanism works through market versus limit orders. Market orders act like a sudden burst of water, forcing the price to slide to the next available limit order. If the limit order stack is thin, the price jumps quickly, creating a sharp move that can overshoot resistance. Conversely, a deep stack of limit orders cushions the impact, resulting in a smoother climb. Traders can observe the spread between 0.00998 and 0.01111 to gauge how much cushion exists.
To apply this insight, monitor the ratio of market to limit order flow and watch 1.15824 as a proxy for pipe width. If volume spikes but the price stalls near resistance, the pipe may still be narrow, suggesting a potential reversal. By treating liquidity as a physical flow, you gain a clearer picture of why the $ACT price rose and how long that move might last. 🙂
Probabilistic market research, not a recommendation or guaranteed return.
Which crypto concept becomes clearer when you look at an actual chart?
#ACT #CryptoEducation #CryptoLearning
When a token pushes above a known resistance level while the hourly direction stays up and volume climbs above its recent baseline, the chart is teaching a basic liquidity lesson. Liquidity can be thought of as water flowing through a pipe: a wide pipe lets water move freely, while a narrow pipe creates pressure and slows the flow. In a crypto market, the pipe is the order book, and the water is trade size. A high 1.15824 or a surge in 6.9967e+06 signals that more traders are adding water, widening the pipe and allowing price to move with less friction.
The mechanism works through market versus limit orders. Market orders act like a sudden burst of water, forcing the price to slide to the next available limit order. If the limit order stack is thin, the price jumps quickly, creating a sharp move that can overshoot resistance. Conversely, a deep stack of limit orders cushions the impact, resulting in a smoother climb. Traders can observe the spread between 0.00998 and 0.01111 to gauge how much cushion exists.
To apply this insight, monitor the ratio of market to limit order flow and watch 1.15824 as a proxy for pipe width. If volume spikes but the price stalls near resistance, the pipe may still be narrow, suggesting a potential reversal. By treating liquidity as a physical flow, you gain a clearer picture of why the $ACT price rose and how long that move might last. 🙂
Probabilistic market research, not a recommendation or guaranteed return.
Which crypto concept becomes clearer when you look at an actual chart?
#ACT #CryptoEducation #CryptoLearning
28

·
--
INSTITUTIONAL BUYING VOLUME DRIVING SUPPLY SHOCK POTENTIAL
Market Data:
🟢 ACT: 0.01156 (+14.12%)
🟢 MITO: 0.008 (+16.79%)
🟢 THE: 0.04 (+7.53%)
Observable institutional buying volume across ACT, MITO, and THE charts indicates aggressive smart money entry, potentially setting the stage for a significant supply shock as accessible tokens diminish.
Are you charting these whale movements for your portfolio strategy?
#ACT #MITO #THE #BinanceSquare #CryptoData
INSTITUTIONAL BUYING VOLUME DRIVING SUPPLY SHOCK POTENTIAL
Market Data:
🟢 ACT: 0.01156 (+14.12%)
🟢 MITO: 0.008 (+16.79%)
🟢 THE: 0.04 (+7.53%)
Observable institutional buying volume across ACT, MITO, and THE charts indicates aggressive smart money entry, potentially setting the stage for a significant supply shock as accessible tokens diminish.
Are you charting these whale movements for your portfolio strategy?
#ACT #MITO #THE #BinanceSquare #CryptoData
Market Data:
🟢 ACT: 0.01156 (+14.12%)
🟢 MITO: 0.008 (+16.79%)
🟢 THE: 0.04 (+7.53%)
Observable institutional buying volume across ACT, MITO, and THE charts indicates aggressive smart money entry, potentially setting the stage for a significant supply shock as accessible tokens diminish.
Are you charting these whale movements for your portfolio strategy?
#ACT #MITO #THE #BinanceSquare #CryptoData
233

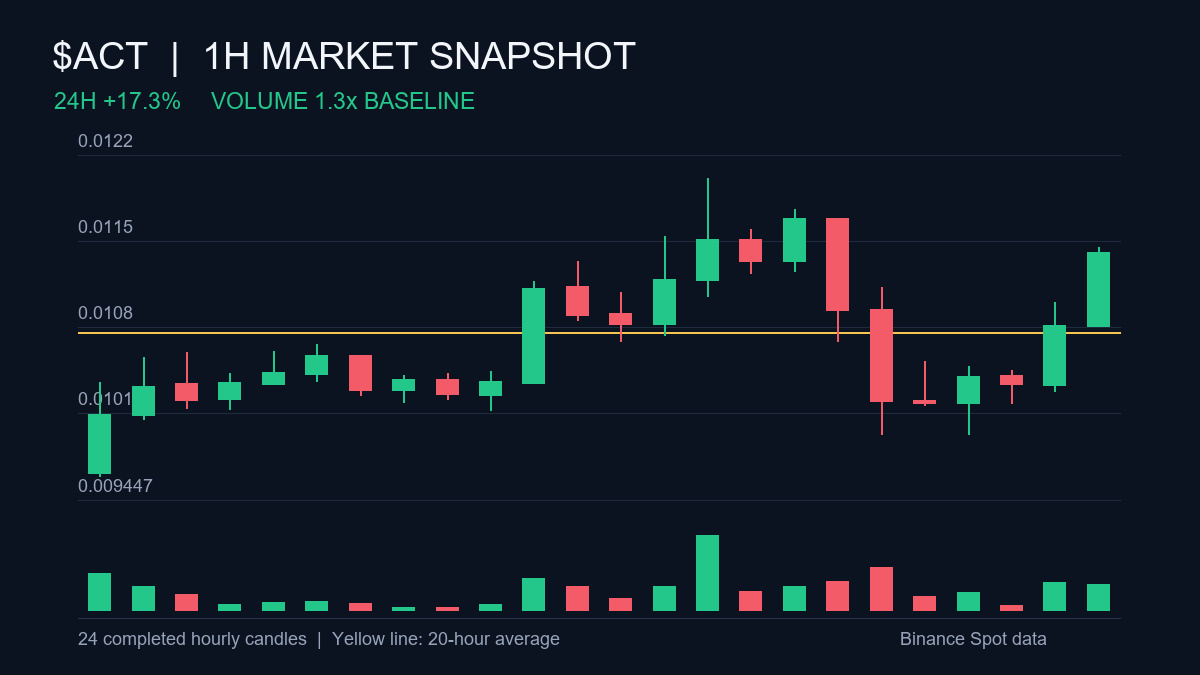
READ — $ACT is +17.3% over 24h; the last closed hour moved +5.4%.
LIMIT — One session is a snapshot; follow-through needs another close.
DATA — Hourly volume was 1.3x its prior 20-hour average. Price is above the 20-hour average at $0.0108.
#ACT #AltcoinFlow #MarketWatch
READ — $ACT is +17.3% over 24h; the last closed hour moved +5.4%.
LIMIT — One session is a snapshot; follow-through needs another close.
DATA — Hourly volume was 1.3x its prior 20-hour average. Price is above the 20-hour average at $0.0108.
#ACT #AltcoinFlow #MarketWatch
LIMIT — One session is a snapshot; follow-through needs another close.
DATA — Hourly volume was 1.3x its prior 20-hour average. Price is above the 20-hour average at $0.0108.
#ACT #AltcoinFlow #MarketWatch
201
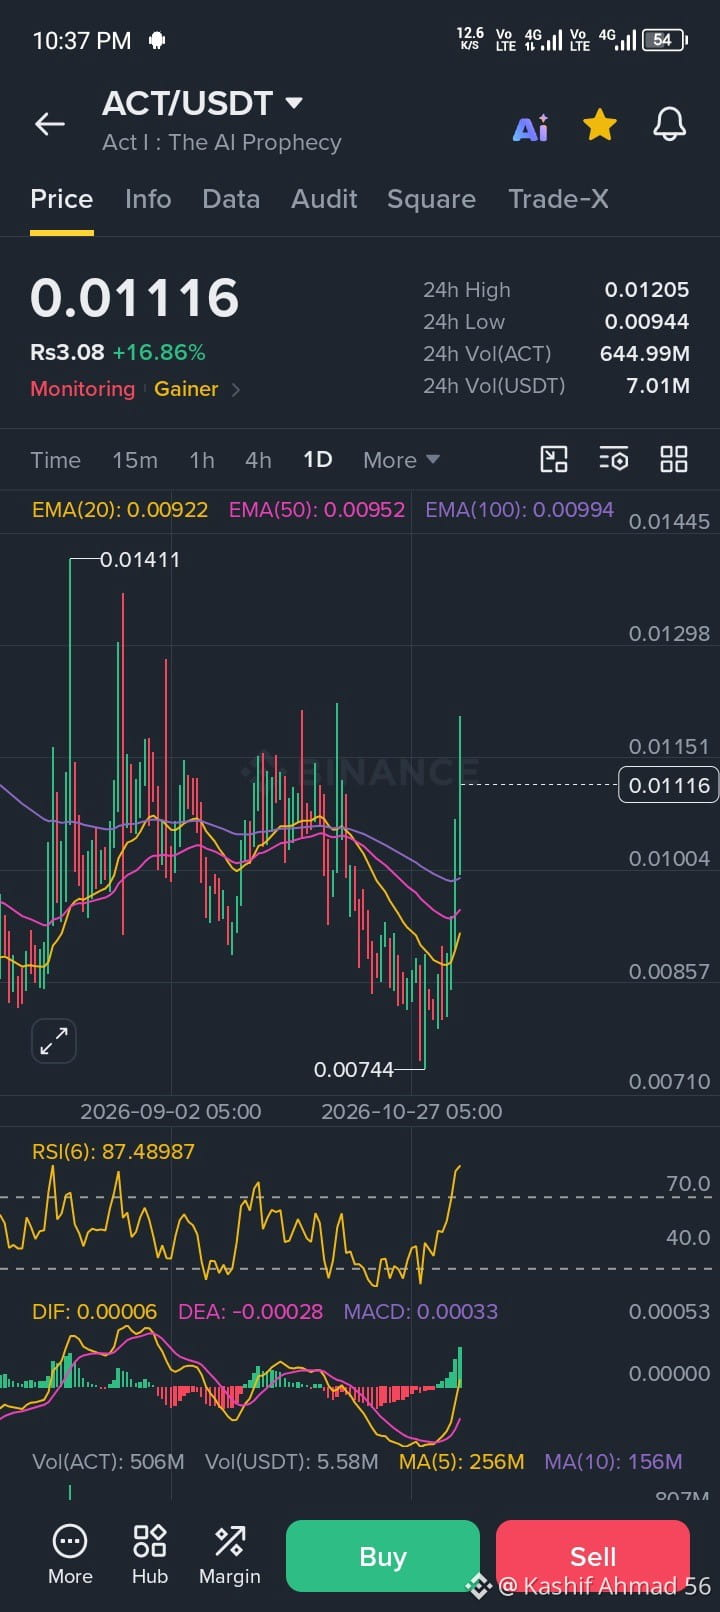
🚀 ACT/USDT — BIG BULLISH MOVE! 🔥
Something interesting is happening with ACT! 👀
The price is showing strong bullish momentum with a +16.86% gain. Buyers are stepping in, and the next move could be exciting!
💰 Current Price: $0.01116
📈 24H High: $0.01205
🟢 Support Zone: $0.01000 – $0.00950
🎯 Target 1: $0.01205
🚀 Target 2: $0.01300
🔥 Target 3: $0.01400
A strong breakout above resistance could open the door for further upside. But remember, confirmation matters!
⚠️ Don't FOMO. Always manage your risk.
❤️ FOLLOW ME for daily crypto opportunities, chart analysis and market updates!
Are you bullish on ACT? Drop your opinion below! 👇
#ACT #JobsReportRaisesHikeOdds #BinanceSquare #CryptoTrading #CPITestsDecemberRateOutlook
$ACT
{spot}(ACTUSDT)
🚀 ACT/USDT — BIG BULLISH MOVE! 🔥
Something interesting is happening with ACT! 👀
The price is showing strong bullish momentum with a +16.86% gain. Buyers are stepping in, and the next move could be exciting!
💰 Current Price: $0.01116
📈 24H High: $0.01205
🟢 Support Zone: $0.01000 – $0.00950
🎯 Target 1: $0.01205
🚀 Target 2: $0.01300
🔥 Target 3: $0.01400
A strong breakout above resistance could open the door for further upside. But remember, confirmation matters!
⚠️ Don't FOMO. Always manage your risk.
❤️ FOLLOW ME for daily crypto opportunities, chart analysis and market updates!
Are you bullish on ACT? Drop your opinion below! 👇
#ACT #JobsReportRaisesHikeOdds #BinanceSquare #CryptoTrading #CPITestsDecemberRateOutlook
$ACT
Something interesting is happening with ACT! 👀
The price is showing strong bullish momentum with a +16.86% gain. Buyers are stepping in, and the next move could be exciting!
💰 Current Price: $0.01116
📈 24H High: $0.01205
🟢 Support Zone: $0.01000 – $0.00950
🎯 Target 1: $0.01205
🚀 Target 2: $0.01300
🔥 Target 3: $0.01400
A strong breakout above resistance could open the door for further upside. But remember, confirmation matters!
⚠️ Don't FOMO. Always manage your risk.
❤️ FOLLOW ME for daily crypto opportunities, chart analysis and market updates!
Are you bullish on ACT? Drop your opinion below! 👇
#ACT #JobsReportRaisesHikeOdds #BinanceSquare #CryptoTrading #CPITestsDecemberRateOutlook
$ACT
166

·
--
🔥 ACT is ripping +10% on 6x volume while ETH and XRP can't decide which way is up. The divergence is the story.
Why this trio? They represent three different market phases right now — ACT is the momentum runner, ETH is the sleeping giant at a decision point, and XRP is the bearish laggard. Watching them together tells you where risk appetite is flowing.
📈 ACT ($0.01063 | +10.4%)
The star of the show. RSI at 63.3 and climbing, 6.21x volume surge, strong uptrend on both 4H and daily. SMA7 > SMA25 confirms the short-term momentum is real. But here's the catch — when RSI crosses 70, this thing could unwind fast. Ride the wave but keep stops tight.
⚖️ ETH ($2,237 | +0.3%)
Stuck in no-man's land. RSI at 41 says bearish lean, but the signal flipped up. Volume is dead at 0.21x normal — the market isn't committing either direction. This is the "wait for the break" setup. A move above $2,280 opens up $2,400. A drop below $2,200 targets $2,100. Patience pays here.
📉 XRP ($1.1593 | -2.6%)
The weakest of the three. RSI at 30.1, declining volume, and firmly below all moving averages. The bearish trend is intact and there's no reversal signal yet. Short bounces toward $1.17 with stops above $1.21 is the play if you want XRP exposure.
🎯 Trade Plans:
ACT (LONG): Entry $0.01006–0.01076 | SL $0.008991 | TP $0.01083
ETH (LONG): Entry $2,219–2,255 | SL $2,166 | TP $2,327
XRP (SHORT): Entry $1.1456–1.1730 | SL $1.2139 | TP $1.1113
💡 The spread: ACT gives you momentum with defined risk. ETH gives you a breakout setup. XRP gives you a clean short. Three different strategies, pick your edge.
Which setup would you take? 🎲
#ACT #ETH #XRP
🔥 ACT is ripping +10% on 6x volume while ETH and XRP can't decide which way is up. The divergence is the story.
Why this trio? They represent three different market phases right now — ACT is the momentum runner, ETH is the sleeping giant at a decision point, and XRP is the bearish laggard. Watching them together tells you where risk appetite is flowing.
📈 ACT ($0.01063 | +10.4%)
The star of the show. RSI at 63.3 and climbing, 6.21x volume surge, strong uptrend on both 4H and daily. SMA7 > SMA25 confirms the short-term momentum is real. But here's the catch — when RSI crosses 70, this thing could unwind fast. Ride the wave but keep stops tight.
⚖️ ETH ($2,237 | +0.3%)
Stuck in no-man's land. RSI at 41 says bearish lean, but the signal flipped up. Volume is dead at 0.21x normal — the market isn't committing either direction. This is the "wait for the break" setup. A move above $2,280 opens up $2,400. A drop below $2,200 targets $2,100. Patience pays here.
📉 XRP ($1.1593 | -2.6%)
The weakest of the three. RSI at 30.1, declining volume, and firmly below all moving averages. The bearish trend is intact and there's no reversal signal yet. Short bounces toward $1.17 with stops above $1.21 is the play if you want XRP exposure.
🎯 Trade Plans:
ACT (LONG): Entry $0.01006–0.01076 | SL $0.008991 | TP $0.01083
ETH (LONG): Entry $2,219–2,255 | SL $2,166 | TP $2,327
XRP (SHORT): Entry $1.1456–1.1730 | SL $1.2139 | TP $1.1113
💡 The spread: ACT gives you momentum with defined risk. ETH gives you a breakout setup. XRP gives you a clean short. Three different strategies, pick your edge.
Which setup would you take? 🎲
#ACT #ETH #XRP
Why this trio? They represent three different market phases right now — ACT is the momentum runner, ETH is the sleeping giant at a decision point, and XRP is the bearish laggard. Watching them together tells you where risk appetite is flowing.
📈 ACT ($0.01063 | +10.4%)
The star of the show. RSI at 63.3 and climbing, 6.21x volume surge, strong uptrend on both 4H and daily. SMA7 > SMA25 confirms the short-term momentum is real. But here's the catch — when RSI crosses 70, this thing could unwind fast. Ride the wave but keep stops tight.
⚖️ ETH ($2,237 | +0.3%)
Stuck in no-man's land. RSI at 41 says bearish lean, but the signal flipped up. Volume is dead at 0.21x normal — the market isn't committing either direction. This is the "wait for the break" setup. A move above $2,280 opens up $2,400. A drop below $2,200 targets $2,100. Patience pays here.
📉 XRP ($1.1593 | -2.6%)
The weakest of the three. RSI at 30.1, declining volume, and firmly below all moving averages. The bearish trend is intact and there's no reversal signal yet. Short bounces toward $1.17 with stops above $1.21 is the play if you want XRP exposure.
🎯 Trade Plans:
ACT (LONG): Entry $0.01006–0.01076 | SL $0.008991 | TP $0.01083
ETH (LONG): Entry $2,219–2,255 | SL $2,166 | TP $2,327
XRP (SHORT): Entry $1.1456–1.1730 | SL $1.2139 | TP $1.1113
💡 The spread: ACT gives you momentum with defined risk. ETH gives you a breakout setup. XRP gives you a clean short. Three different strategies, pick your edge.
Which setup would you take? 🎲
#ACT #ETH #XRP
180
Log in to explore more content
Join global crypto users on Binance Square
⚡️ Get latest and useful information about crypto.
💬 Trusted by the world’s largest crypto exchange.
👍 Discover real insights from verified creators.
Email / Phone number
Trending Topics
1
#JobsReportRaisesHikeOdds
503,034 views
3,264 Discussing
2
#CPITestsDecemberRateOutlook
142,046 views
1,064 Discussing
3
#BitcoinRebounds$75KAsChipsLead
46,068 views
337 Discussing
4
#US Data Center Rules May Constrain AI Expansion
70,167 views
226 Discussing
5
#ARKPlans14ThematicETFsCoveringAIAndTokenizedMarkets
4,051 views
65 Discussing
6
#WillAnthropicListOnTime
150,140 views
1,310 Discussing
7
#WillUS-IranTensionsBoostSafe-HavenDemand?
65,202 views
473 Discussing
8
#BitcoinETFsSee$412MNetOutflows
14,739 views
73 Discussing
9
#HKSFCPlansToRestrictCryptoAndExchangeTerms
57,383 views
512 Discussing
10
#TradFiForBeginners
88,982 views
966 Discussing