

#200weekma
200weekma
125 views
7 Discussing
Hot
Latest

·
--
Article
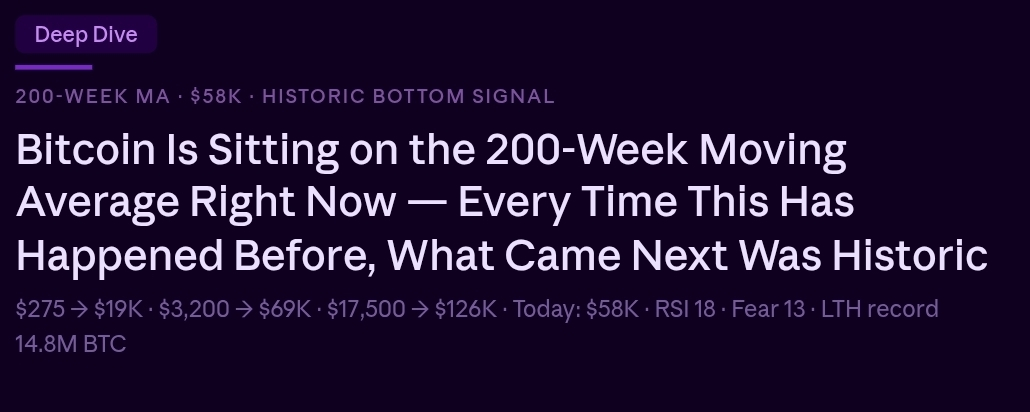
Bitcoin Is Sitting on the 200-Week Moving Average Right Now — Every Single Time This Has Happened BeI want to show you the single most important chart in crypto right now — not because it guarantees anything, but because it has the most consistent track record of any technical indicator in Bitcoin's 15-year history.
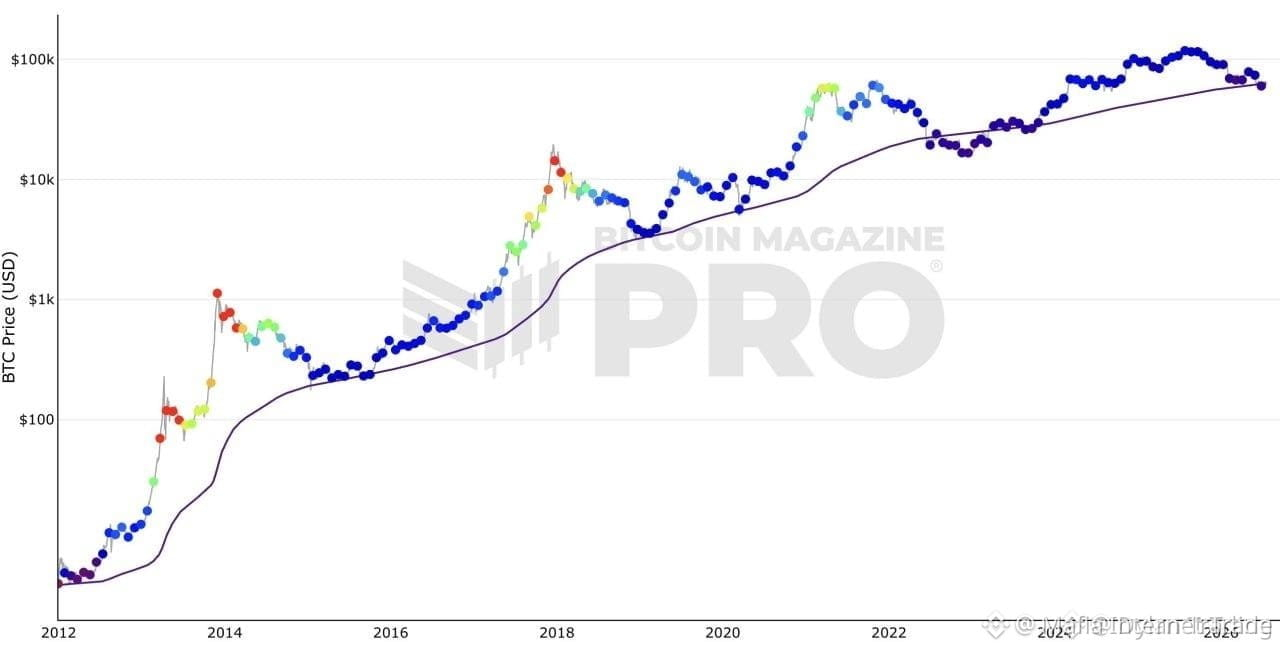
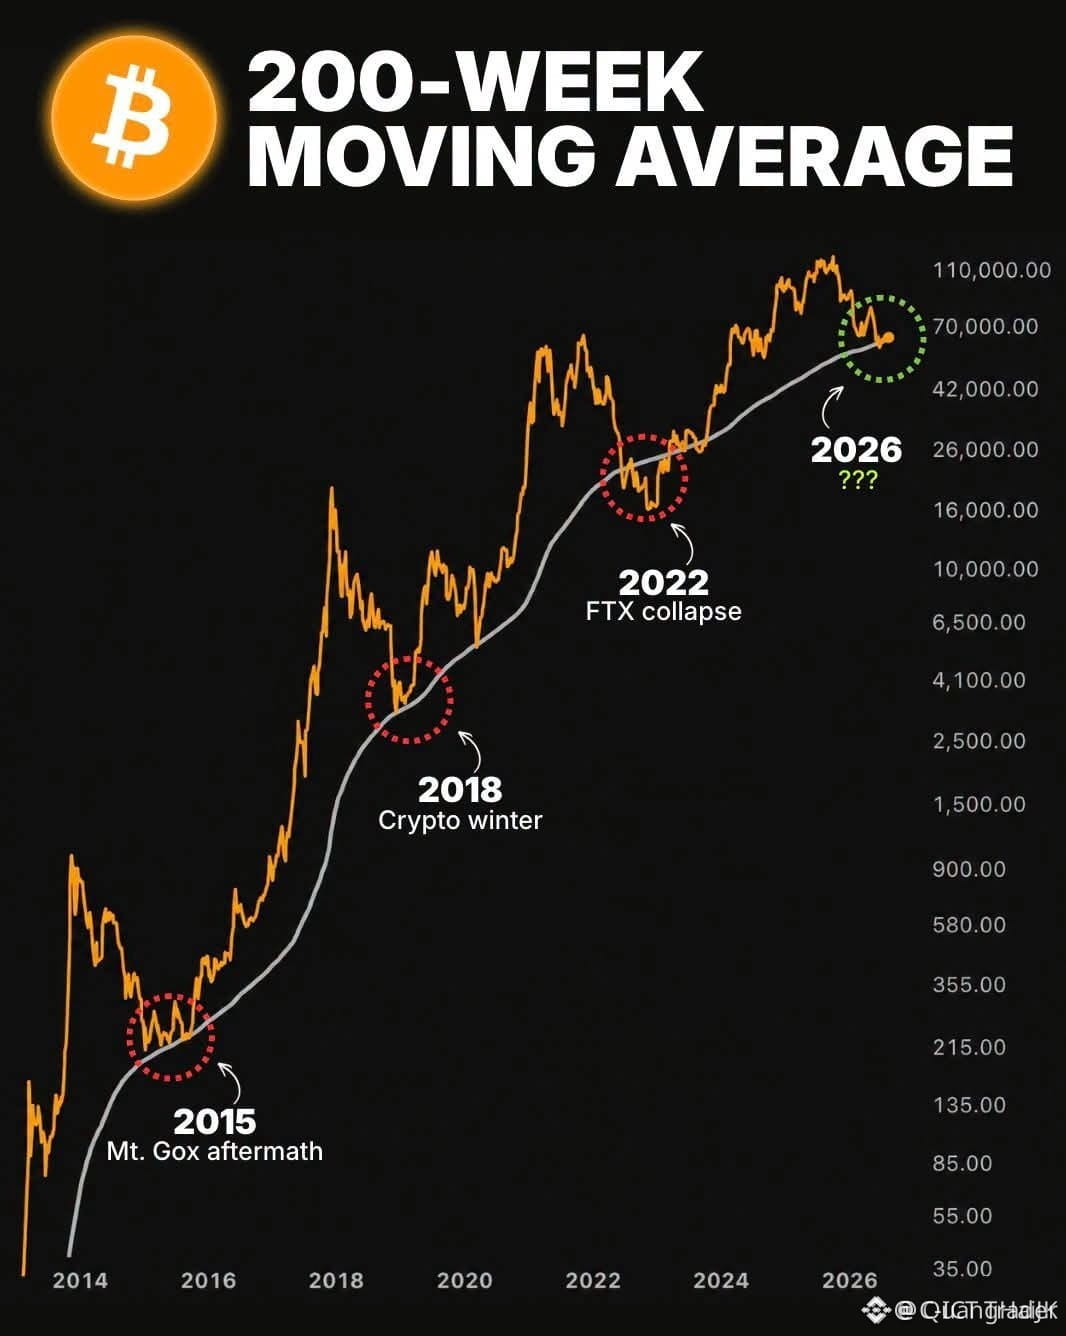
The 200-week moving average — a simple average of Bitcoin's closing price over the most recent 200 weeks, roughly four full years. It has marked the macro bottom of every major Bitcoin bear market since 2015.
In 2015, Bitcoin touched the 200-week MA at $275 and then rallied to $19,000 in 2017.
In 2018, Bitcoin touched $3,200 and then rallied to $69,000 in 2021.
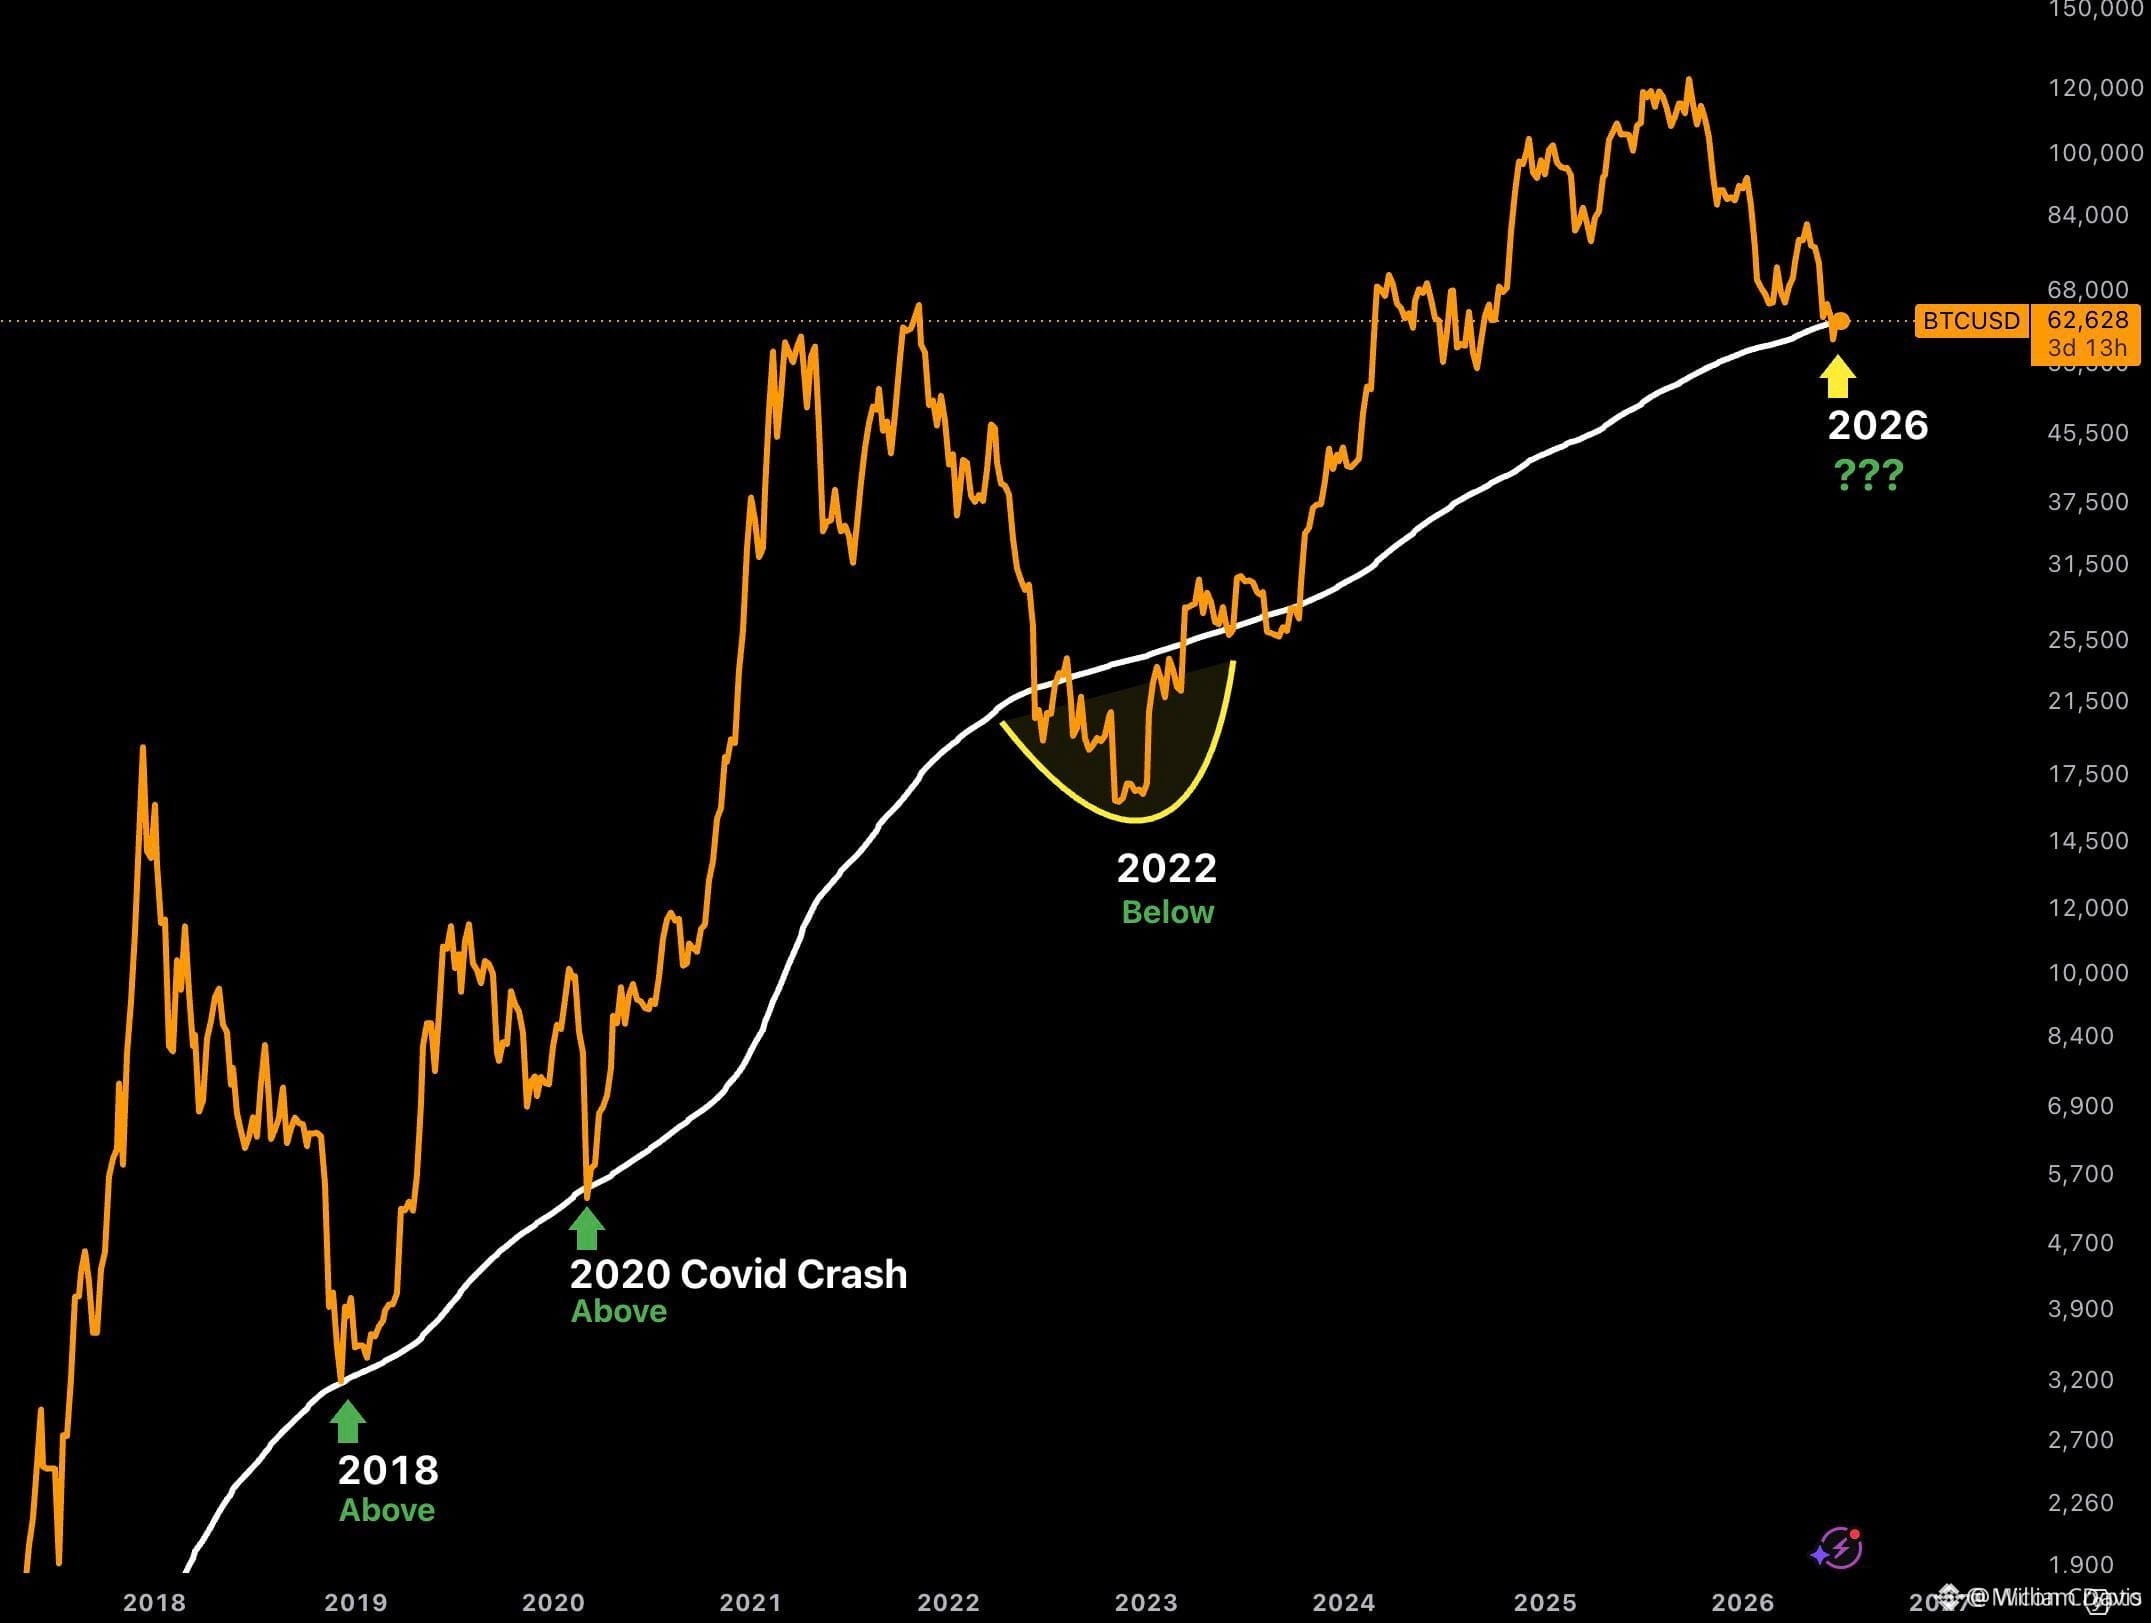
In 2022, Bitcoin briefly broke below it at $17,500 before recovering and then rallying to $126,200 in 2025.
Today, the 200-week MA sits at approximately $58,000–$62,000, depending on the data source. Bitcoin's intraday low on June 26 was $58,189. We are sitting on the line.
Galaxy Digital identified $58,000 as the specific floor that anchors the indicator's historical significance. Multiple analysts across TradingKey, CoinDesk, and CoinStats all flagged this level simultaneously this week. The RSI at 18 — one of the most oversold readings Bitcoin has ever printed. The Fear & Greed Index at 13–16 — deep Extreme Fear. Miner daily profits are approaching negative — meaning small miners are shutting down, which historically precedes a difficulty adjustment and price recovery.
Does this mean Bitcoin bottoms here? History says more likely than not. Does it guarantee it? Nothing in markets is guaranteed.
What the data says: 21Shares in their semi-annual report this week called the current trajectory "broadly similar" to past post-halving performances and reiterated a $100,000 year-end target. Long-term holders control a record 14.8 million BTC and none are selling. Bitcoin supply in loss hit 10.83 million — a record — and price held above the 200-week MA.
The next 200-week MA test after this one, if it fails, sits at approximately $42,000–$44,000. That is the downside scenario if Monday's ETF flows stay deeply negative after yesterday's options expiry.
But right now, today, June 27 — Bitcoin is sitting exactly where it has historically bottomed. That is not nothing.
Please subscribe, like, and share this article. It genuinely helps.
#Bitcoin #BTC走势分析 C #200WeekMA #TechnicalAnalysis #BinanceSquare
Bitcoin Is Sitting on the 200-Week Moving Average Right Now — Every Single Time This Has Happened Be
I want to show you the single most important chart in crypto right now — not because it guarantees anything, but because it has the most consistent track record of any technical indicator in Bitcoin's 15-year history.
The 200-week moving average — a simple average of Bitcoin's closing price over the most recent 200 weeks, roughly four full years. It has marked the macro bottom of every major Bitcoin bear market since 2015.
In 2015, Bitcoin touched the 200-week MA at $275 and then rallied to $19,000 in 2017.
In 2018, Bitcoin touched $3,200 and then rallied to $69,000 in 2021.
In 2022, Bitcoin briefly broke below it at $17,500 before recovering and then rallying to $126,200 in 2025.
Today, the 200-week MA sits at approximately $58,000–$62,000, depending on the data source. Bitcoin's intraday low on June 26 was $58,189. We are sitting on the line.
Galaxy Digital identified $58,000 as the specific floor that anchors the indicator's historical significance. Multiple analysts across TradingKey, CoinDesk, and CoinStats all flagged this level simultaneously this week. The RSI at 18 — one of the most oversold readings Bitcoin has ever printed. The Fear & Greed Index at 13–16 — deep Extreme Fear. Miner daily profits are approaching negative — meaning small miners are shutting down, which historically precedes a difficulty adjustment and price recovery.
Does this mean Bitcoin bottoms here? History says more likely than not. Does it guarantee it? Nothing in markets is guaranteed.
What the data says: 21Shares in their semi-annual report this week called the current trajectory "broadly similar" to past post-halving performances and reiterated a $100,000 year-end target. Long-term holders control a record 14.8 million BTC and none are selling. Bitcoin supply in loss hit 10.83 million — a record — and price held above the 200-week MA.
The next 200-week MA test after this one, if it fails, sits at approximately $42,000–$44,000. That is the downside scenario if Monday's ETF flows stay deeply negative after yesterday's options expiry.
But right now, today, June 27 — Bitcoin is sitting exactly where it has historically bottomed. That is not nothing.
Please subscribe, like, and share this article. It genuinely helps.
#Bitcoin #BTC走势分析 C #200WeekMA #TechnicalAnalysis #BinanceSquare
The 200-week moving average — a simple average of Bitcoin's closing price over the most recent 200 weeks, roughly four full years. It has marked the macro bottom of every major Bitcoin bear market since 2015.
In 2015, Bitcoin touched the 200-week MA at $275 and then rallied to $19,000 in 2017.
In 2018, Bitcoin touched $3,200 and then rallied to $69,000 in 2021.
In 2022, Bitcoin briefly broke below it at $17,500 before recovering and then rallying to $126,200 in 2025.
Today, the 200-week MA sits at approximately $58,000–$62,000, depending on the data source. Bitcoin's intraday low on June 26 was $58,189. We are sitting on the line.
Galaxy Digital identified $58,000 as the specific floor that anchors the indicator's historical significance. Multiple analysts across TradingKey, CoinDesk, and CoinStats all flagged this level simultaneously this week. The RSI at 18 — one of the most oversold readings Bitcoin has ever printed. The Fear & Greed Index at 13–16 — deep Extreme Fear. Miner daily profits are approaching negative — meaning small miners are shutting down, which historically precedes a difficulty adjustment and price recovery.
Does this mean Bitcoin bottoms here? History says more likely than not. Does it guarantee it? Nothing in markets is guaranteed.
What the data says: 21Shares in their semi-annual report this week called the current trajectory "broadly similar" to past post-halving performances and reiterated a $100,000 year-end target. Long-term holders control a record 14.8 million BTC and none are selling. Bitcoin supply in loss hit 10.83 million — a record — and price held above the 200-week MA.
The next 200-week MA test after this one, if it fails, sits at approximately $42,000–$44,000. That is the downside scenario if Monday's ETF flows stay deeply negative after yesterday's options expiry.
But right now, today, June 27 — Bitcoin is sitting exactly where it has historically bottomed. That is not nothing.
Please subscribe, like, and share this article. It genuinely helps.
#Bitcoin #BTC走势分析 C #200WeekMA #TechnicalAnalysis #BinanceSquare
45

$BTC SURGES PAST THE 200-WEEK MA — A CLASSIC BULL SIGNAL 🔥
No specific price levels provided in input — trade signal section omitted.
Bitcoin just reclaimed the 200-week moving average at $63k, and that’s not noise. This level has been a long-term trend filter for years — every time BTC has held above it, the next leg has followed. We’re seeing this break with real momentum, not a fake out.
The question is whether this is the start of a sustained push or just a wick above a key level. What’s your move here?
Not financial advice. Always manage your risk.
#BTC #Bullish #200WeekMA #Crypto
🔥
$BTC SURGES PAST THE 200-WEEK MA — A CLASSIC BULL SIGNAL 🔥
No specific price levels provided in input — trade signal section omitted.
Bitcoin just reclaimed the 200-week moving average at $63k, and that’s not noise. This level has been a long-term trend filter for years — every time BTC has held above it, the next leg has followed. We’re seeing this break with real momentum, not a fake out.
The question is whether this is the start of a sustained push or just a wick above a key level. What’s your move here?
Not financial advice. Always manage your risk.
#BTC #Bullish #200WeekMA #Crypto
🔥
No specific price levels provided in input — trade signal section omitted.
Bitcoin just reclaimed the 200-week moving average at $63k, and that’s not noise. This level has been a long-term trend filter for years — every time BTC has held above it, the next leg has followed. We’re seeing this break with real momentum, not a fake out.
The question is whether this is the start of a sustained push or just a wick above a key level. What’s your move here?
Not financial advice. Always manage your risk.
#BTC #Bullish #200WeekMA #Crypto
🔥
31
$BTC HOLDS ABOVE 200-WEEK MA AFTER $57K LIQUIDITY SWEEP 🔥
Body: This level has only been lost once in the last decade — during the 2022 crash — and each hold since has preceded a structural rally. BTC is now back above $60k after sweeping the $57k cycle low, with volume picking up on the daily.
Macro uncertainty remains, but the historical summer pump pattern is still in play if this support continues to attract bids. Are you positioning for a rally or expecting another test of the range?
Not financial advice. Always manage your risk.
#BTC #SupportTest #200WeekMA #Crypto #SummerPump
🔥
$BTC HOLDS ABOVE 200-WEEK MA AFTER $57K LIQUIDITY SWEEP 🔥
Body: This level has only been lost once in the last decade — during the 2022 crash — and each hold since has preceded a structural rally. BTC is now back above $60k after sweeping the $57k cycle low, with volume picking up on the daily.
Macro uncertainty remains, but the historical summer pump pattern is still in play if this support continues to attract bids. Are you positioning for a rally or expecting another test of the range?
Not financial advice. Always manage your risk.
#BTC #SupportTest #200WeekMA #Crypto #SummerPump
🔥
Body: This level has only been lost once in the last decade — during the 2022 crash — and each hold since has preceded a structural rally. BTC is now back above $60k after sweeping the $57k cycle low, with volume picking up on the daily.
Macro uncertainty remains, but the historical summer pump pattern is still in play if this support continues to attract bids. Are you positioning for a rally or expecting another test of the range?
Not financial advice. Always manage your risk.
#BTC #SupportTest #200WeekMA #Crypto #SummerPump
🔥
31

·
--
🛑 $BTC REJECTS 200-WEEK MA — HISTORICAL BEAR SIGNAL? 📉
📊 The 200-week moving average has been the ultimate line in the sand for Bitcoin across every cycle. Each rejection here has marked the final distribution phase before a deep corrective wave. 🦈 Smart money doesn't wait for confirmation — they're already pressing shorts against this resistance, while $ETH and $SOL trail the same institutional footprint.
⚠️ If this level holds, the macro bias flips bearish, and the path of least resistance points to liquidity sweeps below. The historical fractal is clear, but price action will decide. 💬 Are you respecting the 200-week MA or buying the breakout? 👇
⚠️ Not financial advice. Always manage your risk. 🛡️
🏷️ #BTC #Bearish #200WeekMA #Crypto #RiskOff
🐻 📉
🛑 $BTC REJECTS 200-WEEK MA — HISTORICAL BEAR SIGNAL? 📉
📊 The 200-week moving average has been the ultimate line in the sand for Bitcoin across every cycle. Each rejection here has marked the final distribution phase before a deep corrective wave. 🦈 Smart money doesn't wait for confirmation — they're already pressing shorts against this resistance, while $ETH and $SOL trail the same institutional footprint.
⚠️ If this level holds, the macro bias flips bearish, and the path of least resistance points to liquidity sweeps below. The historical fractal is clear, but price action will decide. 💬 Are you respecting the 200-week MA or buying the breakout? 👇
⚠️ Not financial advice. Always manage your risk. 🛡️
🏷️ #BTC #Bearish #200WeekMA #Crypto #RiskOff
🐻 📉
📊 The 200-week moving average has been the ultimate line in the sand for Bitcoin across every cycle. Each rejection here has marked the final distribution phase before a deep corrective wave. 🦈 Smart money doesn't wait for confirmation — they're already pressing shorts against this resistance, while $ETH and $SOL trail the same institutional footprint.
⚠️ If this level holds, the macro bias flips bearish, and the path of least resistance points to liquidity sweeps below. The historical fractal is clear, but price action will decide. 💬 Are you respecting the 200-week MA or buying the breakout? 👇
⚠️ Not financial advice. Always manage your risk. 🛡️
🏷️ #BTC #Bearish #200WeekMA #Crypto #RiskOff
🐻 📉
36

·
--
$BTC 200W MA RETEST – BUYERS OR BEARS TAKE CONTROL? 🚨🐂
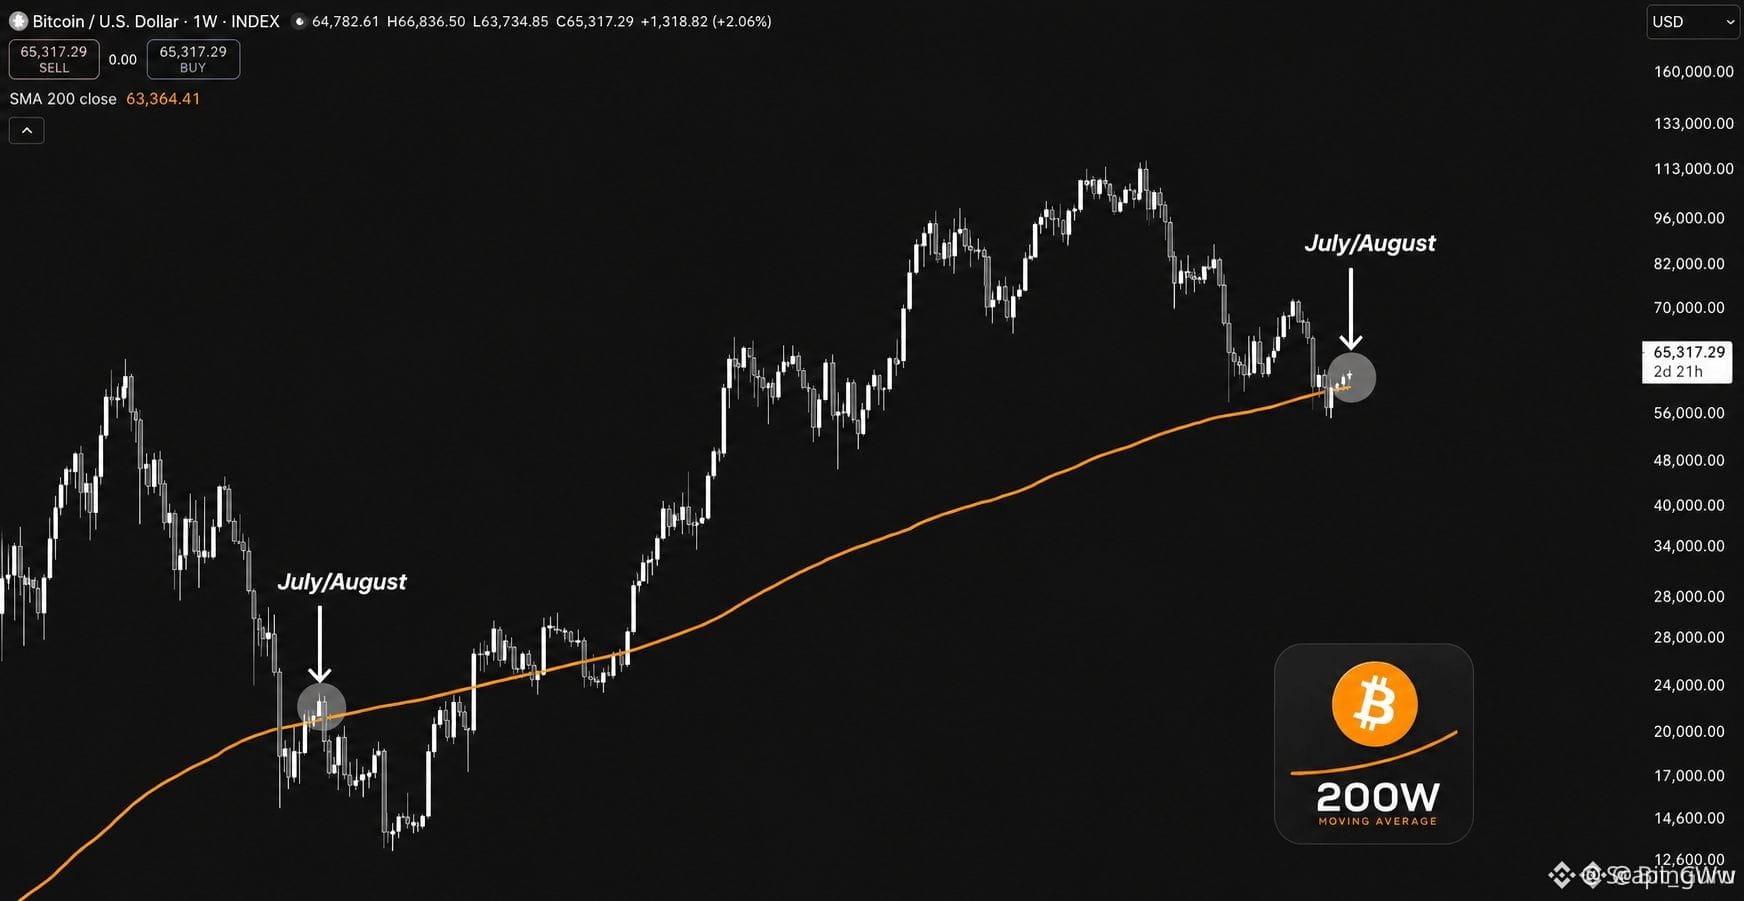
📌 This isn’t just another support zone – this is the 200-week moving average, the line in the sand that has turned Bitcoin around from every major correction since 2015. Buyers are defending it like a fortress, but volume is thinning on approach – a classic setup for an explosive move.
📊 The last two July/August retests of this level triggered multi-month rallies. If history echoes, the foundation for Q4 momentum is being laid right now. A weekly close below, however, opens the door for deeper liquidity grabs before recovery. 💡 Which side of this battle are you positioning for? 💬
⚠️ Not financial advice. Always manage your risk. 🛡️
🏷️ #BTC #200WeekMA #Bitcoin #SupportTest #Crypto
🐂 🛡️
$BTC 200W MA RETEST – BUYERS OR BEARS TAKE CONTROL? 🚨🐂
📌 This isn’t just another support zone – this is the 200-week moving average, the line in the sand that has turned Bitcoin around from every major correction since 2015. Buyers are defending it like a fortress, but volume is thinning on approach – a classic setup for an explosive move.
📊 The last two July/August retests of this level triggered multi-month rallies. If history echoes, the foundation for Q4 momentum is being laid right now. A weekly close below, however, opens the door for deeper liquidity grabs before recovery. 💡 Which side of this battle are you positioning for? 💬
⚠️ Not financial advice. Always manage your risk. 🛡️
🏷️ #BTC #200WeekMA #Bitcoin #SupportTest #Crypto
🐂 🛡️
📌 This isn’t just another support zone – this is the 200-week moving average, the line in the sand that has turned Bitcoin around from every major correction since 2015. Buyers are defending it like a fortress, but volume is thinning on approach – a classic setup for an explosive move.
📊 The last two July/August retests of this level triggered multi-month rallies. If history echoes, the foundation for Q4 momentum is being laid right now. A weekly close below, however, opens the door for deeper liquidity grabs before recovery. 💡 Which side of this battle are you positioning for? 💬
⚠️ Not financial advice. Always manage your risk. 🛡️
🏷️ #BTC #200WeekMA #Bitcoin #SupportTest #Crypto
🐂 🛡️
15
Log in to explore more content
Join global crypto users on Binance Square
⚡️ Get latest and useful information about crypto.
💬 Trusted by the world’s largest crypto exchange.
👍 Discover real insights from verified creators.
Email / Phone number
Trending Topics
1
#DriftHackVictimsBeginClaims
2,240 views
65 Discussing
2
#SolanaTokenizedStockVolumeTops$4.4BInSeptember
959 views
16 Discussing
3
#BitcoinSpotETFsDraw$6.34BInflowsInQ3
8,612 views
125 Discussing
4
#EthereumValidatorExitQueueJumps392%
167,244 views
1,257 Discussing
5
#IMFApprovesElSalvador$138MWithBitcoinWaiver
15,891 views
79 Discussing
6
#SECHaltsCryptoETFReviewsAmidFundingLapse
302,387 views
2,069 Discussing
7
#ZcashETFPostsFirstWeeklyOutflow$93.6M
101,011 views
263 Discussing
8
#GreekPoliceBustCryptoScamRingArrest17
417,147 views
2,667 Discussing
9
#BitcoinRejectedAt$87K
234,339 views
333 Discussing
10
#FedOctoberRateHikeOddsFallTo17%
432,163 views
2,792 Discussing