
#017
017
88 views
4 Discussing
Hot
Latest

·
--
【Structure Watch #017|$BTC 4H】Both highs and lows are rising, yet price is hugging the bottom of the range
Previous check-in: The BTC range of 82,104–85,513 marked at 08:00 today is invalidated; the current price of 81,715 has fallen below 82,104.
At 20:00, the current price is 81,715, down 2.09% over 24 hours, with a trading volume of 17.565 billion U. The intraday high was 84,875 and the low was 81,606.
① Structure: Over the last 30 4H candles, both highs and lows have risen in tandem. The range is 80,841–84,499, with a width of 4.5%. The current price is only at the 24th percentile of the range, hugging its lower boundary. MA25 is at 82,450, above the current price. Its slope over the last 5 candles is +0.19%, flattening out with a slight upward tilt.
② Volume and price: Volume over the last 10 candles is 1.42 times that of the preceding 30, a clear surge. But only 4 of those 10 candles closed higher. Volume has come in, but price hasn't followed through—that's the most awkward part of this structure.
③ Confluence: Around 82,238–82,450 above, Fib 0.618 and MA25 overlap, with two indicators converging in the same zone. Below, 80,490–81,467 has only one indicator, so its reliability should be discounted.
④ Funding and positioning: The funding rate is -0.0031%, meaning shorts are paying. Open interest changed by -3.18% over 7 4H candles, suggesting positions are being unwound. The long/short account ratio is 1.51. Price is hugging the bottom of the range, while leveraged positions are being reduced.
Watch zones: 82,238–83,225 above; 80,490–81,467 below.
1H view: The range over the last 12 hours is 81,606–84,330. The latest close is at the 4th percentile, essentially hugging the bottom of that 12-hour range.
Invalidation: If a 4H candle closes above 83,225 or below 80,490, this analysis is invalidated.
The 82,238 Fib level above and the 82,450 MA25 are very close together. I'm watching to see whether they separate first or get taken out together. Which level are you watching?
This is a record of market structure based on publicly available data, not investment advice. You are responsible for your own gains and losses.
$BTC
#技术分析 #合约交易 #Bitcoin
【Structure Watch #017|$BTC 4H】Both highs and lows are rising, yet price is hugging the bottom of the range
Previous check-in: The BTC range of 82,104–85,513 marked at 08:00 today is invalidated; the current price of 81,715 has fallen below 82,104.
At 20:00, the current price is 81,715, down 2.09% over 24 hours, with a trading volume of 17.565 billion U. The intraday high was 84,875 and the low was 81,606.
① Structure: Over the last 30 4H candles, both highs and lows have risen in tandem. The range is 80,841–84,499, with a width of 4.5%. The current price is only at the 24th percentile of the range, hugging its lower boundary. MA25 is at 82,450, above the current price. Its slope over the last 5 candles is +0.19%, flattening out with a slight upward tilt.
② Volume and price: Volume over the last 10 candles is 1.42 times that of the preceding 30, a clear surge. But only 4 of those 10 candles closed higher. Volume has come in, but price hasn't followed through—that's the most awkward part of this structure.
③ Confluence: Around 82,238–82,450 above, Fib 0.618 and MA25 overlap, with two indicators converging in the same zone. Below, 80,490–81,467 has only one indicator, so its reliability should be discounted.
④ Funding and positioning: The funding rate is -0.0031%, meaning shorts are paying. Open interest changed by -3.18% over 7 4H candles, suggesting positions are being unwound. The long/short account ratio is 1.51. Price is hugging the bottom of the range, while leveraged positions are being reduced.
Watch zones: 82,238–83,225 above; 80,490–81,467 below.
1H view: The range over the last 12 hours is 81,606–84,330. The latest close is at the 4th percentile, essentially hugging the bottom of that 12-hour range.
Invalidation: If a 4H candle closes above 83,225 or below 80,490, this analysis is invalidated.
The 82,238 Fib level above and the 82,450 MA25 are very close together. I'm watching to see whether they separate first or get taken out together. Which level are you watching?
This is a record of market structure based on publicly available data, not investment advice. You are responsible for your own gains and losses.
$BTC
#技术分析 #合约交易 #Bitcoin
Previous check-in: The BTC range of 82,104–85,513 marked at 08:00 today is invalidated; the current price of 81,715 has fallen below 82,104.
At 20:00, the current price is 81,715, down 2.09% over 24 hours, with a trading volume of 17.565 billion U. The intraday high was 84,875 and the low was 81,606.
① Structure: Over the last 30 4H candles, both highs and lows have risen in tandem. The range is 80,841–84,499, with a width of 4.5%. The current price is only at the 24th percentile of the range, hugging its lower boundary. MA25 is at 82,450, above the current price. Its slope over the last 5 candles is +0.19%, flattening out with a slight upward tilt.
② Volume and price: Volume over the last 10 candles is 1.42 times that of the preceding 30, a clear surge. But only 4 of those 10 candles closed higher. Volume has come in, but price hasn't followed through—that's the most awkward part of this structure.
③ Confluence: Around 82,238–82,450 above, Fib 0.618 and MA25 overlap, with two indicators converging in the same zone. Below, 80,490–81,467 has only one indicator, so its reliability should be discounted.
④ Funding and positioning: The funding rate is -0.0031%, meaning shorts are paying. Open interest changed by -3.18% over 7 4H candles, suggesting positions are being unwound. The long/short account ratio is 1.51. Price is hugging the bottom of the range, while leveraged positions are being reduced.
Watch zones: 82,238–83,225 above; 80,490–81,467 below.
1H view: The range over the last 12 hours is 81,606–84,330. The latest close is at the 4th percentile, essentially hugging the bottom of that 12-hour range.
Invalidation: If a 4H candle closes above 83,225 or below 80,490, this analysis is invalidated.
The 82,238 Fib level above and the 82,450 MA25 are very close together. I'm watching to see whether they separate first or get taken out together. Which level are you watching?
This is a record of market structure based on publicly available data, not investment advice. You are responsible for your own gains and losses.
$BTC
#技术分析 #合约交易 #Bitcoin
4

·
--
⚔️ THE CRYPTO WAR CHRONICLES
BATTLE REPORT #017 — $LINK
{future}(LINKUSDT)
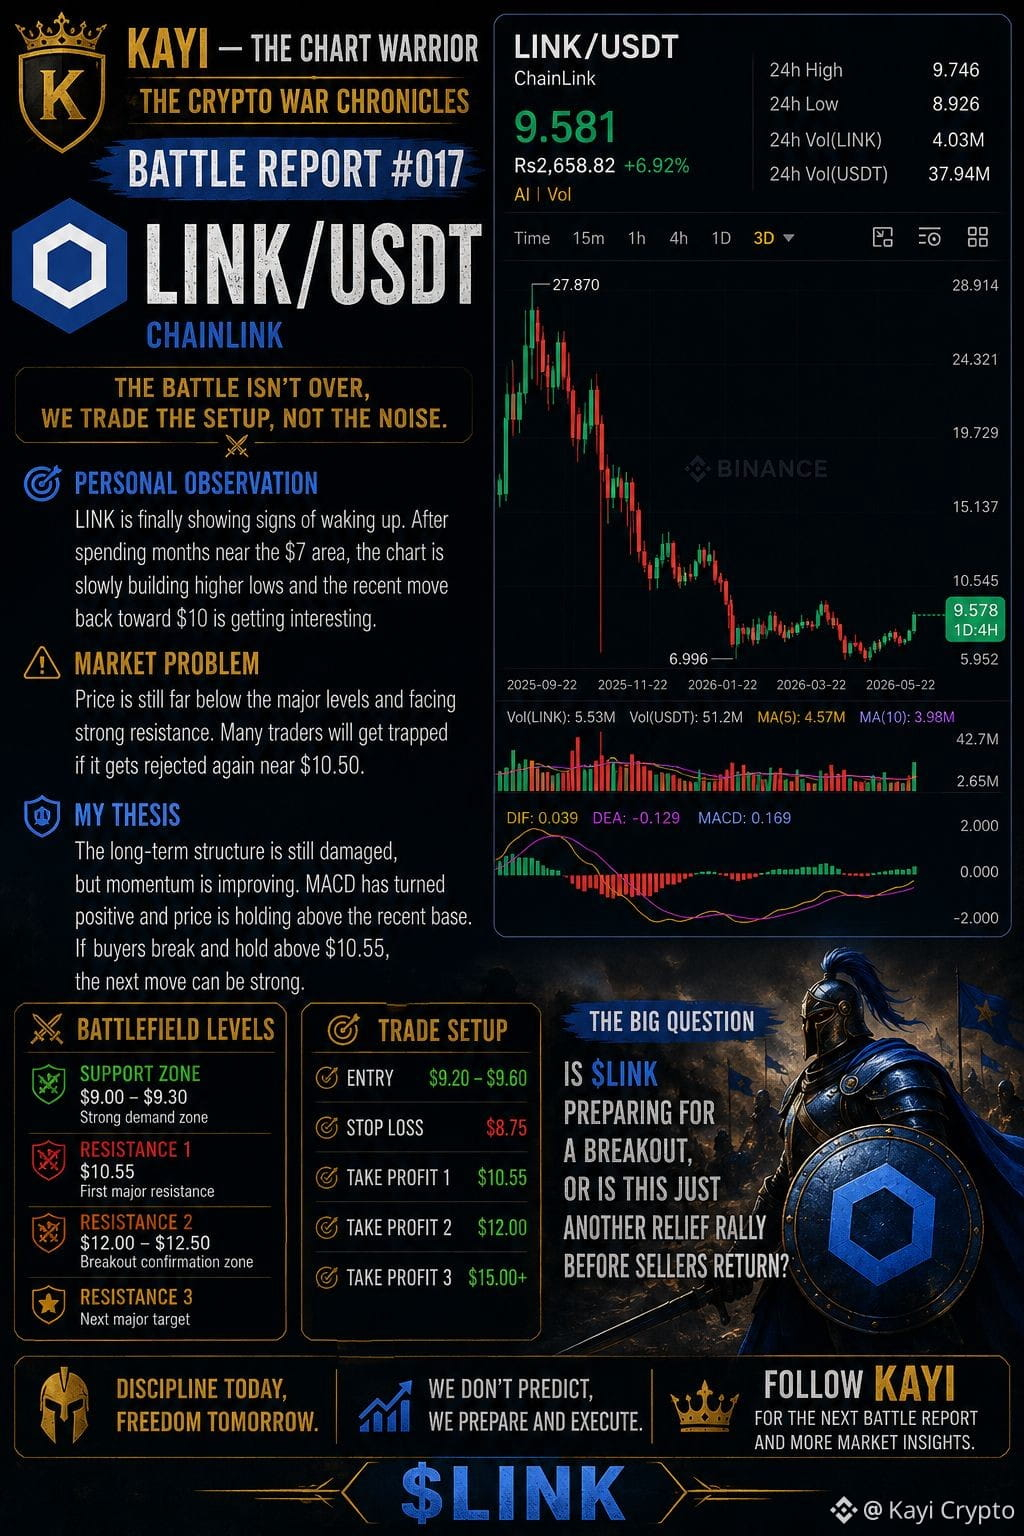
$LINK is finally showing signs of waking up. After spending months near the $7 area, the chart is slowly building higher lows and the recent move back toward $10 is getting interesting. What I’m watching now is simple: can LINK reclaim the $10.55 resistance with real volume, or will this become another rejection?
My thesis: the long-term structure is still damaged, but momentum is improving. MACD has turned positive and price is holding above the recent base. I’m not chasing the green candle here — I’d rather see confirmation or a controlled pullback.
🎯 Battlefield Levels: $9.00–9.30 support zone → $10.55 major resistance → $12.00–12.50 breakout zone → $15.13 next major target.
⚔️ Trade Setup: Entry: $9.20–9.60 | SL: $8.75 | TP1: $10.55 | TP2: $12.00 | TP3: $15.00+
The real question is: Is $LINK preparing for a breakout, or is this just another relief rally before sellers return? 👀 I’ll be watching the $10.55 battlefield closely. Follow KAYI — THE CHART WARRIOR for the next report.
#LINK #KayiCrypto #trading
⚔️ THE CRYPTO WAR CHRONICLES
BATTLE REPORT #017 — $LINK
$LINK is finally showing signs of waking up. After spending months near the $7 area, the chart is slowly building higher lows and the recent move back toward $10 is getting interesting. What I’m watching now is simple: can LINK reclaim the $10.55 resistance with real volume, or will this become another rejection?
My thesis: the long-term structure is still damaged, but momentum is improving. MACD has turned positive and price is holding above the recent base. I’m not chasing the green candle here — I’d rather see confirmation or a controlled pullback.
🎯 Battlefield Levels: $9.00–9.30 support zone → $10.55 major resistance → $12.00–12.50 breakout zone → $15.13 next major target.
⚔️ Trade Setup: Entry: $9.20–9.60 | SL: $8.75 | TP1: $10.55 | TP2: $12.00 | TP3: $15.00+
The real question is: Is $LINK preparing for a breakout, or is this just another relief rally before sellers return? 👀 I’ll be watching the $10.55 battlefield closely. Follow KAYI — THE CHART WARRIOR for the next report.
#LINK #KayiCrypto #trading
BATTLE REPORT #017 — $LINK
$LINK is finally showing signs of waking up. After spending months near the $7 area, the chart is slowly building higher lows and the recent move back toward $10 is getting interesting. What I’m watching now is simple: can LINK reclaim the $10.55 resistance with real volume, or will this become another rejection?
My thesis: the long-term structure is still damaged, but momentum is improving. MACD has turned positive and price is holding above the recent base. I’m not chasing the green candle here — I’d rather see confirmation or a controlled pullback.
🎯 Battlefield Levels: $9.00–9.30 support zone → $10.55 major resistance → $12.00–12.50 breakout zone → $15.13 next major target.
⚔️ Trade Setup: Entry: $9.20–9.60 | SL: $8.75 | TP1: $10.55 | TP2: $12.00 | TP3: $15.00+
The real question is: Is $LINK preparing for a breakout, or is this just another relief rally before sellers return? 👀 I’ll be watching the $10.55 battlefield closely. Follow KAYI — THE CHART WARRIOR for the next report.
#LINK #KayiCrypto #trading
1
105

·
--
Trading Journal #017
The training scenario is pretty ordinary: you open the order book—BTC is at 78621.42000000, while the trending searches, the gainers list, and Alpha’s new TGE all surge forward at the same time. The odd thought is: the more people keep saying “you have to catch it today,” the more you should first check whether BTC can actually stand on its own, rather than being pushed along by the noise around you.
Price that day: BTC 78621.42000000
My choice: wait. There’s only one trigger: BTC has to hold steady around this price first, then consider the next step. Before that condition appears, don’t chase coins that suddenly jump onto the trending list, and don’t treat the point multiplier and the buzz of the new TGE as if they already confirm BTC’s direction. Waiting might cost you a potential run-up that could happen quickly—but you have to own that cost. But if you decide you’re still not done evaluating and then rush in just because the leaderboard swapped in a new batch of names, it’s easy to later mistake “seeing the hype” for “seeing the trend.”
When you open the order book, it’s easiest to blend several signals into one story. The trending list changes its name; the Alpha page pops up a new multiplier—each of these shifts can stir up emotion, yet none of them directly answers where BTC will go next. The lively gainers list at most just shows attention is moving; what BTC is giving you right now is only a price. It could keep rising, or it could churn in place—what’s missing is confirmation, not a story.
So in this drill, I keep only one action: wait. The reason is simple: when the order book slices your attention into many small pieces, the object of your judgment narrows to BTC. Don’t let someone else’s excitement stand in for evidence you still need. In moments like this, you’re most likely to confuse “fear of missing out” as the trigger. Looking back, it’s often not the price that changes the decision, but that instant of impatience.
One more detail to remember: even waiting must have boundaries. Without boundaries, waiting just drags your decision into the future. Too many boundaries, and you’ll turn a small judgment into a whole self-soothing routine. This record accepts only one test: tomorrow at a fixed time, check whether BTC has crossed the same line. If it hasn’t, then today’s waiting decision can’t be packaged as “I got it right early.”
Next day review: Tomorrow at 09:30, verify whether BTC breaks above 78621.42000000; if it does not, then today’s waiting judgment is invalid.
Trading Journal #017
The training scenario is pretty ordinary: you open the order book—BTC is at 78621.42000000, while the trending searches, the gainers list, and Alpha’s new TGE all surge forward at the same time. The odd thought is: the more people keep saying “you have to catch it today,” the more you should first check whether BTC can actually stand on its own, rather than being pushed along by the noise around you.
Price that day: BTC 78621.42000000
My choice: wait. There’s only one trigger: BTC has to hold steady around this price first, then consider the next step. Before that condition appears, don’t chase coins that suddenly jump onto the trending list, and don’t treat the point multiplier and the buzz of the new TGE as if they already confirm BTC’s direction. Waiting might cost you a potential run-up that could happen quickly—but you have to own that cost. But if you decide you’re still not done evaluating and then rush in just because the leaderboard swapped in a new batch of names, it’s easy to later mistake “seeing the hype” for “seeing the trend.”
When you open the order book, it’s easiest to blend several signals into one story. The trending list changes its name; the Alpha page pops up a new multiplier—each of these shifts can stir up emotion, yet none of them directly answers where BTC will go next. The lively gainers list at most just shows attention is moving; what BTC is giving you right now is only a price. It could keep rising, or it could churn in place—what’s missing is confirmation, not a story.
So in this drill, I keep only one action: wait. The reason is simple: when the order book slices your attention into many small pieces, the object of your judgment narrows to BTC. Don’t let someone else’s excitement stand in for evidence you still need. In moments like this, you’re most likely to confuse “fear of missing out” as the trigger. Looking back, it’s often not the price that changes the decision, but that instant of impatience.
One more detail to remember: even waiting must have boundaries. Without boundaries, waiting just drags your decision into the future. Too many boundaries, and you’ll turn a small judgment into a whole self-soothing routine. This record accepts only one test: tomorrow at a fixed time, check whether BTC has crossed the same line. If it hasn’t, then today’s waiting decision can’t be packaged as “I got it right early.”
Next day review: Tomorrow at 09:30, verify whether BTC breaks above 78621.42000000; if it does not, then today’s waiting judgment is invalid.
The training scenario is pretty ordinary: you open the order book—BTC is at 78621.42000000, while the trending searches, the gainers list, and Alpha’s new TGE all surge forward at the same time. The odd thought is: the more people keep saying “you have to catch it today,” the more you should first check whether BTC can actually stand on its own, rather than being pushed along by the noise around you.
Price that day: BTC 78621.42000000
My choice: wait. There’s only one trigger: BTC has to hold steady around this price first, then consider the next step. Before that condition appears, don’t chase coins that suddenly jump onto the trending list, and don’t treat the point multiplier and the buzz of the new TGE as if they already confirm BTC’s direction. Waiting might cost you a potential run-up that could happen quickly—but you have to own that cost. But if you decide you’re still not done evaluating and then rush in just because the leaderboard swapped in a new batch of names, it’s easy to later mistake “seeing the hype” for “seeing the trend.”
When you open the order book, it’s easiest to blend several signals into one story. The trending list changes its name; the Alpha page pops up a new multiplier—each of these shifts can stir up emotion, yet none of them directly answers where BTC will go next. The lively gainers list at most just shows attention is moving; what BTC is giving you right now is only a price. It could keep rising, or it could churn in place—what’s missing is confirmation, not a story.
So in this drill, I keep only one action: wait. The reason is simple: when the order book slices your attention into many small pieces, the object of your judgment narrows to BTC. Don’t let someone else’s excitement stand in for evidence you still need. In moments like this, you’re most likely to confuse “fear of missing out” as the trigger. Looking back, it’s often not the price that changes the decision, but that instant of impatience.
One more detail to remember: even waiting must have boundaries. Without boundaries, waiting just drags your decision into the future. Too many boundaries, and you’ll turn a small judgment into a whole self-soothing routine. This record accepts only one test: tomorrow at a fixed time, check whether BTC has crossed the same line. If it hasn’t, then today’s waiting decision can’t be packaged as “I got it right early.”
Next day review: Tomorrow at 09:30, verify whether BTC breaks above 78621.42000000; if it does not, then today’s waiting judgment is invalid.
155
Log in to explore more content
Join global crypto users on Binance Square
⚡️ Get latest and useful information about crypto.
💬 Trusted by the world’s largest crypto exchange.
👍 Discover real insights from verified creators.
Email / Phone number
Trending Topics
1
#HuangExitNvidiaStrategyInFocus
99,683 views
1,095 Discussing
2
#AnthropicRejectsIPODelayValuationinQuestion
705,749 views
5,341 Discussing
3
#HedgeFundsCMEBitcoinNetShortsFall89%
0 views
8 Discussing
4
#BitMineReports$6.3BNetLossForFiscal2026
12,921 views
134 Discussing
5
#AnthropicIPOAboutSixTimesOversubscribed
0 views
6 Discussing
6
#SoFiExpandsSoFiUSDStablecoinToPolygon
1,256 views
39 Discussing
7
#TetherGoldXAUTCompletesKPMGAudit
655 views
33 Discussing
8
#ChipStocksExtendLossesAfterNvidiaCEOChange
40,788 views
485 Discussing
9
#TrezorConfirmsMaliciousImplantsIn3Safe5Devices
220 views
17 Discussing
10
#TradFiForBeginners
537,362 views
3,747 Discussing