
交易中成长
200 Posts

交易中成长
Report
Block User
Rule No.1: Never lose money. Rule No.2: Never forget rule No.1.
Open Trade
High-Frequency Trader
2.2 Years
9 Following
41 Followers
57 Liked
Posts
Portfolio
·
--
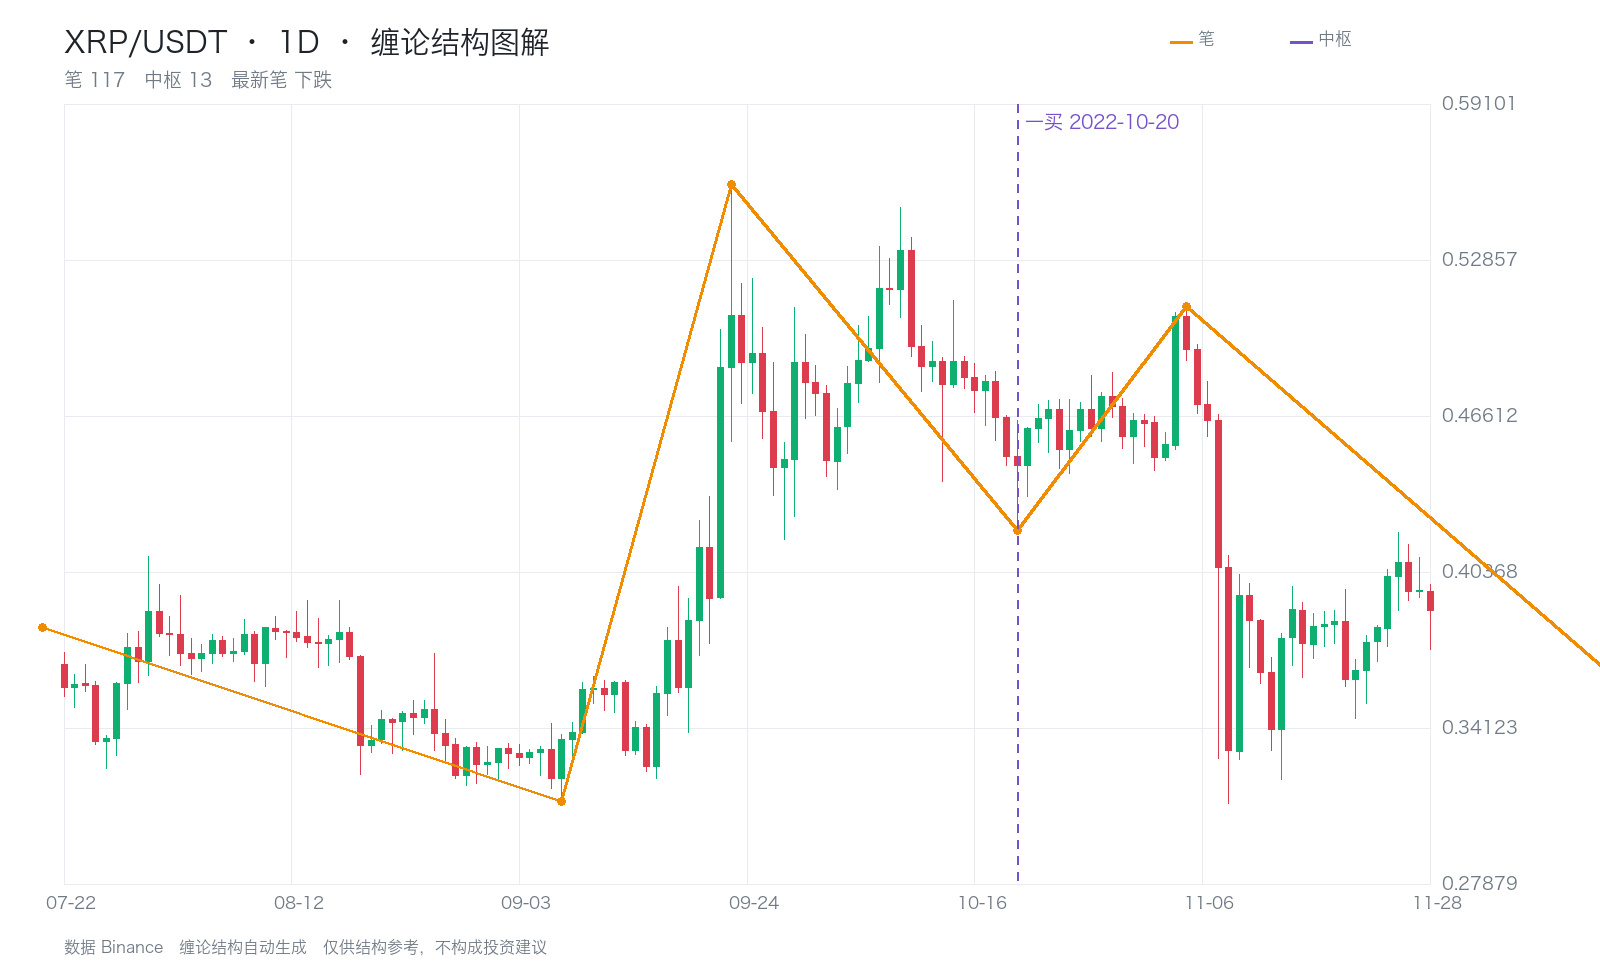
Review of a historical case: On October 20, 2022, the engine identified XRP’s 1-day structure as a first buy point.
The signal’s reference level for the central pivot was 0.33550, and the signal price of 0.42020 was above the pivot’s upper boundary of 0.33550.
Over the next 20 candlesticks, the price reached a high of 0.51000, representing a maximum favorable move of 21.4% relative to the marked price; the closing price at the end of the window was 0.33210.
A review should also consider the adverse price movement along the way, rather than focusing only on how much ground was ultimately covered.
This is a retrospective review of the structure. The period’s high and low prices are not equivalent to actual trading returns, nor do they mean that the signal could already have been confirmed at the time.
$XRP $BTC $ETH #缠论 #Lighter安全事件 #Solana payment
Review of a historical case: On October 20, 2022, the engine identified XRP’s 1-day structure as a first buy point.
The signal’s reference level for the central pivot was 0.33550, and the signal price of 0.42020 was above the pivot’s upper boundary of 0.33550.
Over the next 20 candlesticks, the price reached a high of 0.51000, representing a maximum favorable move of 21.4% relative to the marked price; the closing price at the end of the window was 0.33210.
A review should also consider the adverse price movement along the way, rather than focusing only on how much ground was ultimately covered.
This is a retrospective review of the structure. The period’s high and low prices are not equivalent to actual trading returns, nor do they mean that the signal could already have been confirmed at the time.
$XRP $BTC $ETH #缠论 #Lighter安全事件 #Solana payment
The signal’s reference level for the central pivot was 0.33550, and the signal price of 0.42020 was above the pivot’s upper boundary of 0.33550.
Over the next 20 candlesticks, the price reached a high of 0.51000, representing a maximum favorable move of 21.4% relative to the marked price; the closing price at the end of the window was 0.33210.
A review should also consider the adverse price movement along the way, rather than focusing only on how much ground was ultimately covered.
This is a retrospective review of the structure. The period’s high and low prices are not equivalent to actual trading returns, nor do they mean that the signal could already have been confirmed at the time.
$XRP $BTC $ETH #缠论 #Lighter安全事件 #Solana payment
207
·
--
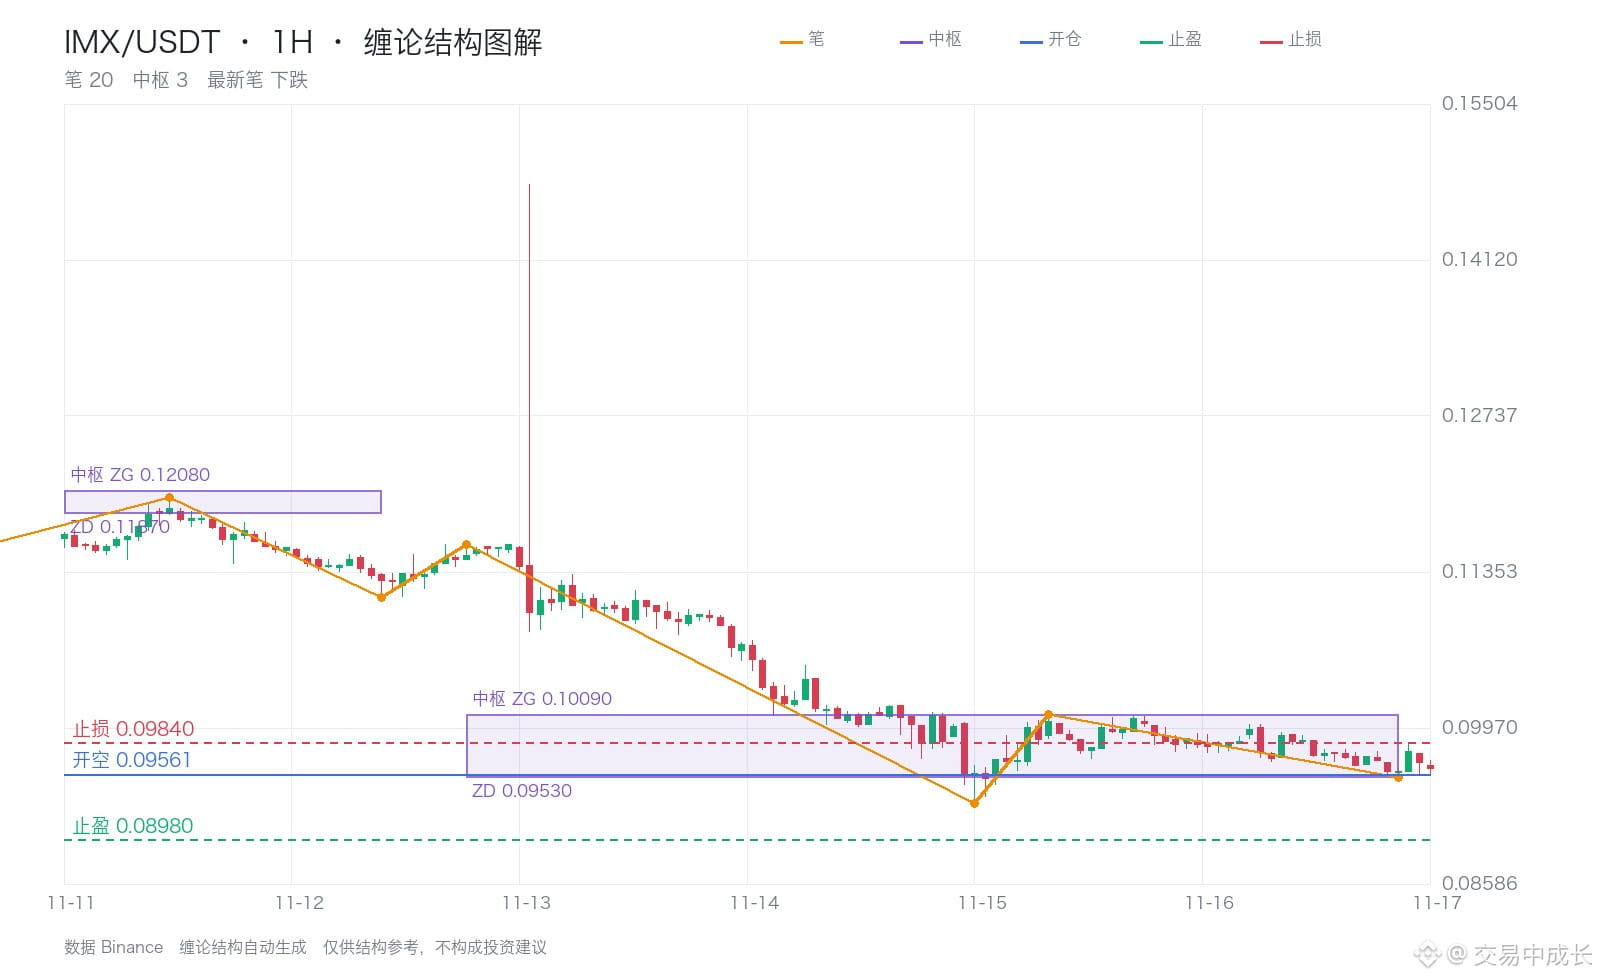
The IMX 1-hour trade entry was marked as a third sell point, with a short entry price of 0.09561.
Based on the most recent pivot zone selected during the review, the range is 0.09530–0.10090, and the price is within the zone.
To confirm a third sell point, check whether the pullback on the lower timeframe after breaking below the original pivot zone failed to return to the zone. The current price's position alone is not enough.
This snapshot of the most recent pivot zone cannot independently verify the third sell point at entry. The pivot zone and pullback corresponding to the original signal also need to be checked.
On higher timeframes, the 4-hour chart is below its pivot zone, and the daily chart is below its pivot zone. These structures provide context but cannot replace confirmation of buy and sell points on this timeframe.
The stop-loss recorded at entry was 0.09840 (about 2.9% from the entry price), and the target price was 0.08980. Subsequent position reductions and exits are subject to actual fills.
$IMX $BTC $ETH #缠论 #Lighter安全事件 #Solana payment
The IMX 1-hour trade entry was marked as a third sell point, with a short entry price of 0.09561.
Based on the most recent pivot zone selected during the review, the range is 0.09530–0.10090, and the price is within the zone.
To confirm a third sell point, check whether the pullback on the lower timeframe after breaking below the original pivot zone failed to return to the zone. The current price's position alone is not enough.
This snapshot of the most recent pivot zone cannot independently verify the third sell point at entry. The pivot zone and pullback corresponding to the original signal also need to be checked.
On higher timeframes, the 4-hour chart is below its pivot zone, and the daily chart is below its pivot zone. These structures provide context but cannot replace confirmation of buy and sell points on this timeframe.
The stop-loss recorded at entry was 0.09840 (about 2.9% from the entry price), and the target price was 0.08980. Subsequent position reductions and exits are subject to actual fills.
$IMX $BTC $ETH #缠论 #Lighter安全事件 #Solana payment
Based on the most recent pivot zone selected during the review, the range is 0.09530–0.10090, and the price is within the zone.
To confirm a third sell point, check whether the pullback on the lower timeframe after breaking below the original pivot zone failed to return to the zone. The current price's position alone is not enough.
This snapshot of the most recent pivot zone cannot independently verify the third sell point at entry. The pivot zone and pullback corresponding to the original signal also need to be checked.
On higher timeframes, the 4-hour chart is below its pivot zone, and the daily chart is below its pivot zone. These structures provide context but cannot replace confirmation of buy and sell points on this timeframe.
The stop-loss recorded at entry was 0.09840 (about 2.9% from the entry price), and the target price was 0.08980. Subsequent position reductions and exits are subject to actual fills.
$IMX $BTC $ETH #缠论 #Lighter安全事件 #Solana payment
·
--
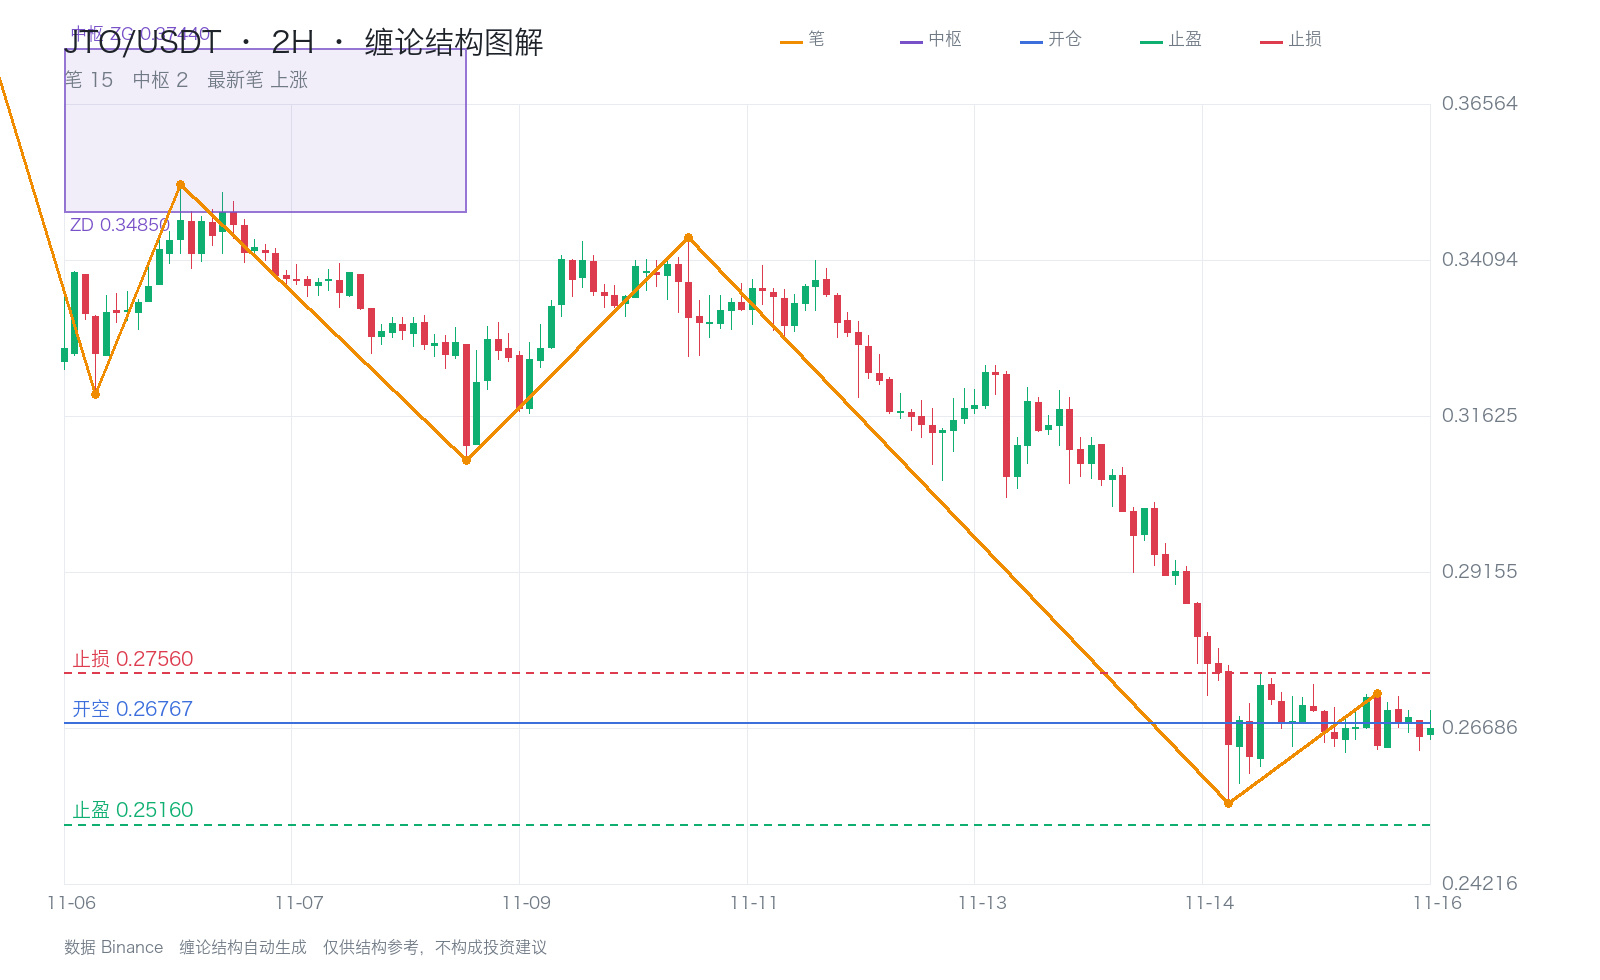
The JTO 2-hour trade entry was marked as a third sell point, with a short entry price of 0.26767.
Looking at the most recent central zone selected during the review, the range is 0.34850–0.37440, and the price is below the zone.
To confirm a third sell point, check whether the pullback on the lower timeframe after breaking below the original central zone failed to return to the zone; the current price’s position alone is not enough.
On higher timeframes, the 4-hour and daily charts are both below their central zones. These structures provide context but cannot replace confirmation of buy and sell points on this timeframe.
The stop-loss price recorded at entry was 0.27560 (about 3.0% from the entry), and the target price was 0.25160. Subsequent position reductions and exits are subject to actual fills.
$JTO $BTC $ETH #缠论 #NVIDIA
The JTO 2-hour trade entry was marked as a third sell point, with a short entry price of 0.26767.
Looking at the most recent central zone selected during the review, the range is 0.34850–0.37440, and the price is below the zone.
To confirm a third sell point, check whether the pullback on the lower timeframe after breaking below the original central zone failed to return to the zone; the current price’s position alone is not enough.
On higher timeframes, the 4-hour and daily charts are both below their central zones. These structures provide context but cannot replace confirmation of buy and sell points on this timeframe.
The stop-loss price recorded at entry was 0.27560 (about 3.0% from the entry), and the target price was 0.25160. Subsequent position reductions and exits are subject to actual fills.
$JTO $BTC $ETH #缠论 #NVIDIA
Looking at the most recent central zone selected during the review, the range is 0.34850–0.37440, and the price is below the zone.
To confirm a third sell point, check whether the pullback on the lower timeframe after breaking below the original central zone failed to return to the zone; the current price’s position alone is not enough.
On higher timeframes, the 4-hour and daily charts are both below their central zones. These structures provide context but cannot replace confirmation of buy and sell points on this timeframe.
The stop-loss price recorded at entry was 0.27560 (about 3.0% from the entry), and the target price was 0.25160. Subsequent position reductions and exits are subject to actual fills.
$JTO $BTC $ETH #缠论 #NVIDIA
1
·
--
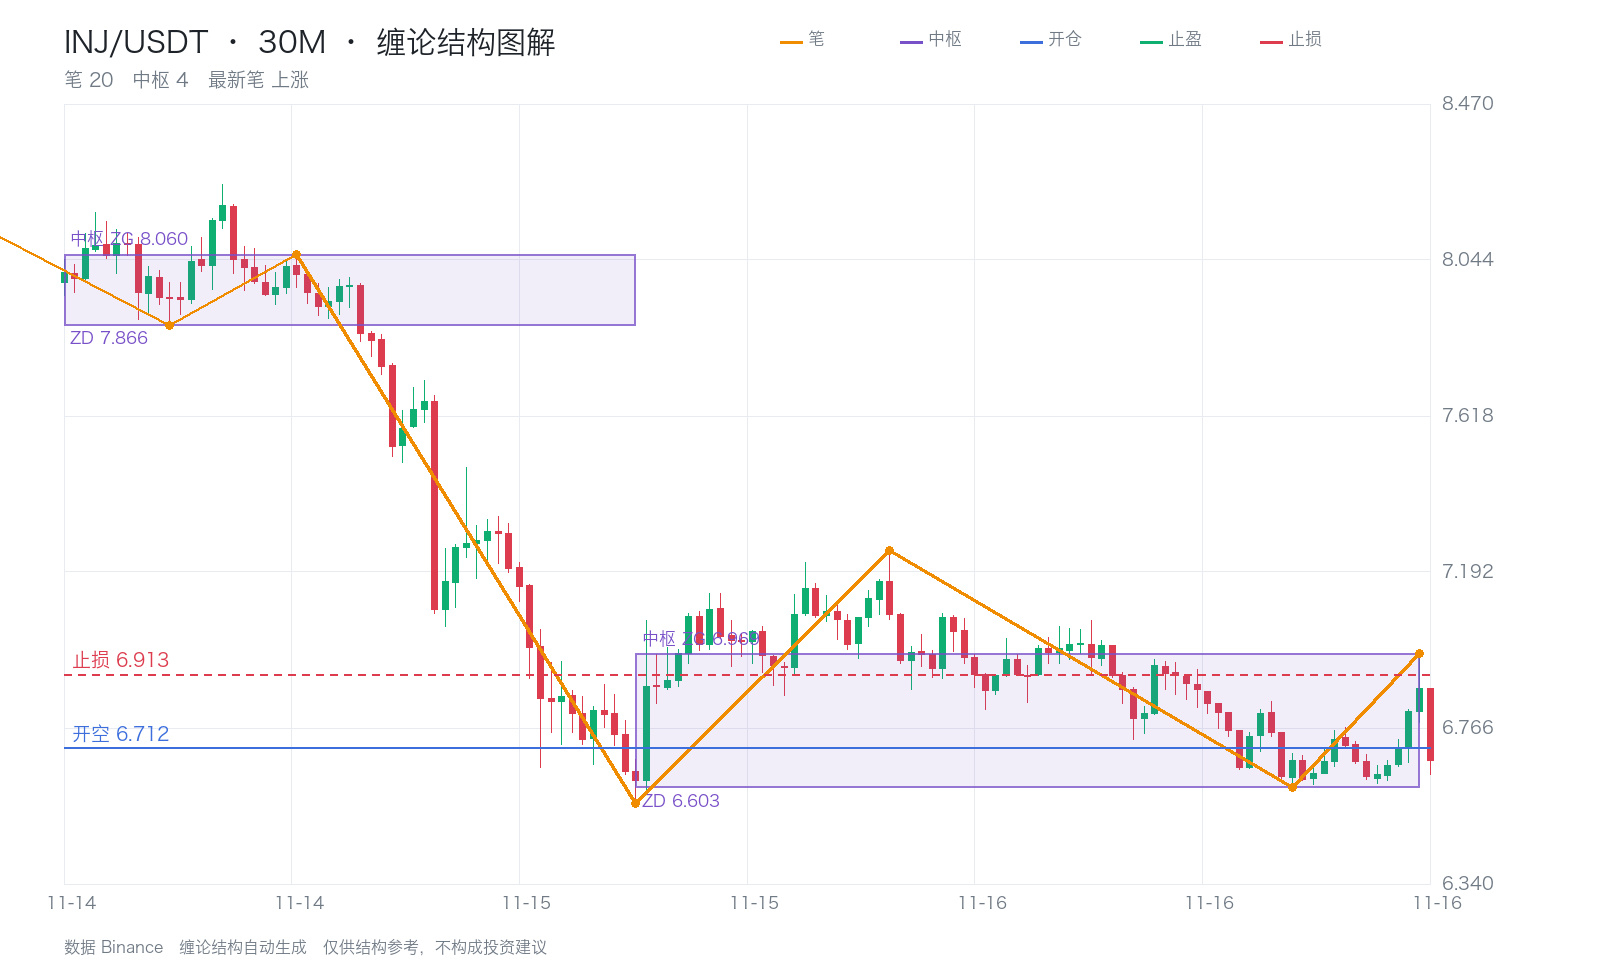
The opening record for the INJ 30m trade is marked as a third sell, with a short entry price of 6.712.
Based on the most recent center range selected during the review, the range is 6.603–6.969, and the price is within the center range.
A third sell requires checking whether the secondary-level pullback after breaking below the original center range failed to return to the center range; it cannot be judged solely by which side the current price is on.
This latest center-range snapshot cannot independently verify the third sell at the time of entry; it must be compared with the center range corresponding to the original signal and the pullback process.
Looking at a higher timeframe, the 4-hour chart is below the center range, and the daily chart is below the center range. These structures provide context and cannot replace confirmation of the buy/sell point at this timeframe.
The stop-loss price recorded at entry was 6.913 (about 3.0% away from entry), and the target price was 6.308. Subsequent position reduction and exit should be based on actual execution.
$INJ $BTC $ETH #缠论 #NVIDIA
The opening record for the INJ 30m trade is marked as a third sell, with a short entry price of 6.712.
Based on the most recent center range selected during the review, the range is 6.603–6.969, and the price is within the center range.
A third sell requires checking whether the secondary-level pullback after breaking below the original center range failed to return to the center range; it cannot be judged solely by which side the current price is on.
This latest center-range snapshot cannot independently verify the third sell at the time of entry; it must be compared with the center range corresponding to the original signal and the pullback process.
Looking at a higher timeframe, the 4-hour chart is below the center range, and the daily chart is below the center range. These structures provide context and cannot replace confirmation of the buy/sell point at this timeframe.
The stop-loss price recorded at entry was 6.913 (about 3.0% away from entry), and the target price was 6.308. Subsequent position reduction and exit should be based on actual execution.
$INJ $BTC $ETH #缠论 #NVIDIA
Based on the most recent center range selected during the review, the range is 6.603–6.969, and the price is within the center range.
A third sell requires checking whether the secondary-level pullback after breaking below the original center range failed to return to the center range; it cannot be judged solely by which side the current price is on.
This latest center-range snapshot cannot independently verify the third sell at the time of entry; it must be compared with the center range corresponding to the original signal and the pullback process.
Looking at a higher timeframe, the 4-hour chart is below the center range, and the daily chart is below the center range. These structures provide context and cannot replace confirmation of the buy/sell point at this timeframe.
The stop-loss price recorded at entry was 6.913 (about 3.0% away from entry), and the target price was 6.308. Subsequent position reduction and exit should be based on actual execution.
$INJ $BTC $ETH #缠论 #NVIDIA
7
·
--
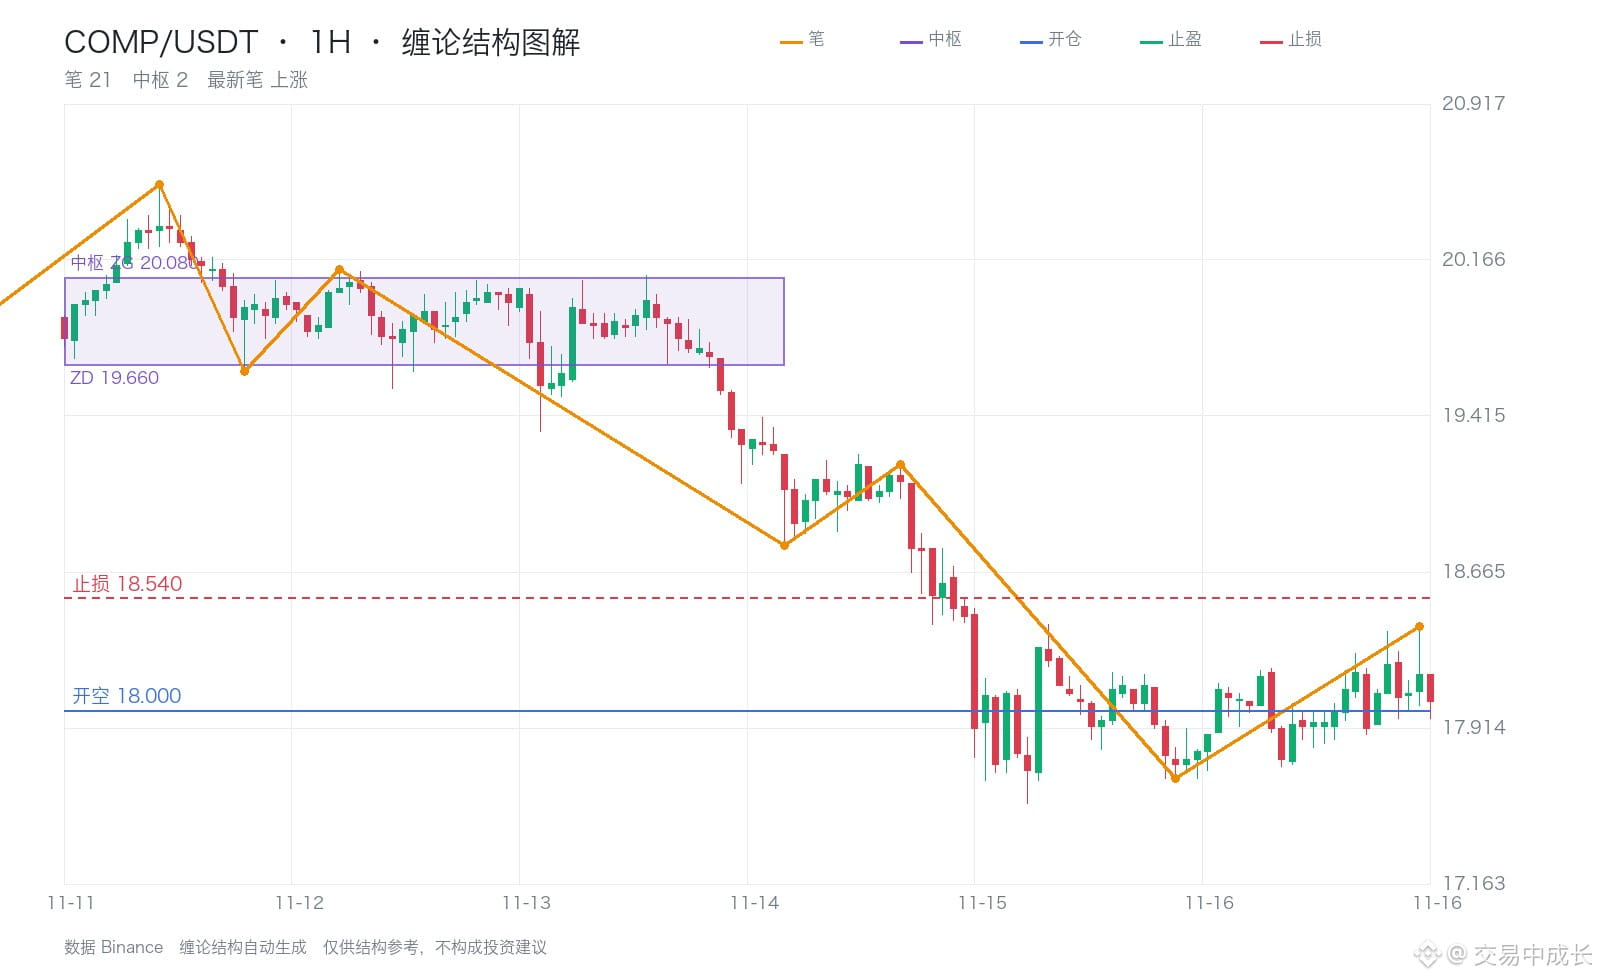
The COMP 1h trade entry was marked as a third sell, with a short entry price of 18.000.
Based on the most recent central zone selected during the review, the range is 19.660–20.080, and the price is below the zone.
To confirm a third sell, check whether the lower-level rebound after breaking below the original central zone failed to return to the zone; you cannot determine it just by looking at which side the current price is on.
On higher timeframes, the 4-hour chart is below its central zone, and the daily chart is below its central zone. These structures provide context, but cannot replace confirmation of buy and sell points on this timeframe.
The stop-loss price recorded at entry was 18.540 (about 3.0% from entry), and the target price was 16.920. Subsequent position reductions and exits are based on actual fills.
$COMP $BTC $ETH #缠论 #Nvidia
The COMP 1h trade entry was marked as a third sell, with a short entry price of 18.000.
Based on the most recent central zone selected during the review, the range is 19.660–20.080, and the price is below the zone.
To confirm a third sell, check whether the lower-level rebound after breaking below the original central zone failed to return to the zone; you cannot determine it just by looking at which side the current price is on.
On higher timeframes, the 4-hour chart is below its central zone, and the daily chart is below its central zone. These structures provide context, but cannot replace confirmation of buy and sell points on this timeframe.
The stop-loss price recorded at entry was 18.540 (about 3.0% from entry), and the target price was 16.920. Subsequent position reductions and exits are based on actual fills.
$COMP $BTC $ETH #缠论 #Nvidia
Based on the most recent central zone selected during the review, the range is 19.660–20.080, and the price is below the zone.
To confirm a third sell, check whether the lower-level rebound after breaking below the original central zone failed to return to the zone; you cannot determine it just by looking at which side the current price is on.
On higher timeframes, the 4-hour chart is below its central zone, and the daily chart is below its central zone. These structures provide context, but cannot replace confirmation of buy and sell points on this timeframe.
The stop-loss price recorded at entry was 18.540 (about 3.0% from entry), and the target price was 16.920. Subsequent position reductions and exits are based on actual fills.
$COMP $BTC $ETH #缠论 #Nvidia
·
--
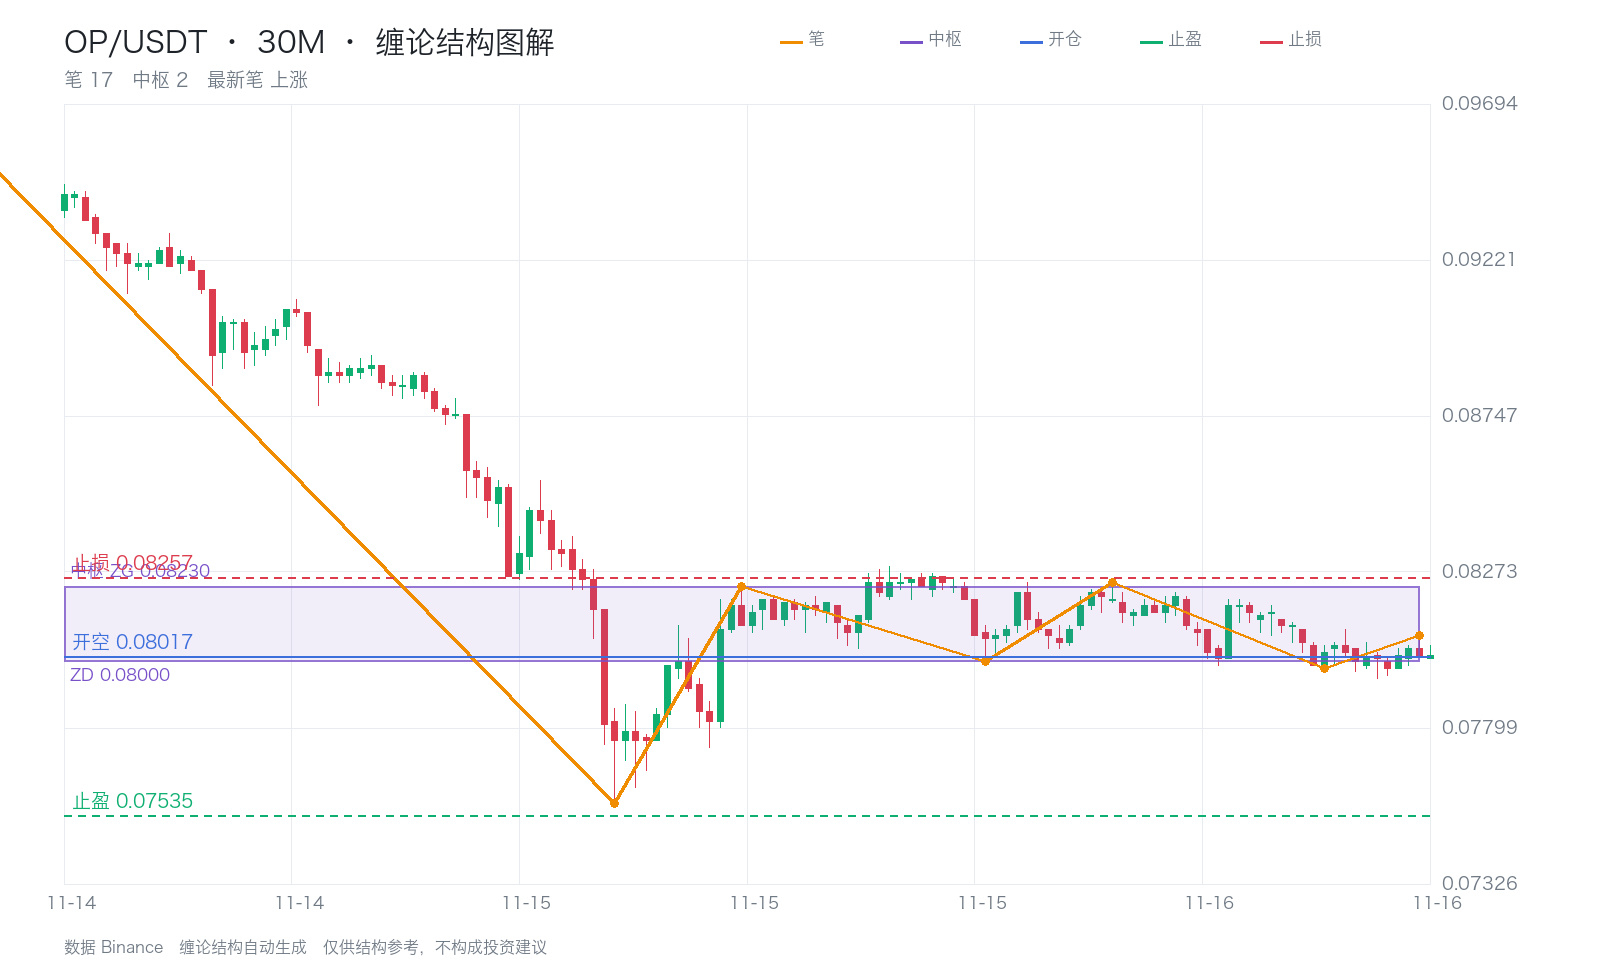
The OP 30m trade entry was marked as a third sell point, with a short entry price of 0.08017.
Based on the most recent central zone selected during the review, the range is 0.08000–0.08230, and the price is within the zone.
To confirm a third sell point, check whether the pullback on the next lower timeframe after breaking below the original central zone failed to return to the zone; you cannot determine this solely from which side of the zone the current price is on.
This snapshot of the most recent central zone cannot by itself verify that the entry was a third sell point. You also need to compare it with the central zone and pullback process corresponding to the original signal.
On higher timeframes, the 4-hour chart is below its central zone, and the daily chart is below its central zone. These structures provide context but cannot replace confirmation of buy and sell points on this timeframe.
The stop-loss recorded at entry was 0.08257 (about 3.0% from the entry price), and the target price was 0.07535. Subsequent position reductions and exits should be based on actual fills.
$OP $BTC $ETH #缠论 #NVIDIA
The OP 30m trade entry was marked as a third sell point, with a short entry price of 0.08017.
Based on the most recent central zone selected during the review, the range is 0.08000–0.08230, and the price is within the zone.
To confirm a third sell point, check whether the pullback on the next lower timeframe after breaking below the original central zone failed to return to the zone; you cannot determine this solely from which side of the zone the current price is on.
This snapshot of the most recent central zone cannot by itself verify that the entry was a third sell point. You also need to compare it with the central zone and pullback process corresponding to the original signal.
On higher timeframes, the 4-hour chart is below its central zone, and the daily chart is below its central zone. These structures provide context but cannot replace confirmation of buy and sell points on this timeframe.
The stop-loss recorded at entry was 0.08257 (about 3.0% from the entry price), and the target price was 0.07535. Subsequent position reductions and exits should be based on actual fills.
$OP $BTC $ETH #缠论 #NVIDIA
Based on the most recent central zone selected during the review, the range is 0.08000–0.08230, and the price is within the zone.
To confirm a third sell point, check whether the pullback on the next lower timeframe after breaking below the original central zone failed to return to the zone; you cannot determine this solely from which side of the zone the current price is on.
This snapshot of the most recent central zone cannot by itself verify that the entry was a third sell point. You also need to compare it with the central zone and pullback process corresponding to the original signal.
On higher timeframes, the 4-hour chart is below its central zone, and the daily chart is below its central zone. These structures provide context but cannot replace confirmation of buy and sell points on this timeframe.
The stop-loss recorded at entry was 0.08257 (about 3.0% from the entry price), and the target price was 0.07535. Subsequent position reductions and exits should be based on actual fills.
$OP $BTC $ETH #缠论 #NVIDIA
17
·
--
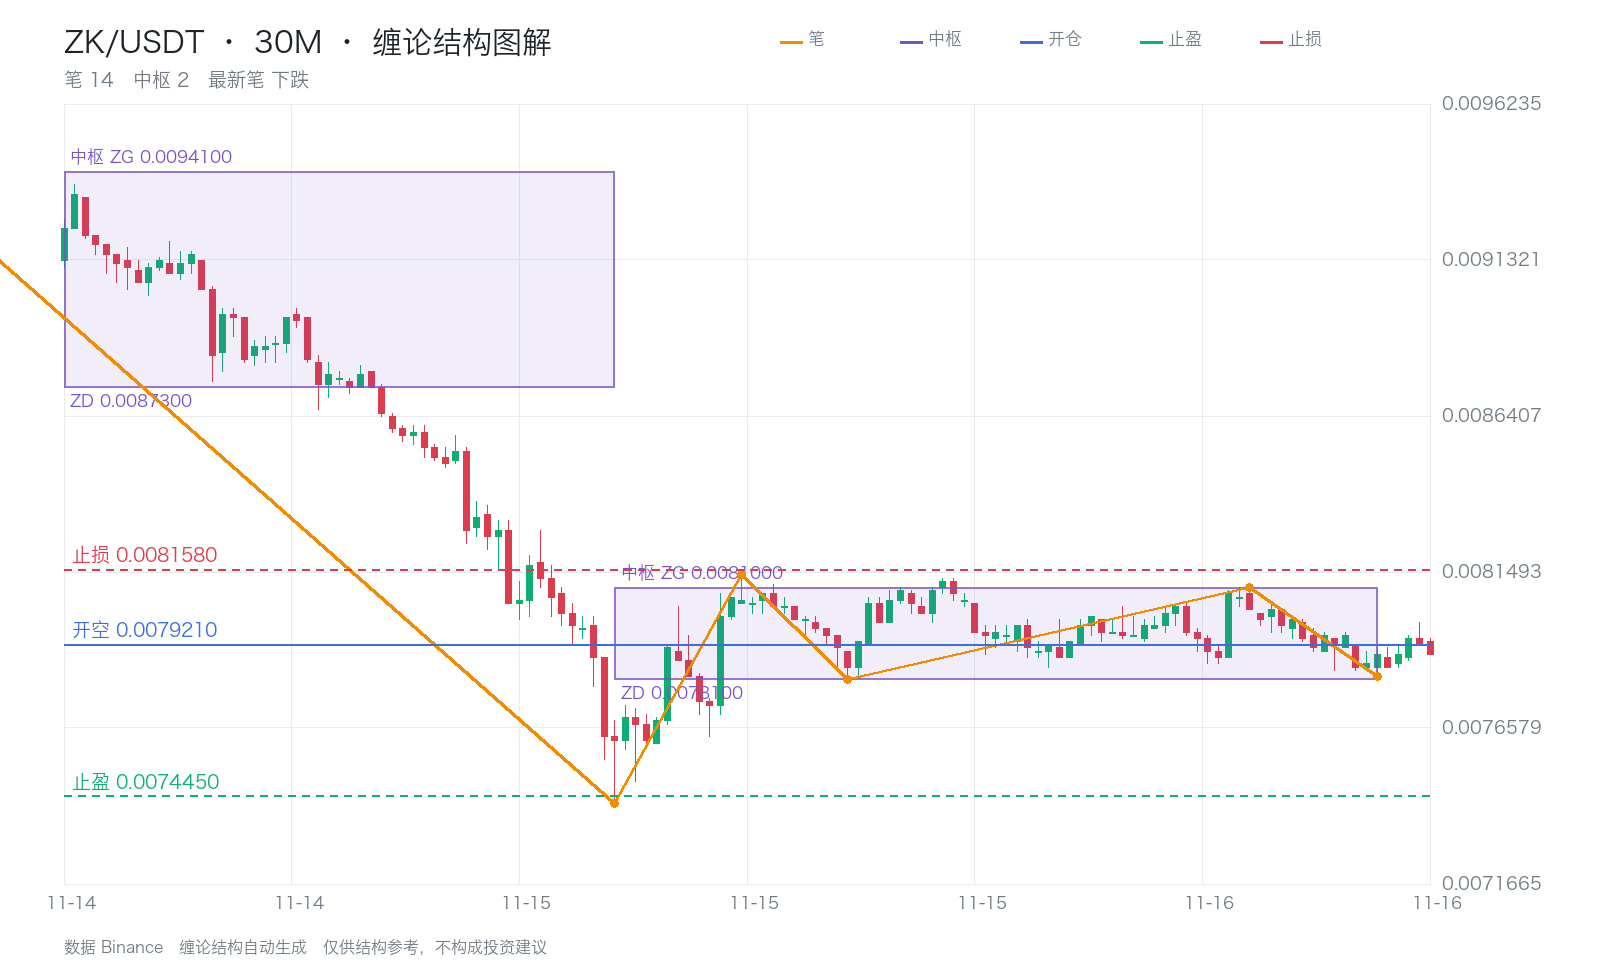
The ZK 30m trade opening record is marked as a third sell point, with a short entry price of 0.0079210.
Based on the nearest central zone selected during the review, the range is 0.0078100–0.0081000, and the price is within the zone.
To confirm a third sell point, check whether the pullback on the lower timeframe after breaking below the original central zone failed to return to the zone; you cannot determine this solely from which side the current price is on.
This snapshot of the most recent central zone cannot, by itself, verify the third sell point at entry. You also need to compare it with the central zone and pullback process corresponding to the original signal.
On higher timeframes, the 4-hour chart is below its central zone, as is the daily chart. These structures provide context but cannot replace confirmation of buy or sell points on this timeframe.
The stop-loss recorded at entry was 0.0081580 (about 3.0% from the entry price), and the target price was 0.0074450. Subsequent position reductions and exits should be based on actual executions.
$ZK $BTC $ETH #缠论 #NVIDIA
The ZK 30m trade opening record is marked as a third sell point, with a short entry price of 0.0079210.
Based on the nearest central zone selected during the review, the range is 0.0078100–0.0081000, and the price is within the zone.
To confirm a third sell point, check whether the pullback on the lower timeframe after breaking below the original central zone failed to return to the zone; you cannot determine this solely from which side the current price is on.
This snapshot of the most recent central zone cannot, by itself, verify the third sell point at entry. You also need to compare it with the central zone and pullback process corresponding to the original signal.
On higher timeframes, the 4-hour chart is below its central zone, as is the daily chart. These structures provide context but cannot replace confirmation of buy or sell points on this timeframe.
The stop-loss recorded at entry was 0.0081580 (about 3.0% from the entry price), and the target price was 0.0074450. Subsequent position reductions and exits should be based on actual executions.
$ZK $BTC $ETH #缠论 #NVIDIA
Based on the nearest central zone selected during the review, the range is 0.0078100–0.0081000, and the price is within the zone.
To confirm a third sell point, check whether the pullback on the lower timeframe after breaking below the original central zone failed to return to the zone; you cannot determine this solely from which side the current price is on.
This snapshot of the most recent central zone cannot, by itself, verify the third sell point at entry. You also need to compare it with the central zone and pullback process corresponding to the original signal.
On higher timeframes, the 4-hour chart is below its central zone, as is the daily chart. These structures provide context but cannot replace confirmation of buy or sell points on this timeframe.
The stop-loss recorded at entry was 0.0081580 (about 3.0% from the entry price), and the target price was 0.0074450. Subsequent position reductions and exits should be based on actual executions.
$ZK $BTC $ETH #缠论 #NVIDIA
·
--
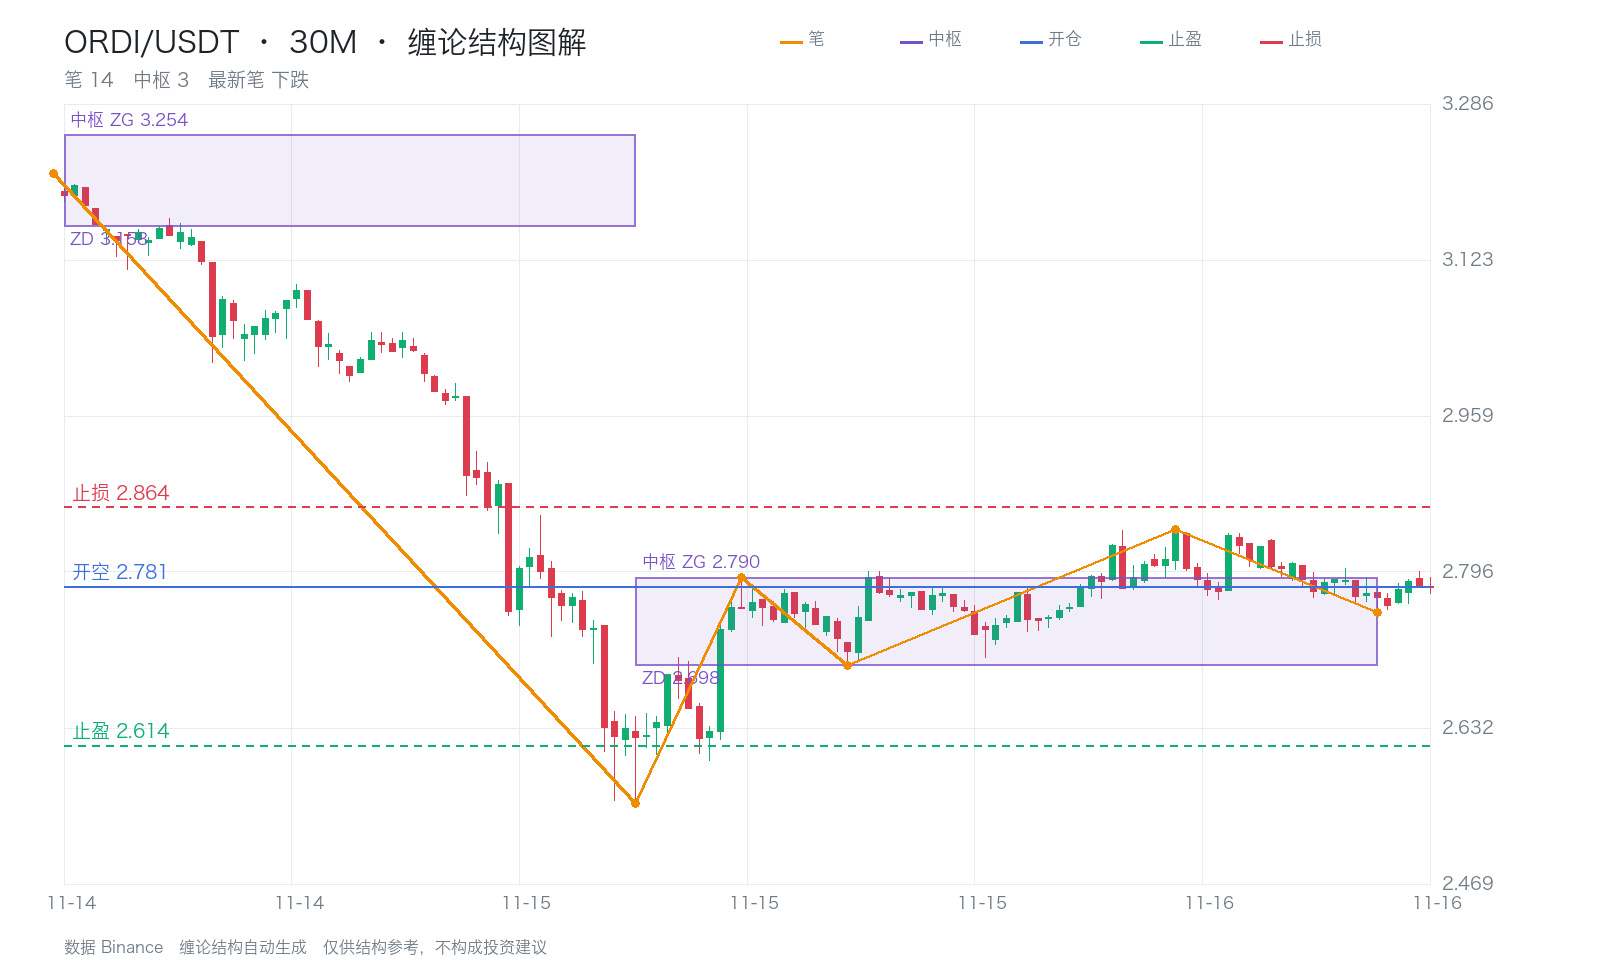
The ORDI 30m trade entry was marked as a third sell, with a short entry price of 2.781.
Based on the most recent central zone selected during the review, the range is 2.698–2.790, and the price is within the zone.
To confirm a third sell, check whether the pullback at the next lower level after the price breaks below the original central zone fails to return to the zone; the current price’s position on either side of it is not enough.
This snapshot of the most recent central zone cannot, by itself, verify the third sell at the time of entry. The central zone and pullback process associated with the original signal must also be checked.
At higher timeframes, the 4-hour chart is below its central zone, as is the daily chart. These structures provide context but cannot replace confirmation of buy and sell points at this timeframe.
The stop-loss recorded at entry was 2.864 (about 3.0% from the entry price), and the target price was 2.614. Subsequent position reductions and exits are subject to actual fills.
$ORDI $BTC $ETH #缠论 #Nvidia
The ORDI 30m trade entry was marked as a third sell, with a short entry price of 2.781.
Based on the most recent central zone selected during the review, the range is 2.698–2.790, and the price is within the zone.
To confirm a third sell, check whether the pullback at the next lower level after the price breaks below the original central zone fails to return to the zone; the current price’s position on either side of it is not enough.
This snapshot of the most recent central zone cannot, by itself, verify the third sell at the time of entry. The central zone and pullback process associated with the original signal must also be checked.
At higher timeframes, the 4-hour chart is below its central zone, as is the daily chart. These structures provide context but cannot replace confirmation of buy and sell points at this timeframe.
The stop-loss recorded at entry was 2.864 (about 3.0% from the entry price), and the target price was 2.614. Subsequent position reductions and exits are subject to actual fills.
$ORDI $BTC $ETH #缠论 #Nvidia
Based on the most recent central zone selected during the review, the range is 2.698–2.790, and the price is within the zone.
To confirm a third sell, check whether the pullback at the next lower level after the price breaks below the original central zone fails to return to the zone; the current price’s position on either side of it is not enough.
This snapshot of the most recent central zone cannot, by itself, verify the third sell at the time of entry. The central zone and pullback process associated with the original signal must also be checked.
At higher timeframes, the 4-hour chart is below its central zone, as is the daily chart. These structures provide context but cannot replace confirmation of buy and sell points at this timeframe.
The stop-loss recorded at entry was 2.864 (about 3.0% from the entry price), and the target price was 2.614. Subsequent position reductions and exits are subject to actual fills.
$ORDI $BTC $ETH #缠论 #Nvidia
49
·
--
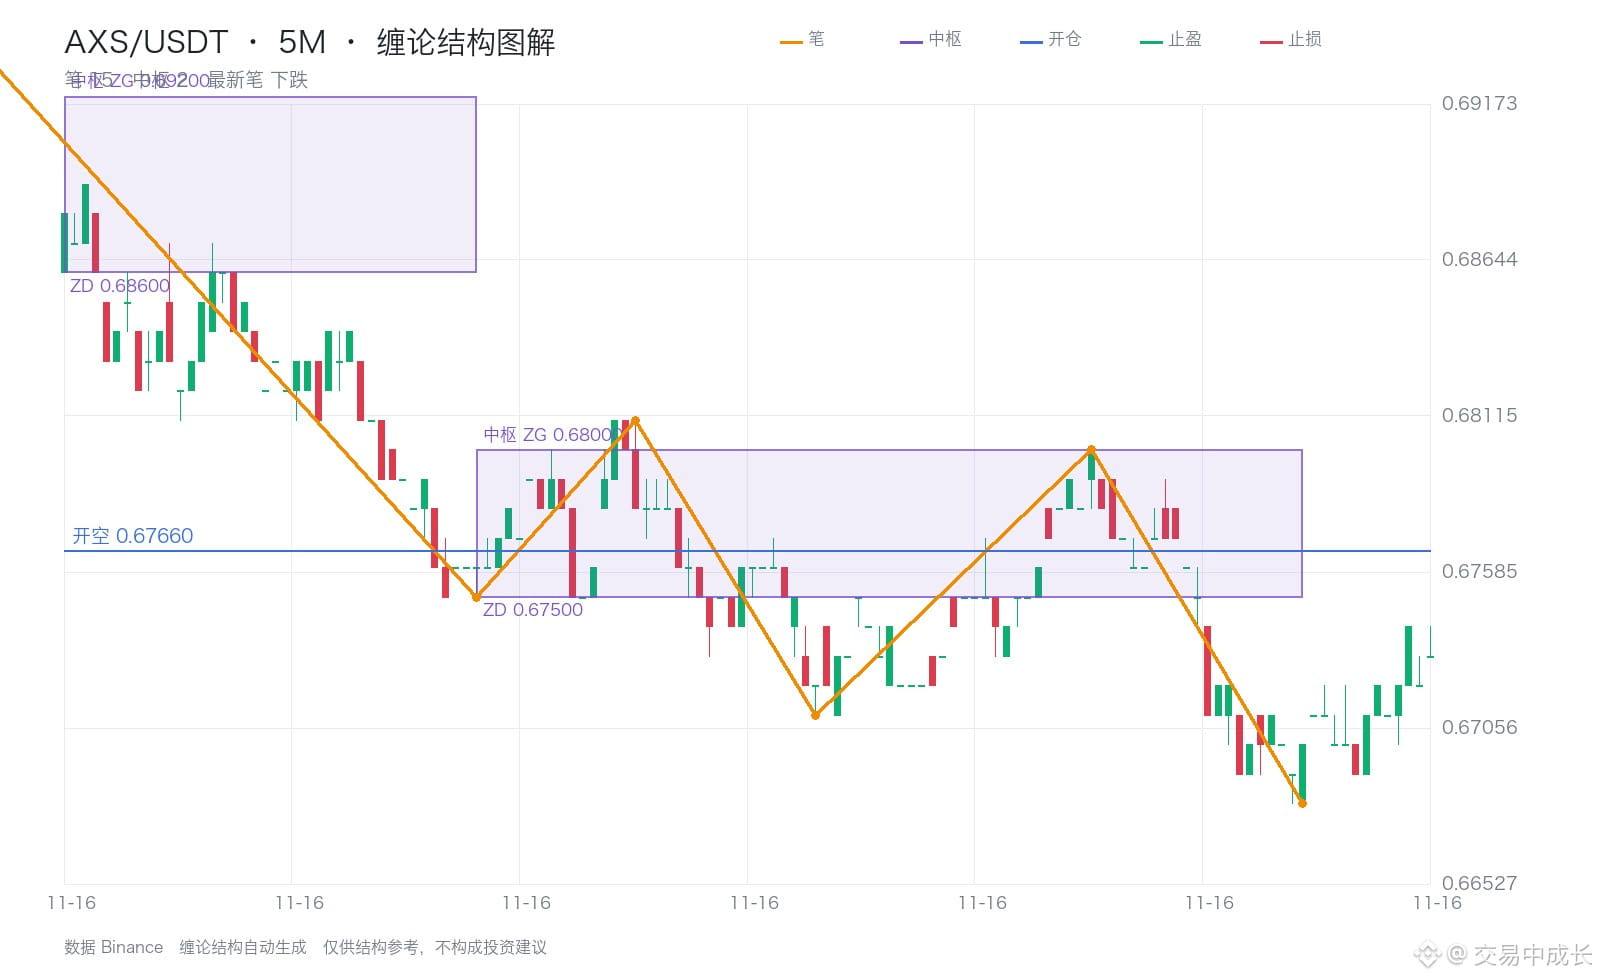
The AXS 5m trade opening record is marked as a third sell, with a short entry price of 0.67660.
Based on the most recent consolidation zone selected during the review, the range is 0.67500–0.68000, and the price is below the zone.
To confirm a third sell, check whether the pullback at the sub-level after breaking below the original consolidation zone failed to return to the zone; the current price being on one side of it is not enough.
On higher timeframes, the 4-hour chart is below its consolidation zone, and the daily chart is also below its consolidation zone. These structures provide context but cannot replace confirmation of buy or sell signals on this timeframe.
The stop-loss recorded at entry was 0.69680 (about 3.0% from the entry price), and the target price was 0.63600. Subsequent position reductions and exits are based on actual fills.
The realized profit and loss for this trade was +0.18% of the notional value of the matched opening record, before fees and funding costs.
This record may be from a partial position reduction. Based on this record alone, it is not possible to determine whether the entire position was closed or which exit condition was triggered.
$AXS $BTC $ETH #缠论 #NVIDIA
The AXS 5m trade opening record is marked as a third sell, with a short entry price of 0.67660.
Based on the most recent consolidation zone selected during the review, the range is 0.67500–0.68000, and the price is below the zone.
To confirm a third sell, check whether the pullback at the sub-level after breaking below the original consolidation zone failed to return to the zone; the current price being on one side of it is not enough.
On higher timeframes, the 4-hour chart is below its consolidation zone, and the daily chart is also below its consolidation zone. These structures provide context but cannot replace confirmation of buy or sell signals on this timeframe.
The stop-loss recorded at entry was 0.69680 (about 3.0% from the entry price), and the target price was 0.63600. Subsequent position reductions and exits are based on actual fills.
The realized profit and loss for this trade was +0.18% of the notional value of the matched opening record, before fees and funding costs.
This record may be from a partial position reduction. Based on this record alone, it is not possible to determine whether the entire position was closed or which exit condition was triggered.
$AXS $BTC $ETH #缠论 #NVIDIA
Based on the most recent consolidation zone selected during the review, the range is 0.67500–0.68000, and the price is below the zone.
To confirm a third sell, check whether the pullback at the sub-level after breaking below the original consolidation zone failed to return to the zone; the current price being on one side of it is not enough.
On higher timeframes, the 4-hour chart is below its consolidation zone, and the daily chart is also below its consolidation zone. These structures provide context but cannot replace confirmation of buy or sell signals on this timeframe.
The stop-loss recorded at entry was 0.69680 (about 3.0% from the entry price), and the target price was 0.63600. Subsequent position reductions and exits are based on actual fills.
The realized profit and loss for this trade was +0.18% of the notional value of the matched opening record, before fees and funding costs.
This record may be from a partial position reduction. Based on this record alone, it is not possible to determine whether the entire position was closed or which exit condition was triggered.
$AXS $BTC $ETH #缠论 #NVIDIA
9
·
--
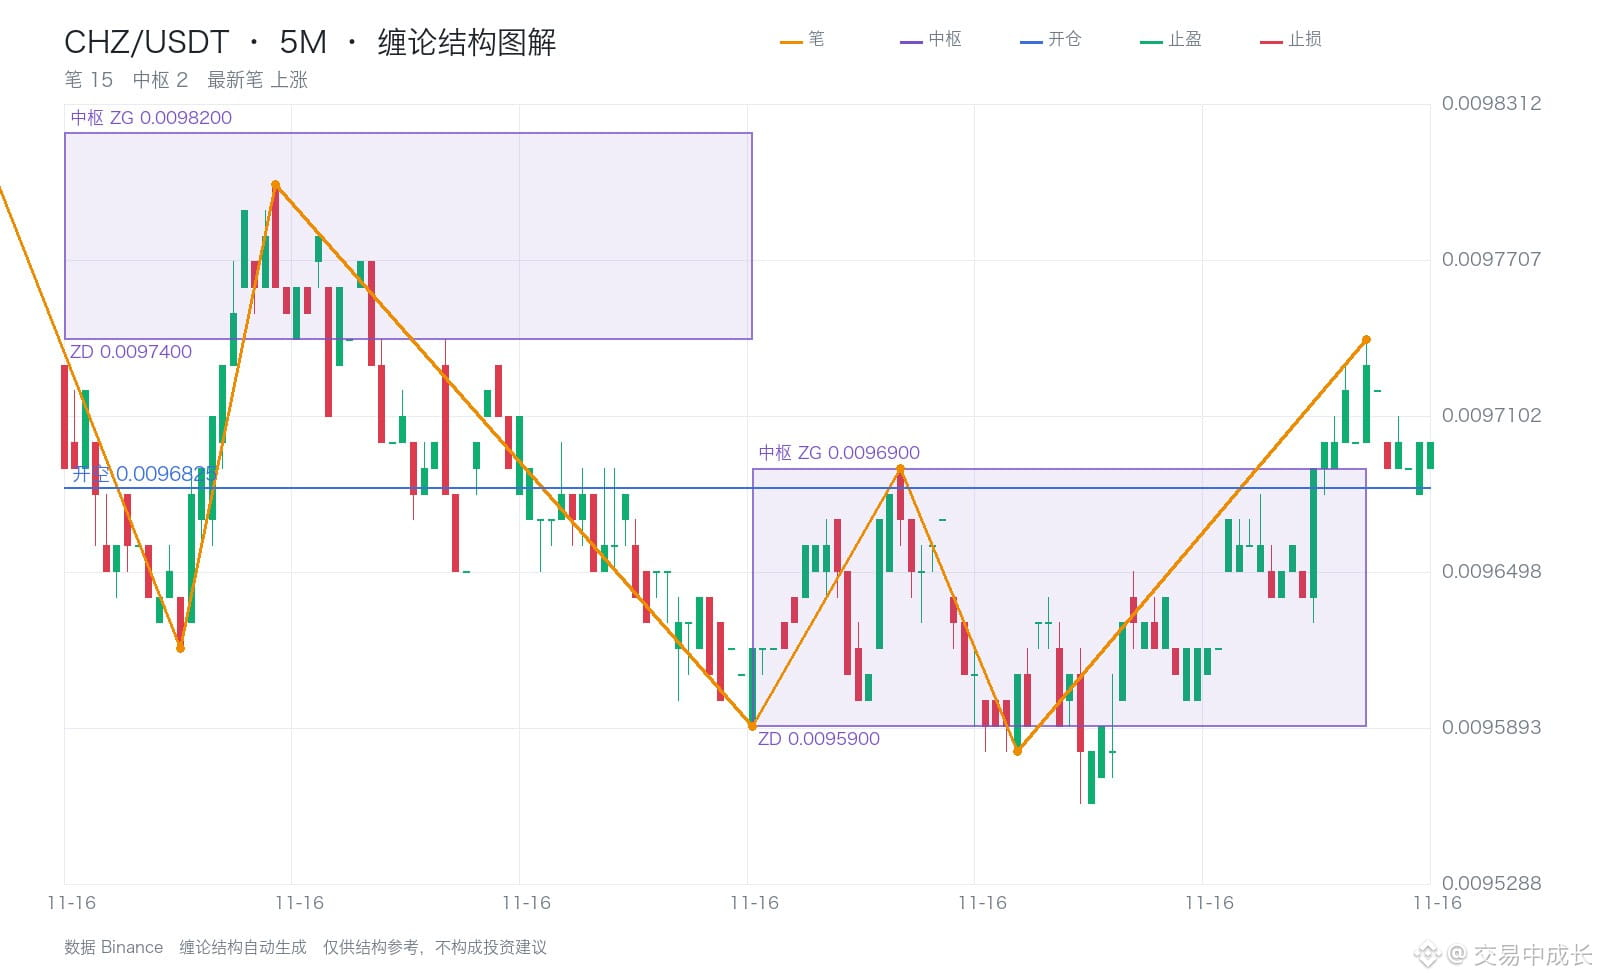
The CHZ 5m trade entry was marked as a third sell point, with a short entry price of 0.0096825.
Based on the most recent central zone selected during the review, the range is 0.0095900–0.0096900, and the price is above the zone.
To confirm a third sell point, check whether the lower-level pullback after breaking below the original central zone failed to return to it; the current price’s position relative to the zone alone is not enough.
This snapshot of the most recent central zone cannot by itself verify the third sell point at the time of entry. The central zone and pullback process corresponding to the original signal also need to be checked.
On higher time frames, the 4-hour chart is below its central zone, as is the daily chart. These structures provide context but cannot replace confirmation of buy and sell points on this time frame.
The stop-loss price recorded at entry was 0.0099700 (about 3.0% from the entry), and the target price was 0.0091000. Subsequent position reductions and exits are subject to actual fills.
$CHZ $BTC $ETH #缠论 #Nvidia
The CHZ 5m trade entry was marked as a third sell point, with a short entry price of 0.0096825.
Based on the most recent central zone selected during the review, the range is 0.0095900–0.0096900, and the price is above the zone.
To confirm a third sell point, check whether the lower-level pullback after breaking below the original central zone failed to return to it; the current price’s position relative to the zone alone is not enough.
This snapshot of the most recent central zone cannot by itself verify the third sell point at the time of entry. The central zone and pullback process corresponding to the original signal also need to be checked.
On higher time frames, the 4-hour chart is below its central zone, as is the daily chart. These structures provide context but cannot replace confirmation of buy and sell points on this time frame.
The stop-loss price recorded at entry was 0.0099700 (about 3.0% from the entry), and the target price was 0.0091000. Subsequent position reductions and exits are subject to actual fills.
$CHZ $BTC $ETH #缠论 #Nvidia
Based on the most recent central zone selected during the review, the range is 0.0095900–0.0096900, and the price is above the zone.
To confirm a third sell point, check whether the lower-level pullback after breaking below the original central zone failed to return to it; the current price’s position relative to the zone alone is not enough.
This snapshot of the most recent central zone cannot by itself verify the third sell point at the time of entry. The central zone and pullback process corresponding to the original signal also need to be checked.
On higher time frames, the 4-hour chart is below its central zone, as is the daily chart. These structures provide context but cannot replace confirmation of buy and sell points on this time frame.
The stop-loss price recorded at entry was 0.0099700 (about 3.0% from the entry), and the target price was 0.0091000. Subsequent position reductions and exits are subject to actual fills.
$CHZ $BTC $ETH #缠论 #Nvidia
10
·
--
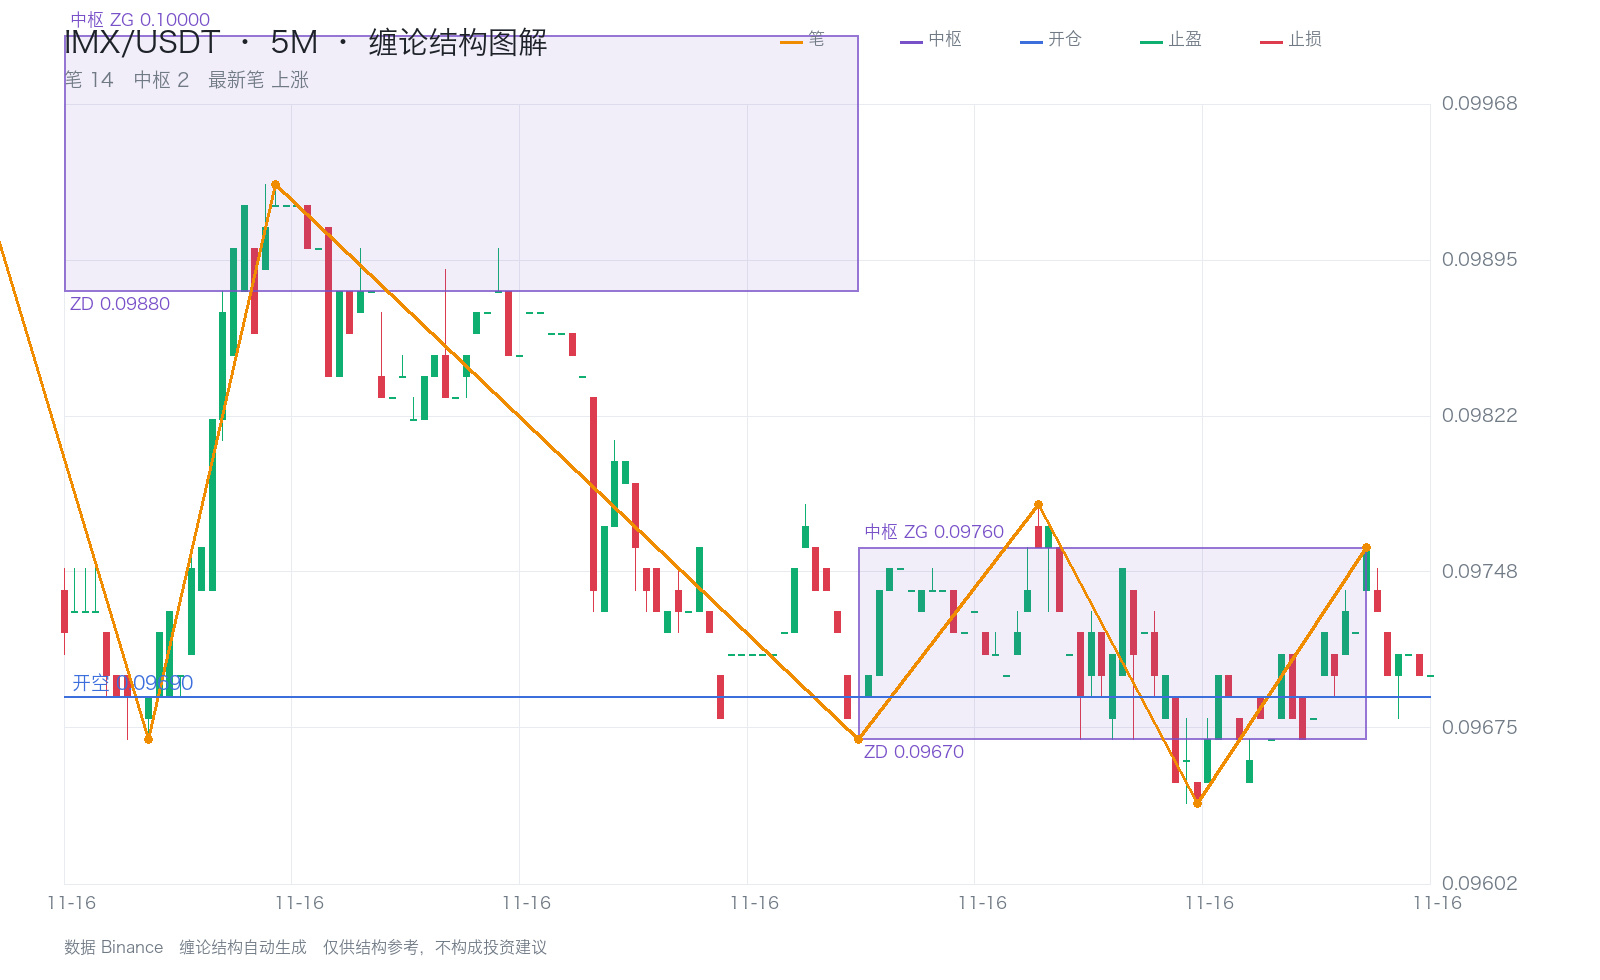
The IMX 5m trade entry was marked as a third sell point, with a short entry price of 0.09690.
Based on the most recent consolidation zone selected during the review, the range is 0.09670–0.09760, and the price is within the zone.
To confirm a third sell point, check whether the lower-timeframe pullback after breaking below the original consolidation zone failed to return to it; the current price’s position alone is not enough.
This snapshot of the most recent consolidation zone cannot independently verify the third sell point at entry. The zone and pullback corresponding to the original signal must also be checked.
On higher timeframes, the 4-hour chart is below its consolidation zone, as is the daily chart. These structures provide context but cannot replace confirmation of buy and sell points on this timeframe.
The stop-loss recorded at entry was 0.09980 (about 3.0% from the entry price), and the target price was 0.09100. Subsequent reductions and exits should be based on actual fills.
$IMX $BTC $ETH #缠论 #Nvidia
The IMX 5m trade entry was marked as a third sell point, with a short entry price of 0.09690.
Based on the most recent consolidation zone selected during the review, the range is 0.09670–0.09760, and the price is within the zone.
To confirm a third sell point, check whether the lower-timeframe pullback after breaking below the original consolidation zone failed to return to it; the current price’s position alone is not enough.
This snapshot of the most recent consolidation zone cannot independently verify the third sell point at entry. The zone and pullback corresponding to the original signal must also be checked.
On higher timeframes, the 4-hour chart is below its consolidation zone, as is the daily chart. These structures provide context but cannot replace confirmation of buy and sell points on this timeframe.
The stop-loss recorded at entry was 0.09980 (about 3.0% from the entry price), and the target price was 0.09100. Subsequent reductions and exits should be based on actual fills.
$IMX $BTC $ETH #缠论 #Nvidia
Based on the most recent consolidation zone selected during the review, the range is 0.09670–0.09760, and the price is within the zone.
To confirm a third sell point, check whether the lower-timeframe pullback after breaking below the original consolidation zone failed to return to it; the current price’s position alone is not enough.
This snapshot of the most recent consolidation zone cannot independently verify the third sell point at entry. The zone and pullback corresponding to the original signal must also be checked.
On higher timeframes, the 4-hour chart is below its consolidation zone, as is the daily chart. These structures provide context but cannot replace confirmation of buy and sell points on this timeframe.
The stop-loss recorded at entry was 0.09980 (about 3.0% from the entry price), and the target price was 0.09100. Subsequent reductions and exits should be based on actual fills.
$IMX $BTC $ETH #缠论 #Nvidia
173
·
--
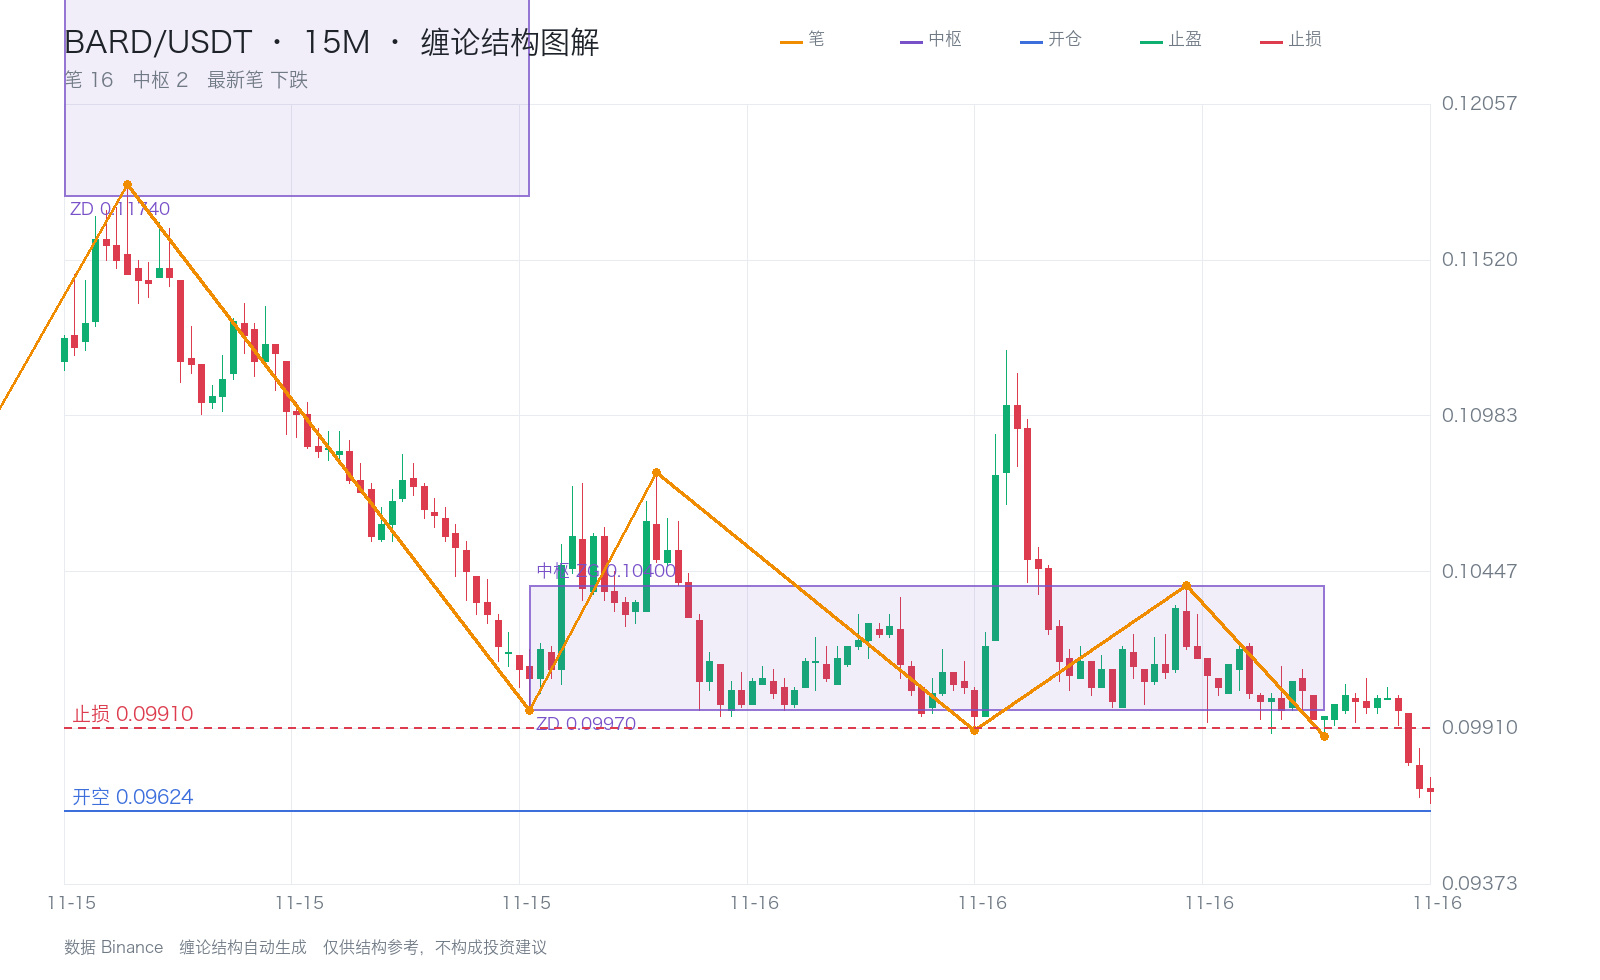
The opening record for the BARD 15m trade was marked as a third sell point, with a short entry price of 0.09624.
Based on the most recent consolidation zone selected during the review, the range is 0.09970–0.10400, and the price is below the zone.
To confirm a third sell point, check whether the pullback on the next lower timeframe after breaking below the original consolidation zone failed to return to the zone; you cannot determine this solely by looking at which side of the zone the current price is on.
On higher timeframes, the 4-hour chart is below the consolidation zone, as is the daily chart. These structures provide context, but cannot replace confirmation of buy and sell points on this timeframe.
The stop-loss price recorded at entry was 0.09910 (about 3.0% from the entry price), and the target price was 0.09040. Subsequent position reductions and exits are based on actual executions.
$BARD $BTC $ETH #缠论 #Nvidia
The opening record for the BARD 15m trade was marked as a third sell point, with a short entry price of 0.09624.
Based on the most recent consolidation zone selected during the review, the range is 0.09970–0.10400, and the price is below the zone.
To confirm a third sell point, check whether the pullback on the next lower timeframe after breaking below the original consolidation zone failed to return to the zone; you cannot determine this solely by looking at which side of the zone the current price is on.
On higher timeframes, the 4-hour chart is below the consolidation zone, as is the daily chart. These structures provide context, but cannot replace confirmation of buy and sell points on this timeframe.
The stop-loss price recorded at entry was 0.09910 (about 3.0% from the entry price), and the target price was 0.09040. Subsequent position reductions and exits are based on actual executions.
$BARD $BTC $ETH #缠论 #Nvidia
Based on the most recent consolidation zone selected during the review, the range is 0.09970–0.10400, and the price is below the zone.
To confirm a third sell point, check whether the pullback on the next lower timeframe after breaking below the original consolidation zone failed to return to the zone; you cannot determine this solely by looking at which side of the zone the current price is on.
On higher timeframes, the 4-hour chart is below the consolidation zone, as is the daily chart. These structures provide context, but cannot replace confirmation of buy and sell points on this timeframe.
The stop-loss price recorded at entry was 0.09910 (about 3.0% from the entry price), and the target price was 0.09040. Subsequent position reductions and exits are based on actual executions.
$BARD $BTC $ETH #缠论 #Nvidia
3
·
--
Article
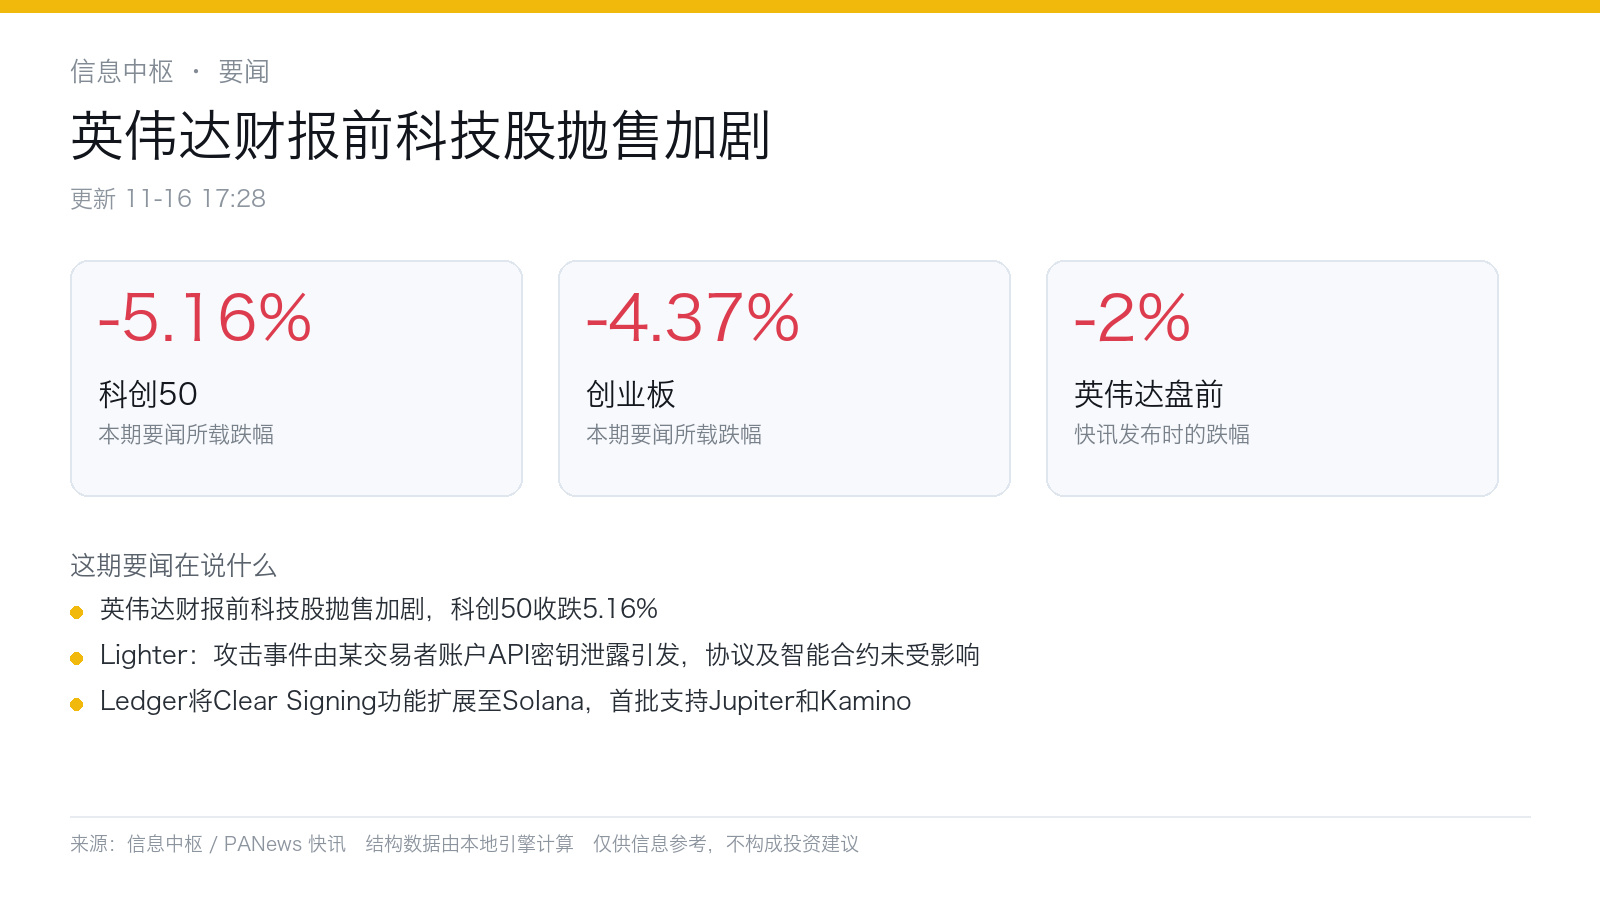
Top News | Tech stock sell-offs intensify ahead of Nvidia’s earnings reportTech stock sell-offs intensified ahead of Nvidia’s earnings report, with the STAR 50 Index closing down 5.16%.
Risk aversion increased ahead of Nvidia’s earnings report, sending Asian stocks broadly lower on Monday. The MSCI Asia-Pacific Index fell more than 1%, South Korea’s KOSPI Composite Index dropped 3.6%, and the Nikkei 225 fell 2.4%. In mainland China, the Shanghai Composite Index declined 0.87%, the ChiNext Index fell 4.37%, and the STAR 50 Index dropped 5.16%.
Nvidia fell about 2% in premarket trading, while memory chip and optical communications stocks broadly declined.
Lighter: The attack was triggered by the leak of an API key for a trader’s account; the protocol and smart contracts were unaffected.
PANews, Nov. 16 — Lighter issued an update on its investigation into the security incident, saying its preliminary findings indicate that the incident was triggered by the leak of an API key for a trader’s account. The Lighter protocol and smart contracts were unaffected.
Top News | Tech stock sell-offs intensify ahead of Nvidia’s earnings report
Tech stock sell-offs intensified ahead of Nvidia’s earnings report, with the STAR 50 Index closing down 5.16%.
Risk aversion increased ahead of Nvidia’s earnings report, sending Asian stocks broadly lower on Monday. The MSCI Asia-Pacific Index fell more than 1%, South Korea’s KOSPI Composite Index dropped 3.6%, and the Nikkei 225 fell 2.4%. In mainland China, the Shanghai Composite Index declined 0.87%, the ChiNext Index fell 4.37%, and the STAR 50 Index dropped 5.16%.
Nvidia fell about 2% in premarket trading, while memory chip and optical communications stocks broadly declined.
Lighter: The attack was triggered by the leak of an API key for a trader’s account; the protocol and smart contracts were unaffected.
PANews, Nov. 16 — Lighter issued an update on its investigation into the security incident, saying its preliminary findings indicate that the incident was triggered by the leak of an API key for a trader’s account. The Lighter protocol and smart contracts were unaffected.
Risk aversion increased ahead of Nvidia’s earnings report, sending Asian stocks broadly lower on Monday. The MSCI Asia-Pacific Index fell more than 1%, South Korea’s KOSPI Composite Index dropped 3.6%, and the Nikkei 225 fell 2.4%. In mainland China, the Shanghai Composite Index declined 0.87%, the ChiNext Index fell 4.37%, and the STAR 50 Index dropped 5.16%.
Nvidia fell about 2% in premarket trading, while memory chip and optical communications stocks broadly declined.
Lighter: The attack was triggered by the leak of an API key for a trader’s account; the protocol and smart contracts were unaffected.
PANews, Nov. 16 — Lighter issued an update on its investigation into the security incident, saying its preliminary findings indicate that the incident was triggered by the leak of an API key for a trader’s account. The Lighter protocol and smart contracts were unaffected.
232
·
--
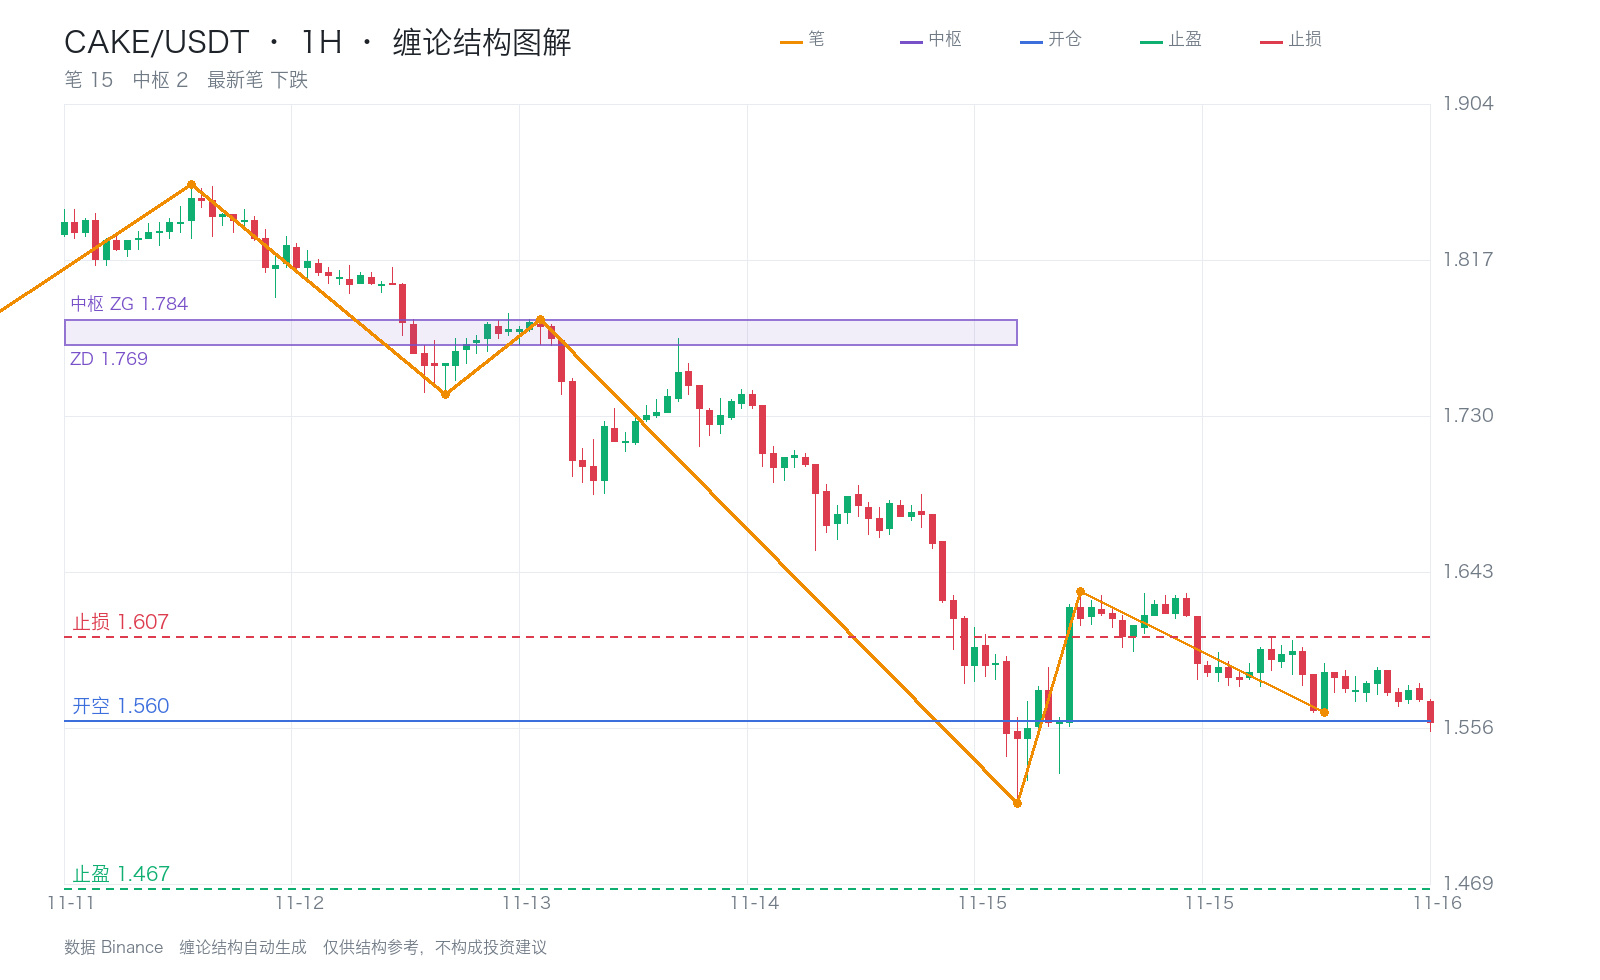
The CAKE 1h trade entry was marked as a third sell point, with a short entry price of 1.560.
Based on the most recent consolidation zone selected during the review, the range is 1.769–1.784, and the price is below the zone.
To confirm a third sell point, check whether the pullback on the sub-level after breaking below the original consolidation zone failed to return to the zone. You cannot determine it solely by looking at which side the current price is on.
On higher timeframes, the 4-hour and daily charts are both below their consolidation zones. These structures provide context, but cannot replace confirmation of buy or sell points on this timeframe.
The stop-loss recorded at entry was 1.607 (about 3.0% from the entry price), and the target price was 1.467. Subsequent position reductions and exits are based on actual fills.
$CAKE $BTC $ETH #缠论 #ETF资金流 #ETF outflow
The CAKE 1h trade entry was marked as a third sell point, with a short entry price of 1.560.
Based on the most recent consolidation zone selected during the review, the range is 1.769–1.784, and the price is below the zone.
To confirm a third sell point, check whether the pullback on the sub-level after breaking below the original consolidation zone failed to return to the zone. You cannot determine it solely by looking at which side the current price is on.
On higher timeframes, the 4-hour and daily charts are both below their consolidation zones. These structures provide context, but cannot replace confirmation of buy or sell points on this timeframe.
The stop-loss recorded at entry was 1.607 (about 3.0% from the entry price), and the target price was 1.467. Subsequent position reductions and exits are based on actual fills.
$CAKE $BTC $ETH #缠论 #ETF资金流 #ETF outflow
Based on the most recent consolidation zone selected during the review, the range is 1.769–1.784, and the price is below the zone.
To confirm a third sell point, check whether the pullback on the sub-level after breaking below the original consolidation zone failed to return to the zone. You cannot determine it solely by looking at which side the current price is on.
On higher timeframes, the 4-hour and daily charts are both below their consolidation zones. These structures provide context, but cannot replace confirmation of buy or sell points on this timeframe.
The stop-loss recorded at entry was 1.607 (about 3.0% from the entry price), and the target price was 1.467. Subsequent position reductions and exits are based on actual fills.
$CAKE $BTC $ETH #缠论 #ETF资金流 #ETF outflow
37
·
--
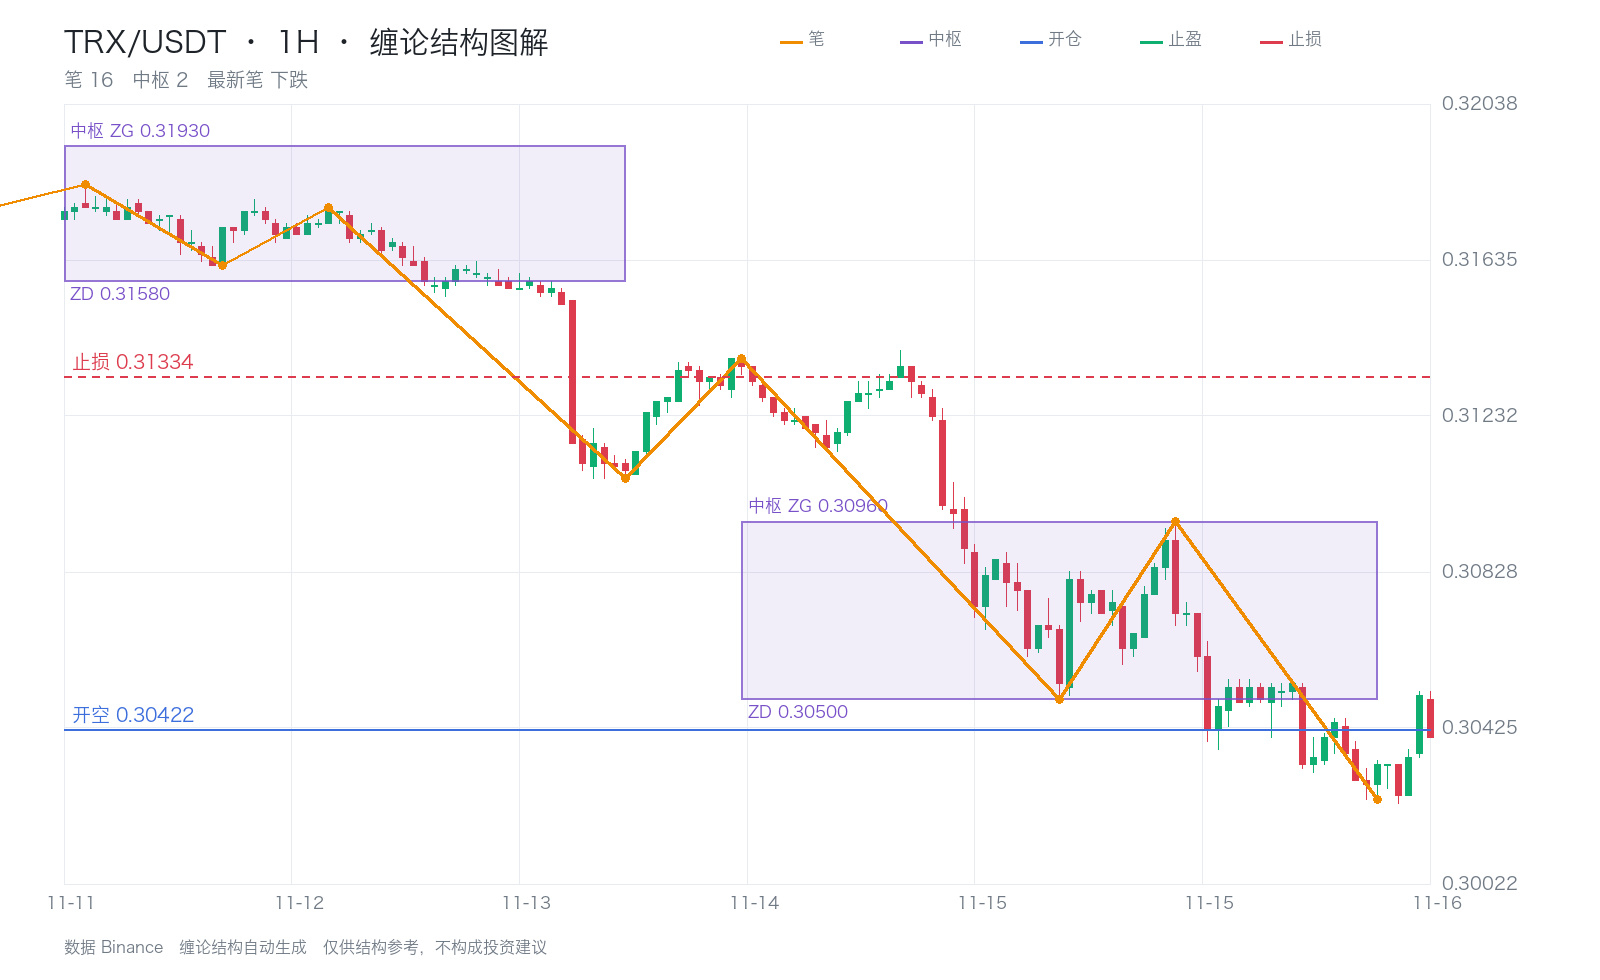
The TRX 1h trade entry was marked as a third sell, with a short entry price of 0.30422.
Based on the most recent central zone selected during the review, the range is 0.30500–0.30960, and the price is below the zone.
For a third sell, check whether the pullback at the next lower level after breaking below the original central zone failed to return to the zone; you cannot determine this solely by looking at which side of the zone the current price is on.
On higher timeframes, the 4-hour price is below its central zone, and the daily price is also below its central zone. These structures provide context but cannot replace confirmation of buy or sell signals on this timeframe.
The stop-loss recorded at entry was 0.31334 (about 3.0% from the entry price), and the target price was 0.28596. Subsequent position reductions and exits are based on actual fills.
$TRX $BTC $ETH #缠论 #ETF资金流 #ETF outflows
The TRX 1h trade entry was marked as a third sell, with a short entry price of 0.30422.
Based on the most recent central zone selected during the review, the range is 0.30500–0.30960, and the price is below the zone.
For a third sell, check whether the pullback at the next lower level after breaking below the original central zone failed to return to the zone; you cannot determine this solely by looking at which side of the zone the current price is on.
On higher timeframes, the 4-hour price is below its central zone, and the daily price is also below its central zone. These structures provide context but cannot replace confirmation of buy or sell signals on this timeframe.
The stop-loss recorded at entry was 0.31334 (about 3.0% from the entry price), and the target price was 0.28596. Subsequent position reductions and exits are based on actual fills.
$TRX $BTC $ETH #缠论 #ETF资金流 #ETF outflows
Based on the most recent central zone selected during the review, the range is 0.30500–0.30960, and the price is below the zone.
For a third sell, check whether the pullback at the next lower level after breaking below the original central zone failed to return to the zone; you cannot determine this solely by looking at which side of the zone the current price is on.
On higher timeframes, the 4-hour price is below its central zone, and the daily price is also below its central zone. These structures provide context but cannot replace confirmation of buy or sell signals on this timeframe.
The stop-loss recorded at entry was 0.31334 (about 3.0% from the entry price), and the target price was 0.28596. Subsequent position reductions and exits are based on actual fills.
$TRX $BTC $ETH #缠论 #ETF资金流 #ETF outflows
14
·
--
News Update | China, the U.S. and Russia to Meet: A New “Yalta” for the Emerging Powers?
On November 16, China’s Ministry of Foreign Affairs announced that Xi Jinping will meet with Russian President Vladimir Putin and U.S. President Donald Trump in Shenzhen on November 19 for a China-U.S.-Russia summit.
The meeting has yet to take place, but the fact that the three sides are about to sit down at the same table has already fueled discussion of a “new Yalta.”
I see it as the opening of a new round of coordination among major powers: three parties in a competitive relationship are beginning to explore, through direct dialogue, areas where they can reach agreement.
“New Yalta” is a commentator’s metaphor. There is currently no basis for concluding that the three countries have agreed on a new international order or divided up spheres of influence.
The Yalta comparison has a clear historical context.
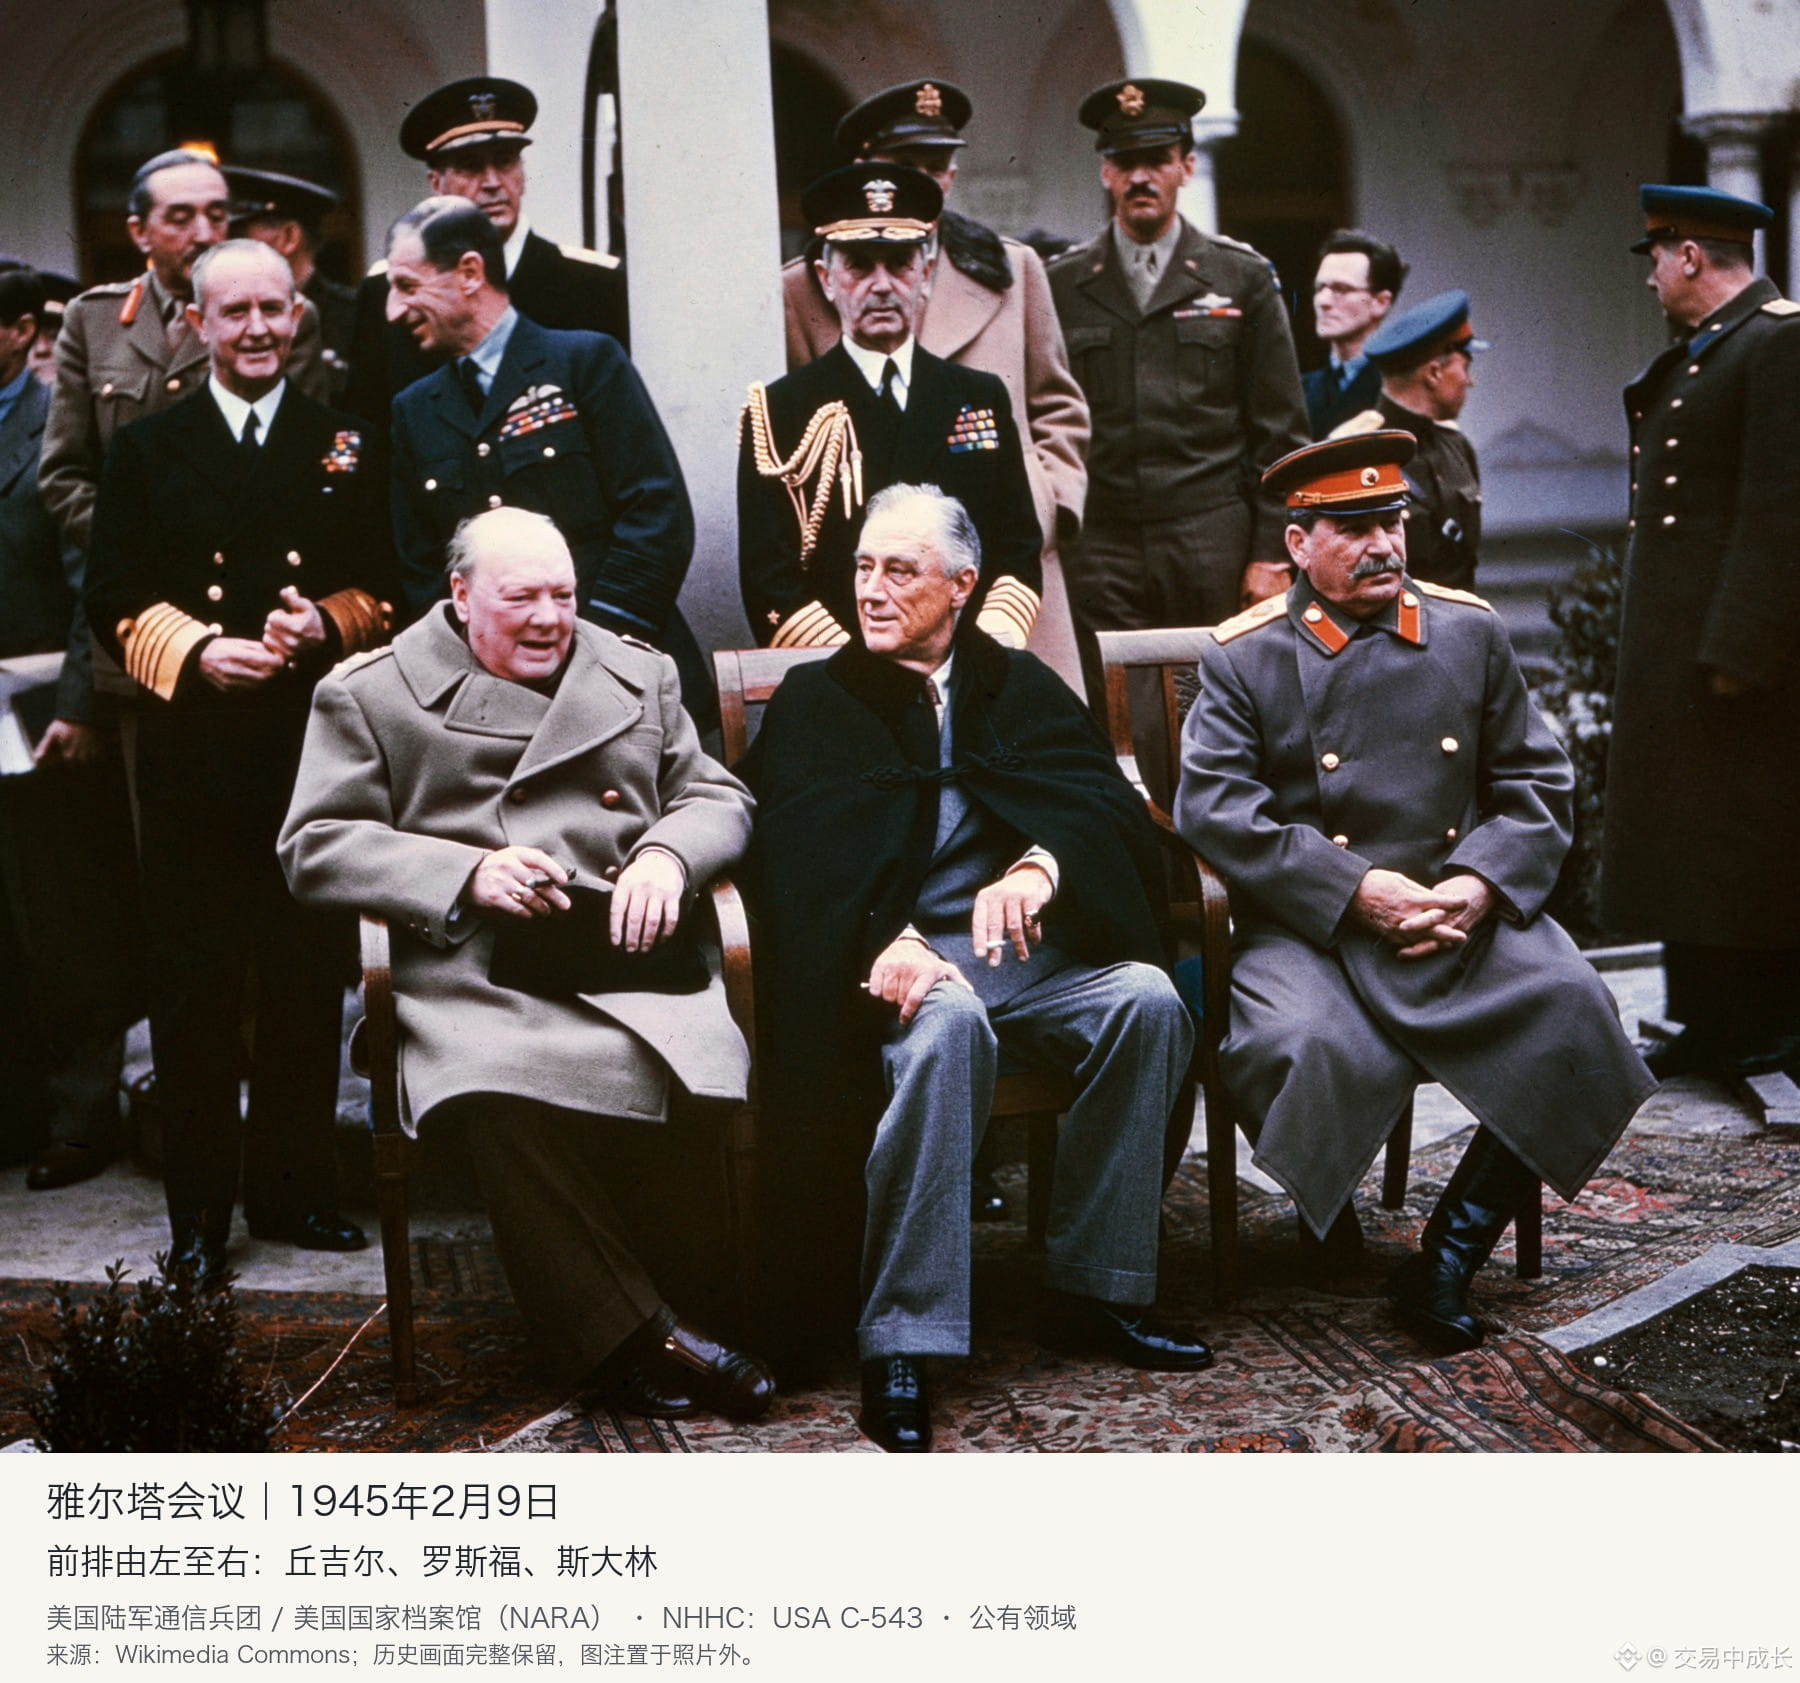
From February 4 to 11, 1945, Roosevelt, Churchill and Stalin met at Yalta to discuss the course of the war, postwar arrangements for Germany, Eastern Europe, the United Nations and other matters, profoundly shaping the postwar landscape.
The historic photograph of the three men seated together later became a symbol of coordination and competing interests among major powers.
Today’s China-U.S.-Russia meeting is likewise drawing global attention, but the conditions of the era, relations among the countries and the issues they face have all changed.
In my view, China’s manufacturing and trade networks, the United States’ financial and alliance systems, and Russia’s energy resources and nuclear capabilities give each of the three significant influence in different fields.
What is truly worth watching is whether these interdependent forces can establish more stable channels of communication and bring some of their competition and disagreements into a framework for sustained negotiations.
Europe, Ukraine and other countries also have their own interests and capacity to act. The global order will not be determined by a single negotiating table.
I’ll be watching for three things in the news that follows.
First, whether there is a verifiable joint statement after the meeting, and whether a follow-up communication mechanism is established.
Second, whether there are any tangible changes in actions related to disagreements over conflict and security.
Third, whether market pricing adjusts in response to subsequent policies and actions, rather than just fluctuating briefly around expectations for the meeting.
The Foreign Ministry announcement cited above did not specify an agenda, so speculative topics, agreements or ceasefire arrangements cannot be presented as confirmed outcomes at this point.
For traders, if subsequent communication does indeed reduce the risk of conflict, the pricing dynamics for energy, safe-haven assets and risk assets could all change.
BTC and ETH may also be affected by global liquidity and risk appetite, but the news of the meeting alone does not indicate whether crypto prices will rise or fall.
My central view is that the major powers sitting down to talk again is a development worth watching. Whether a “new order” takes shape will depend on what they do after the meeting.
Figure 1 is a composite of reference portraits of Xi Jinping, Trump and Putin, not a photograph of the leaders at this meeting.
Figure 1 credits: The photographs of Xi Jinping and Putin are from the Russian Presidential Press Service (www.kremlin.ru). The original Xi Jinping image was processed by Roman Kubanskiy and used under CC BY 4.0; it has been cropped, resized and composited. The photograph of Trump is a public-domain work by Daniel Torok / the White House.
https://creativecommons.org/licenses/by/4.0/
Figure 2 is a historic photograph of the 1945 Yalta Conference. In the front row, from left to right, are Churchill, Roosevelt and Stalin. It is included to illustrate the historical comparison made in this article.
Figure 2 source: U.S. Army Signal Corps / National Archives, archival reference USA C-543. Public-domain work; the historical image is reproduced in full.
News source: November 16 announcement by China’s Ministry of Foreign Affairs.
https://www.fmprc.gov.cn/wjdt_674879/wsrc_674883/202611/t20261116_12059654.shtml
Historical background: U.S. Department of State, Office of the Historian, “The Yalta Conference, 1945.”
https://history.state.gov/milestones/1937-1945/yalta-conf
$BTC $ETH #中美俄会晤 #地缘政治 #Macro Watch
News Update | China, the U.S. and Russia to Meet: A New “Yalta” for the Emerging Powers?
On November 16, China’s Ministry of Foreign Affairs announced that Xi Jinping will meet with Russian President Vladimir Putin and U.S. President Donald Trump in Shenzhen on November 19 for a China-U.S.-Russia summit.
The meeting has yet to take place, but the fact that the three sides are about to sit down at the same table has already fueled discussion of a “new Yalta.”
I see it as the opening of a new round of coordination among major powers: three parties in a competitive relationship are beginning to explore, through direct dialogue, areas where they can reach agreement.
“New Yalta” is a commentator’s metaphor. There is currently no basis for concluding that the three countries have agreed on a new international order or divided up spheres of influence.
The Yalta comparison has a clear historical context.
From February 4 to 11, 1945, Roosevelt, Churchill and Stalin met at Yalta to discuss the course of the war, postwar arrangements for Germany, Eastern Europe, the United Nations and other matters, profoundly shaping the postwar landscape.
The historic photograph of the three men seated together later became a symbol of coordination and competing interests among major powers.
Today’s China-U.S.-Russia meeting is likewise drawing global attention, but the conditions of the era, relations among the countries and the issues they face have all changed.
In my view, China’s manufacturing and trade networks, the United States’ financial and alliance systems, and Russia’s energy resources and nuclear capabilities give each of the three significant influence in different fields.
What is truly worth watching is whether these interdependent forces can establish more stable channels of communication and bring some of their competition and disagreements into a framework for sustained negotiations.
Europe, Ukraine and other countries also have their own interests and capacity to act. The global order will not be determined by a single negotiating table.
I’ll be watching for three things in the news that follows.
First, whether there is a verifiable joint statement after the meeting, and whether a follow-up communication mechanism is established.
Second, whether there are any tangible changes in actions related to disagreements over conflict and security.
Third, whether market pricing adjusts in response to subsequent policies and actions, rather than just fluctuating briefly around expectations for the meeting.
The Foreign Ministry announcement cited above did not specify an agenda, so speculative topics, agreements or ceasefire arrangements cannot be presented as confirmed outcomes at this point.
For traders, if subsequent communication does indeed reduce the risk of conflict, the pricing dynamics for energy, safe-haven assets and risk assets could all change.
BTC and ETH may also be affected by global liquidity and risk appetite, but the news of the meeting alone does not indicate whether crypto prices will rise or fall.
My central view is that the major powers sitting down to talk again is a development worth watching. Whether a “new order” takes shape will depend on what they do after the meeting.
Figure 1 is a composite of reference portraits of Xi Jinping, Trump and Putin, not a photograph of the leaders at this meeting.
Figure 1 credits: The photographs of Xi Jinping and Putin are from the Russian Presidential Press Service (www.kremlin.ru). The original Xi Jinping image was processed by Roman Kubanskiy and used under CC BY 4.0; it has been cropped, resized and composited. The photograph of Trump is a public-domain work by Daniel Torok / the White House.
https://creativecommons.org/licenses/by/4.0/
Figure 2 is a historic photograph of the 1945 Yalta Conference. In the front row, from left to right, are Churchill, Roosevelt and Stalin. It is included to illustrate the historical comparison made in this article.
Figure 2 source: U.S. Army Signal Corps / National Archives, archival reference USA C-543. Public-domain work; the historical image is reproduced in full.
News source: November 16 announcement by China’s Ministry of Foreign Affairs.
https://www.fmprc.gov.cn/wjdt_674879/wsrc_674883/202611/t20261116_12059654.shtml
Historical background: U.S. Department of State, Office of the Historian, “The Yalta Conference, 1945.”
https://history.state.gov/milestones/1937-1945/yalta-conf
$BTC $ETH #中美俄会晤 #地缘政治 #Macro Watch
On November 16, China’s Ministry of Foreign Affairs announced that Xi Jinping will meet with Russian President Vladimir Putin and U.S. President Donald Trump in Shenzhen on November 19 for a China-U.S.-Russia summit.
The meeting has yet to take place, but the fact that the three sides are about to sit down at the same table has already fueled discussion of a “new Yalta.”
I see it as the opening of a new round of coordination among major powers: three parties in a competitive relationship are beginning to explore, through direct dialogue, areas where they can reach agreement.
“New Yalta” is a commentator’s metaphor. There is currently no basis for concluding that the three countries have agreed on a new international order or divided up spheres of influence.
The Yalta comparison has a clear historical context.
From February 4 to 11, 1945, Roosevelt, Churchill and Stalin met at Yalta to discuss the course of the war, postwar arrangements for Germany, Eastern Europe, the United Nations and other matters, profoundly shaping the postwar landscape.
The historic photograph of the three men seated together later became a symbol of coordination and competing interests among major powers.
Today’s China-U.S.-Russia meeting is likewise drawing global attention, but the conditions of the era, relations among the countries and the issues they face have all changed.
In my view, China’s manufacturing and trade networks, the United States’ financial and alliance systems, and Russia’s energy resources and nuclear capabilities give each of the three significant influence in different fields.
What is truly worth watching is whether these interdependent forces can establish more stable channels of communication and bring some of their competition and disagreements into a framework for sustained negotiations.
Europe, Ukraine and other countries also have their own interests and capacity to act. The global order will not be determined by a single negotiating table.
I’ll be watching for three things in the news that follows.
First, whether there is a verifiable joint statement after the meeting, and whether a follow-up communication mechanism is established.
Second, whether there are any tangible changes in actions related to disagreements over conflict and security.
Third, whether market pricing adjusts in response to subsequent policies and actions, rather than just fluctuating briefly around expectations for the meeting.
The Foreign Ministry announcement cited above did not specify an agenda, so speculative topics, agreements or ceasefire arrangements cannot be presented as confirmed outcomes at this point.
For traders, if subsequent communication does indeed reduce the risk of conflict, the pricing dynamics for energy, safe-haven assets and risk assets could all change.
BTC and ETH may also be affected by global liquidity and risk appetite, but the news of the meeting alone does not indicate whether crypto prices will rise or fall.
My central view is that the major powers sitting down to talk again is a development worth watching. Whether a “new order” takes shape will depend on what they do after the meeting.
Figure 1 is a composite of reference portraits of Xi Jinping, Trump and Putin, not a photograph of the leaders at this meeting.
Figure 1 credits: The photographs of Xi Jinping and Putin are from the Russian Presidential Press Service (www.kremlin.ru). The original Xi Jinping image was processed by Roman Kubanskiy and used under CC BY 4.0; it has been cropped, resized and composited. The photograph of Trump is a public-domain work by Daniel Torok / the White House.
https://creativecommons.org/licenses/by/4.0/
Figure 2 is a historic photograph of the 1945 Yalta Conference. In the front row, from left to right, are Churchill, Roosevelt and Stalin. It is included to illustrate the historical comparison made in this article.
Figure 2 source: U.S. Army Signal Corps / National Archives, archival reference USA C-543. Public-domain work; the historical image is reproduced in full.
News source: November 16 announcement by China’s Ministry of Foreign Affairs.
https://www.fmprc.gov.cn/wjdt_674879/wsrc_674883/202611/t20261116_12059654.shtml
Historical background: U.S. Department of State, Office of the Historian, “The Yalta Conference, 1945.”
https://history.state.gov/milestones/1937-1945/yalta-conf
$BTC $ETH #中美俄会晤 #地缘政治 #Macro Watch

·
--
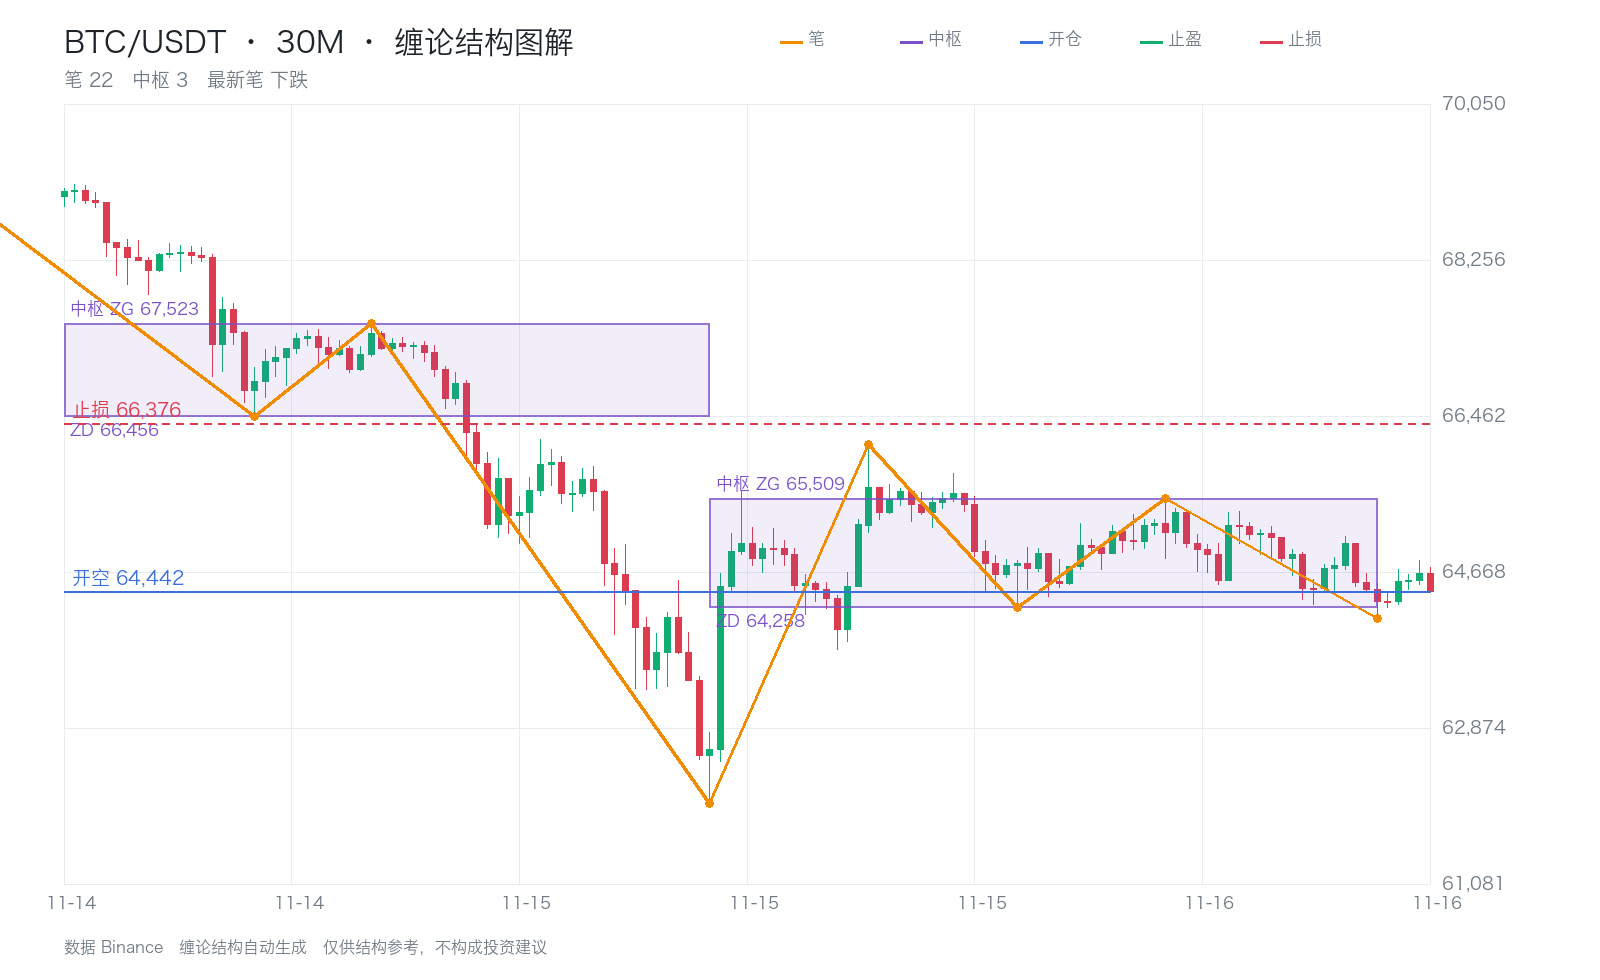
A 3-sell signal appeared on the BTC 30m timeframe; short entry at 64,442.
The consolidation zone it belongs to is 64,258–65,509, and the price is still oscillating within the range.
This 3-sell signal appeared inside the consolidation zone: the price failed to rebound from the zone’s lower boundary, and the move was weaker than a 3-sell signal after a breakdown, so the position should not be too large.
Looking two timeframes higher, both the 4-hour and daily charts are below their respective consolidation zones. The broader trend is aligned to the downside, confirming the 3-sell signal.
Stop loss at 66,376 (about 3.0% to exit); take profit at 60,576. Losses are limited while gains have room to grow.
This trade has already exited at take profit, with a return of +0.15%.
$BTC $ETH #缠论 #ETF资金流 #ETF outflows
A 3-sell signal appeared on the BTC 30m timeframe; short entry at 64,442.
The consolidation zone it belongs to is 64,258–65,509, and the price is still oscillating within the range.
This 3-sell signal appeared inside the consolidation zone: the price failed to rebound from the zone’s lower boundary, and the move was weaker than a 3-sell signal after a breakdown, so the position should not be too large.
Looking two timeframes higher, both the 4-hour and daily charts are below their respective consolidation zones. The broader trend is aligned to the downside, confirming the 3-sell signal.
Stop loss at 66,376 (about 3.0% to exit); take profit at 60,576. Losses are limited while gains have room to grow.
This trade has already exited at take profit, with a return of +0.15%.
$BTC $ETH #缠论 #ETF资金流 #ETF outflows
The consolidation zone it belongs to is 64,258–65,509, and the price is still oscillating within the range.
This 3-sell signal appeared inside the consolidation zone: the price failed to rebound from the zone’s lower boundary, and the move was weaker than a 3-sell signal after a breakdown, so the position should not be too large.
Looking two timeframes higher, both the 4-hour and daily charts are below their respective consolidation zones. The broader trend is aligned to the downside, confirming the 3-sell signal.
Stop loss at 66,376 (about 3.0% to exit); take profit at 60,576. Losses are limited while gains have room to grow.
This trade has already exited at take profit, with a return of +0.15%.
$BTC $ETH #缠论 #ETF资金流 #ETF outflows
11
·
--
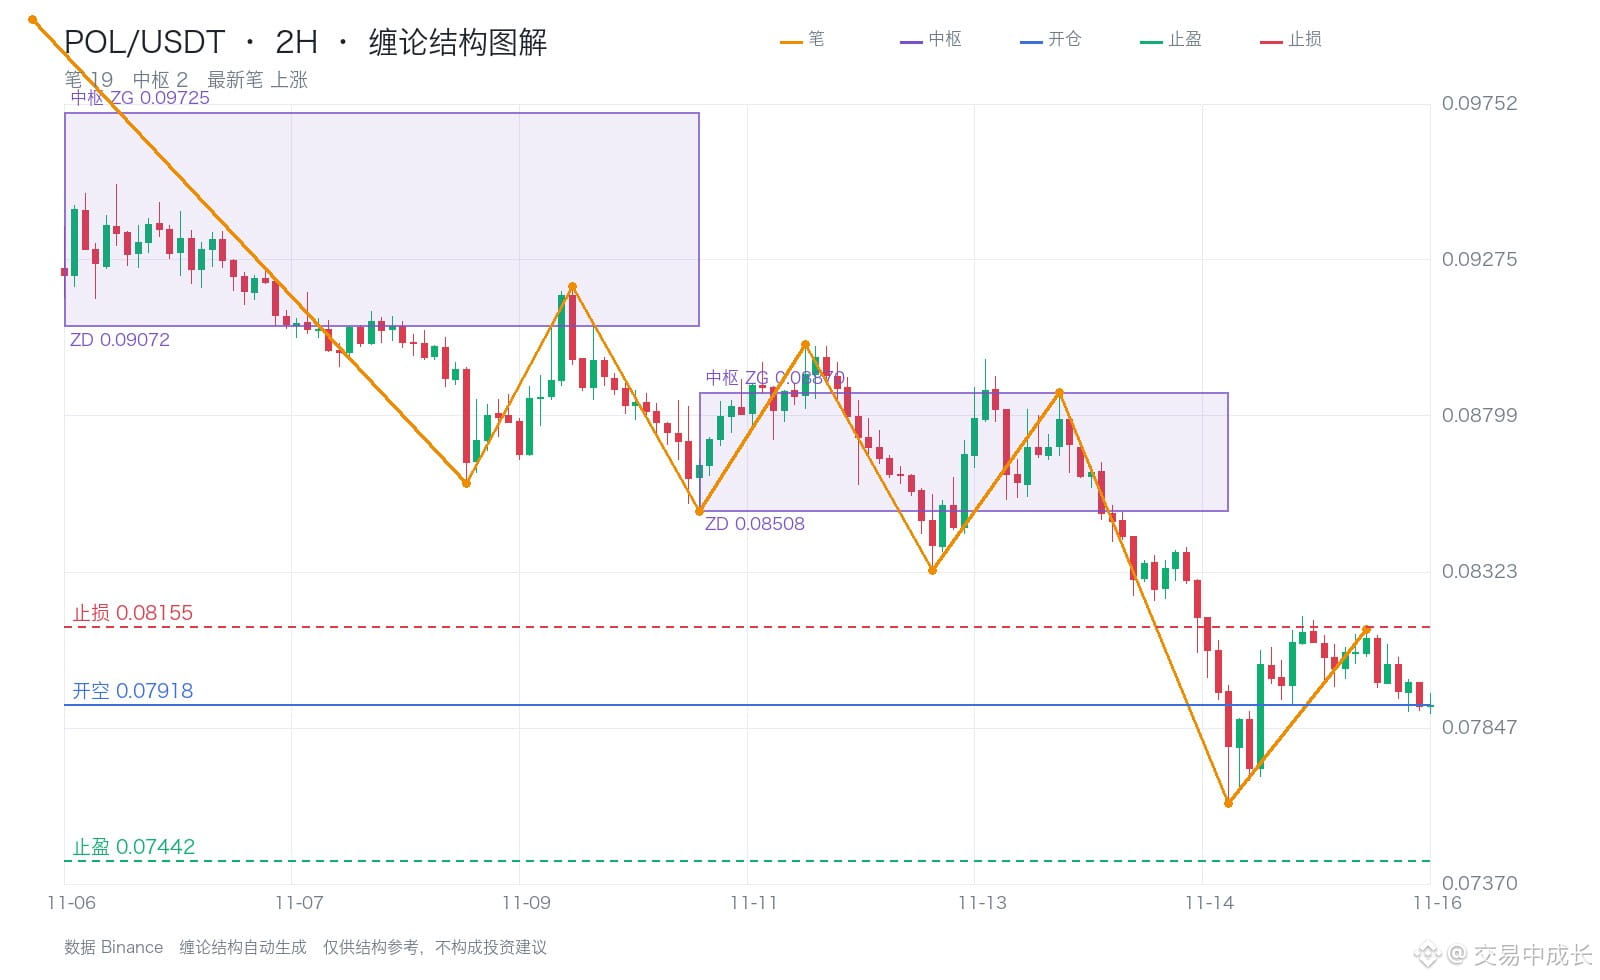
A third sell signal appeared on the POL 2-hour chart; short entry at 0.07918.
The consolidation zone it just left was 0.08508–0.08870. After breaking below it, the price has not returned to the zone.
According to Chan theory, the first rebound after a breakdown fails to re-enter the consolidation zone—that is the third sell point, the clearest short entry signal.
Looking at the next two higher timeframes, both the 4-hour and daily charts are below their respective consolidation zones. The broader trend is aligned to the downside, confirming the third sell signal.
Stop loss: 0.08155 (approximately 3.0% to exit); take profit: 0.07442. Losses are limited, while gains can be amplified.
This trade has already hit its take-profit target and been closed, with a return of +0.06%.
$POL $BTC $ETH #缠论 #ETF资金流 #ETF outflows
A third sell signal appeared on the POL 2-hour chart; short entry at 0.07918.
The consolidation zone it just left was 0.08508–0.08870. After breaking below it, the price has not returned to the zone.
According to Chan theory, the first rebound after a breakdown fails to re-enter the consolidation zone—that is the third sell point, the clearest short entry signal.
Looking at the next two higher timeframes, both the 4-hour and daily charts are below their respective consolidation zones. The broader trend is aligned to the downside, confirming the third sell signal.
Stop loss: 0.08155 (approximately 3.0% to exit); take profit: 0.07442. Losses are limited, while gains can be amplified.
This trade has already hit its take-profit target and been closed, with a return of +0.06%.
$POL $BTC $ETH #缠论 #ETF资金流 #ETF outflows
The consolidation zone it just left was 0.08508–0.08870. After breaking below it, the price has not returned to the zone.
According to Chan theory, the first rebound after a breakdown fails to re-enter the consolidation zone—that is the third sell point, the clearest short entry signal.
Looking at the next two higher timeframes, both the 4-hour and daily charts are below their respective consolidation zones. The broader trend is aligned to the downside, confirming the third sell signal.
Stop loss: 0.08155 (approximately 3.0% to exit); take profit: 0.07442. Losses are limited, while gains can be amplified.
This trade has already hit its take-profit target and been closed, with a return of +0.06%.
$POL $BTC $ETH #缠论 #ETF资金流 #ETF outflows
6
·
--
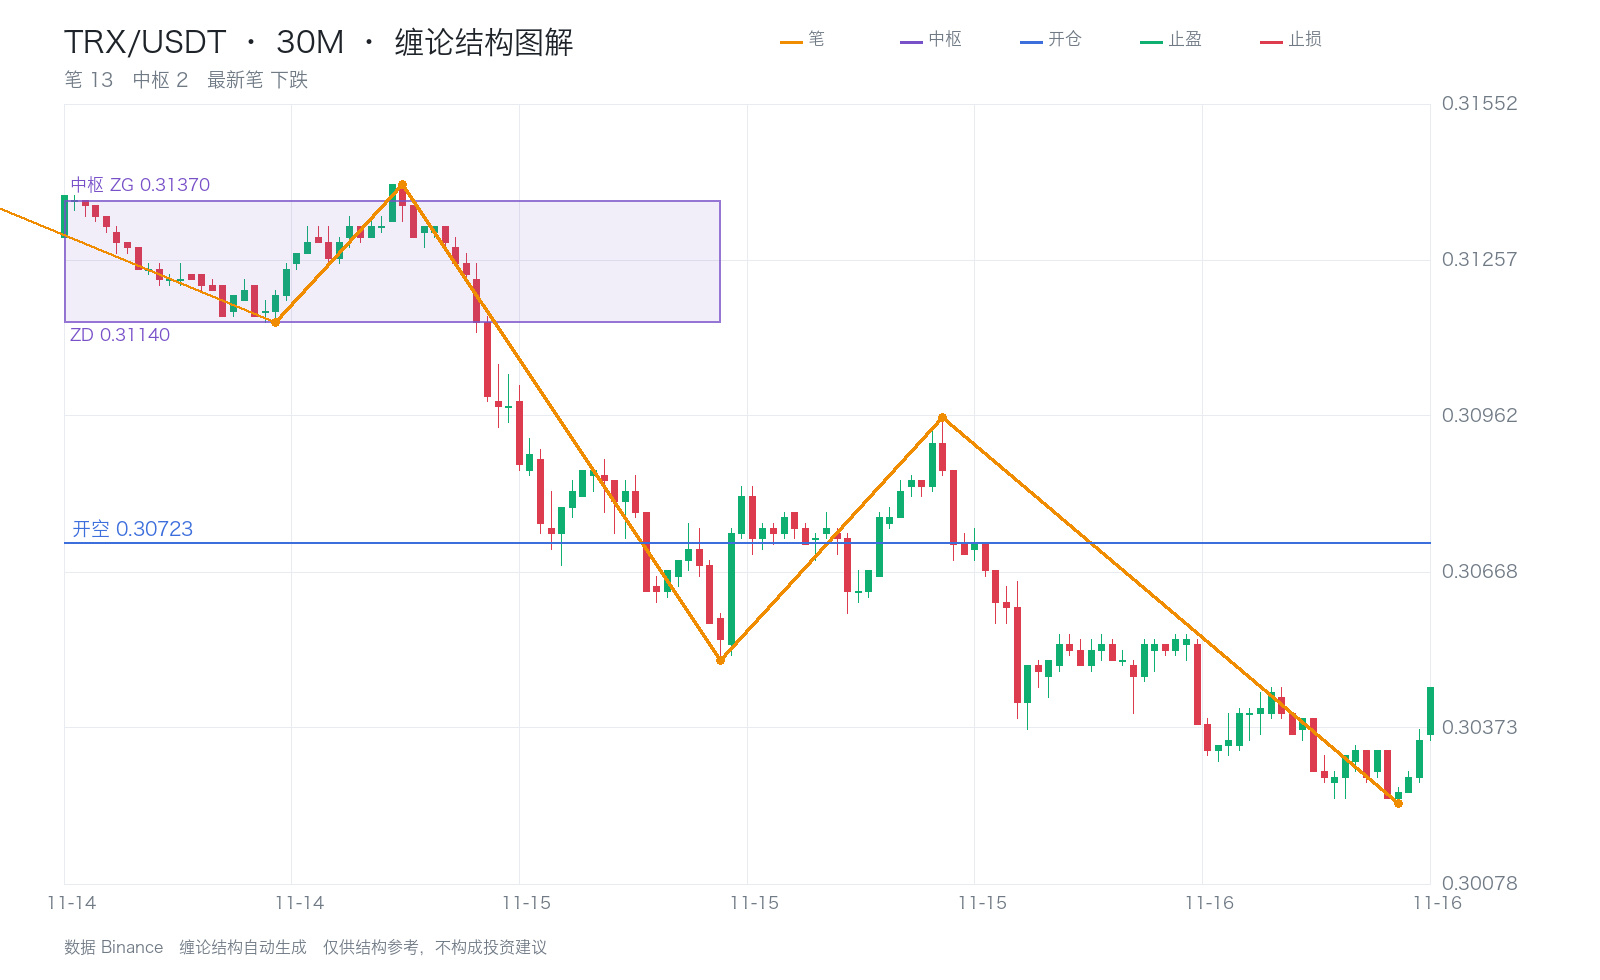
A 3-sell signal appeared on the TRX 30-minute chart, with a short entry at 0.30723.
The central zone it just left was 0.31140–0.31370. After breaking below it, the price has not returned to the zone.
According to Chan theory, the first rebound after a breakdown that fails to re-enter the central zone is a 3-sell signal—the clearest short entry point.
Looking at the next two higher timeframes, both the 4-hour and daily charts are below their respective central zones, confirming that the broader trend is also downward, which validates the 3-sell signal.
Stop-loss at 0.31644 (about 3.0% from entry); take-profit at 0.28879. The downside is limited, while the potential gain is greater.
This trade has already hit its take-profit and been closed, for a return of +1.04%.
$TRX $BTC $ETH #缠论 #ETF资金流 #ETF outflows
A 3-sell signal appeared on the TRX 30-minute chart, with a short entry at 0.30723.
The central zone it just left was 0.31140–0.31370. After breaking below it, the price has not returned to the zone.
According to Chan theory, the first rebound after a breakdown that fails to re-enter the central zone is a 3-sell signal—the clearest short entry point.
Looking at the next two higher timeframes, both the 4-hour and daily charts are below their respective central zones, confirming that the broader trend is also downward, which validates the 3-sell signal.
Stop-loss at 0.31644 (about 3.0% from entry); take-profit at 0.28879. The downside is limited, while the potential gain is greater.
This trade has already hit its take-profit and been closed, for a return of +1.04%.
$TRX $BTC $ETH #缠论 #ETF资金流 #ETF outflows
The central zone it just left was 0.31140–0.31370. After breaking below it, the price has not returned to the zone.
According to Chan theory, the first rebound after a breakdown that fails to re-enter the central zone is a 3-sell signal—the clearest short entry point.
Looking at the next two higher timeframes, both the 4-hour and daily charts are below their respective central zones, confirming that the broader trend is also downward, which validates the 3-sell signal.
Stop-loss at 0.31644 (about 3.0% from entry); take-profit at 0.28879. The downside is limited, while the potential gain is greater.
This trade has already hit its take-profit and been closed, for a return of +1.04%.
$TRX $BTC $ETH #缠论 #ETF资金流 #ETF outflows
6
·
--
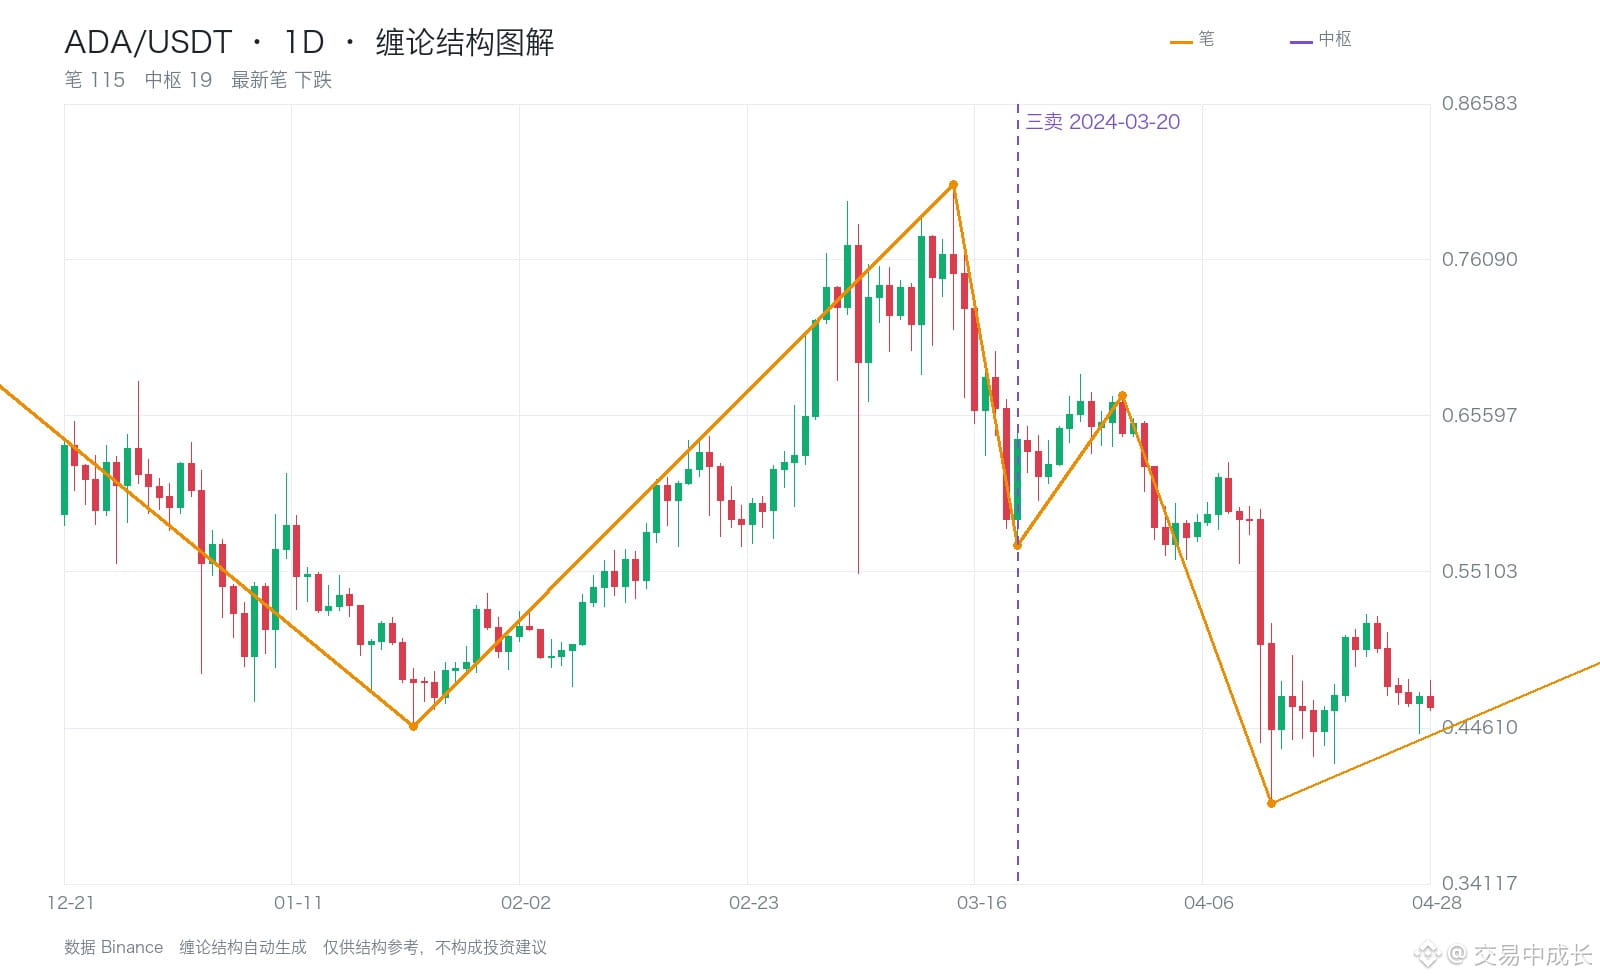
Let’s look at a historical example: On March 20, 2024, ADA showed a third-buy signal on the 1d timeframe.
The reference level for the corresponding center was 0.26710, and the signal price of 0.56910 was above the center’s upper boundary of 0.26710.
After the signal appeared, the price rose to a high of 0.68420 within 20 candlesticks, a gain of 20.2% from the signal price (closing at 0.59150).
That’s the value of a third buy: the center determines the level, the stop-loss goes where the structure is invalidated, and losses stay small while gains can be large.
History doesn’t simply repeat itself, but structures recur. It takes seeing the same pattern many times before you dare to act on a genuine signal.
$ADA $BTC $ETH #缠论 #ETF资金流 #ETF outflows
Let’s look at a historical example: On March 20, 2024, ADA showed a third-buy signal on the 1d timeframe.
The reference level for the corresponding center was 0.26710, and the signal price of 0.56910 was above the center’s upper boundary of 0.26710.
After the signal appeared, the price rose to a high of 0.68420 within 20 candlesticks, a gain of 20.2% from the signal price (closing at 0.59150).
That’s the value of a third buy: the center determines the level, the stop-loss goes where the structure is invalidated, and losses stay small while gains can be large.
History doesn’t simply repeat itself, but structures recur. It takes seeing the same pattern many times before you dare to act on a genuine signal.
$ADA $BTC $ETH #缠论 #ETF资金流 #ETF outflows
The reference level for the corresponding center was 0.26710, and the signal price of 0.56910 was above the center’s upper boundary of 0.26710.
After the signal appeared, the price rose to a high of 0.68420 within 20 candlesticks, a gain of 20.2% from the signal price (closing at 0.59150).
That’s the value of a third buy: the center determines the level, the stop-loss goes where the structure is invalidated, and losses stay small while gains can be large.
History doesn’t simply repeat itself, but structures recur. It takes seeing the same pattern many times before you dare to act on a genuine signal.
$ADA $BTC $ETH #缠论 #ETF资金流 #ETF outflows
5
Log in to explore more content
Join global crypto users on Binance Square
⚡️ Get latest and useful information about crypto.
💬 Trusted by the world’s largest crypto exchange.
👍 Discover real insights from verified creators.
Email / Phone number
Trending Topics
A Packed Week of Earnings and Data Tests Markets
42,360 views
302 Discussing
🚨🇺🇸 BIG WEEK AHEAD FOR THE MARKETS!
Markets are pricing in a Fed rate hike in December and $BTC could see some big moves next week.
Here's what's coming:
• Monday: Fed Chair Warsh speaks
• Tuesday: US Retail Sales + $NVDA earnings
• Wednesday: FOMC Minutes
• Thursday: Jobless Claims + Philly Fed Index
• Friday: Consumer Sentiment + Fed speeches
All eyes on $BTC as another important week begins.
#bitcoin
Mookie
·10 Likes
·5.7k views
AnthropicIPOTestsInvestorAppetiteForAI
56,940 views
970 Discussing
BitcoinExtendsLosingStreakToSixWeeks
17,430 views
328 Discussing