

CHART KING 亗
3.7k Posts

CHART KING 亗
Report
Block User
The market is a book and I read its pages Technical analysis is my craft and the decision is yours I set the targets and the stoploss the rest is God's guidance
20 Following
2.5K+ Followers
3.1K+ Liked
Posts
All
Quotes
Videos
PINNED
·
--
When will it stop 😂
{future}(BULLAUSDT)
When will it stop 😂
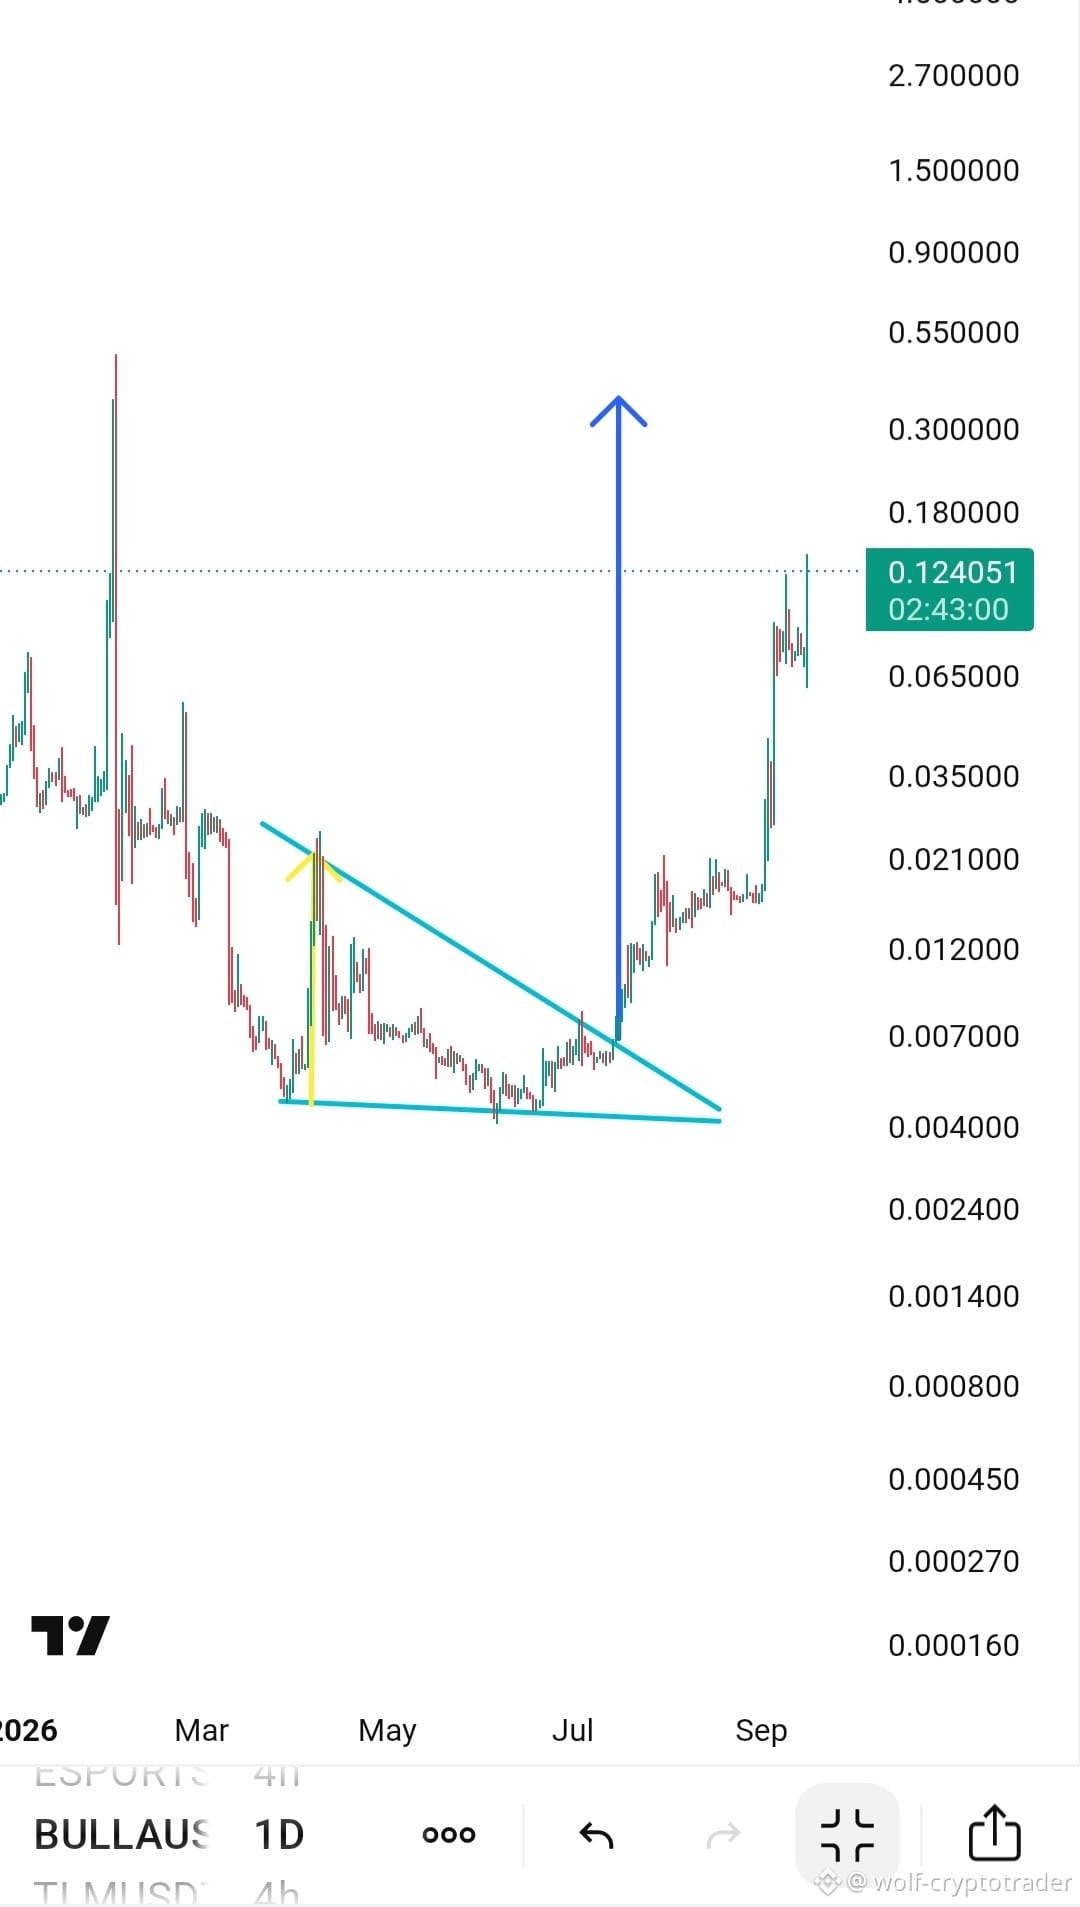
CHART KING 亗
·
--
🚀🔥 Buy long now — the descending triangle has been breached. Get ready for takeoff 💎
👀 Keep an eye on it — the price managed to break the descending triangle that had trapped the movement for weeks, confirming the start of a new uptrend wave
👀 Keep an eye on it — the price managed to break the descending triangle that had trapped the movement for weeks, confirming the start of a new uptrend wave
1
142
PINNED
·
--
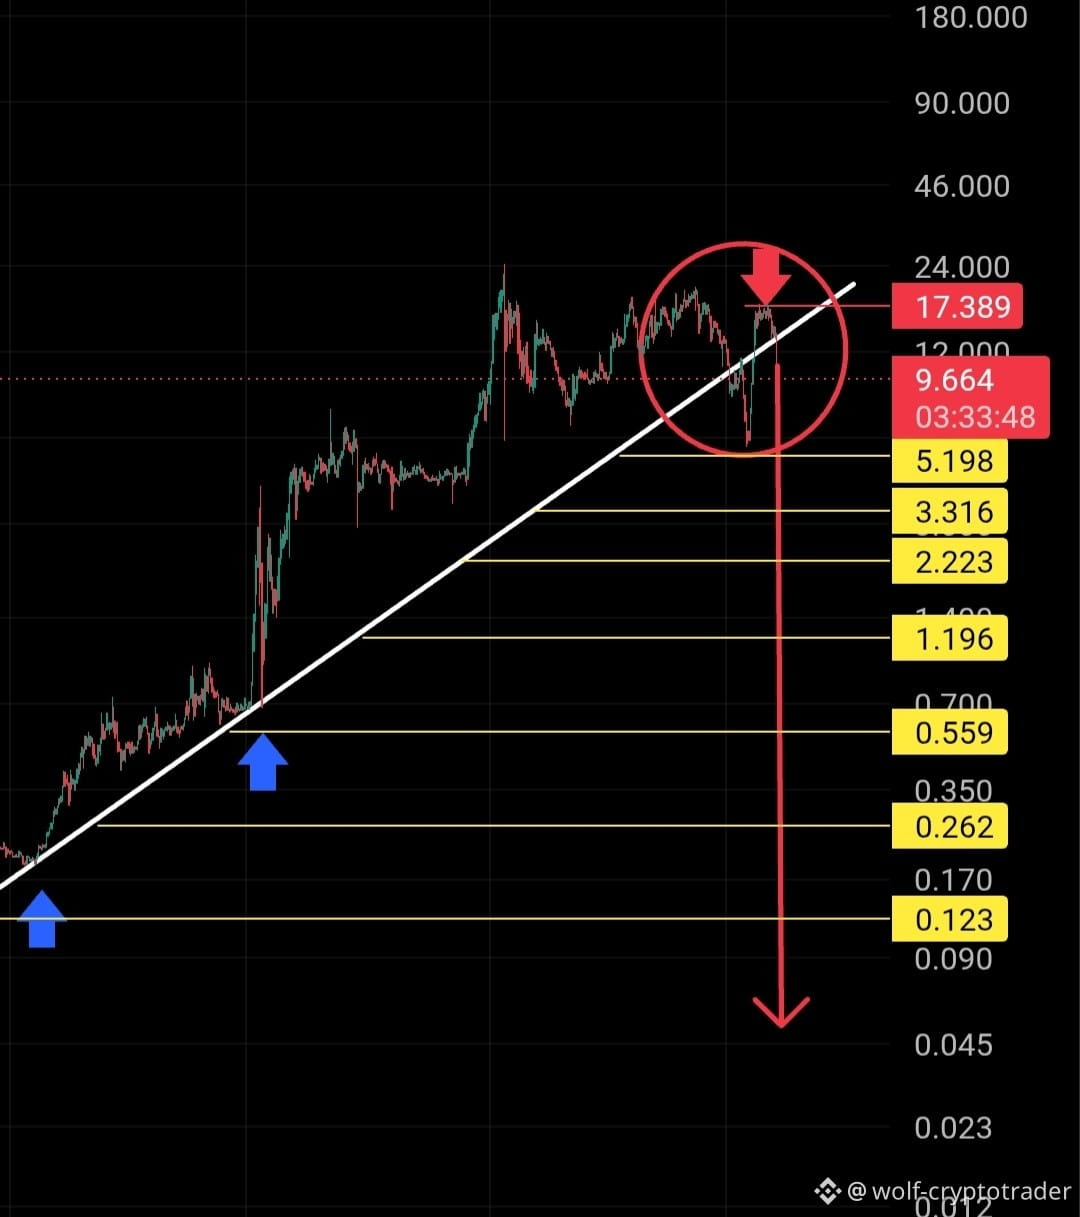
🔻💀Boooooom into Hell.. the collapse hasn't started yet💀📉
📉 Keep selling Short – the fall hasn't ended, and the targets haven't been hit yet 🎯
{future}(LABUSDT)
🔻💀Boooooom into Hell.. the collapse hasn't started yet💀📉
📉 Keep selling Short – the fall hasn't ended, and the targets haven't been hit yet 🎯
📉 Keep selling Short – the fall hasn't ended, and the targets haven't been hit yet 🎯
5
2
2.8k
·
--
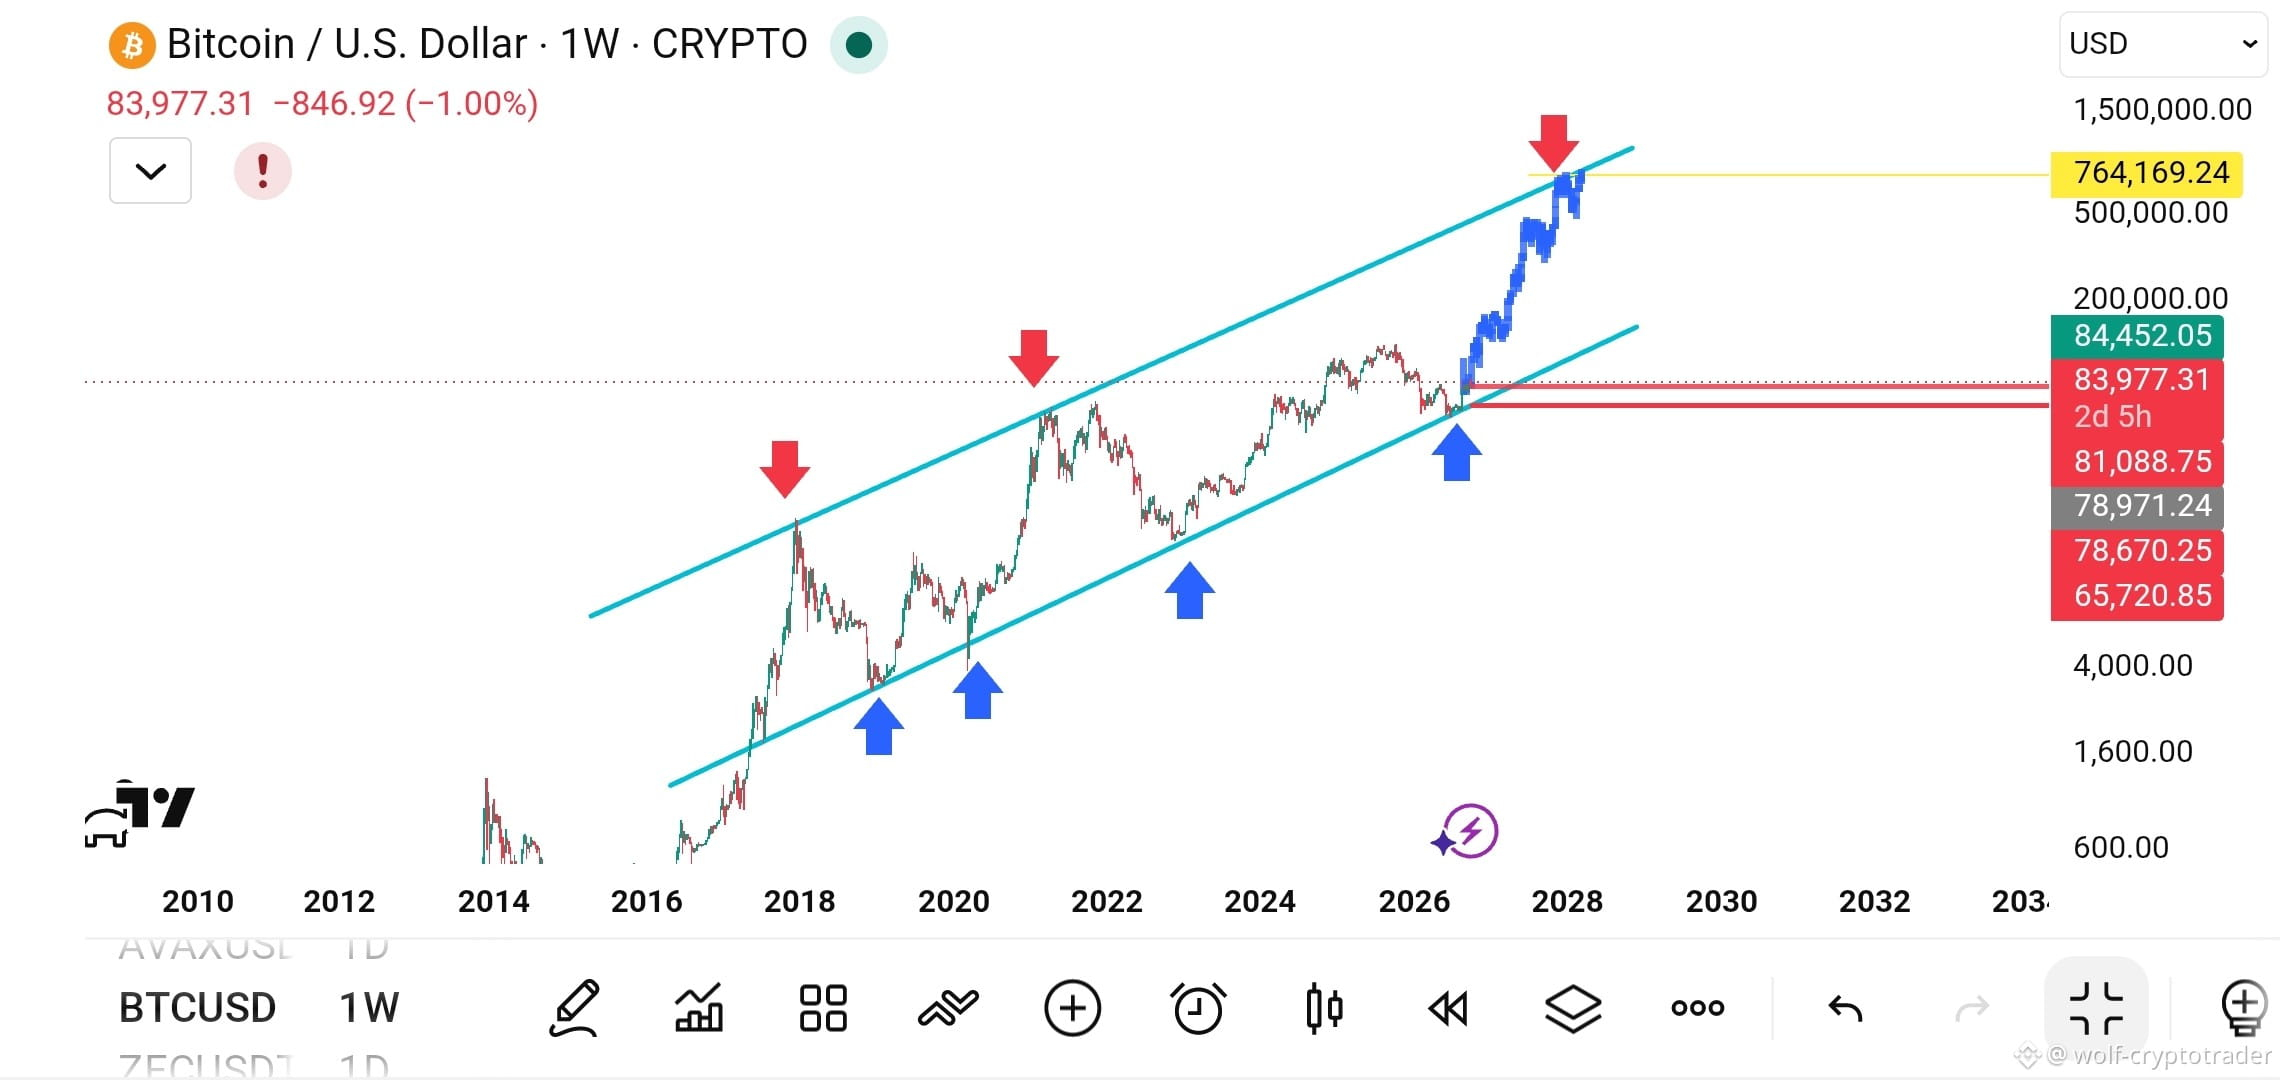
(BTC) The current correction is not a crash.. it’s a golden opportunity
📌 Why should you go LONG now?
1- The historical rising channel: the price is touching the lower limit of the channel (the previous blue arrows), and every time it touches this line, it launches into a strong upward wave
2- Leverage liquidation: the latest correction’s goal is to clean the market from open positions with high leverage, not to end the bullish trend
3- Institutions are watching the 80-84k dollar zones as ideal accumulation areas for funds and investors
{future}(BTCUSDT)
(BTC) The current correction is not a crash.. it’s a golden opportunity
📌 Why should you go LONG now?
1- The historical rising channel: the price is touching the lower limit of the channel (the previous blue arrows), and every time it touches this line, it launches into a strong upward wave
2- Leverage liquidation: the latest correction’s goal is to clean the market from open positions with high leverage, not to end the bullish trend
3- Institutions are watching the 80-84k dollar zones as ideal accumulation areas for funds and investors
📌 Why should you go LONG now?
1- The historical rising channel: the price is touching the lower limit of the channel (the previous blue arrows), and every time it touches this line, it launches into a strong upward wave
2- Leverage liquidation: the latest correction’s goal is to clean the market from open positions with high leverage, not to end the bullish trend
3- Institutions are watching the 80-84k dollar zones as ideal accumulation areas for funds and investors
322
·
--
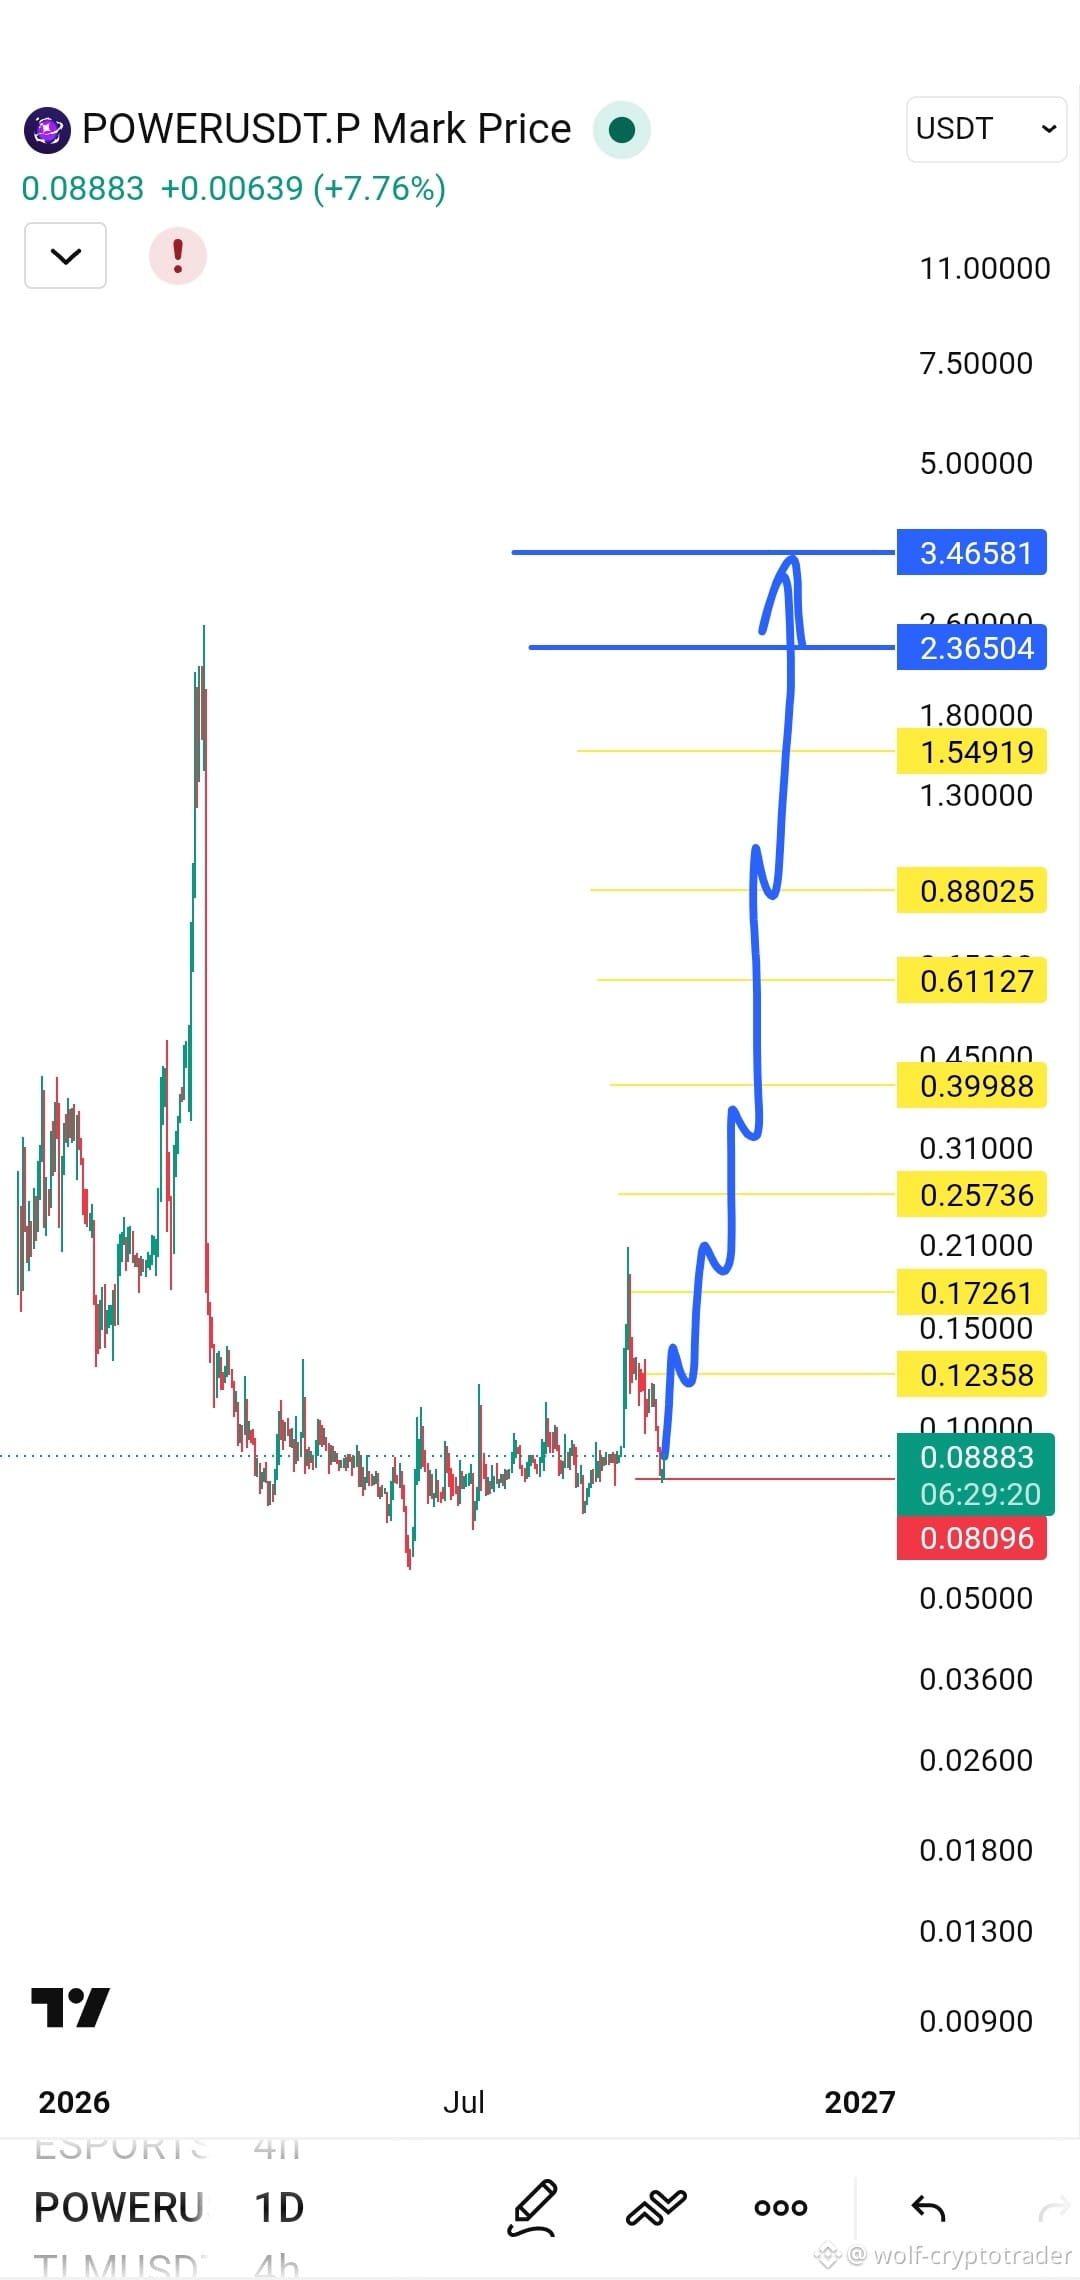
🟢 Available long
👀 Your eyes are on it, getting ready to fly to the moon 💎
Your targets and stop are on the chart
{future}(POWERUSDT)
🟢 Available long
👀 Your eyes are on it, getting ready to fly to the moon 💎
Your targets and stop are on the chart
👀 Your eyes are on it, getting ready to fly to the moon 💎
Your targets and stop are on the chart
1
852
·
--
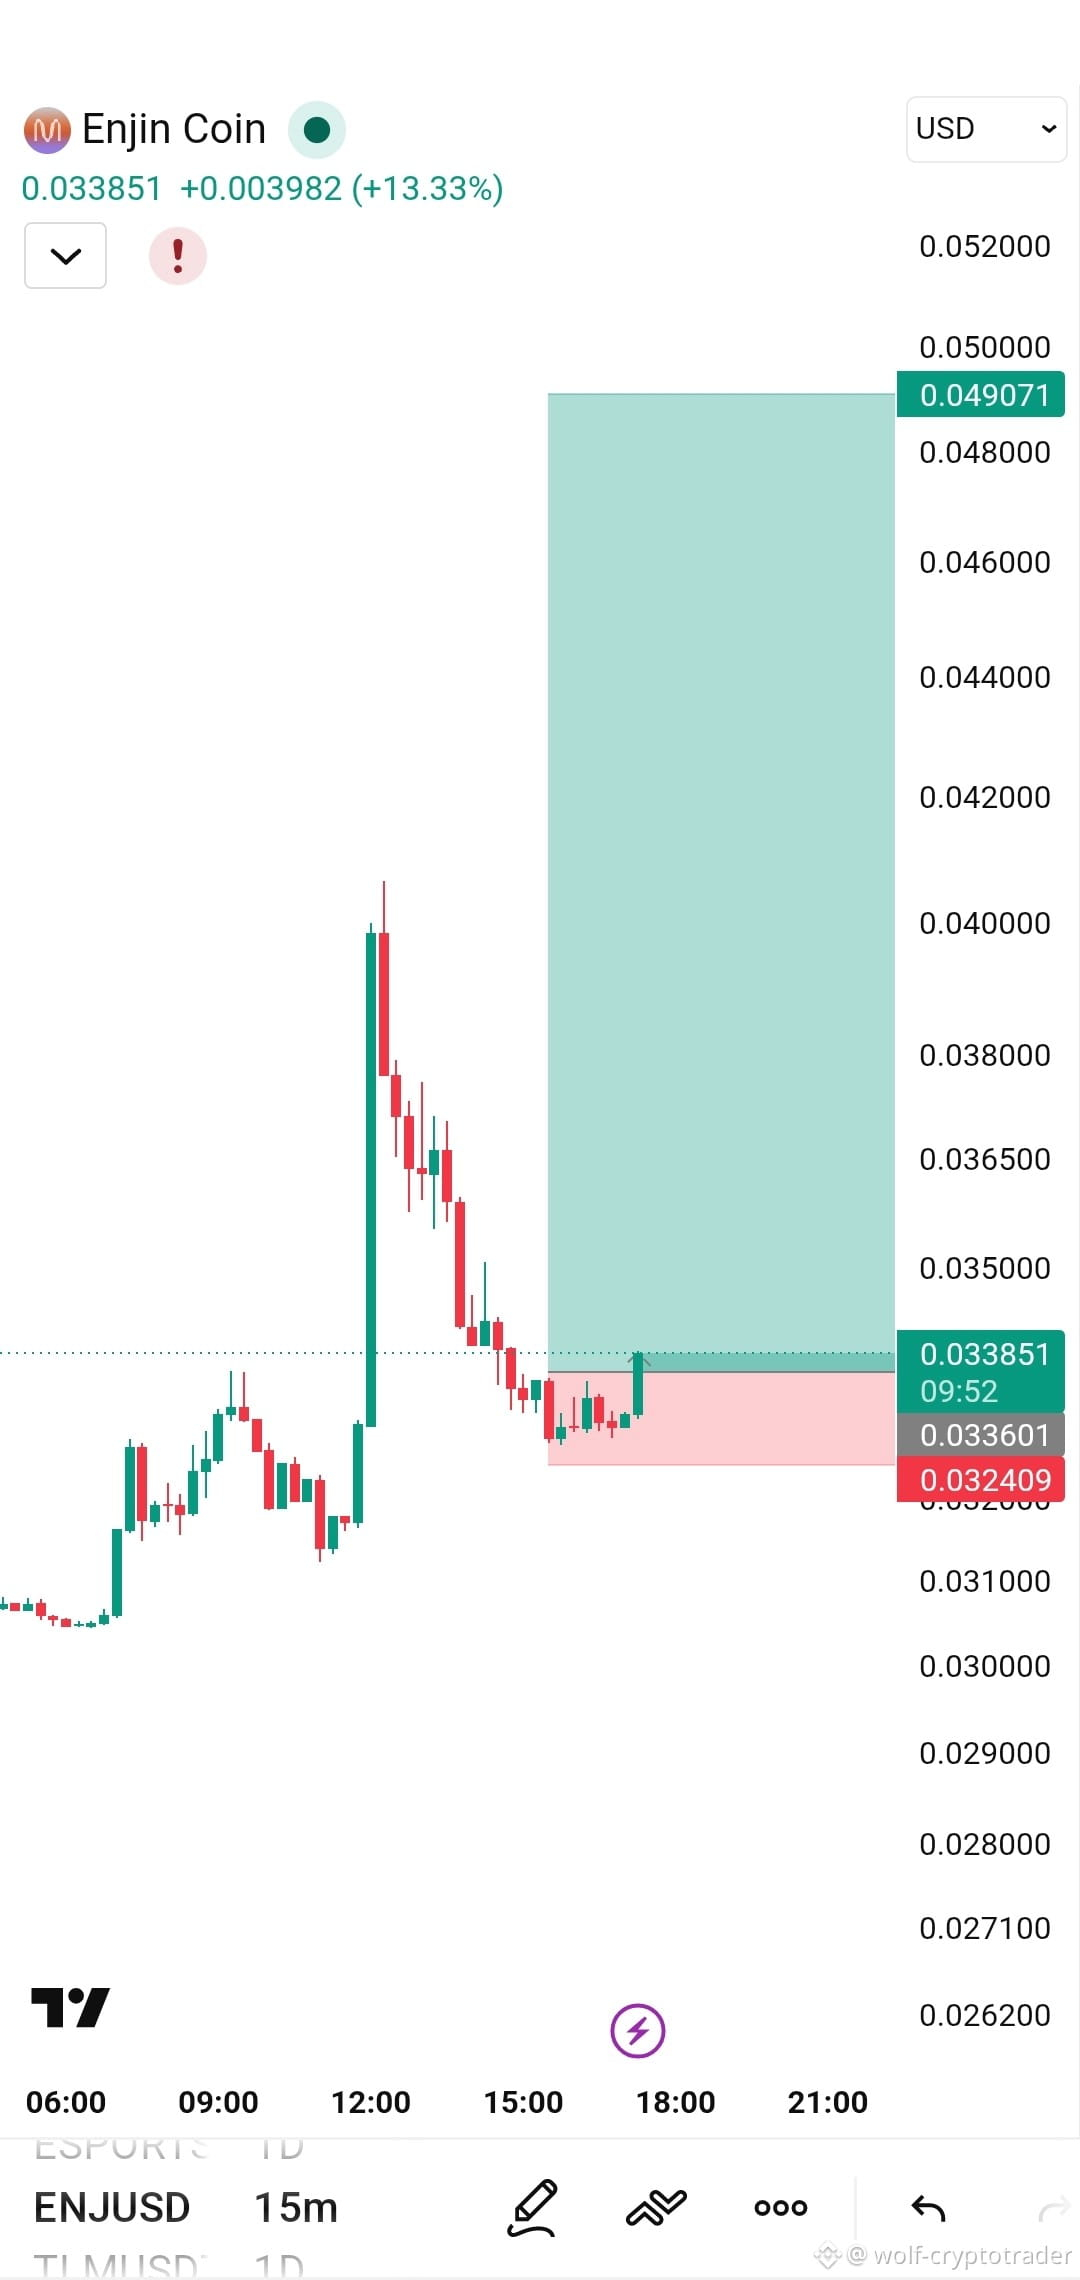
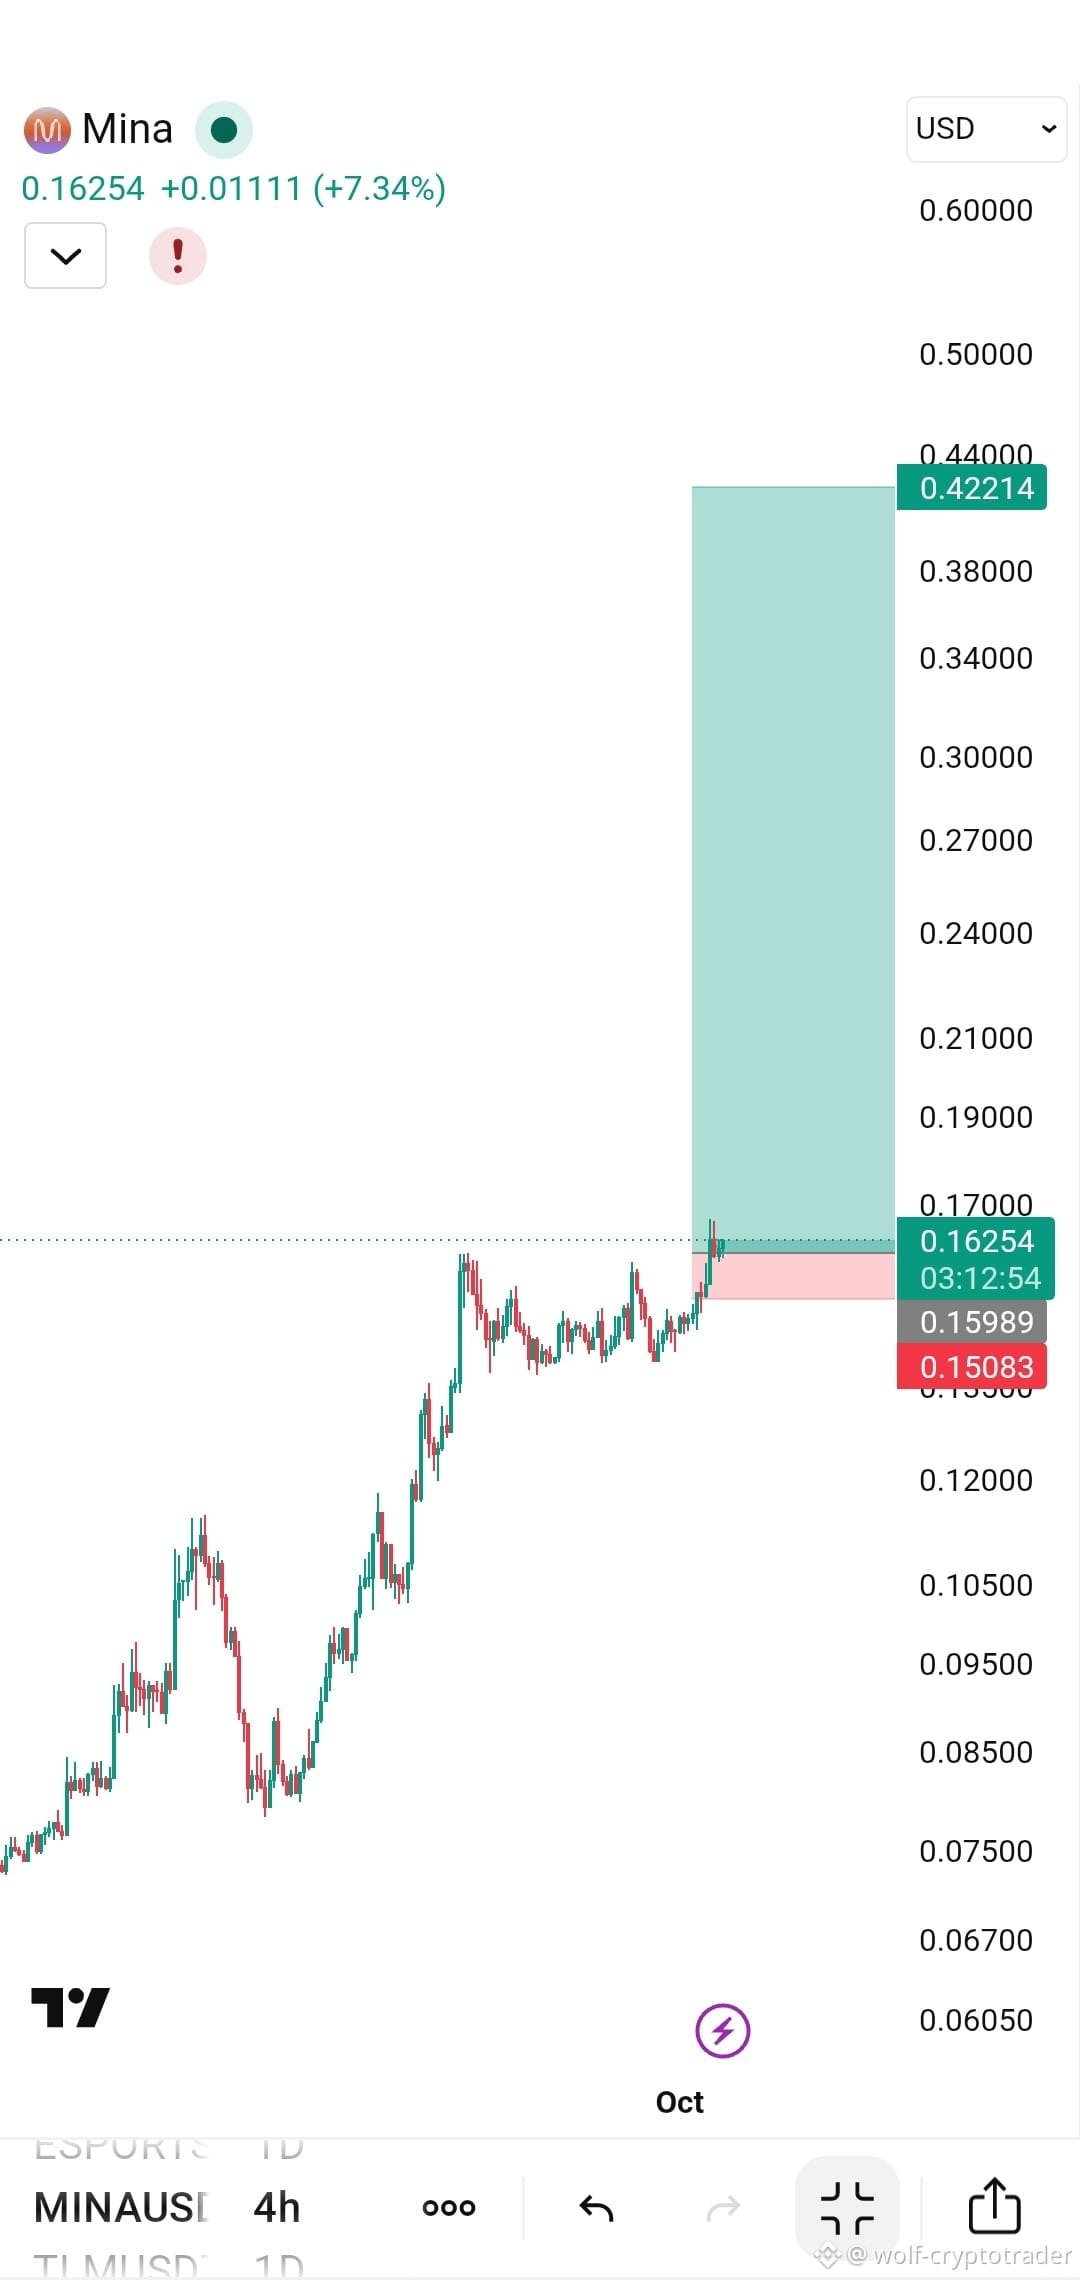
🎉💥 Boom! The goal is flying—first and second! 🏆
👀 Keep your eyes on it… keep going to the moon
{future}(ENJUSDT)
🎉💥 Boom! The goal is flying—first and second! 🏆
👀 Keep your eyes on it… keep going to the moon
👀 Keep your eyes on it… keep going to the moon
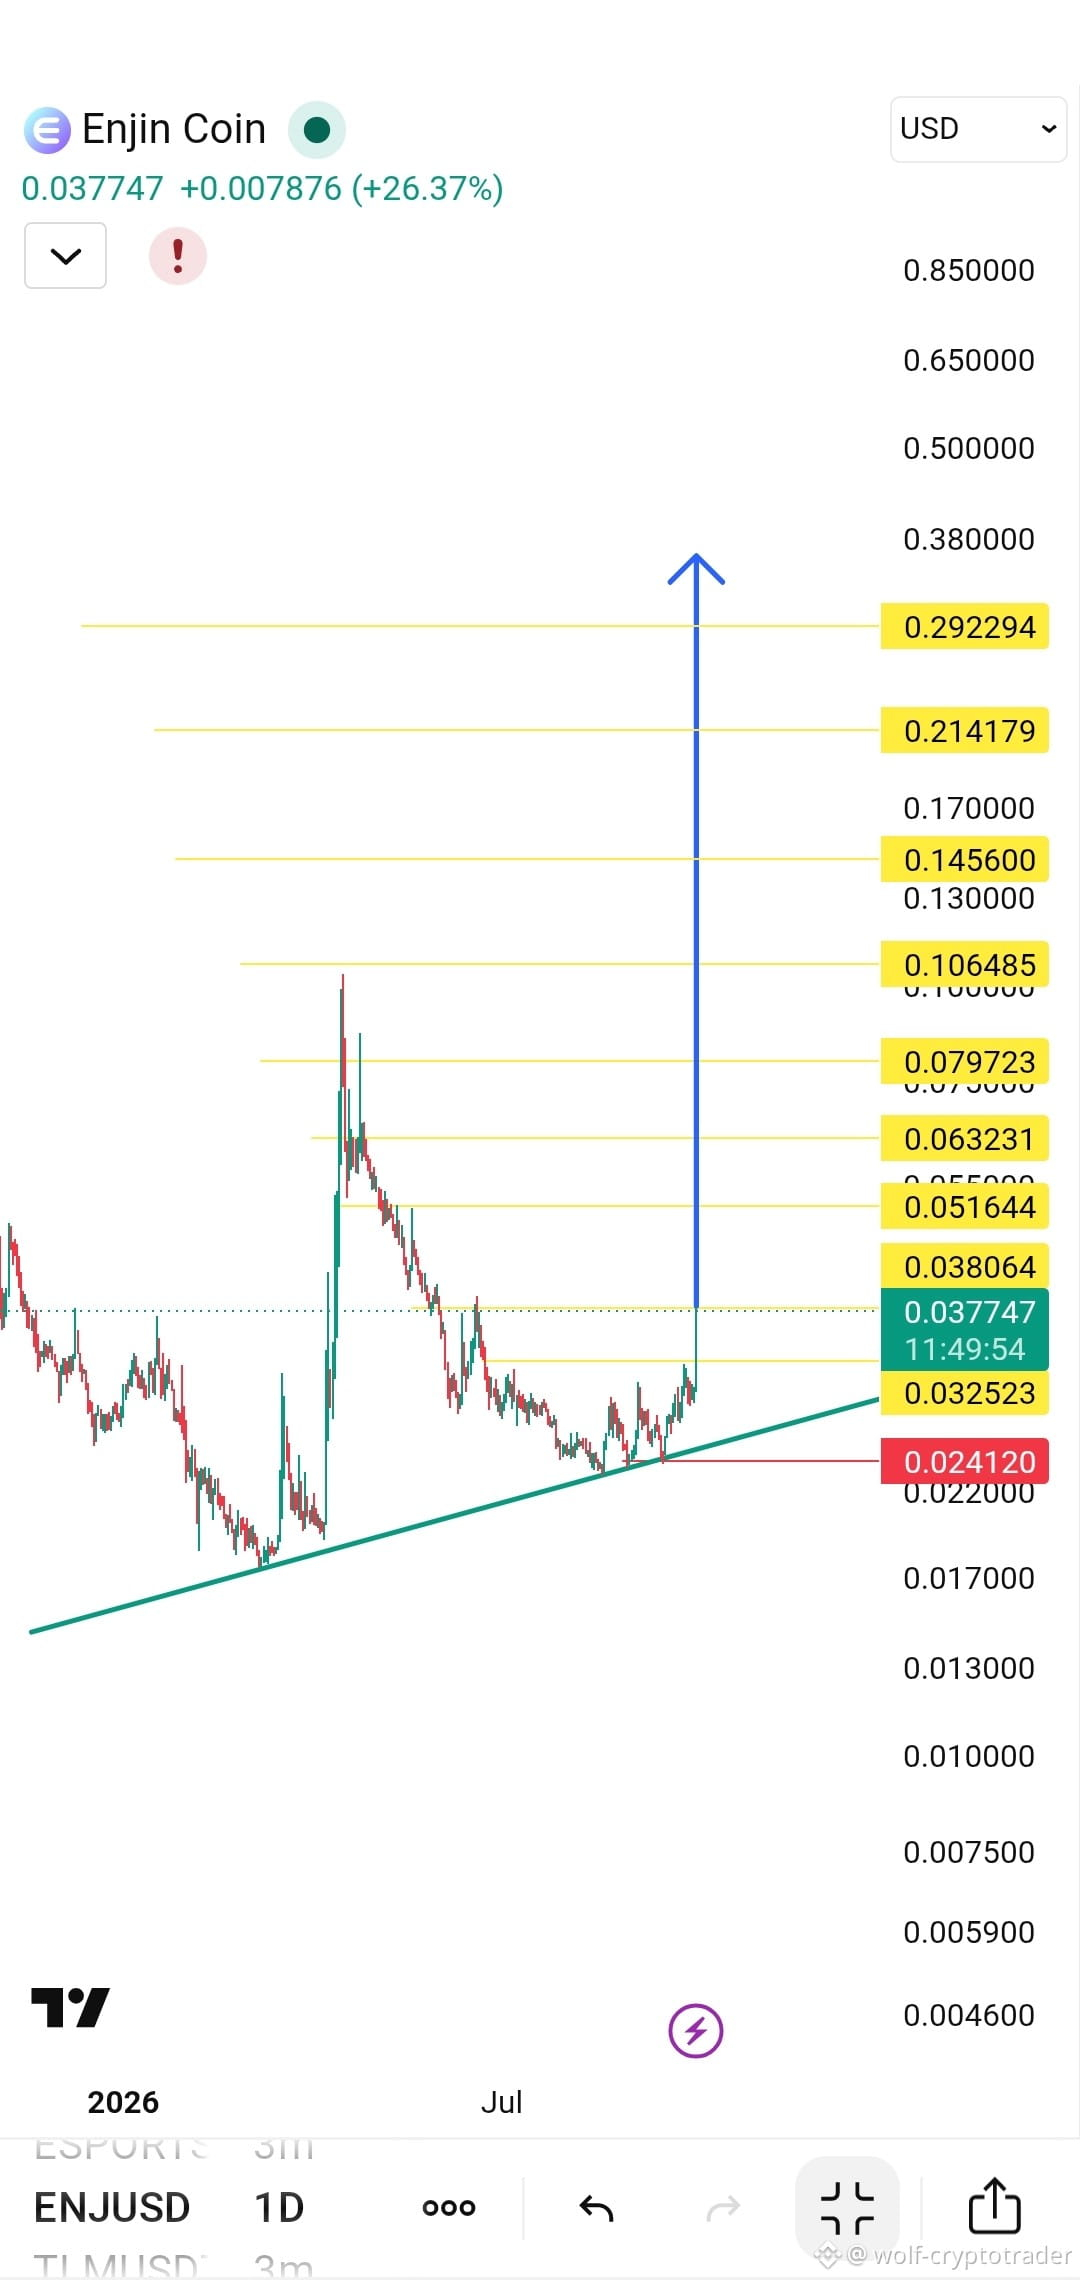
CHART KING 亗
·
--
🟢 Available long
👀 Your eyes are on the bottom, getting ready to launch to the moon 💎
Your targets and the stop on the chart won’t let you miss them
👀 Your eyes are on the bottom, getting ready to launch to the moon 💎
Your targets and the stop on the chart won’t let you miss them
397
·
--
Verified
📌 Why should you pay attention to APE coin?
✅ Updating ApeChain to ArbOS 51 (September 2026) improves network efficiency and gas, strengthening the technical foundation of the ecosystem.
✅ Draining the current sell-side accumulation after a 98% drop from the all-time high provides an ideal entry point for cycle investors.
✅ Trading volume rises with any attempt to break in, supporting the continuation of momentum
Current technical outlook
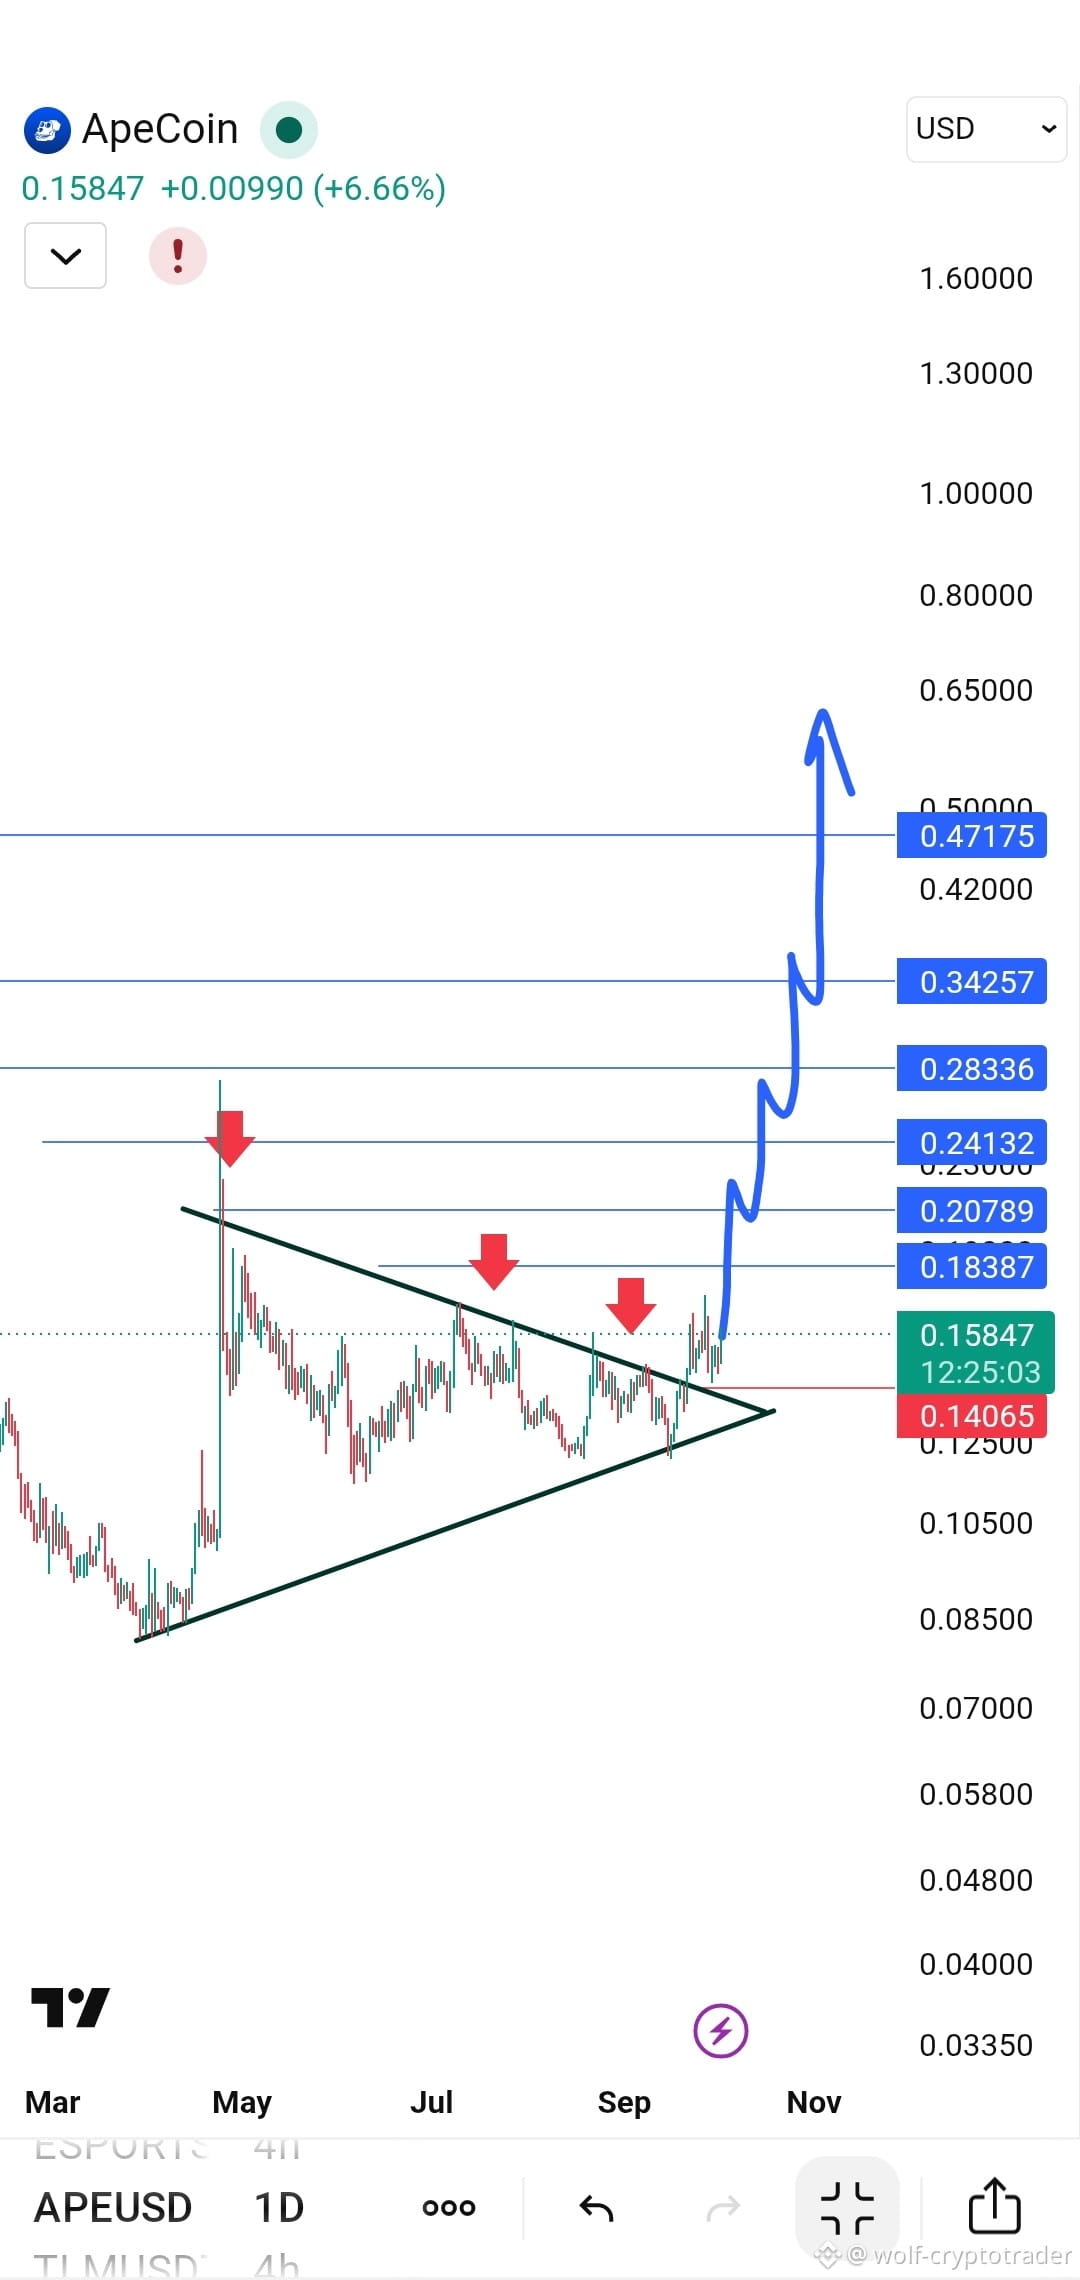
A breakout from a symmetrical triangle on the daily chart with high confidence and a positive close, with the previous resistance turning into structural support.
A successful retest of the $0.14 zone confirms the breakout’s validity and that buyers remain in control.
Current price ~0.158$, with stability above the moving averages (EMAs)
{future}(APEUSDT)
📌 Why should you pay attention to APE coin?
✅ Updating ApeChain to ArbOS 51 (September 2026) improves network efficiency and gas, strengthening the technical foundation of the ecosystem.
✅ Draining the current sell-side accumulation after a 98% drop from the all-time high provides an ideal entry point for cycle investors.
✅ Trading volume rises with any attempt to break in, supporting the continuation of momentum
Current technical outlook
A breakout from a symmetrical triangle on the daily chart with high confidence and a positive close, with the previous resistance turning into structural support.
A successful retest of the $0.14 zone confirms the breakout’s validity and that buyers remain in control.
Current price ~0.158$, with stability above the moving averages (EMAs)
✅ Updating ApeChain to ArbOS 51 (September 2026) improves network efficiency and gas, strengthening the technical foundation of the ecosystem.
✅ Draining the current sell-side accumulation after a 98% drop from the all-time high provides an ideal entry point for cycle investors.
✅ Trading volume rises with any attempt to break in, supporting the continuation of momentum
Current technical outlook
A breakout from a symmetrical triangle on the daily chart with high confidence and a positive close, with the previous resistance turning into structural support.
A successful retest of the $0.14 zone confirms the breakout’s validity and that buyers remain in control.
Current price ~0.158$, with stability above the moving averages (EMAs)
473
·
--
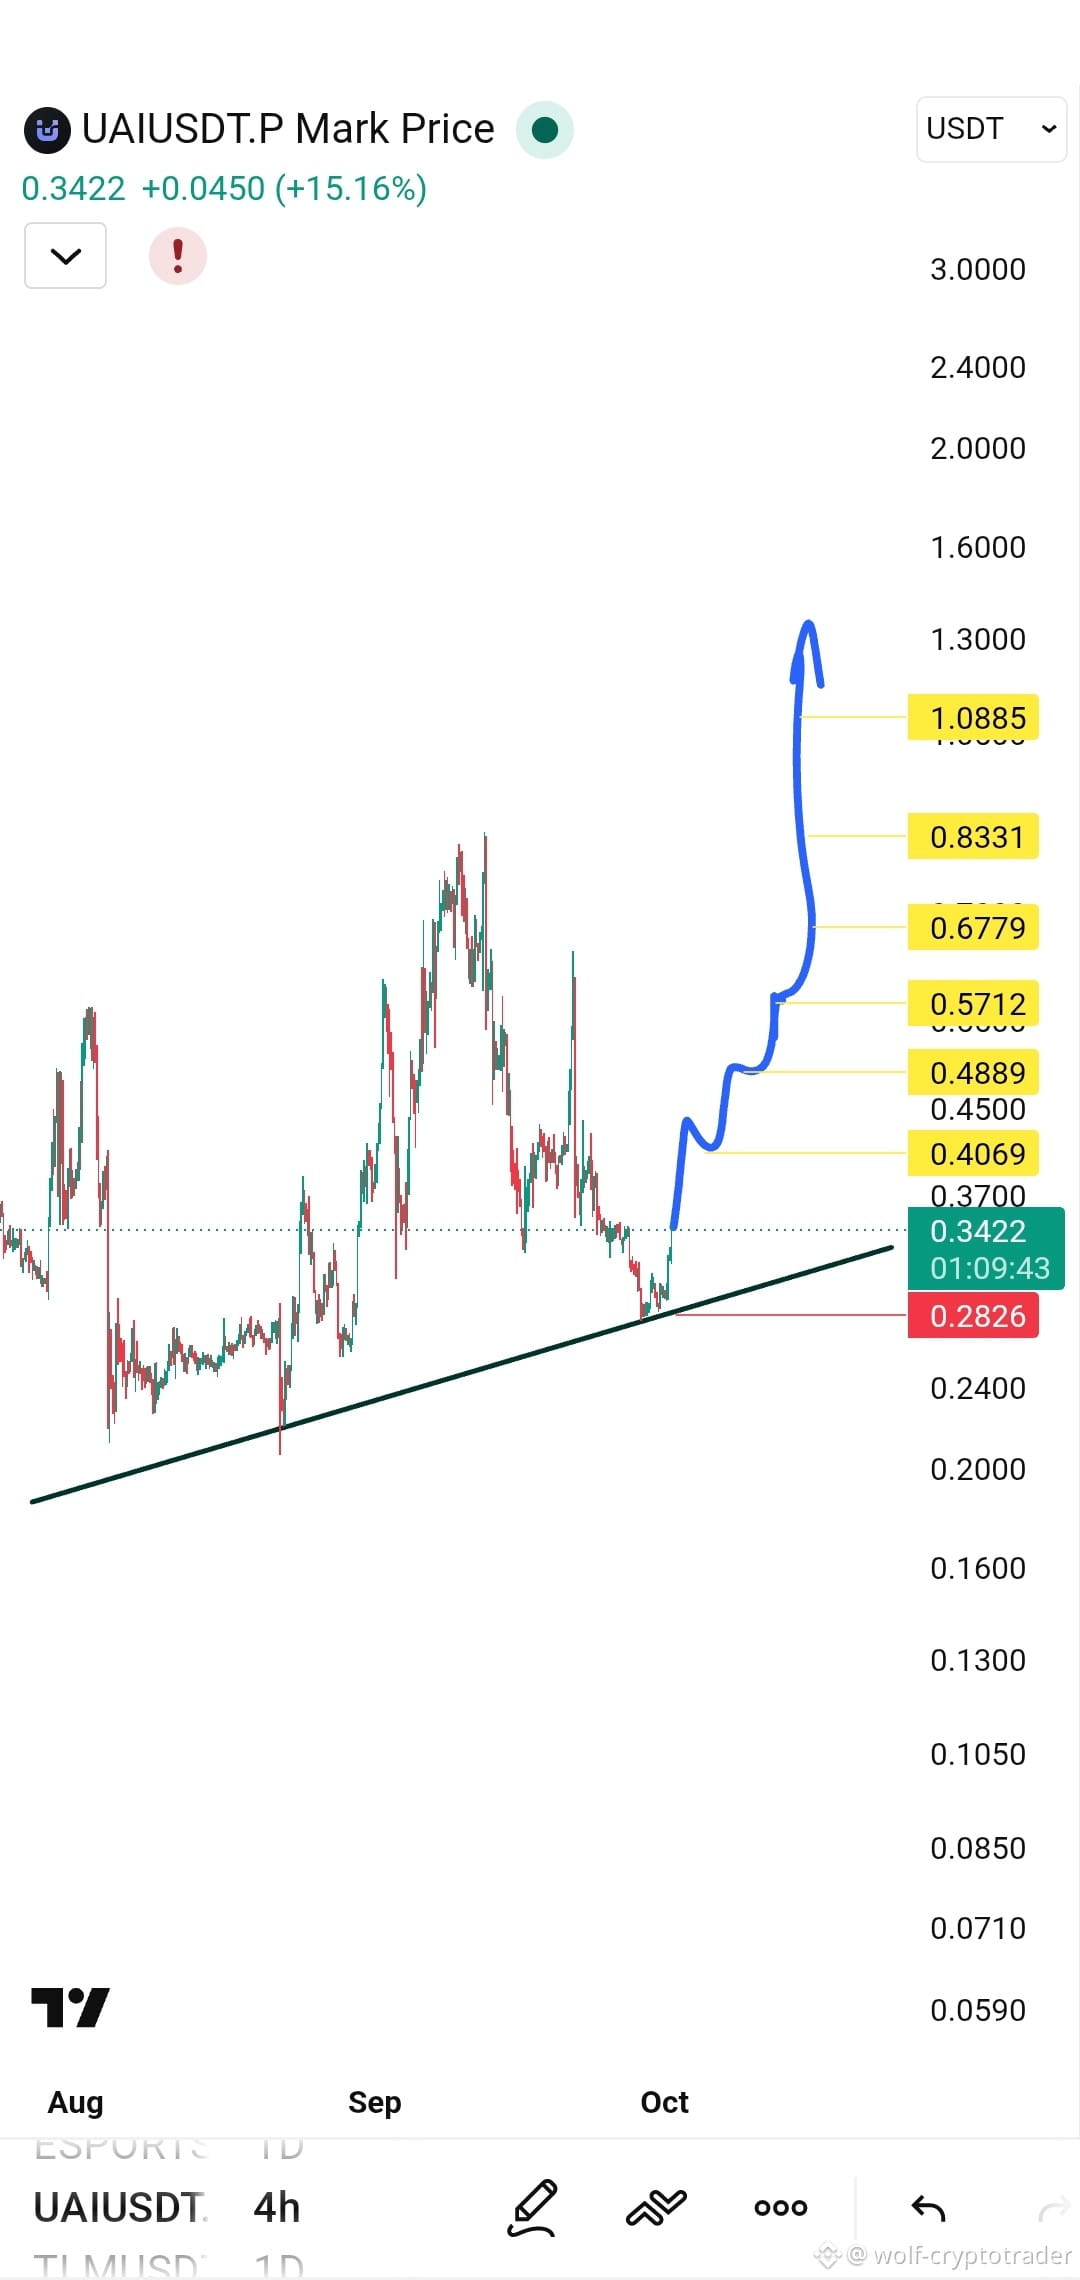
🟢 Available long
👀 Your eyes are on it, ready to launch to the moon 💎
Your targets and the stop on the chart will not let you miss
{future}(UAIUSDT)
🟢 Available long
👀 Your eyes are on it, ready to launch to the moon 💎
Your targets and the stop on the chart will not let you miss
👀 Your eyes are on it, ready to launch to the moon 💎
Your targets and the stop on the chart will not let you miss
1
241
·
--
Why did the “lobster” (龙虾) rise? And are they targeting $0.8? Here is a comprehensive analysis of the reasons and the targeted technical scenario
📌 First: Why did the “lobster” (龙虾) rise?
1. Strong connection to “OpenClaw” and the AI narrative
“龙虾” is not just an ordinary meme coin; it is the symbolic representation of the “lobster farming” phenomenon in Chinese society, linked to the OpenClaw AI Agent project (known by the red lobster icon). This association caused it to attract flows from the developer community and AI enthusiasts, giving it real momentum.
2. Successive listings on major platforms
· LBank listed the coin on March 9, 2026.
· KuCoin listed it on August 27, 2026.
· Bybit listed a perpetual contract (Perpetual) with a leverage of up to 10x on September 14, 2026.
· Binance Alpha: It is said that this was the biggest turning point, leading to a significant acceleration of momentum
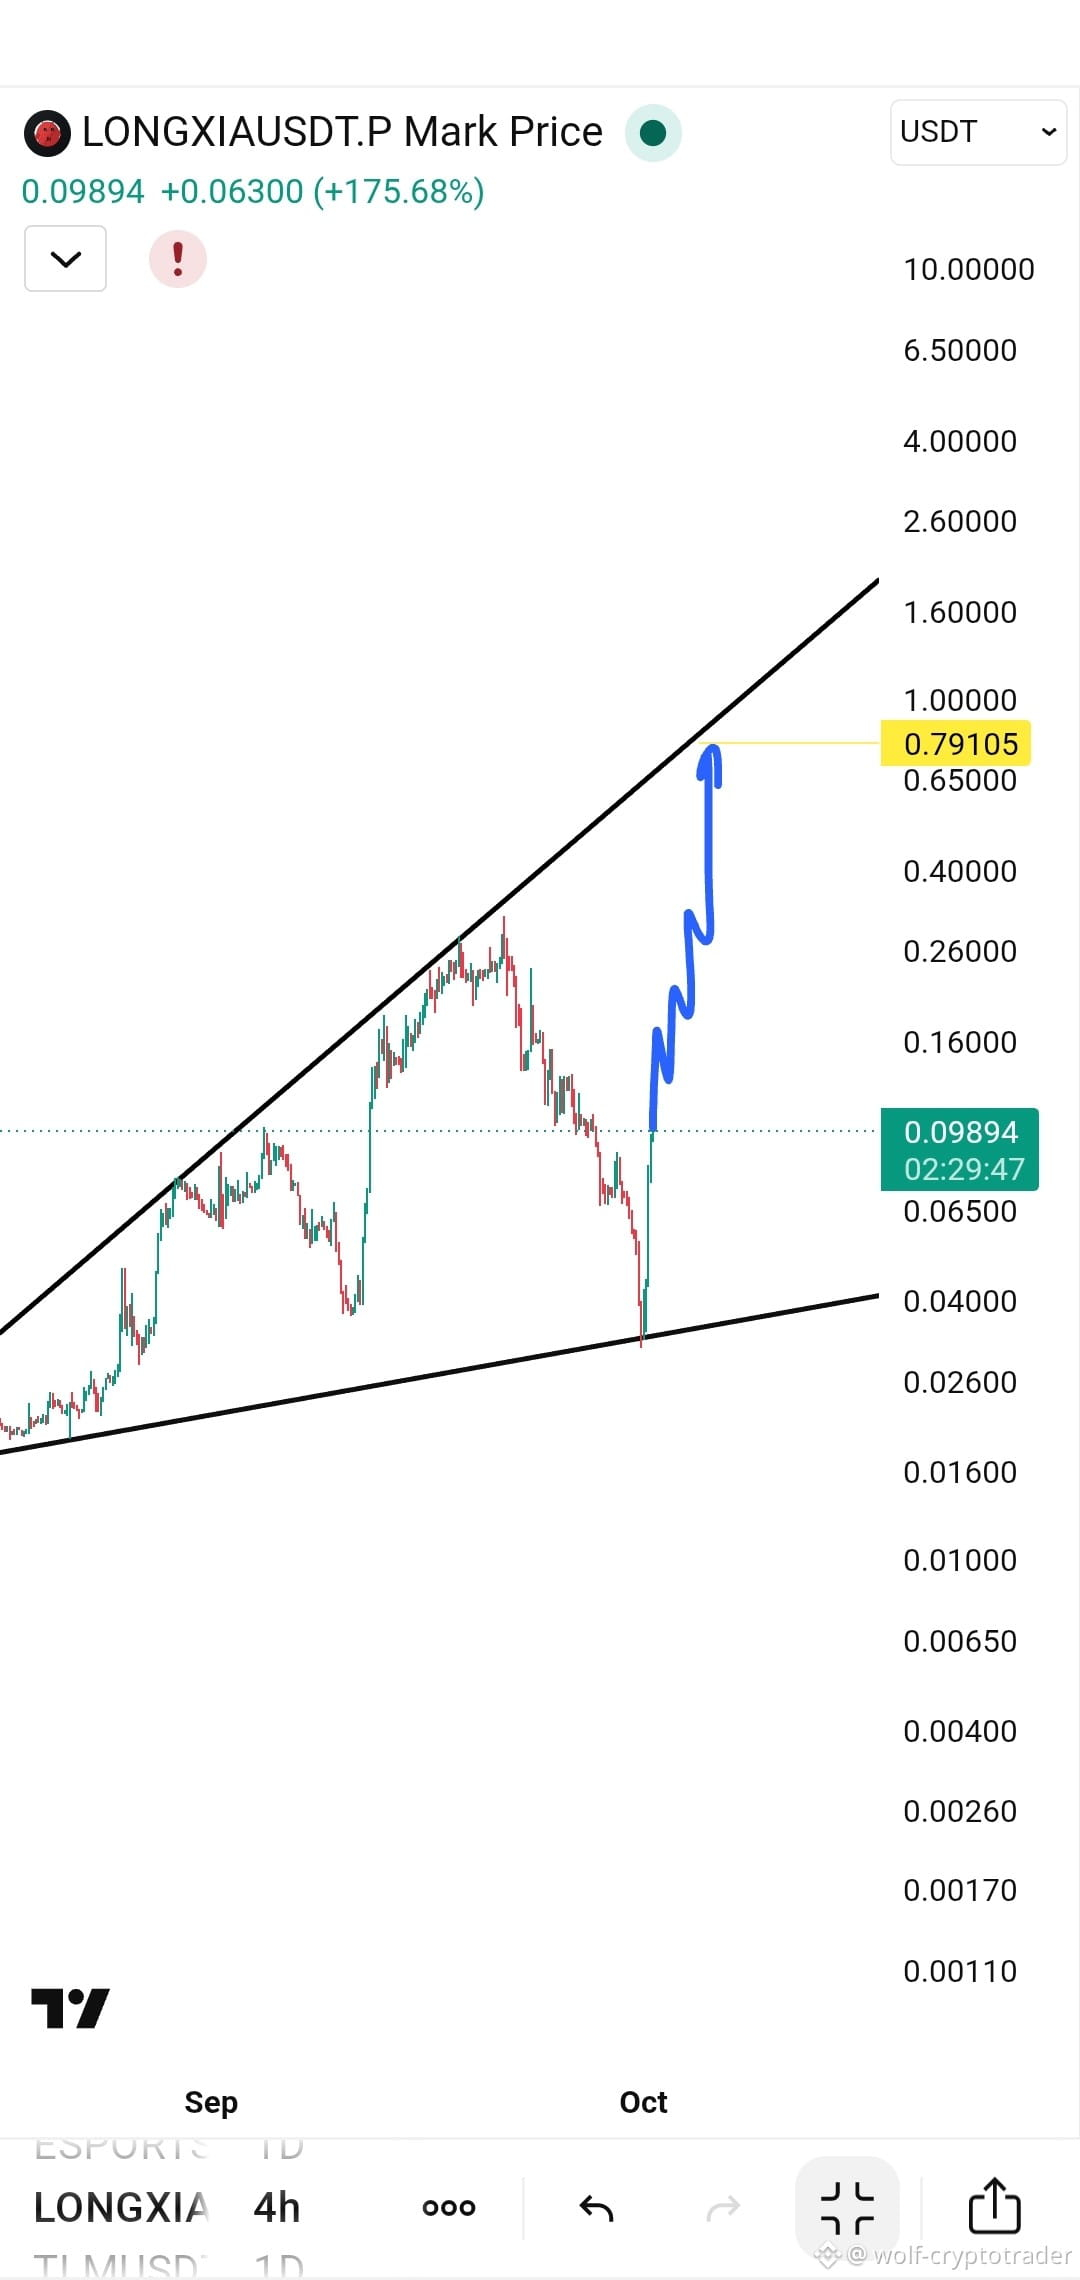
📊 Second: Technical analysis for the $0.8 scenario
Based on the chart (4 hours)
1. Bounce from the bottom of the rising channel
The price bounced strongly from the lower boundary of the rising channel that has extended since September, indicating that buyers successfully defended the support.
{future}(龙虾USDT)
Why did the “lobster” (龙虾) rise? And are they targeting $0.8? Here is a comprehensive analysis of the reasons and the targeted technical scenario
📌 First: Why did the “lobster” (龙虾) rise?
1. Strong connection to “OpenClaw” and the AI narrative
“龙虾” is not just an ordinary meme coin; it is the symbolic representation of the “lobster farming” phenomenon in Chinese society, linked to the OpenClaw AI Agent project (known by the red lobster icon). This association caused it to attract flows from the developer community and AI enthusiasts, giving it real momentum.
2. Successive listings on major platforms
· LBank listed the coin on March 9, 2026.
· KuCoin listed it on August 27, 2026.
· Bybit listed a perpetual contract (Perpetual) with a leverage of up to 10x on September 14, 2026.
· Binance Alpha: It is said that this was the biggest turning point, leading to a significant acceleration of momentum
📊 Second: Technical analysis for the $0.8 scenario
Based on the chart (4 hours)
1. Bounce from the bottom of the rising channel
The price bounced strongly from the lower boundary of the rising channel that has extended since September, indicating that buyers successfully defended the support.
📌 First: Why did the “lobster” (龙虾) rise?
1. Strong connection to “OpenClaw” and the AI narrative
“龙虾” is not just an ordinary meme coin; it is the symbolic representation of the “lobster farming” phenomenon in Chinese society, linked to the OpenClaw AI Agent project (known by the red lobster icon). This association caused it to attract flows from the developer community and AI enthusiasts, giving it real momentum.
2. Successive listings on major platforms
· LBank listed the coin on March 9, 2026.
· KuCoin listed it on August 27, 2026.
· Bybit listed a perpetual contract (Perpetual) with a leverage of up to 10x on September 14, 2026.
· Binance Alpha: It is said that this was the biggest turning point, leading to a significant acceleration of momentum
📊 Second: Technical analysis for the $0.8 scenario
Based on the chart (4 hours)
1. Bounce from the bottom of the rising channel
The price bounced strongly from the lower boundary of the rising channel that has extended since September, indicating that buyers successfully defended the support.
1
451
·
--
Partly True
🚨 Why You Shouldn’t Buy ZEC Now? 4 Reasons Buying ZEC Right Now Is An Unjustified Risk
After a historic, swift surge, negative signs are piling up for Zcash. Here’s why staying away is the smarter decision right now
1. 🕳️ A Hole in Core Trust An unproven security vulnerability in the privacy circuit (zk-SNARK) that hasn’t been proven safe against exploitation yet, threatening the credibility of the supply cap (21 million coins)
2. 🏛️ Eroding Governance A collective exit of the core development team (ECC) in early 2026, along with a drop in development activity to its lowest levels.
3. ⚖️ An Imminent Regulatory Ban on the European Anti–Money Laundering Regulation (AMLR) that will ban trading it in Europe by July 2027, with its removal beginning from Asian platforms
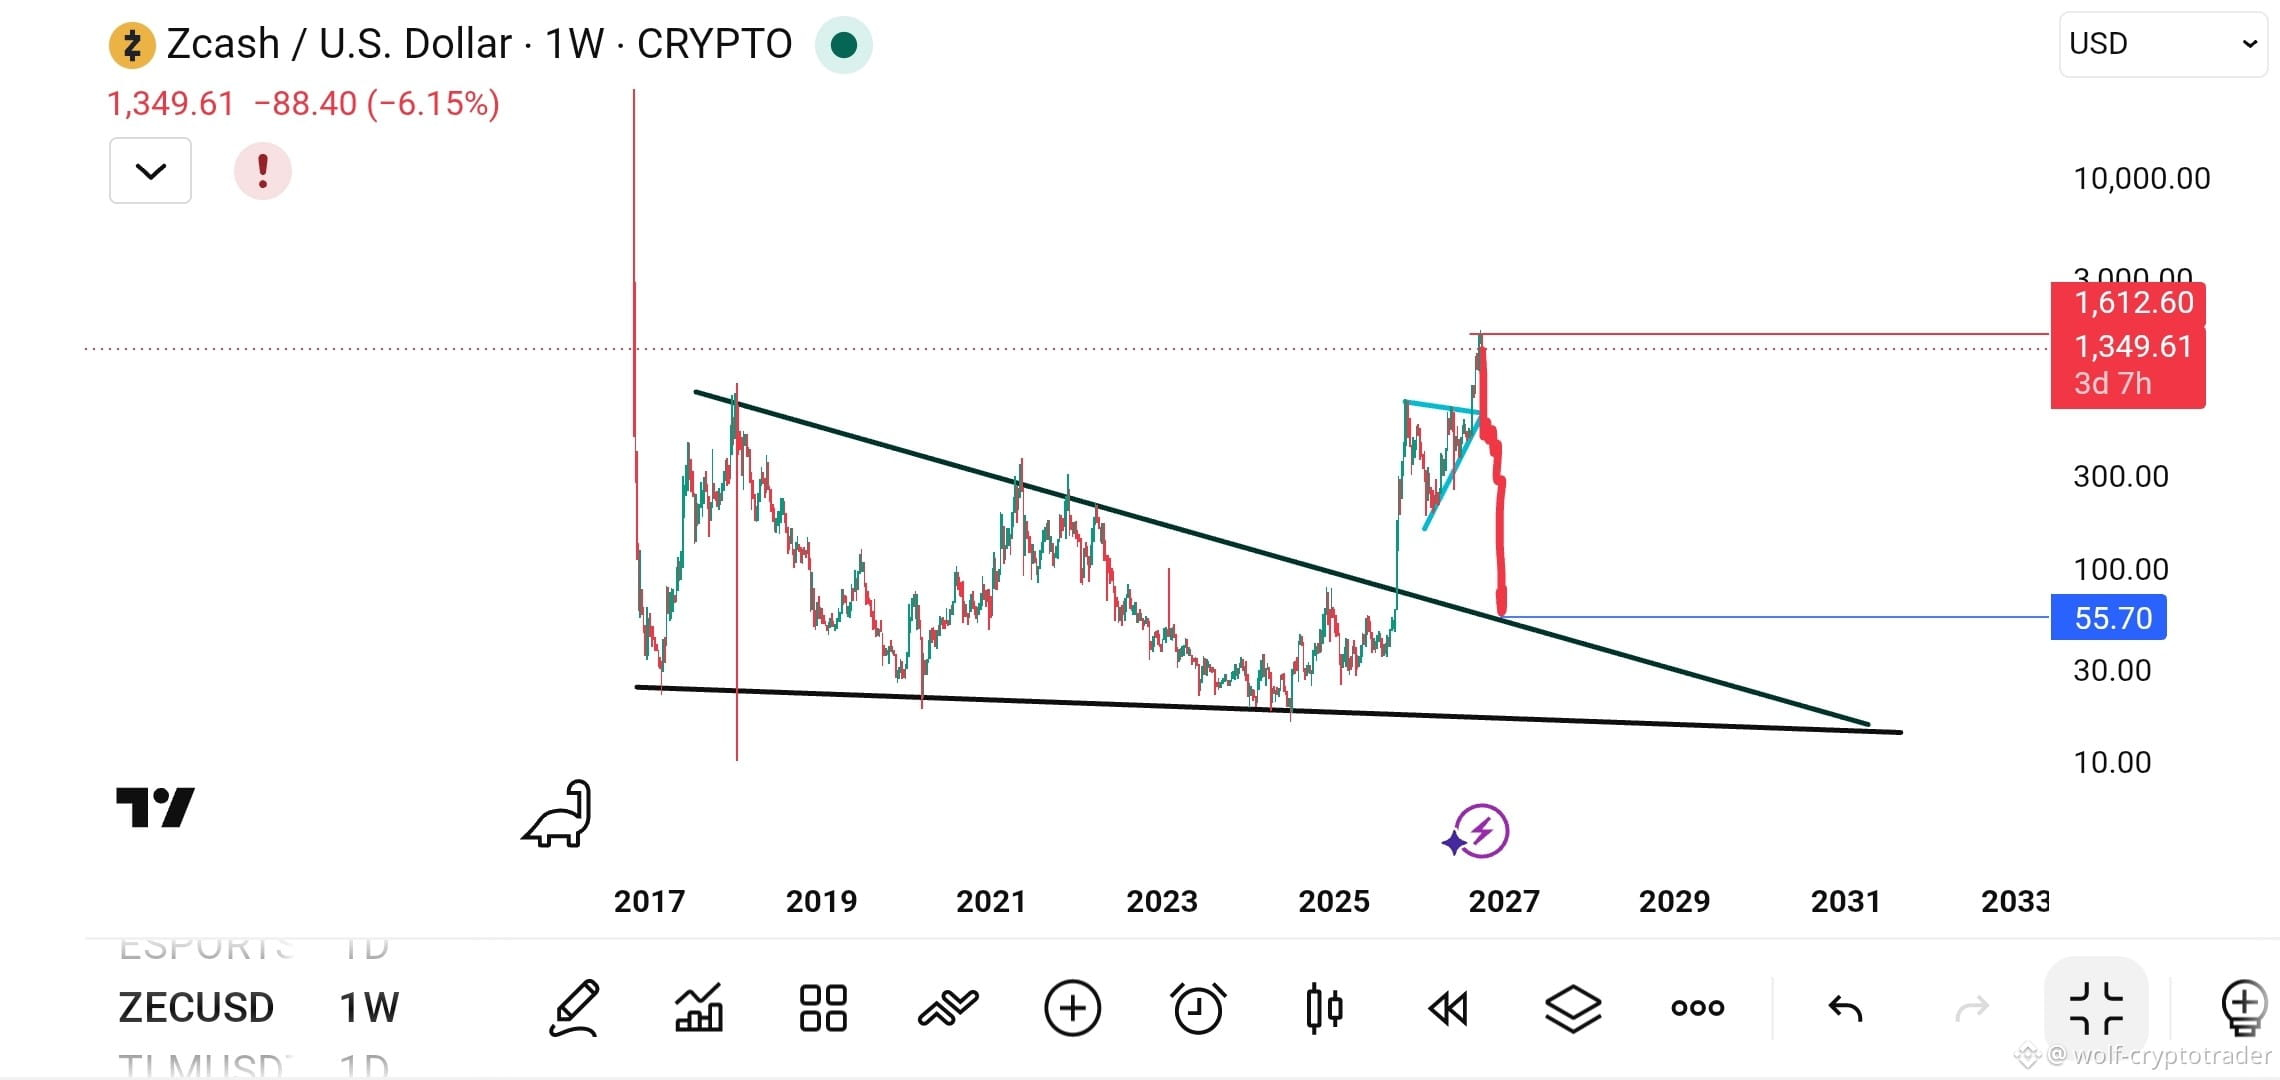
4. Technical Analysis A fateful retest of a historical descending triangle at 55$
{future}(ZECUSDT)
🚨 Why You Shouldn’t Buy ZEC Now? 4 Reasons Buying ZEC Right Now Is An Unjustified Risk
After a historic, swift surge, negative signs are piling up for Zcash. Here’s why staying away is the smarter decision right now
1. 🕳️ A Hole in Core Trust An unproven security vulnerability in the privacy circuit (zk-SNARK) that hasn’t been proven safe against exploitation yet, threatening the credibility of the supply cap (21 million coins)
2. 🏛️ Eroding Governance A collective exit of the core development team (ECC) in early 2026, along with a drop in development activity to its lowest levels.
3. ⚖️ An Imminent Regulatory Ban on the European Anti–Money Laundering Regulation (AMLR) that will ban trading it in Europe by July 2027, with its removal beginning from Asian platforms
4. Technical Analysis A fateful retest of a historical descending triangle at 55$
After a historic, swift surge, negative signs are piling up for Zcash. Here’s why staying away is the smarter decision right now
1. 🕳️ A Hole in Core Trust An unproven security vulnerability in the privacy circuit (zk-SNARK) that hasn’t been proven safe against exploitation yet, threatening the credibility of the supply cap (21 million coins)
2. 🏛️ Eroding Governance A collective exit of the core development team (ECC) in early 2026, along with a drop in development activity to its lowest levels.
3. ⚖️ An Imminent Regulatory Ban on the European Anti–Money Laundering Regulation (AMLR) that will ban trading it in Europe by July 2027, with its removal beginning from Asian platforms
4. Technical Analysis A fateful retest of a historical descending triangle at 55$
183
·
--
Verified
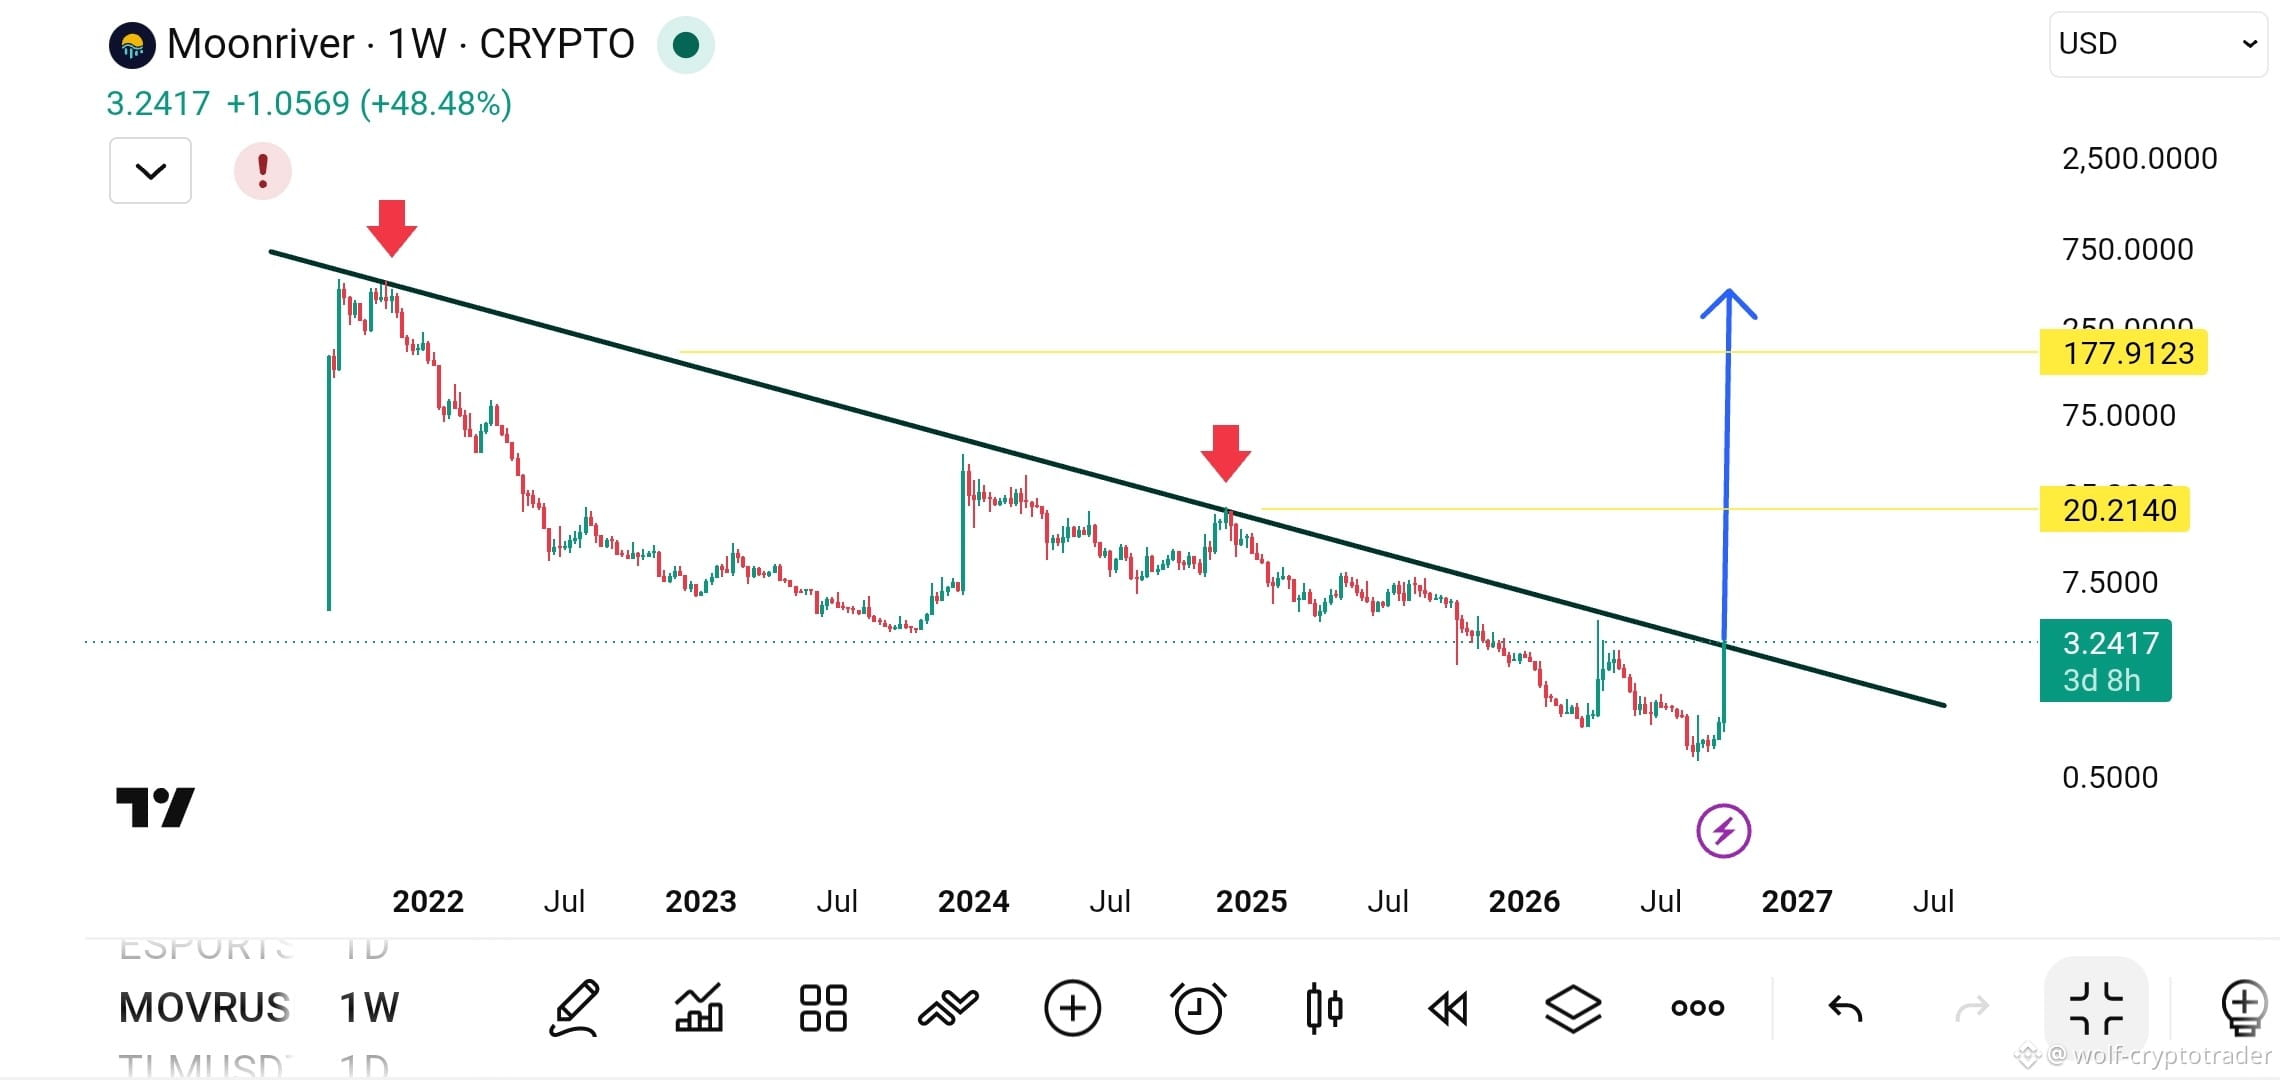
Why is Moonriver rising? And will the uptrend continue after breaking the downtrend?
📌 First, the basic reasons behind the rise
1. Completion of the migration to the Base network (the main engine)
2. A surge in trading volume compared to market value
3. Accumulation by whales
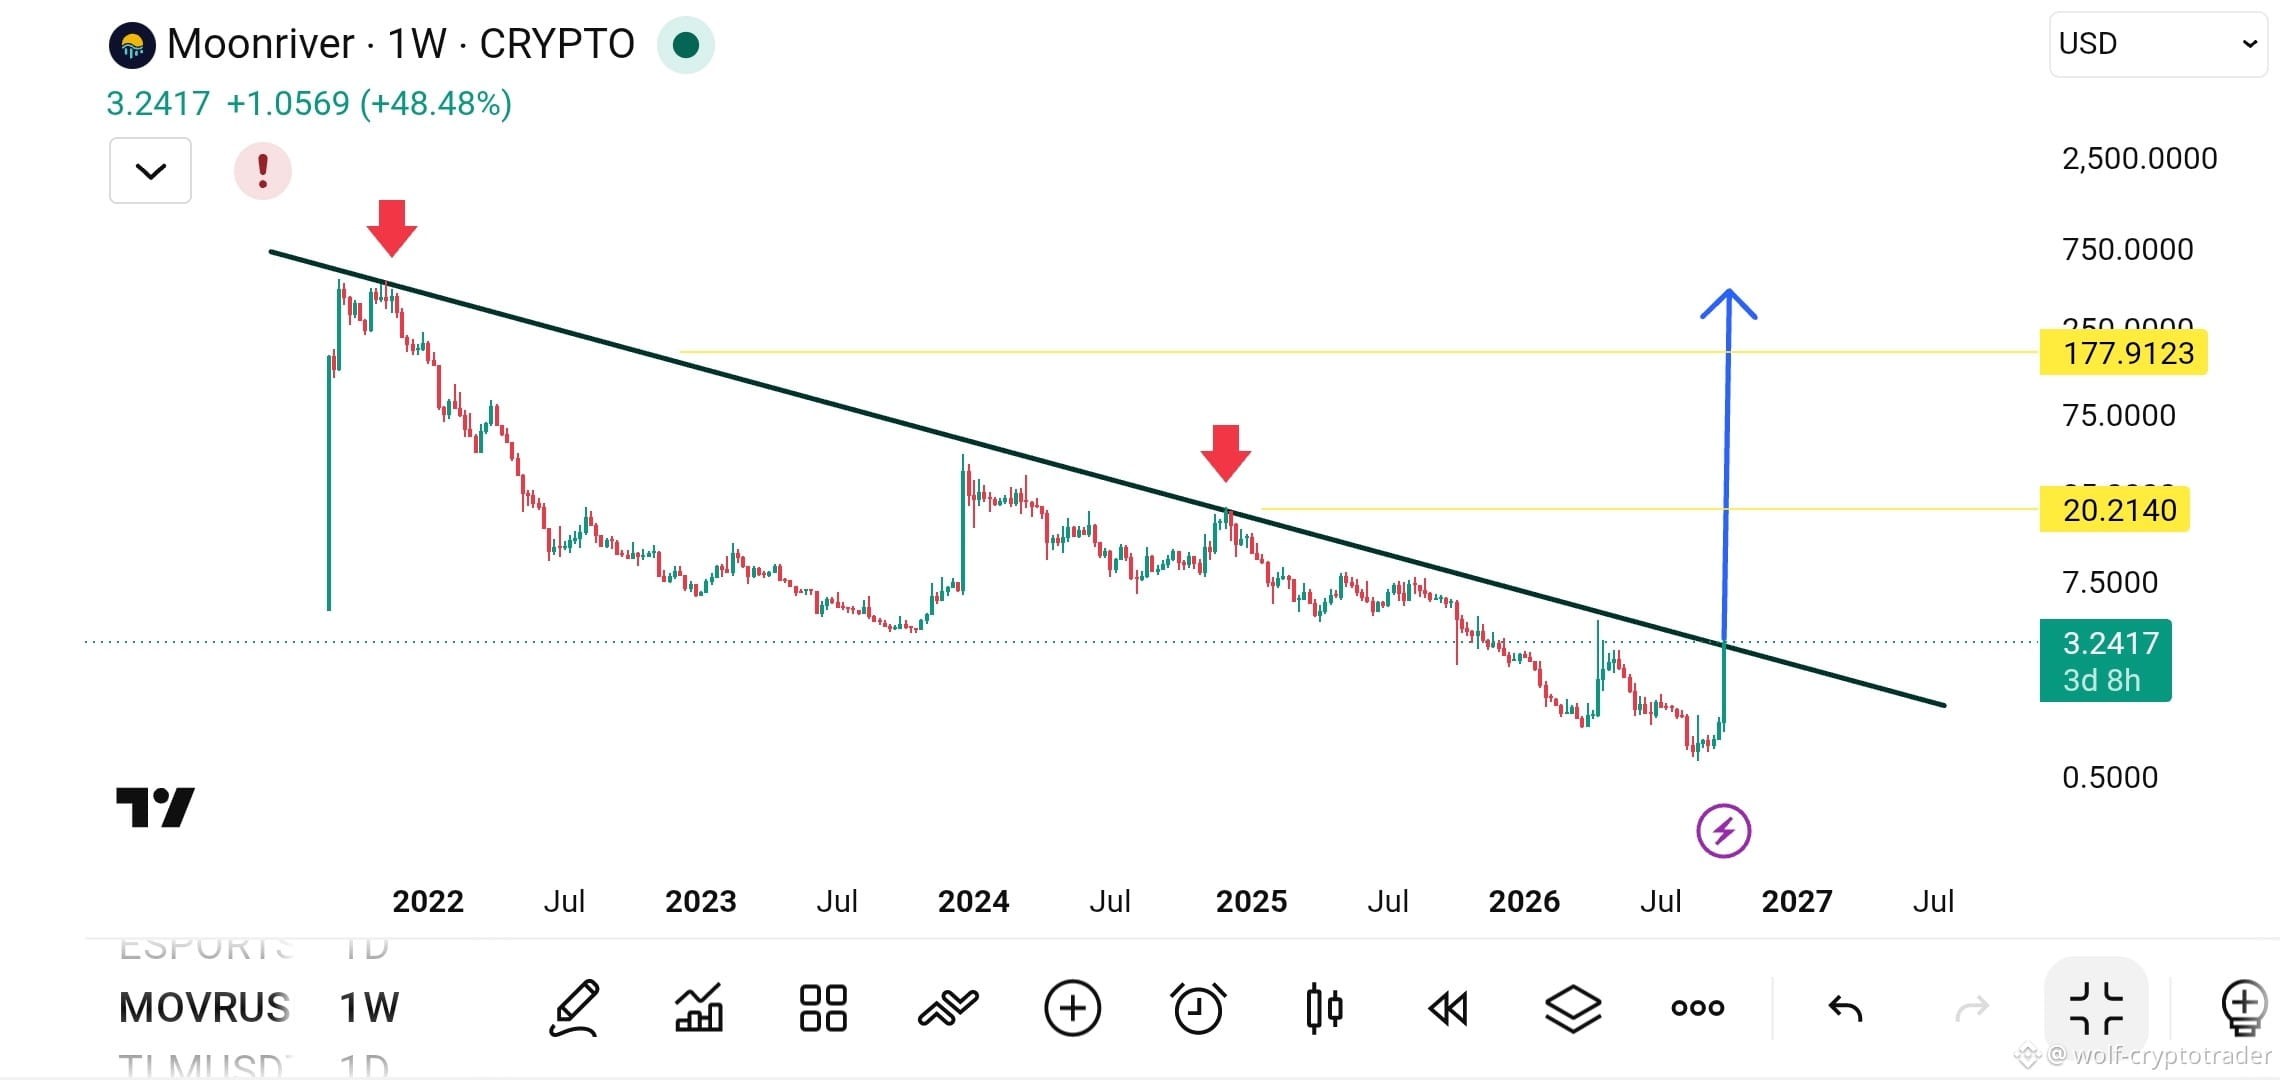
📊 Second, technical analysis for the downtrend-break scenario
Based on the attached weekly chart
⚠️ Third, can the rally continue? (future scenarios)
Scenario Condition Potential targets
Bullish: a consistent weekly close above $2.88
{future}(MOVRUSDT)
Why is Moonriver rising? And will the uptrend continue after breaking the downtrend?
📌 First, the basic reasons behind the rise
1. Completion of the migration to the Base network (the main engine)
2. A surge in trading volume compared to market value
3. Accumulation by whales
📊 Second, technical analysis for the downtrend-break scenario
Based on the attached weekly chart
⚠️ Third, can the rally continue? (future scenarios)
Scenario Condition Potential targets
Bullish: a consistent weekly close above $2.88
📌 First, the basic reasons behind the rise
1. Completion of the migration to the Base network (the main engine)
2. A surge in trading volume compared to market value
3. Accumulation by whales
📊 Second, technical analysis for the downtrend-break scenario
Based on the attached weekly chart
⚠️ Third, can the rally continue? (future scenarios)
Scenario Condition Potential targets
Bullish: a consistent weekly close above $2.88
346
·
--
When facing strong resistance, your eyes are upon it. If you succeed in breaking through, we can see it from 19$ or from 170$ . Available long for quick strikes with the direction
{future}(MOVRUSDT)
When facing strong resistance, your eyes are upon it. If you succeed in breaking through, we can see it from 19$ or from 170$ . Available long for quick strikes with the direction
1
345
·
--
👀 Watch your eyes on it—how it went from support to the moon
{future}(USUSDT)
👀 Watch your eyes on it—how it went from support to the moon
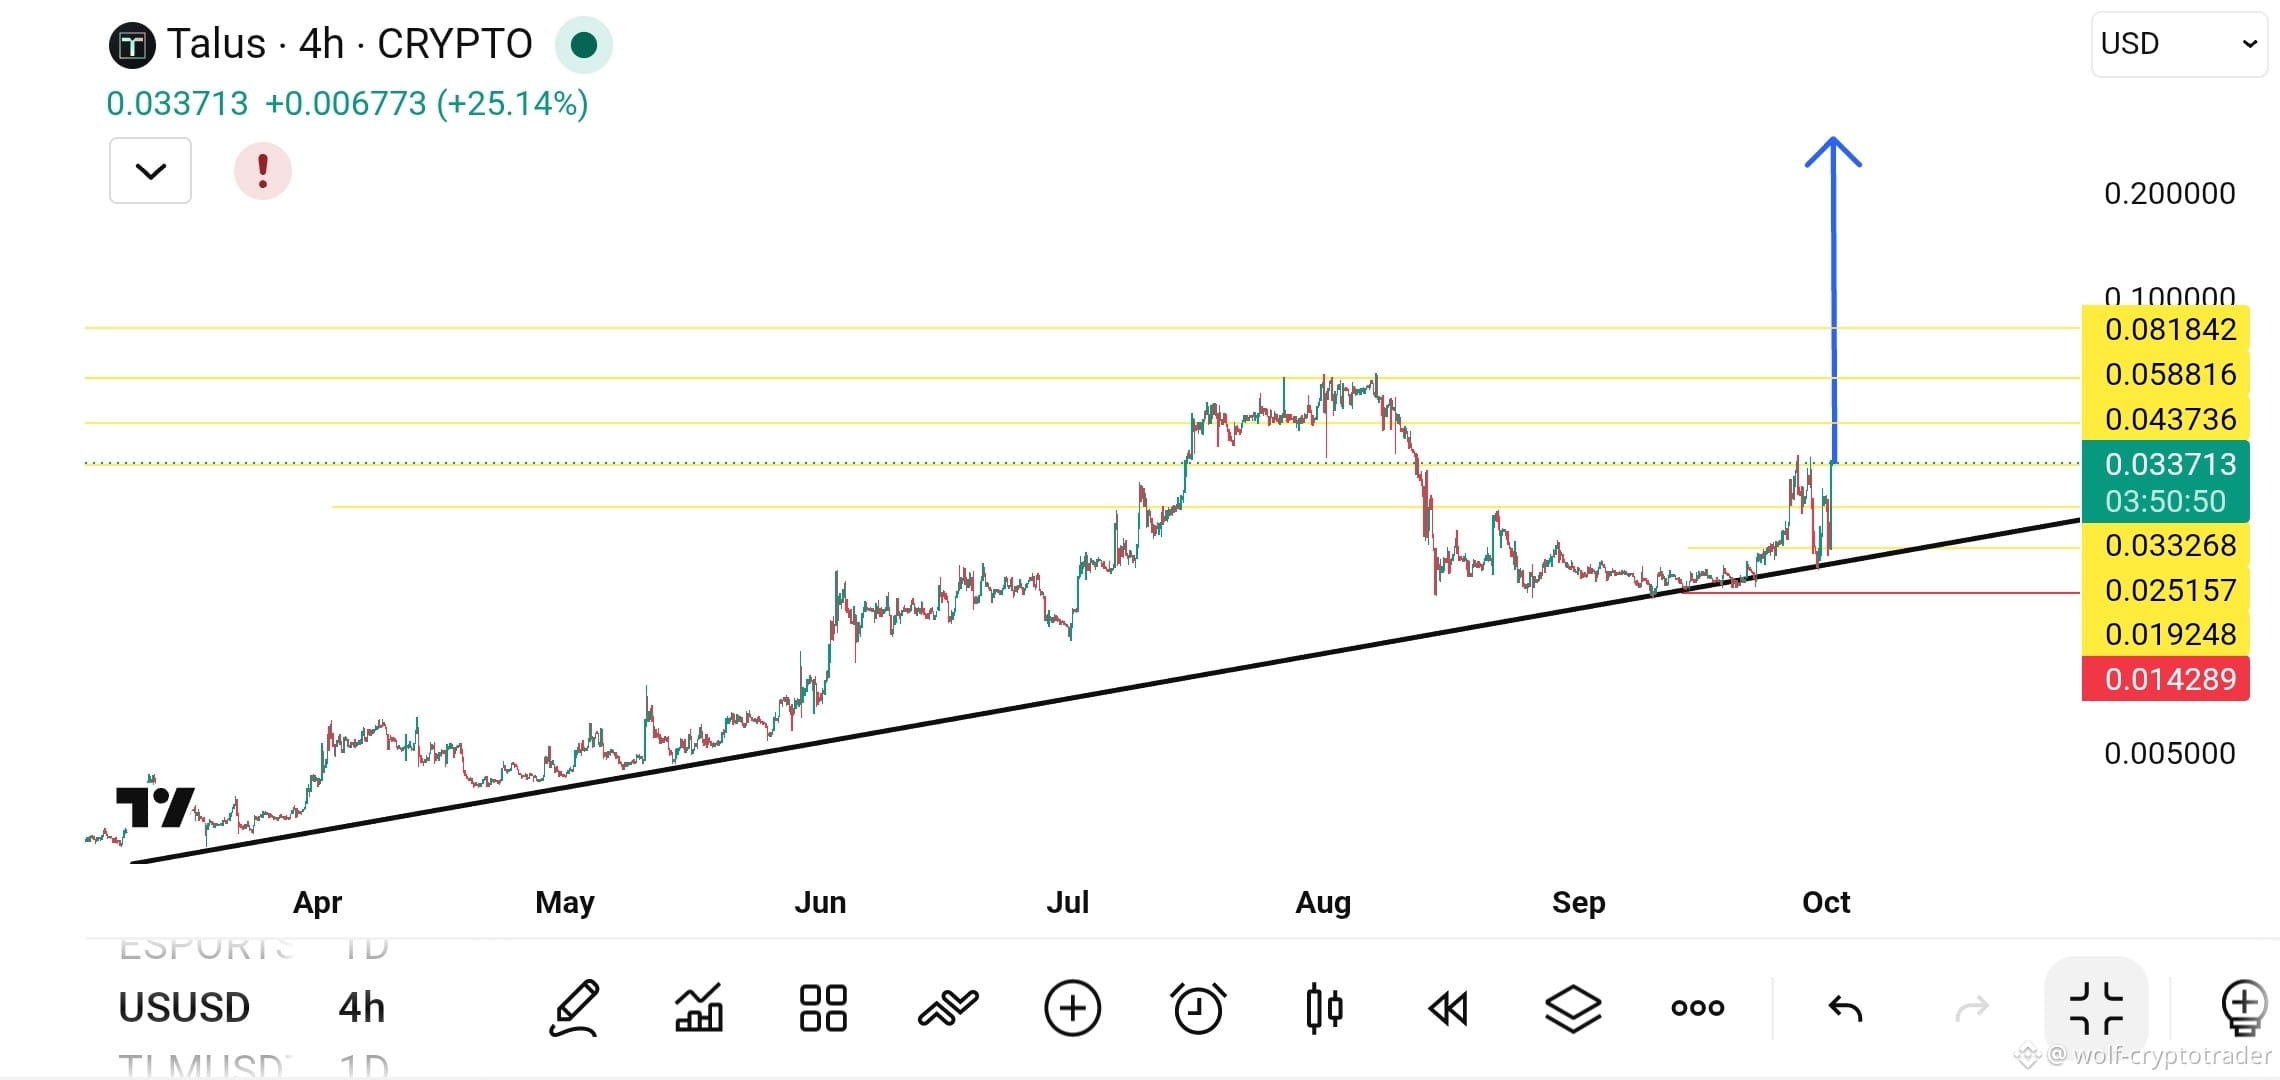
CHART KING 亗
·
--
🟢 Available long and strong
👀 Your eyes are on it at the bottom, and with strong support it’s ready to launch to the moon 💎
Your targets and the stop are on the chart—don’t miss them
👀 Your eyes are on it at the bottom, and with strong support it’s ready to launch to the moon 💎
Your targets and the stop are on the chart—don’t miss them
79
·
--
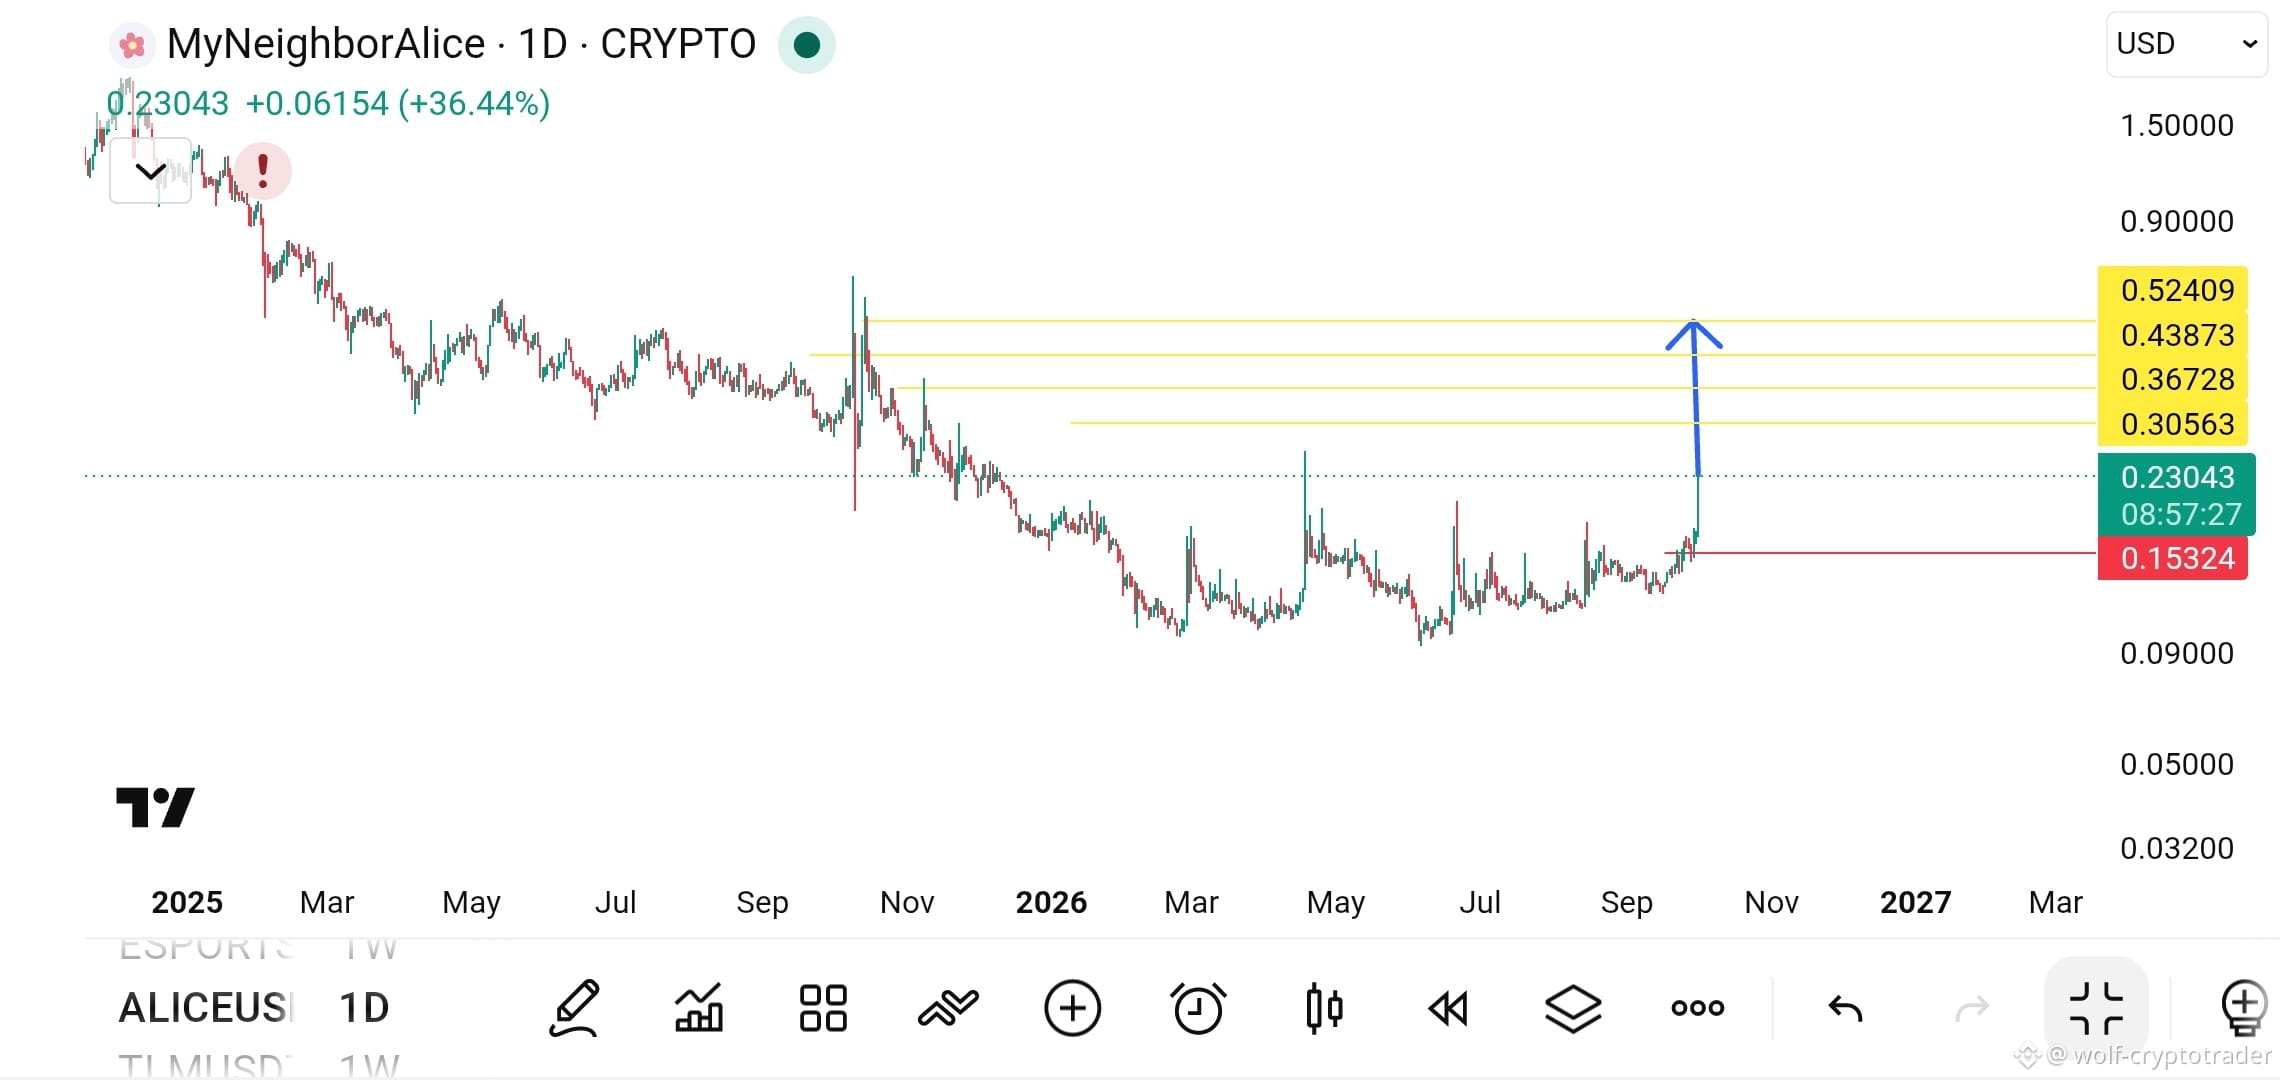
🟢 Available long now for quick trading with the trend
👀 Keep an eye on it—its rise is not over. Get ready to fly to the moon 💎
Your targets on the chart
{future}(ALICEUSDT)
🟢 Available long now for quick trading with the trend
👀 Keep an eye on it—its rise is not over. Get ready to fly to the moon 💎
Your targets on the chart
👀 Keep an eye on it—its rise is not over. Get ready to fly to the moon 💎
Your targets on the chart
1
261
·
--
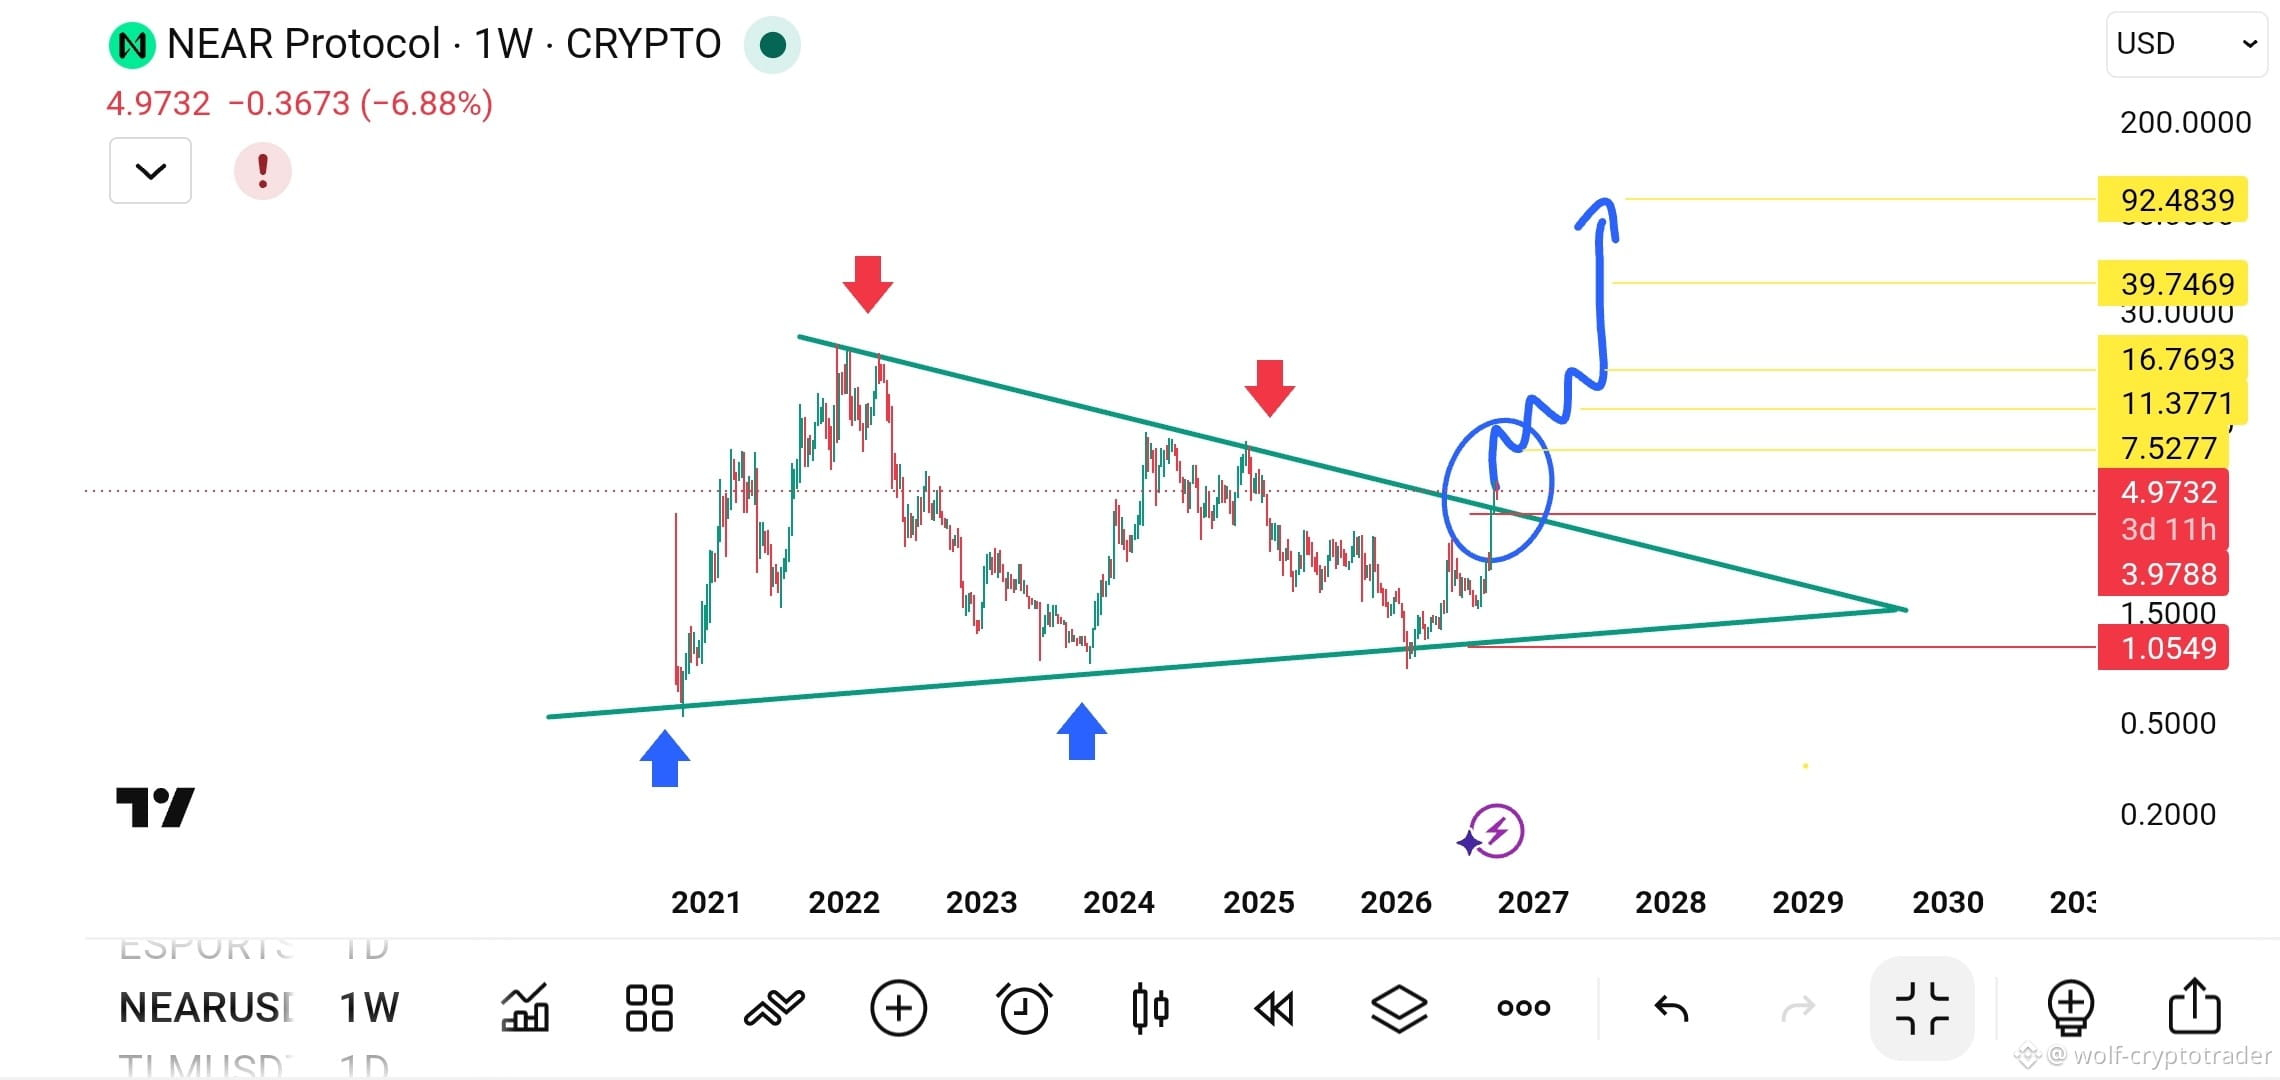
Current correction... a strategic buying opportunity (Long)
On the weekly timeframe (1W), NEAR presents us with a crucial technical picture after recently breaking out of a rare technical pattern
🔍 The technical pattern and price movement
Since 2020, the coin has been confined within an extended symmetrical triangle for years. As we can see in the blue circle, the price has recently managed to break above the upper boundary of this triangle upward, indicating a potential shift in the overall trend from bearish to bullish
✅ Why is this a buying opportunity (Long)?
As long as the price holds steady above the breakout zone (level 3.9 and around it), the bullish scenario remains strongly valid. The current correction gives traders a golden opportunity to enter long buying positions before the larger bullish wave resumes
{future}(NEARUSDT)
Current correction... a strategic buying opportunity (Long)
On the weekly timeframe (1W), NEAR presents us with a crucial technical picture after recently breaking out of a rare technical pattern
🔍 The technical pattern and price movement
Since 2020, the coin has been confined within an extended symmetrical triangle for years. As we can see in the blue circle, the price has recently managed to break above the upper boundary of this triangle upward, indicating a potential shift in the overall trend from bearish to bullish
✅ Why is this a buying opportunity (Long)?
As long as the price holds steady above the breakout zone (level 3.9 and around it), the bullish scenario remains strongly valid. The current correction gives traders a golden opportunity to enter long buying positions before the larger bullish wave resumes
On the weekly timeframe (1W), NEAR presents us with a crucial technical picture after recently breaking out of a rare technical pattern
🔍 The technical pattern and price movement
Since 2020, the coin has been confined within an extended symmetrical triangle for years. As we can see in the blue circle, the price has recently managed to break above the upper boundary of this triangle upward, indicating a potential shift in the overall trend from bearish to bullish
✅ Why is this a buying opportunity (Long)?
As long as the price holds steady above the breakout zone (level 3.9 and around it), the bullish scenario remains strongly valid. The current correction gives traders a golden opportunity to enter long buying positions before the larger bullish wave resumes
1
686
·
--
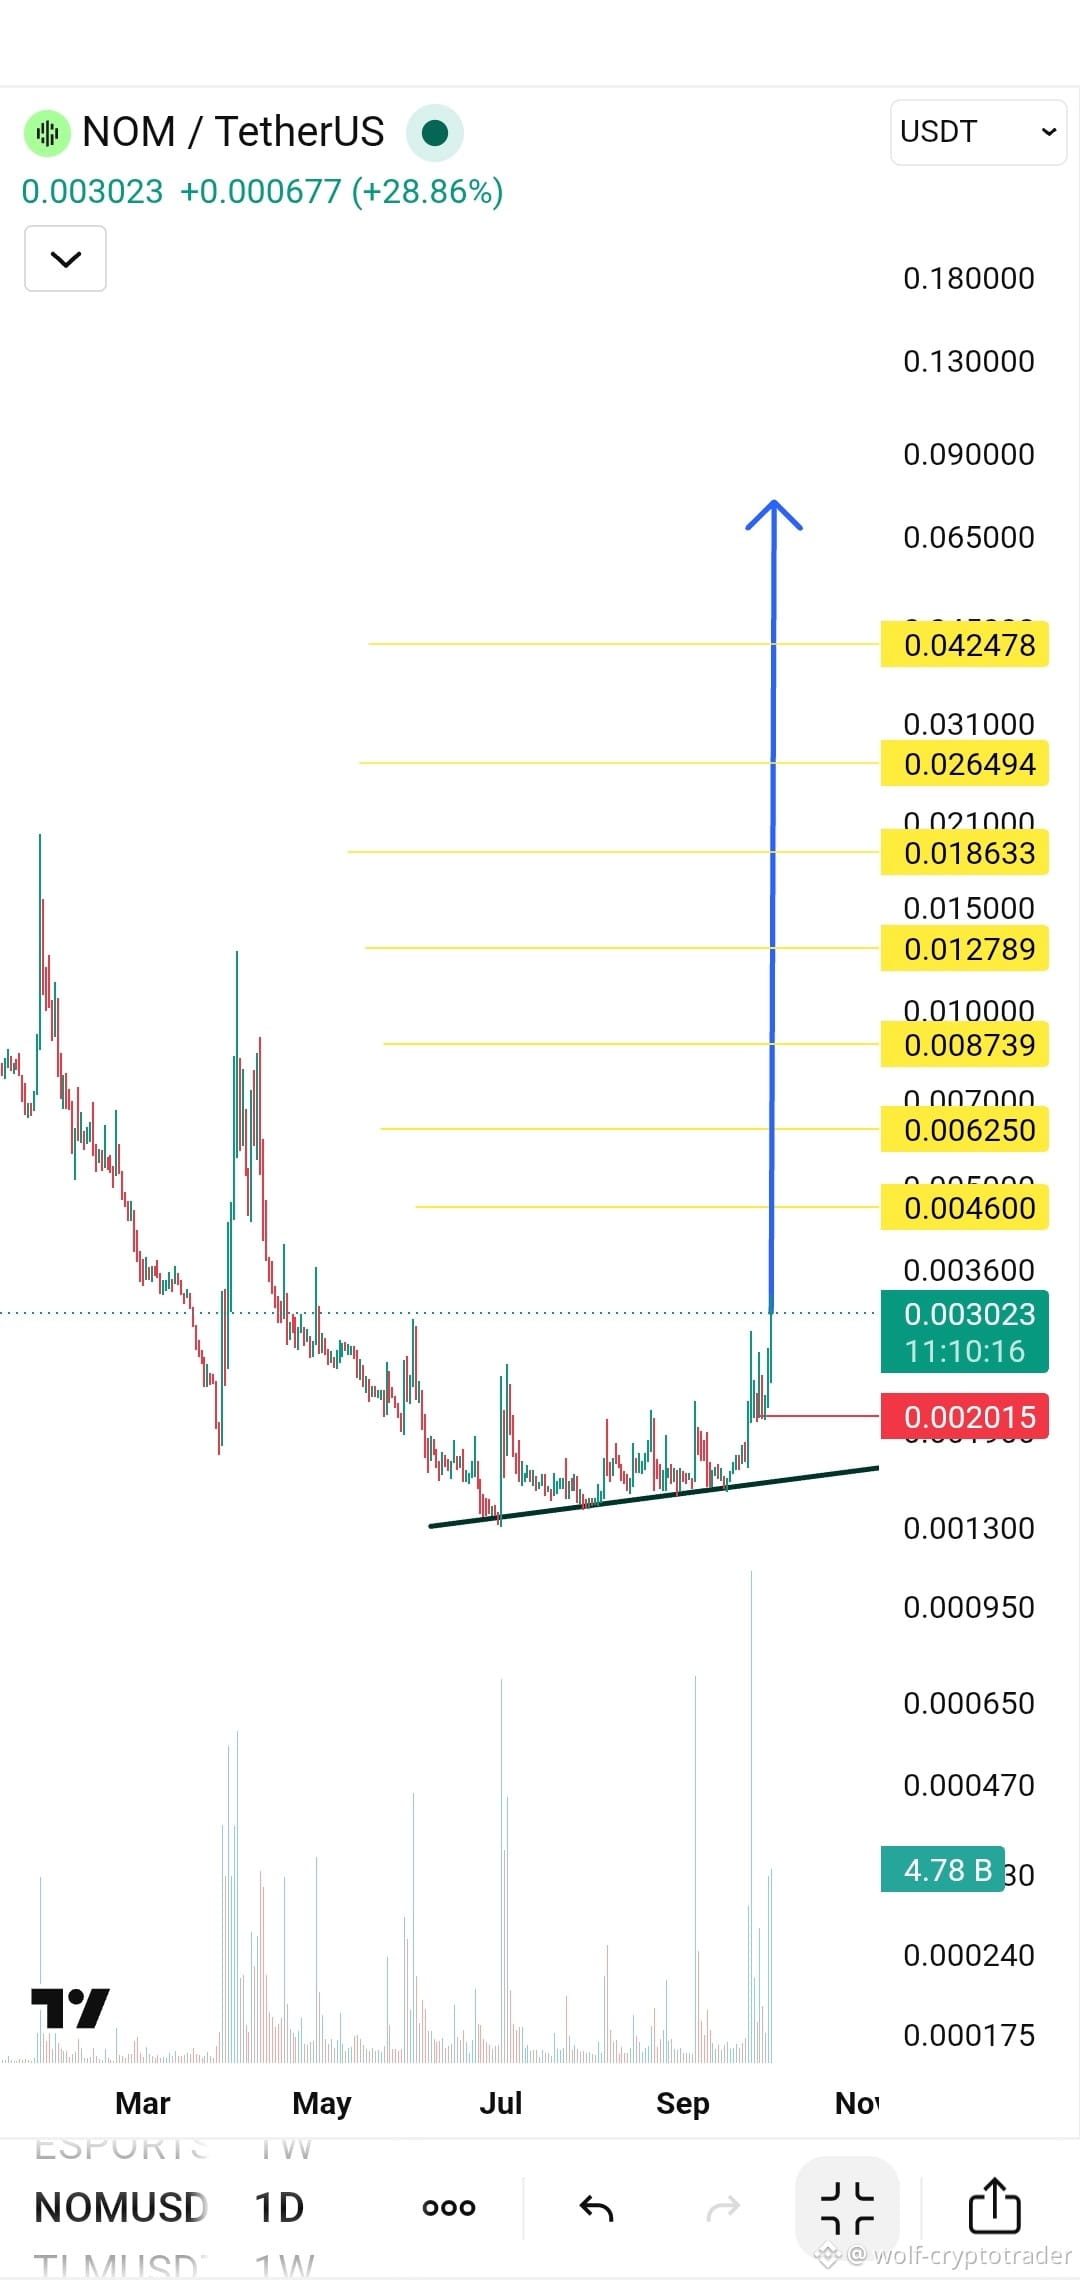
🟢 Available long
👀 Your eyes are on it—its rise isn’t over. Preparing to fly to the moon 💎
Your targets and the stop are in the chart, so don’t miss them
{future}(NOMUSDT)
🟢 Available long
👀 Your eyes are on it—its rise isn’t over. Preparing to fly to the moon 💎
Your targets and the stop are in the chart, so don’t miss them
👀 Your eyes are on it—its rise isn’t over. Preparing to fly to the moon 💎
Your targets and the stop are in the chart, so don’t miss them
528
·
--
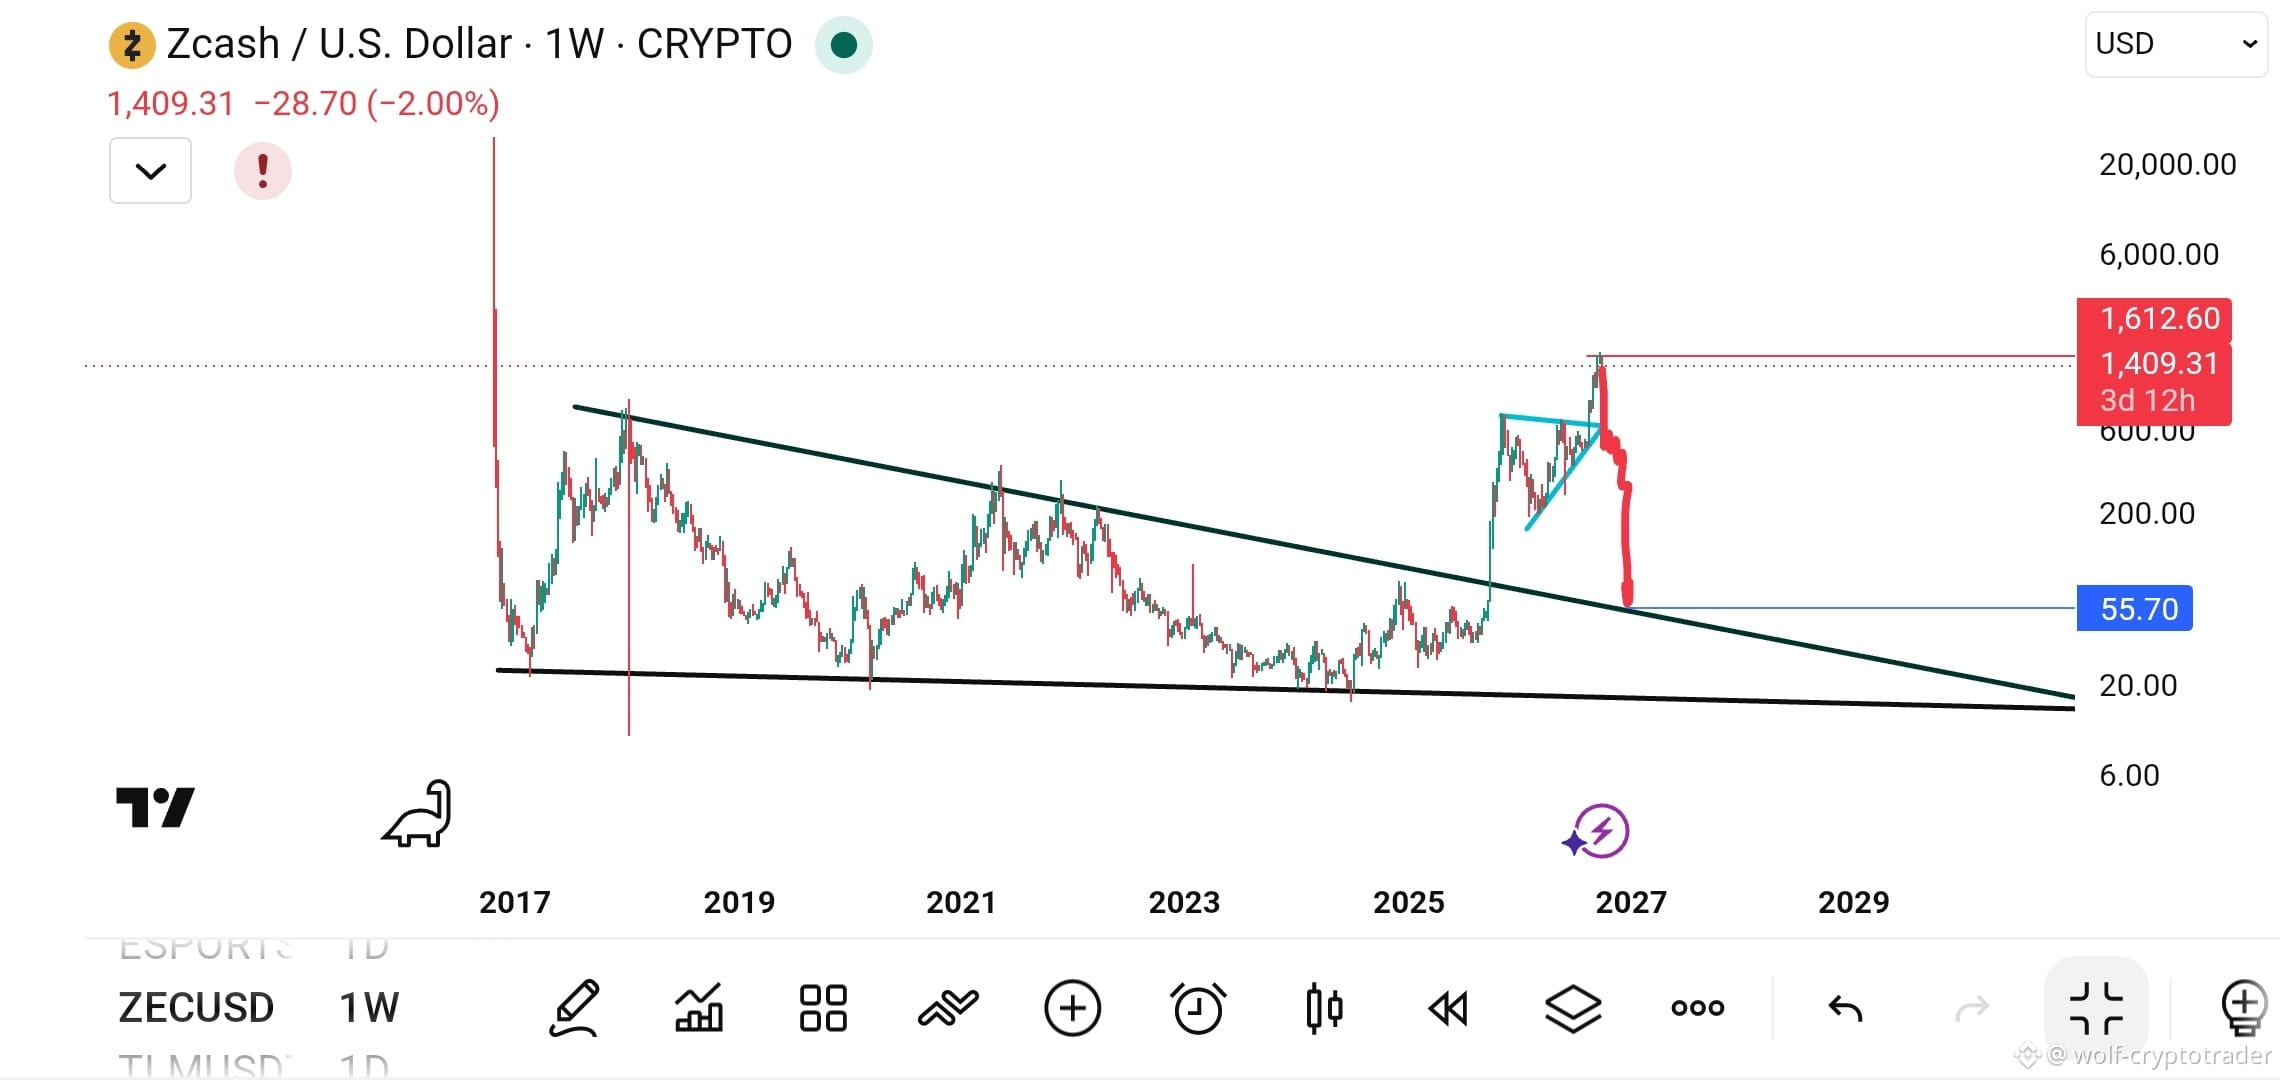
A fateful retest for a historic descending triangle
On the weekly timeframe (1W), Zcash is presenting us with an extremely important technical scene
🔍 The technical model and price movement
Since 2017, the coin has been confined within a massive descending triangle that lasted for years. Recently, a strong breakout upward occurred, suggesting a potential shift in the overall trend.
But as usually happens in markets, the price is now returning to test the upper boundary of the previous triangle (the blue level at $55.70). This retest is the moment of truth—will this level turn from stubborn resistance into strong support?
{future}(ZECUSDT)
A fateful retest for a historic descending triangle
On the weekly timeframe (1W), Zcash is presenting us with an extremely important technical scene
🔍 The technical model and price movement
Since 2017, the coin has been confined within a massive descending triangle that lasted for years. Recently, a strong breakout upward occurred, suggesting a potential shift in the overall trend.
But as usually happens in markets, the price is now returning to test the upper boundary of the previous triangle (the blue level at $55.70). This retest is the moment of truth—will this level turn from stubborn resistance into strong support?
On the weekly timeframe (1W), Zcash is presenting us with an extremely important technical scene
🔍 The technical model and price movement
Since 2017, the coin has been confined within a massive descending triangle that lasted for years. Recently, a strong breakout upward occurred, suggesting a potential shift in the overall trend.
But as usually happens in markets, the price is now returning to test the upper boundary of the previous triangle (the blue level at $55.70). This retest is the moment of truth—will this level turn from stubborn resistance into strong support?
467
·
--
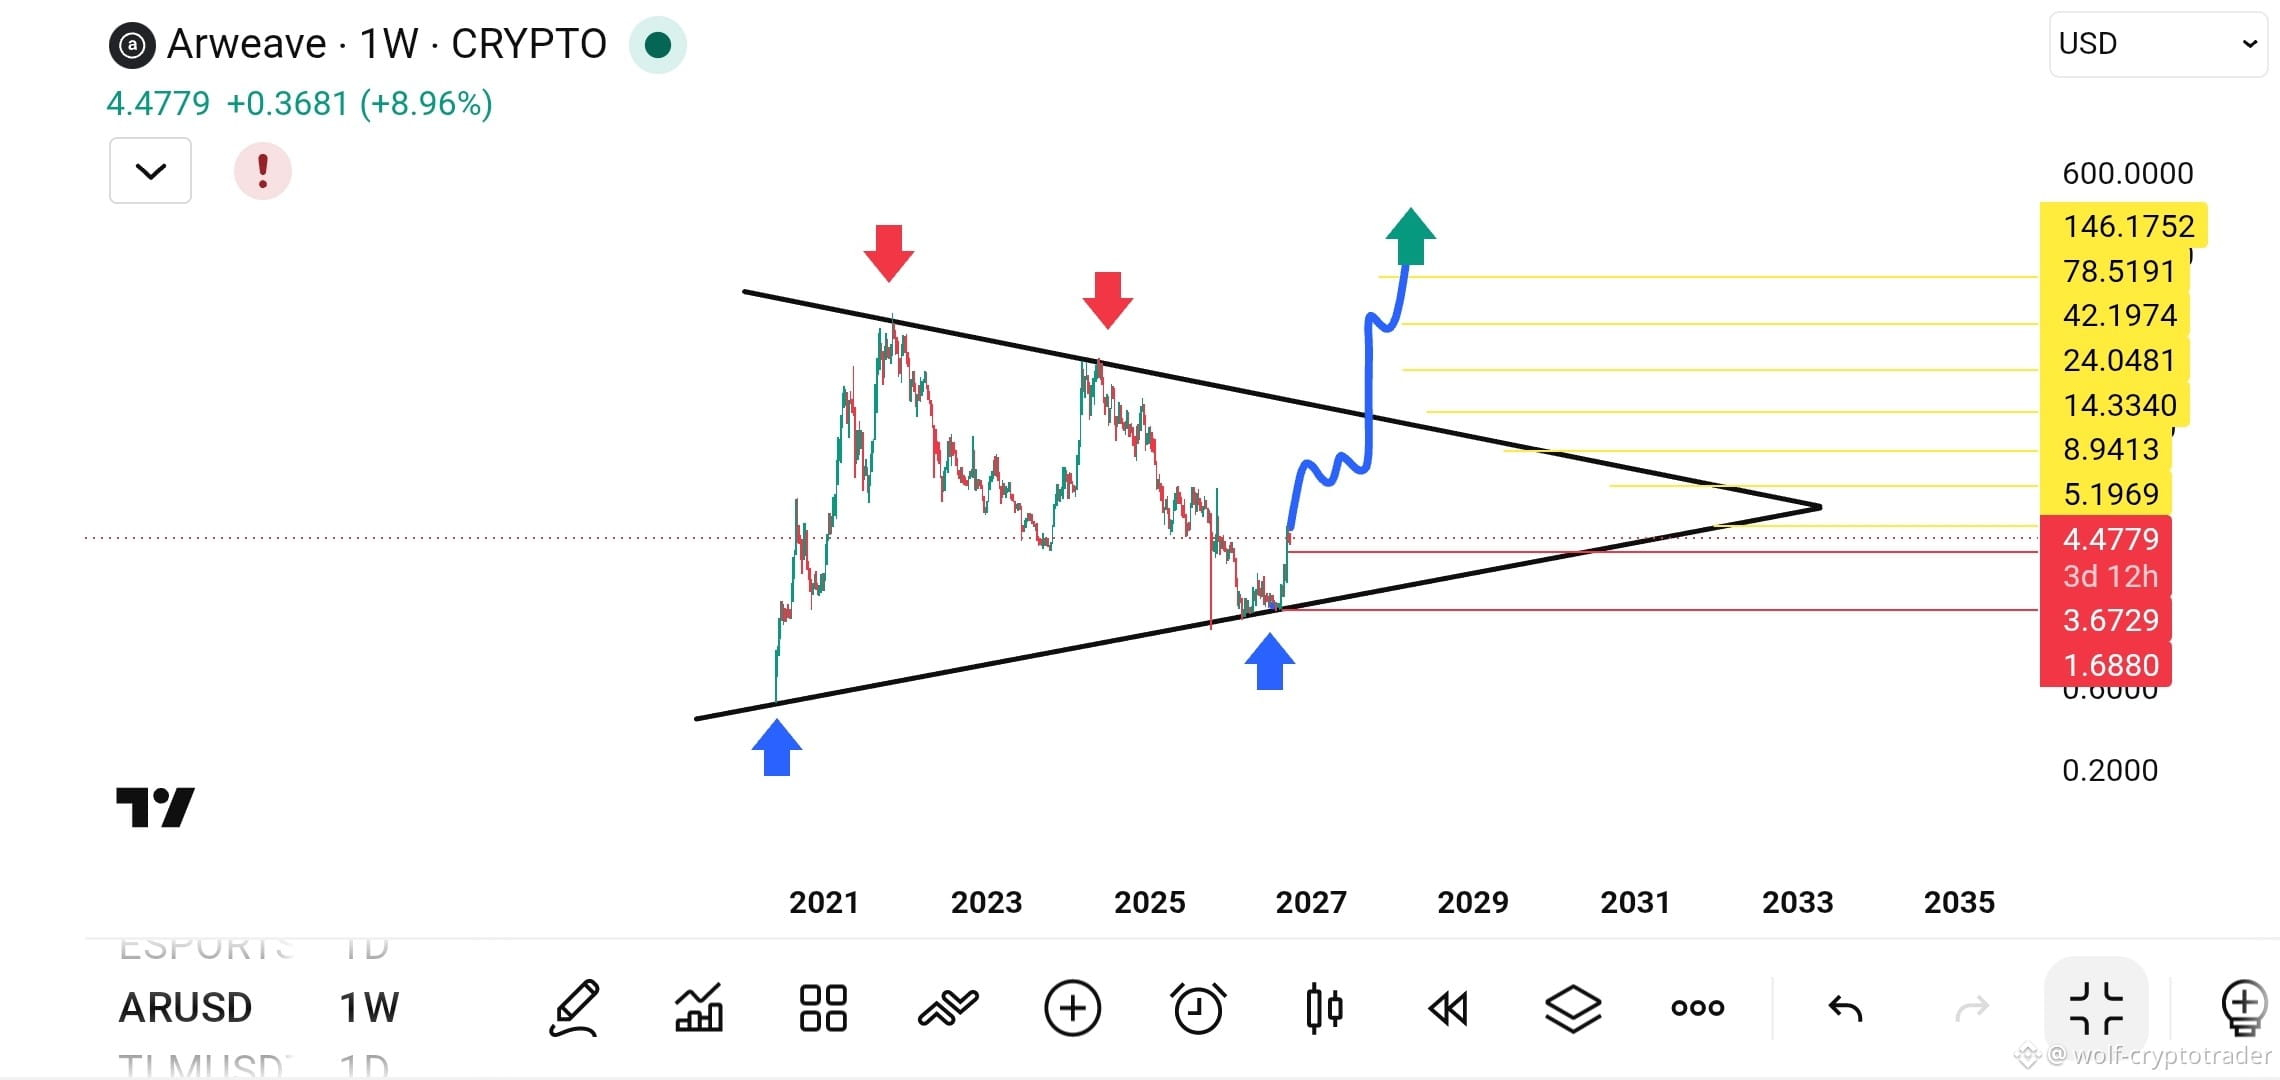
Are we facing a historic breakthrough?
On the weekly timeframe (1W), Ar’s coin provides a technical model that deserves careful follow-up
{future}(ARUSDT)
Are we facing a historic breakthrough?
On the weekly timeframe (1W), Ar’s coin provides a technical model that deserves careful follow-up
On the weekly timeframe (1W), Ar’s coin provides a technical model that deserves careful follow-up
3
504
·
--
💥🚀 Boom! It flew to the first goal 💎
👀 Your eyes are on it—keep going to the moon
{future}(SOONUSDT)
💥🚀 Boom! It flew to the first goal 💎
👀 Your eyes are on it—keep going to the moon
👀 Your eyes are on it—keep going to the moon
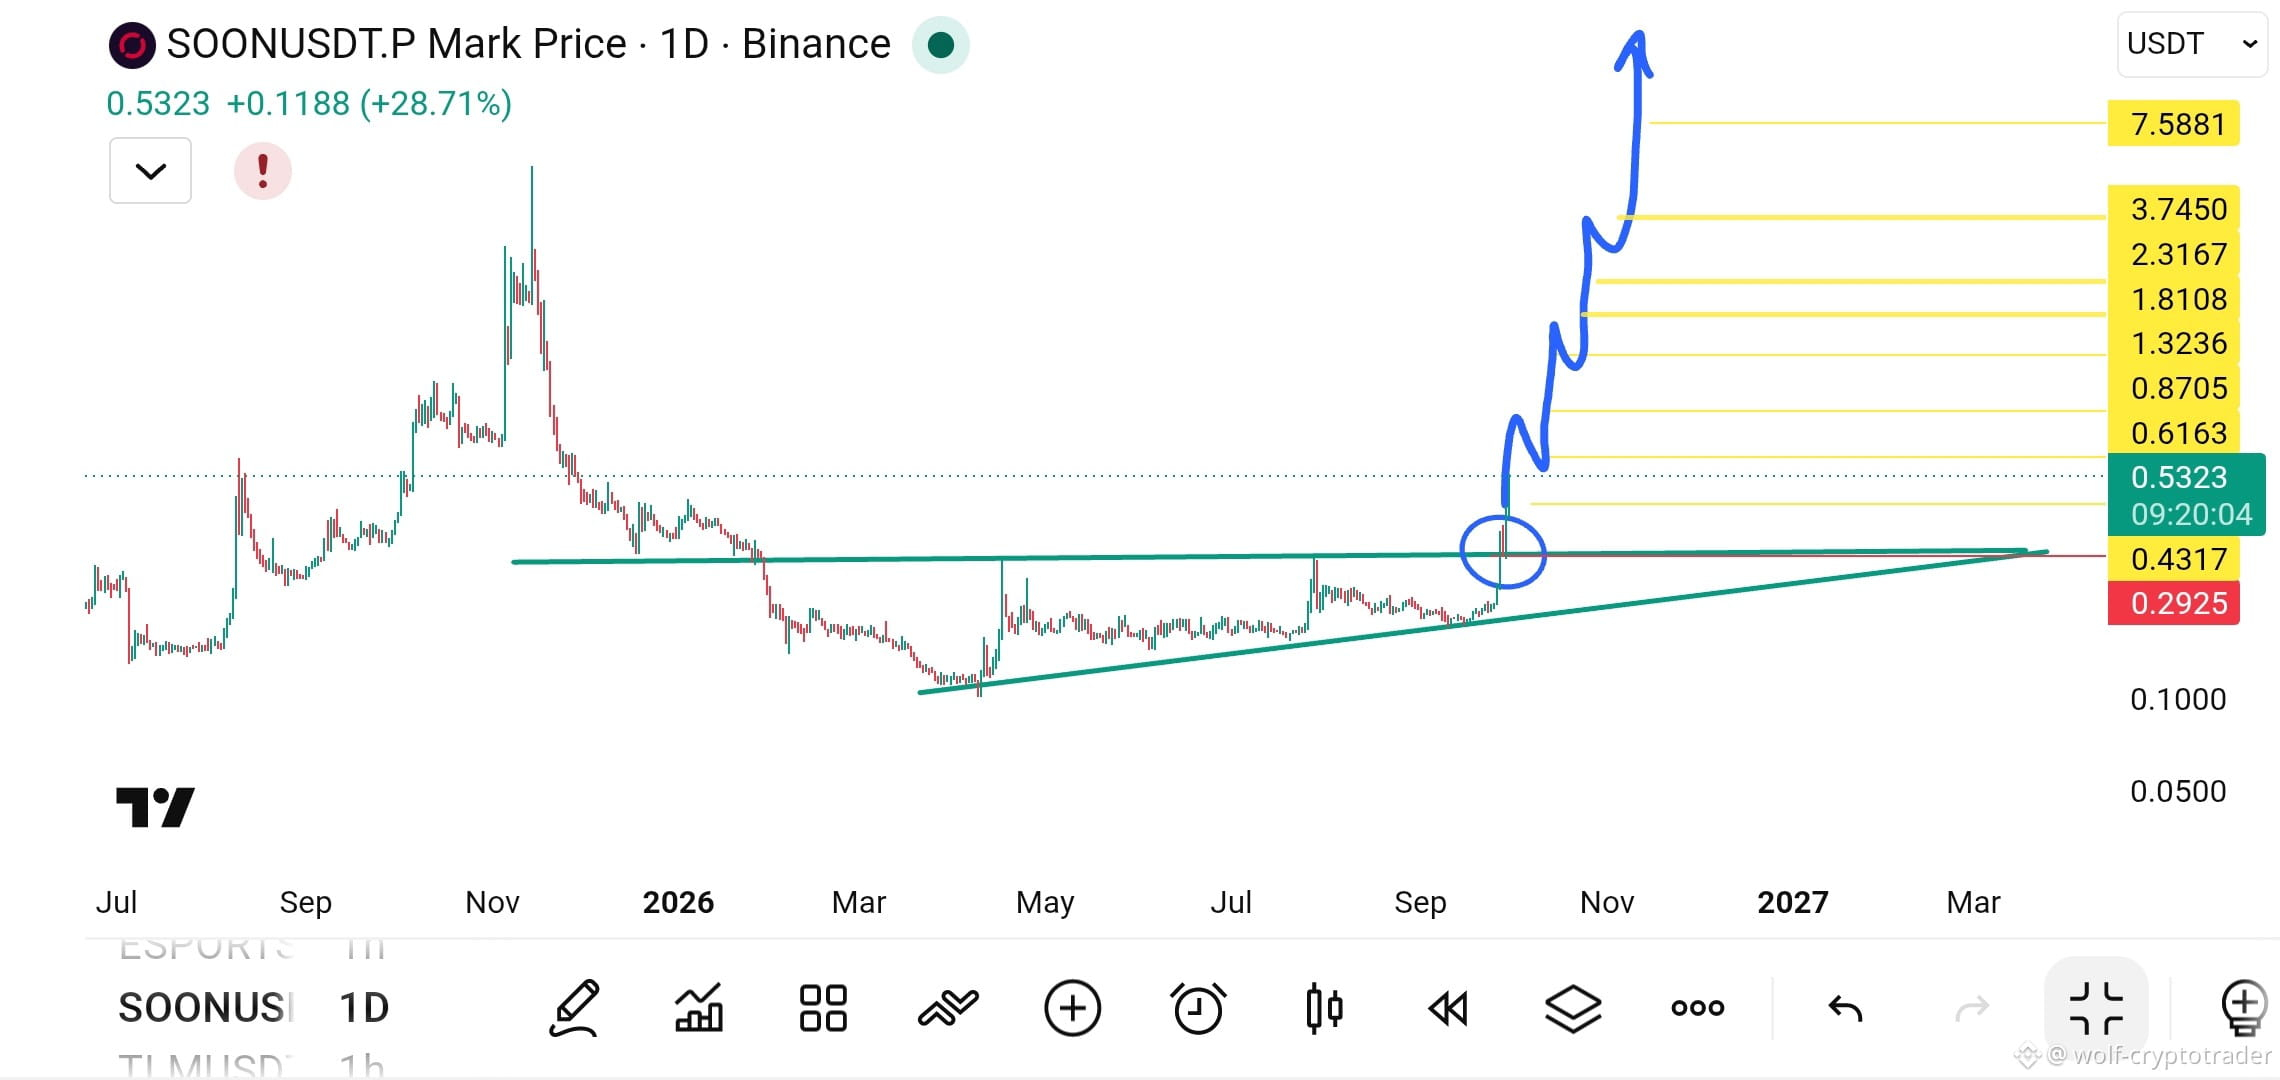
CHART KING 亗
·
--
Bullish🚀 Successful Re-testing for SOON Coin ignites the chart and prepares to launch to the moon 🔥
After a period of accumulation and price pressure, the $SOON coin was able to break the Symmetrical Triangle pattern on the daily timeframe (1D) in a strong and bullish move 📊
And most importantly—beyond the breakout... the retest succeeded (Retest 🎯
The blue circle on the chart shows exactly how the price bounced from the breakout line, confirming that the previous resistance has turned into strong support. This kind of technical confirmation is what comes before major vertical rallies 🚀💎
After a period of accumulation and price pressure, the $SOON coin was able to break the Symmetrical Triangle pattern on the daily timeframe (1D) in a strong and bullish move 📊
And most importantly—beyond the breakout... the retest succeeded (Retest 🎯
The blue circle on the chart shows exactly how the price bounced from the breakout line, confirming that the previous resistance has turned into strong support. This kind of technical confirmation is what comes before major vertical rallies 🚀💎
291
Log in to explore more content
Join global crypto users on Binance Square
⚡️ Get latest and useful information about crypto.
💬 Trusted by the world’s largest crypto exchange.
👍 Discover real insights from verified creators.
Email / Phone number