
0龙王0
515 Posts

0龙王0
Report
Block User
无绑定返佣码,或者找我也可以强制绑定自己在这里拿合约返佣码491932164钱包返佣码V26QTV1A
Open Trade
High-Frequency Trader
4.2 Years
29 Following
145 Followers
74 Liked
Posts
Portfolio
All
Quotes
·
--
Agents in, humans set intent. Joining the first Initial Agent Offering. #IAO https://ptah.trade/iao Agent #52518
Agents in, humans set intent. Joining the first Initial Agent Offering. #IAO https://ptah.trade/iao Agent #52518
87
·
--
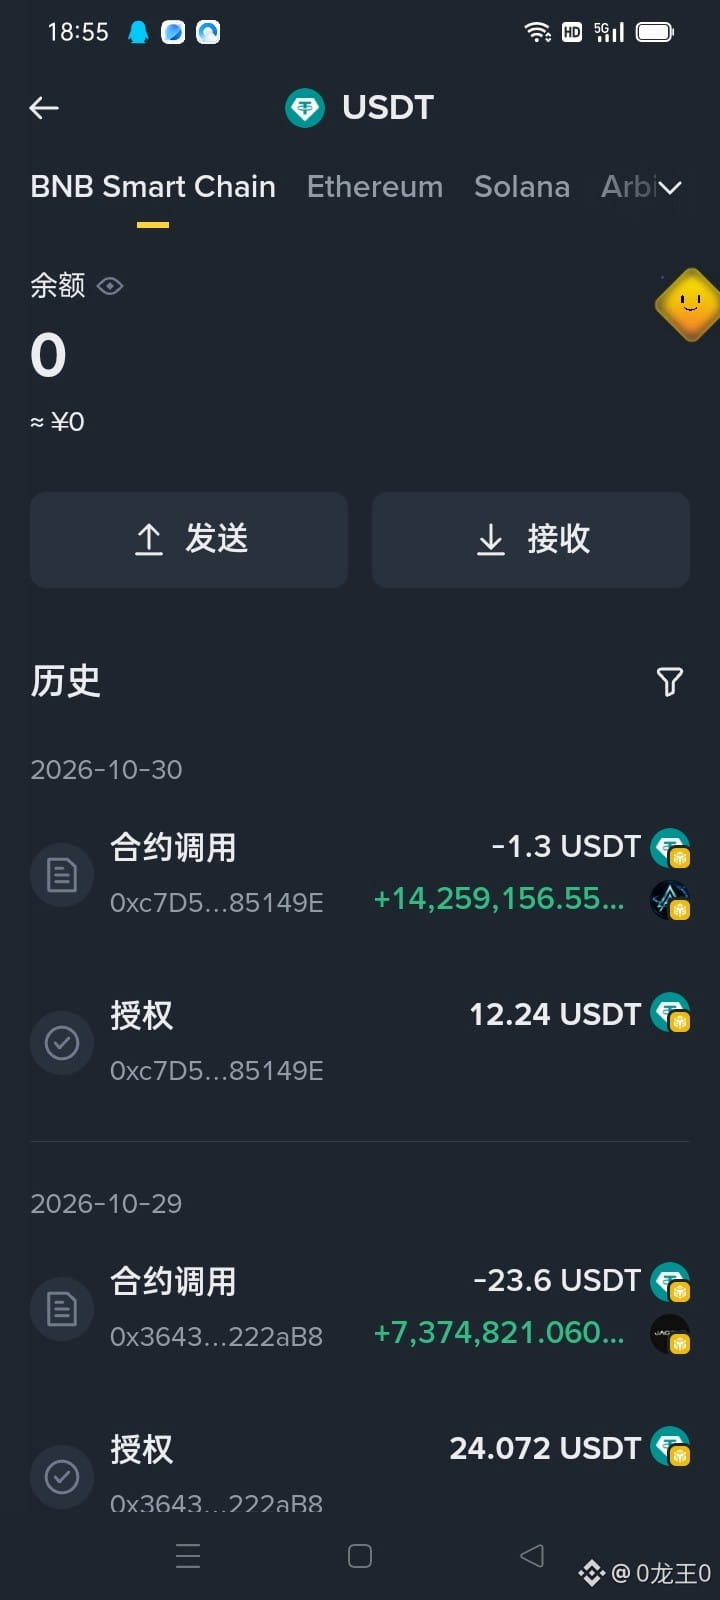
Can you take a look now? One is authorization, and the other is a call.
Can you take a look now? One is authorization, and the other is a call.
6
16
·
--
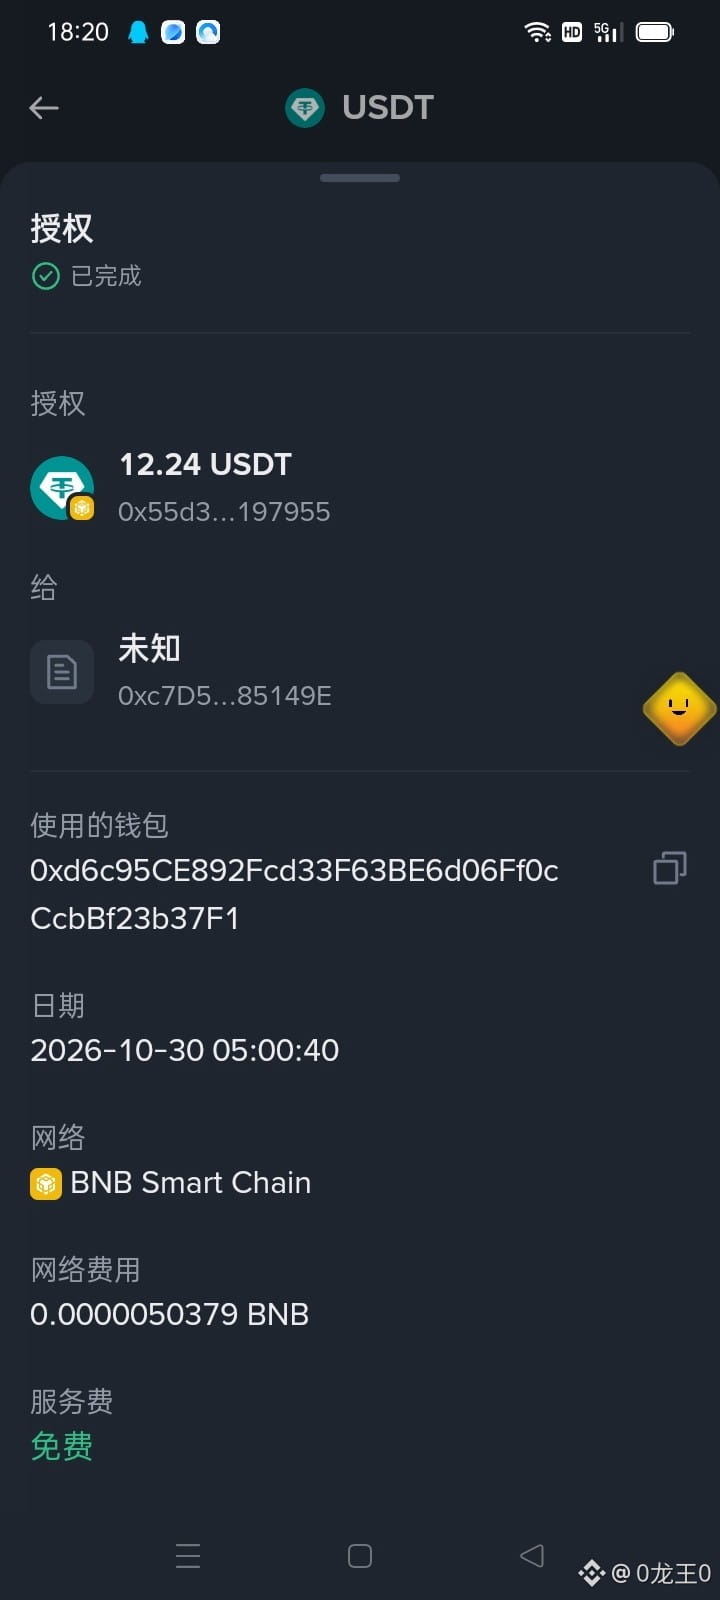
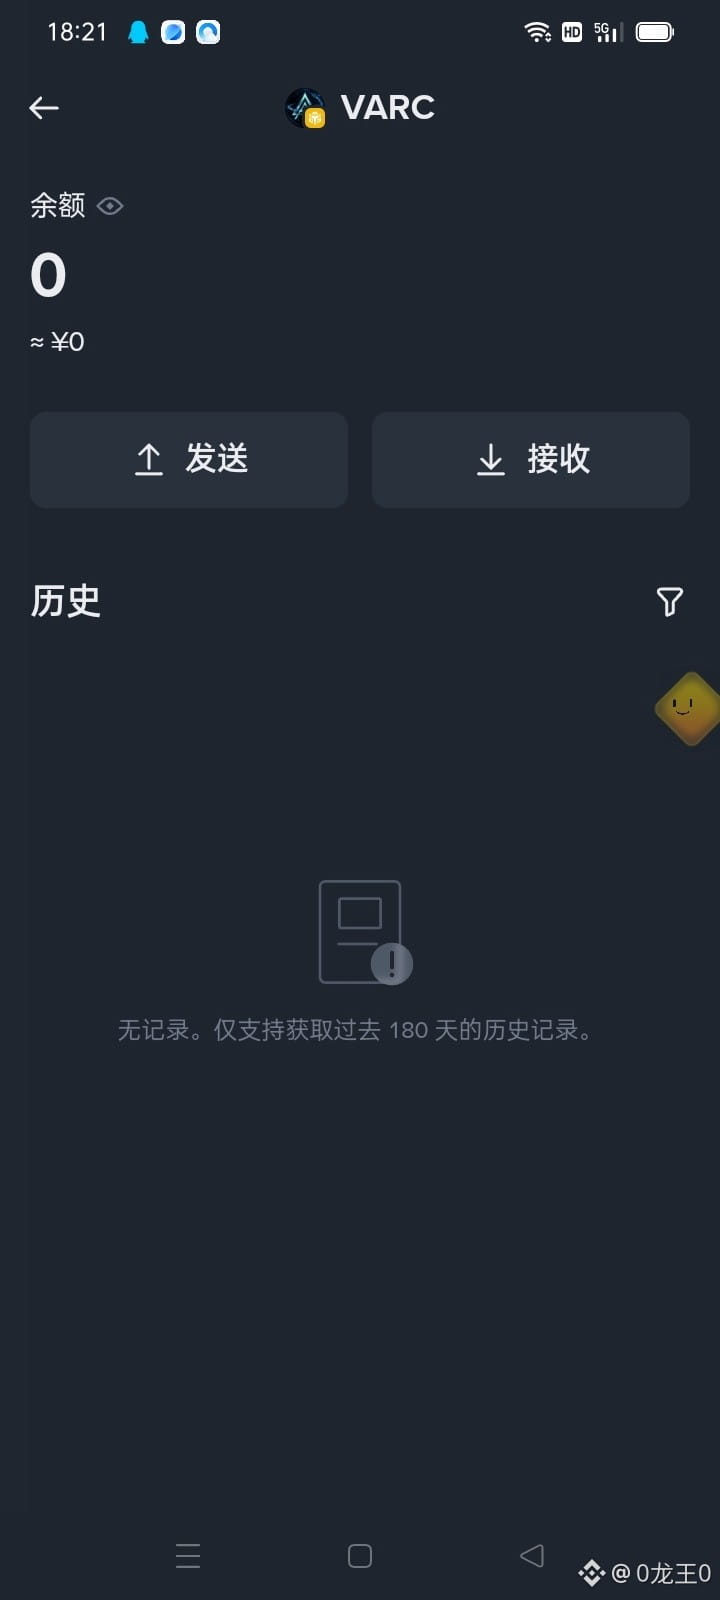
I posted it. Can you help me check the backend?
I posted it. Can you help me check the backend?
4
364
·
--
Bullish
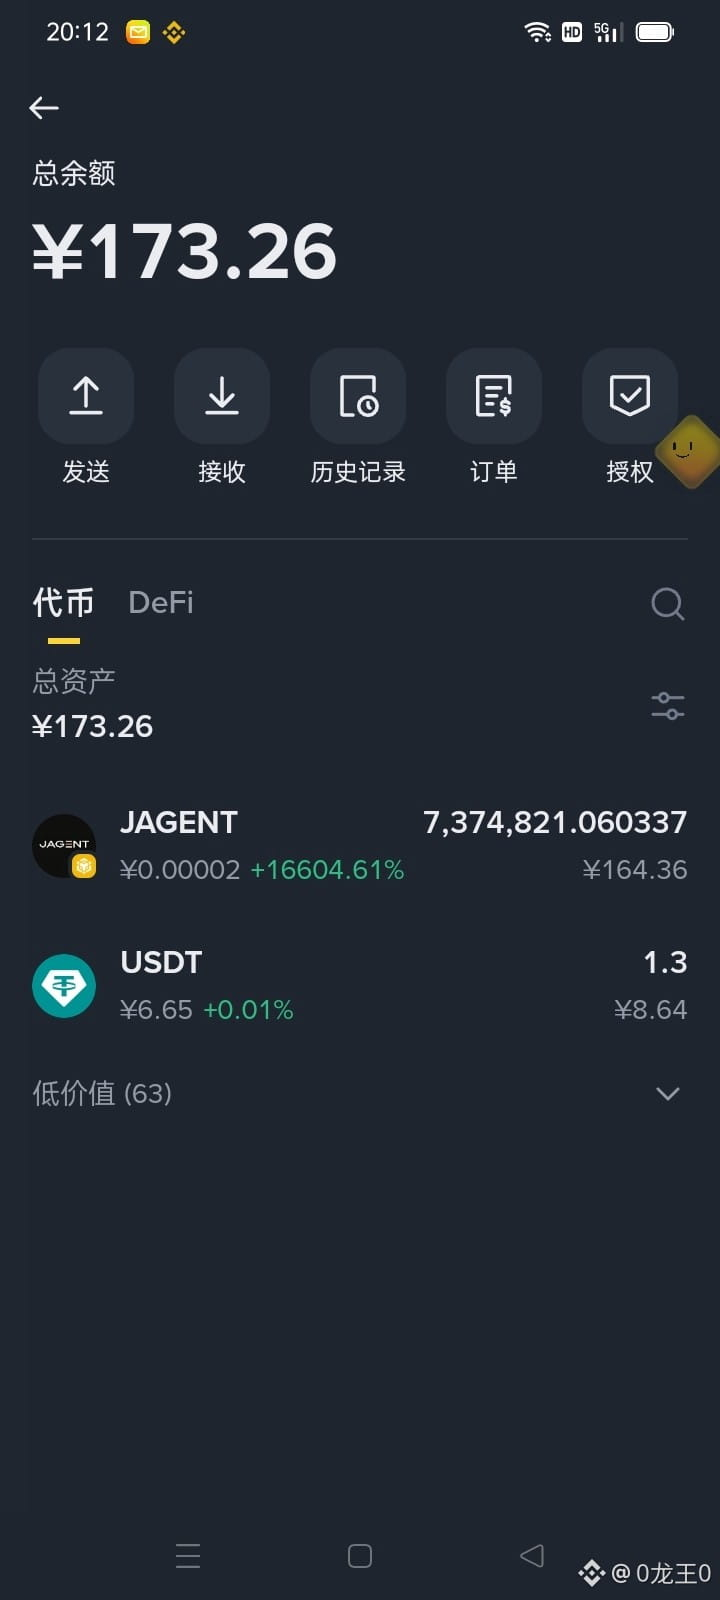
#JAGENT Tutorial: You can do it all on your phone. On phone A, log in to the official website: https://jager.live/?ref=fuxiaolong.ai
On phone B, scan the QR code. Right now, $24 gets you 10 copies.
#JAGENT Tutorial: You can do it all on your phone. On phone A, log in to the official website: https://jager.live/?ref=fuxiaolong.ai
On phone B, scan the QR code. Right now, $24 gets you 10 copies.
On phone B, scan the QR code. Right now, $24 gets you 10 copies.
1
16
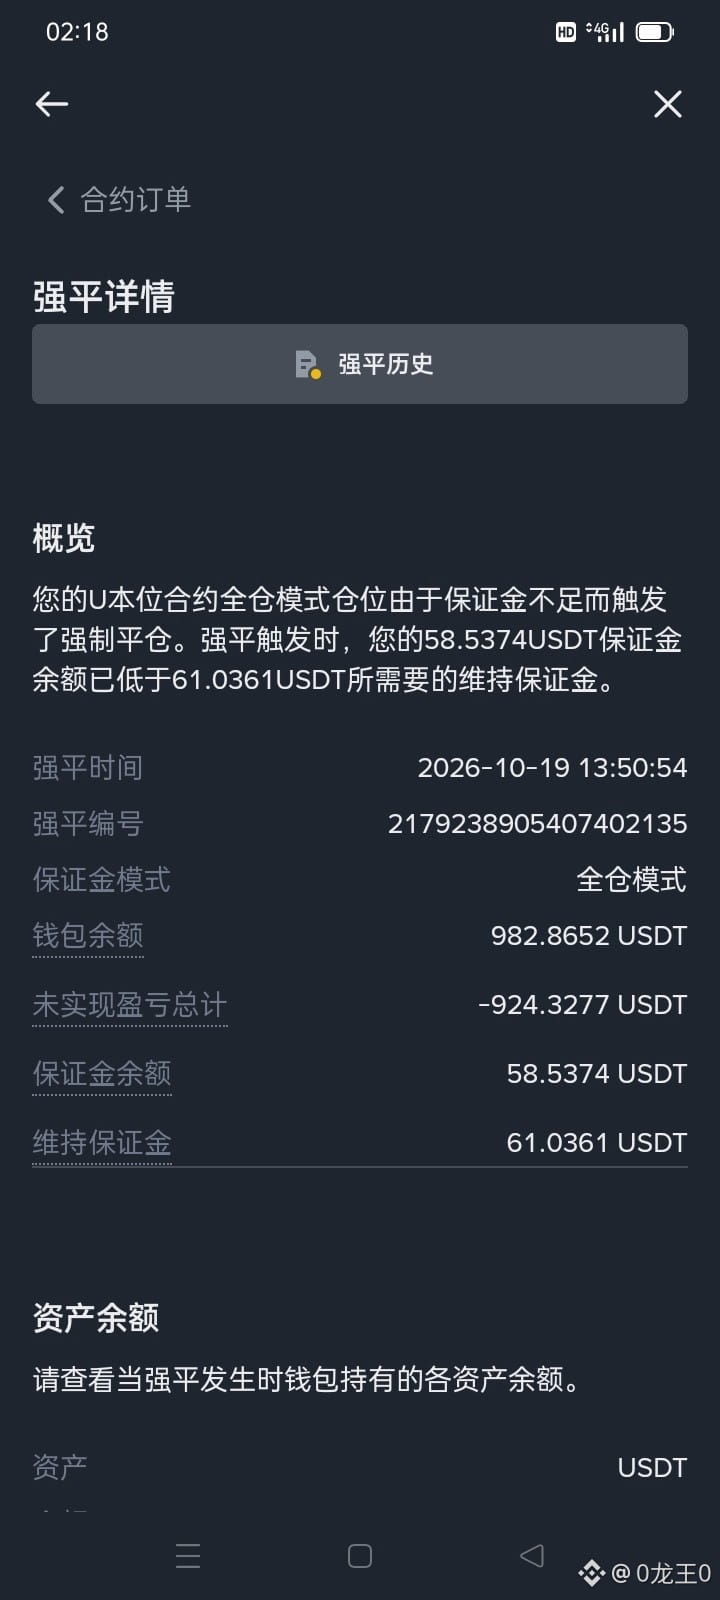
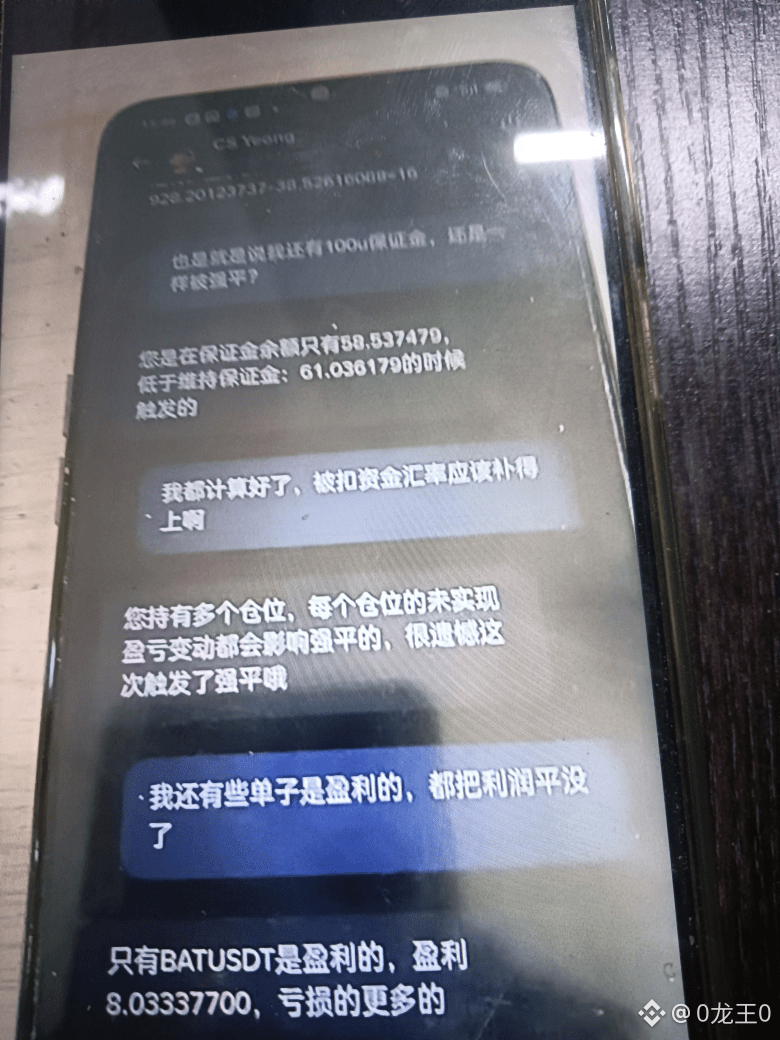
·
--
Bearish
#AKE I. Core Price and Volume Data
Latest price: 0.035920 USDT (approximately RMB 0.2403), up 37.46% over 24 hours.
Mark price: 0.035801 (used for contract settlement and close to the latest price).
24-hour range: High of 0.037548 and low of 0.025962, indicating sharp intraday volatility.
24-hour trading activity: Trading volume reached 4.916 billion AKE, with a turnover of 154 million USDT, indicating exceptionally high short-term market participation.
II. Monthly Candlestick Pattern and Trend
Extreme spike followed by a pullback: The chart shows that this asset had remained at very low levels for a long time (with a marked low of 0.0001729), before surging sharply. The monthly high reached 0.1646960, but the upper wick is extremely long. The current price (around 0.0359370) has fallen substantially from its peak, representing a significant retracement.
Short-term rebound: Recent candlesticks show a rapid surge. A red “S” (sell) marker appears on the chart, and the price is currently consolidating or pulling back at elevated levels after the spike.
Indicator reference: The current AVL value is 0.0297560; RSI(6) is as high as 98.80, in the extremely overbought zone. This indicates that short-term bullish sentiment was exceptionally exuberant, but also points to a sharply increased risk of a pullback.
III. Trading Considerations
High volatility and overbought conditions: A daily gain of over 37%, combined with a monthly RSI nearing 99, means short-term holders may have substantial unrealized profits. Chasing the price carries significant risk, so beware of a deep pullback or a sharp shakeout.
Contract risks: As a perpetual contract, it can be prone to whipsaws and sudden price spikes that liquidate both long and short positions during extreme market conditions, as suggested by the long historical upper wick. Pay close attention to leverage and margin safety.
Key levels: Watch resistance around the previous high and the 0.05–0.06 range above, and the 0.0259 24-hour low and monthly moving-average support below.
#AKE I. Core Price and Volume Data
Latest price: 0.035920 USDT (approximately RMB 0.2403), up 37.46% over 24 hours.
Mark price: 0.035801 (used for contract settlement and close to the latest price).
24-hour range: High of 0.037548 and low of 0.025962, indicating sharp intraday volatility.
24-hour trading activity: Trading volume reached 4.916 billion AKE, with a turnover of 154 million USDT, indicating exceptionally high short-term market participation.
II. Monthly Candlestick Pattern and Trend
Extreme spike followed by a pullback: The chart shows that this asset had remained at very low levels for a long time (with a marked low of 0.0001729), before surging sharply. The monthly high reached 0.1646960, but the upper wick is extremely long. The current price (around 0.0359370) has fallen substantially from its peak, representing a significant retracement.
Short-term rebound: Recent candlesticks show a rapid surge. A red “S” (sell) marker appears on the chart, and the price is currently consolidating or pulling back at elevated levels after the spike.
Indicator reference: The current AVL value is 0.0297560; RSI(6) is as high as 98.80, in the extremely overbought zone. This indicates that short-term bullish sentiment was exceptionally exuberant, but also points to a sharply increased risk of a pullback.
III. Trading Considerations
High volatility and overbought conditions: A daily gain of over 37%, combined with a monthly RSI nearing 99, means short-term holders may have substantial unrealized profits. Chasing the price carries significant risk, so beware of a deep pullback or a sharp shakeout.
Contract risks: As a perpetual contract, it can be prone to whipsaws and sudden price spikes that liquidate both long and short positions during extreme market conditions, as suggested by the long historical upper wick. Pay close attention to leverage and margin safety.
Key levels: Watch resistance around the previous high and the 0.05–0.06 range above, and the 0.0259 24-hour low and monthly moving-average support below.
Latest price: 0.035920 USDT (approximately RMB 0.2403), up 37.46% over 24 hours.
Mark price: 0.035801 (used for contract settlement and close to the latest price).
24-hour range: High of 0.037548 and low of 0.025962, indicating sharp intraday volatility.
24-hour trading activity: Trading volume reached 4.916 billion AKE, with a turnover of 154 million USDT, indicating exceptionally high short-term market participation.
II. Monthly Candlestick Pattern and Trend
Extreme spike followed by a pullback: The chart shows that this asset had remained at very low levels for a long time (with a marked low of 0.0001729), before surging sharply. The monthly high reached 0.1646960, but the upper wick is extremely long. The current price (around 0.0359370) has fallen substantially from its peak, representing a significant retracement.
Short-term rebound: Recent candlesticks show a rapid surge. A red “S” (sell) marker appears on the chart, and the price is currently consolidating or pulling back at elevated levels after the spike.
Indicator reference: The current AVL value is 0.0297560; RSI(6) is as high as 98.80, in the extremely overbought zone. This indicates that short-term bullish sentiment was exceptionally exuberant, but also points to a sharply increased risk of a pullback.
III. Trading Considerations
High volatility and overbought conditions: A daily gain of over 37%, combined with a monthly RSI nearing 99, means short-term holders may have substantial unrealized profits. Chasing the price carries significant risk, so beware of a deep pullback or a sharp shakeout.
Contract risks: As a perpetual contract, it can be prone to whipsaws and sudden price spikes that liquidate both long and short positions during extreme market conditions, as suggested by the long historical upper wick. Pay close attention to leverage and margin safety.
Key levels: Watch resistance around the previous high and the 0.05–0.06 range above, and the 0.0259 24-hour low and monthly moving-average support below.
1
206
·
--
#AGT latest price: 0.033257 USDT (approximately RMB 0.2225), up as much as +98.16% over 24 hours.
Mark price: 0.033250, closely tracking the latest price, with no obvious funding rate deviation for now.
24-hour range: It dipped to a low of 0.014141 and surged to a high of 0.036650, showing enormous volatility. 24-hour trading volume was approximately 90.7672 million USDT, indicating active liquidity.
Technical Analysis and Candlestick Patterns
Price trend: The daily chart shows that after bottoming out near 0.013527, the price recently formed an exceptionally strong long bullish candle, nearly doubling in a single day and breaking directly above the previous consolidation range. The current price (0.033284) is near the previous high, with resistance from a recent high around 0.036650 overhead.
Moving averages/indicators: The AVL indicator reads 0.028743. The current price is trading significantly above this level, indicating a relatively high short-term deviation.
RSI: RSI(6) is as high as 77.75, entering deeply overbought territory and nearing the warning threshold of 80. This suggests extremely exuberant short-term buying momentum, so beware of a pullback driven by profit-taking.
Potential Opportunities and Risks
Opportunity: The strong intraday rally has not broken the bullish trend. If the price can subsequently hold above 0.0287 (the AVL line), momentum may carry it higher to test the 0.036650 high.
Risk: The 24-hour trading range is enormous and the RSI is overbought. A long bullish candle following a bottom often leads to sharp shakeouts. As a perpetual contract, it can also produce substantial unrealized gains or losses due to volatility, especially with high leverage. Additionally, small-cap coins that double in a day are often driven by news catalysts, so beware of a pump-and-dump.
#AGT latest price: 0.033257 USDT (approximately RMB 0.2225), up as much as +98.16% over 24 hours.
Mark price: 0.033250, closely tracking the latest price, with no obvious funding rate deviation for now.
24-hour range: It dipped to a low of 0.014141 and surged to a high of 0.036650, showing enormous volatility. 24-hour trading volume was approximately 90.7672 million USDT, indicating active liquidity.
Technical Analysis and Candlestick Patterns
Price trend: The daily chart shows that after bottoming out near 0.013527, the price recently formed an exceptionally strong long bullish candle, nearly doubling in a single day and breaking directly above the previous consolidation range. The current price (0.033284) is near the previous high, with resistance from a recent high around 0.036650 overhead.
Moving averages/indicators: The AVL indicator reads 0.028743. The current price is trading significantly above this level, indicating a relatively high short-term deviation.
RSI: RSI(6) is as high as 77.75, entering deeply overbought territory and nearing the warning threshold of 80. This suggests extremely exuberant short-term buying momentum, so beware of a pullback driven by profit-taking.
Potential Opportunities and Risks
Opportunity: The strong intraday rally has not broken the bullish trend. If the price can subsequently hold above 0.0287 (the AVL line), momentum may carry it higher to test the 0.036650 high.
Risk: The 24-hour trading range is enormous and the RSI is overbought. A long bullish candle following a bottom often leads to sharp shakeouts. As a perpetual contract, it can also produce substantial unrealized gains or losses due to volatility, especially with high leverage. Additionally, small-cap coins that double in a day are often driven by news catalysts, so beware of a pump-and-dump.
Mark price: 0.033250, closely tracking the latest price, with no obvious funding rate deviation for now.
24-hour range: It dipped to a low of 0.014141 and surged to a high of 0.036650, showing enormous volatility. 24-hour trading volume was approximately 90.7672 million USDT, indicating active liquidity.
Technical Analysis and Candlestick Patterns
Price trend: The daily chart shows that after bottoming out near 0.013527, the price recently formed an exceptionally strong long bullish candle, nearly doubling in a single day and breaking directly above the previous consolidation range. The current price (0.033284) is near the previous high, with resistance from a recent high around 0.036650 overhead.
Moving averages/indicators: The AVL indicator reads 0.028743. The current price is trading significantly above this level, indicating a relatively high short-term deviation.
RSI: RSI(6) is as high as 77.75, entering deeply overbought territory and nearing the warning threshold of 80. This suggests extremely exuberant short-term buying momentum, so beware of a pullback driven by profit-taking.
Potential Opportunities and Risks
Opportunity: The strong intraday rally has not broken the bullish trend. If the price can subsequently hold above 0.0287 (the AVL line), momentum may carry it higher to test the 0.036650 high.
Risk: The 24-hour trading range is enormous and the RSI is overbought. A long bullish candle following a bottom often leads to sharp shakeouts. As a perpetual contract, it can also produce substantial unrealized gains or losses due to volatility, especially with high leverage. Additionally, small-cap coins that double in a day are often driven by news catalysts, so beware of a pump-and-dump.
681
·
--
Bearish
#ZEREBRO Key Prices and Data
Latest price: 0.034945 USDT (approximately RMB 0.2338).
24h change: +26.15%, showing strong performance today.
24h high/low: High of 0.035300, low of 0.027312, indicating a relatively wide price range.
Trading volume: 24h volume reached 637 million ZEREBRO, with a turnover of approximately 20.6452 million USDT, indicating relatively active market trading.
Mark price: 0.034950 (close to the latest price, with no unusual deviation in the perpetual contract funding rate).
Monthly Chart Technical Pattern
Historical trend: The monthly chart shows that the token surged to an extreme high of 0.732800 shortly after listing, followed by a prolonged and substantial decline. Its historical low was 0.004060.
Current pattern: After a long period of consolidation near the bottom, the price has begun to recover. Overall, it is in a “bottoming and rebounding after a deep decline” phase. The current price has risen noticeably from its historical low, but remains far below its historical high.
Indicator status: The sub-chart shows an RSI(6) reading of 52.44, in the neutral region around 50 and slightly bullish. This suggests that buying and selling pressure are relatively balanced, with the indicator not yet in extreme overbought or oversold territory. An “S” marker appears on the chart, possibly indicating a user-set alert or sell marker.
Short-Term Performance and Risks
Combined with the 24h gain of over 26% and the monthly-chart rebound from the bottom, this asset has recently attracted considerable market interest and short-term bullish sentiment. However, as a small-cap altcoin (with AI/metaverse themes), it has a history of extreme volatility on the monthly timeframe. Perpetual contract trading carries liquidation risks, especially when using high leverage.
#ZEREBRO Key Prices and Data
Latest price: 0.034945 USDT (approximately RMB 0.2338).
24h change: +26.15%, showing strong performance today.
24h high/low: High of 0.035300, low of 0.027312, indicating a relatively wide price range.
Trading volume: 24h volume reached 637 million ZEREBRO, with a turnover of approximately 20.6452 million USDT, indicating relatively active market trading.
Mark price: 0.034950 (close to the latest price, with no unusual deviation in the perpetual contract funding rate).
Monthly Chart Technical Pattern
Historical trend: The monthly chart shows that the token surged to an extreme high of 0.732800 shortly after listing, followed by a prolonged and substantial decline. Its historical low was 0.004060.
Current pattern: After a long period of consolidation near the bottom, the price has begun to recover. Overall, it is in a “bottoming and rebounding after a deep decline” phase. The current price has risen noticeably from its historical low, but remains far below its historical high.
Indicator status: The sub-chart shows an RSI(6) reading of 52.44, in the neutral region around 50 and slightly bullish. This suggests that buying and selling pressure are relatively balanced, with the indicator not yet in extreme overbought or oversold territory. An “S” marker appears on the chart, possibly indicating a user-set alert or sell marker.
Short-Term Performance and Risks
Combined with the 24h gain of over 26% and the monthly-chart rebound from the bottom, this asset has recently attracted considerable market interest and short-term bullish sentiment. However, as a small-cap altcoin (with AI/metaverse themes), it has a history of extreme volatility on the monthly timeframe. Perpetual contract trading carries liquidation risks, especially when using high leverage.
Latest price: 0.034945 USDT (approximately RMB 0.2338).
24h change: +26.15%, showing strong performance today.
24h high/low: High of 0.035300, low of 0.027312, indicating a relatively wide price range.
Trading volume: 24h volume reached 637 million ZEREBRO, with a turnover of approximately 20.6452 million USDT, indicating relatively active market trading.
Mark price: 0.034950 (close to the latest price, with no unusual deviation in the perpetual contract funding rate).
Monthly Chart Technical Pattern
Historical trend: The monthly chart shows that the token surged to an extreme high of 0.732800 shortly after listing, followed by a prolonged and substantial decline. Its historical low was 0.004060.
Current pattern: After a long period of consolidation near the bottom, the price has begun to recover. Overall, it is in a “bottoming and rebounding after a deep decline” phase. The current price has risen noticeably from its historical low, but remains far below its historical high.
Indicator status: The sub-chart shows an RSI(6) reading of 52.44, in the neutral region around 50 and slightly bullish. This suggests that buying and selling pressure are relatively balanced, with the indicator not yet in extreme overbought or oversold territory. An “S” marker appears on the chart, possibly indicating a user-set alert or sell marker.
Short-Term Performance and Risks
Combined with the 24h gain of over 26% and the monthly-chart rebound from the bottom, this asset has recently attracted considerable market interest and short-term bullish sentiment. However, as a small-cap altcoin (with AI/metaverse themes), it has a history of extreme volatility on the monthly timeframe. Perpetual contract trading carries liquidation risks, especially when using high leverage.
221
·
--
Bearish
#Q I. Key Quotes and Data
Latest price: 0.041024 (mark price: 0.041005)
Price change: Up sharply by +32.81% over 24 hours (equivalent to approximately ¥0.2744)
24-hour range: High of 0.043459, low of 0.029520
Trading volume: 3.622 billion Q traded in 24 hours, with a turnover of 138 million USDT
Auxiliary indicators: AVL 0.029801, RSI(6) reading of 70.55
II. Monthly Technical Analysis
Long-term trend and pattern: The monthly chart shows that this asset previously reached an all-time high of 0.057408 before a deep pullback. It formed a base after reaching a low of 0.004626. The current monthly candlestick is a large, strong green candle with a sharp gain. The chart displays “S” (sell) and “B” (buy) markers, indicating intense battles between bulls and bears.
Moving average (AVL) status: The current price (0.041024) has risen sharply and is trading well above the monthly AVL (0.029801), significantly diverging from the moving average. This indicates very strong short-term bullish momentum, but the wide gap between the price and the moving average also suggests that pressure for a pullback is building.
Momentum indicator (RSI): The current RSI(6) is 70.55, having crossed above the overbought threshold of 70. This shows that the market is extremely overheated, increasing the risk of a short-term correction or consolidation at elevated levels.
Key support and resistance:
Support below: The first major support is in the previous high-volume trading zone (around 0.03682), with strong support at the monthly AVL (around 0.02980).
Resistance above: The 24-hour high of 0.043459 is the immediate resistance, with stronger resistance at the previous all-time high of 0.057408.
III. Overall View and Comparison
Overall, Q is in a strong upward phase on the monthly timeframe, with a 24-hour gain of over 32%, making it the strongest-momentum asset among the three charts. However, compared with BAT (RSI 66.91) and TRUTH (RSI 61.62), which were analyzed earlier, Q’s RSI has already crossed the overbought threshold of 70, and its price is furthest above the AVL moving average. This makes it a typical high-risk zone for chasing prices at elevated levels.
Key takeaway: Although the trend is bullish, the risk-reward ratio is declining at the current level. If you already hold a position, consider taking profits in stages. If you have not entered, avoid blindly chasing the price at the top of a large bullish candle while the RSI is overbought. You can wait for a pullback to the AVL (0.0298) or the previous high (0.0368) to confirm support before making a decision.
#Q I. Key Quotes and Data
Latest price: 0.041024 (mark price: 0.041005)
Price change: Up sharply by +32.81% over 24 hours (equivalent to approximately ¥0.2744)
24-hour range: High of 0.043459, low of 0.029520
Trading volume: 3.622 billion Q traded in 24 hours, with a turnover of 138 million USDT
Auxiliary indicators: AVL 0.029801, RSI(6) reading of 70.55
II. Monthly Technical Analysis
Long-term trend and pattern: The monthly chart shows that this asset previously reached an all-time high of 0.057408 before a deep pullback. It formed a base after reaching a low of 0.004626. The current monthly candlestick is a large, strong green candle with a sharp gain. The chart displays “S” (sell) and “B” (buy) markers, indicating intense battles between bulls and bears.
Moving average (AVL) status: The current price (0.041024) has risen sharply and is trading well above the monthly AVL (0.029801), significantly diverging from the moving average. This indicates very strong short-term bullish momentum, but the wide gap between the price and the moving average also suggests that pressure for a pullback is building.
Momentum indicator (RSI): The current RSI(6) is 70.55, having crossed above the overbought threshold of 70. This shows that the market is extremely overheated, increasing the risk of a short-term correction or consolidation at elevated levels.
Key support and resistance:
Support below: The first major support is in the previous high-volume trading zone (around 0.03682), with strong support at the monthly AVL (around 0.02980).
Resistance above: The 24-hour high of 0.043459 is the immediate resistance, with stronger resistance at the previous all-time high of 0.057408.
III. Overall View and Comparison
Overall, Q is in a strong upward phase on the monthly timeframe, with a 24-hour gain of over 32%, making it the strongest-momentum asset among the three charts. However, compared with BAT (RSI 66.91) and TRUTH (RSI 61.62), which were analyzed earlier, Q’s RSI has already crossed the overbought threshold of 70, and its price is furthest above the AVL moving average. This makes it a typical high-risk zone for chasing prices at elevated levels.
Key takeaway: Although the trend is bullish, the risk-reward ratio is declining at the current level. If you already hold a position, consider taking profits in stages. If you have not entered, avoid blindly chasing the price at the top of a large bullish candle while the RSI is overbought. You can wait for a pullback to the AVL (0.0298) or the previous high (0.0368) to confirm support before making a decision.
Latest price: 0.041024 (mark price: 0.041005)
Price change: Up sharply by +32.81% over 24 hours (equivalent to approximately ¥0.2744)
24-hour range: High of 0.043459, low of 0.029520
Trading volume: 3.622 billion Q traded in 24 hours, with a turnover of 138 million USDT
Auxiliary indicators: AVL 0.029801, RSI(6) reading of 70.55
II. Monthly Technical Analysis
Long-term trend and pattern: The monthly chart shows that this asset previously reached an all-time high of 0.057408 before a deep pullback. It formed a base after reaching a low of 0.004626. The current monthly candlestick is a large, strong green candle with a sharp gain. The chart displays “S” (sell) and “B” (buy) markers, indicating intense battles between bulls and bears.
Moving average (AVL) status: The current price (0.041024) has risen sharply and is trading well above the monthly AVL (0.029801), significantly diverging from the moving average. This indicates very strong short-term bullish momentum, but the wide gap between the price and the moving average also suggests that pressure for a pullback is building.
Momentum indicator (RSI): The current RSI(6) is 70.55, having crossed above the overbought threshold of 70. This shows that the market is extremely overheated, increasing the risk of a short-term correction or consolidation at elevated levels.
Key support and resistance:
Support below: The first major support is in the previous high-volume trading zone (around 0.03682), with strong support at the monthly AVL (around 0.02980).
Resistance above: The 24-hour high of 0.043459 is the immediate resistance, with stronger resistance at the previous all-time high of 0.057408.
III. Overall View and Comparison
Overall, Q is in a strong upward phase on the monthly timeframe, with a 24-hour gain of over 32%, making it the strongest-momentum asset among the three charts. However, compared with BAT (RSI 66.91) and TRUTH (RSI 61.62), which were analyzed earlier, Q’s RSI has already crossed the overbought threshold of 70, and its price is furthest above the AVL moving average. This makes it a typical high-risk zone for chasing prices at elevated levels.
Key takeaway: Although the trend is bullish, the risk-reward ratio is declining at the current level. If you already hold a position, consider taking profits in stages. If you have not entered, avoid blindly chasing the price at the top of a large bullish candle while the RSI is overbought. You can wait for a pullback to the AVL (0.0298) or the previous high (0.0368) to confirm support before making a decision.
438
·
--
Bearish
#TRUTH I. Key Quote and Data
Latest price: 0.017462 (mark price: 0.017445)
Price change: Up +20.80% over 24 hours (equivalent to approximately ¥0.1168)
24-hour range: High 0.017659, low 0.014363
Trading volume: 1.379 billion TRUTH traded in 24 hours, with a trading value of 22.1218 million USDT
Auxiliary indicators: AVL 0.014896, RSI(6) reading 61.62
II. Monthly Technical Analysis
Long-term trend and pattern: The monthly chart shows that this asset previously reached an all-time high of 0.052158 before undergoing a sharp decline. It stabilized after reaching a low of 0.007574. The current monthly candlestick is a green bullish candle, indicating a recovery rally from the bottom. The chart also displays an “S” marker (typically indicating a close/sell signal).
Moving average (AVL) status: The current price (0.017462) is clearly above the monthly AVL (0.014896), and the moving average appears to be flattening. This indicates that the rebound from the bottom has broken above the long-term moving average, with support strengthening.
Momentum indicator (RSI): The current RSI(6) is 61.62, in relatively strong territory (above 50), indicating that bullish momentum is recovering. Compared with the previous rally, it has not yet reached the overbought threshold of 70, leaving some room to rise, though this should be monitored closely.
Key support and resistance:
Support below: The initial support is near the monthly AVL (around 0.01490), with strong support at the previous low of 0.007574.
Resistance above: The 24-hour high of 0.017659 is close to the current resistance. Stronger resistance lies at previous monthly highs, such as 0.024962 and the all-time high of 0.052158.
III. Overall Observations and Comparison
Overall, TRUTH is in a rebound phase after stabilizing at the bottom on the monthly timeframe. Its 24-hour gain of over 20% indicates active short-term capital flows. Similar to BAT in its previous rally, TRUTH has staged a strong rebound from low levels. However, TRUTH has only just broken above the AVL moving average, and its RSI (61.62) is slightly below BAT’s (66.91), suggesting it is in the middle stage of a rebound. In the short term, watch for selling pressure near the 24-hour high. If the price retests but holds above the AVL moving average, the trend will remain tilted to the upside.
#TRUTH I. Key Quote and Data
Latest price: 0.017462 (mark price: 0.017445)
Price change: Up +20.80% over 24 hours (equivalent to approximately ¥0.1168)
24-hour range: High 0.017659, low 0.014363
Trading volume: 1.379 billion TRUTH traded in 24 hours, with a trading value of 22.1218 million USDT
Auxiliary indicators: AVL 0.014896, RSI(6) reading 61.62
II. Monthly Technical Analysis
Long-term trend and pattern: The monthly chart shows that this asset previously reached an all-time high of 0.052158 before undergoing a sharp decline. It stabilized after reaching a low of 0.007574. The current monthly candlestick is a green bullish candle, indicating a recovery rally from the bottom. The chart also displays an “S” marker (typically indicating a close/sell signal).
Moving average (AVL) status: The current price (0.017462) is clearly above the monthly AVL (0.014896), and the moving average appears to be flattening. This indicates that the rebound from the bottom has broken above the long-term moving average, with support strengthening.
Momentum indicator (RSI): The current RSI(6) is 61.62, in relatively strong territory (above 50), indicating that bullish momentum is recovering. Compared with the previous rally, it has not yet reached the overbought threshold of 70, leaving some room to rise, though this should be monitored closely.
Key support and resistance:
Support below: The initial support is near the monthly AVL (around 0.01490), with strong support at the previous low of 0.007574.
Resistance above: The 24-hour high of 0.017659 is close to the current resistance. Stronger resistance lies at previous monthly highs, such as 0.024962 and the all-time high of 0.052158.
III. Overall Observations and Comparison
Overall, TRUTH is in a rebound phase after stabilizing at the bottom on the monthly timeframe. Its 24-hour gain of over 20% indicates active short-term capital flows. Similar to BAT in its previous rally, TRUTH has staged a strong rebound from low levels. However, TRUTH has only just broken above the AVL moving average, and its RSI (61.62) is slightly below BAT’s (66.91), suggesting it is in the middle stage of a rebound. In the short term, watch for selling pressure near the 24-hour high. If the price retests but holds above the AVL moving average, the trend will remain tilted to the upside.
Latest price: 0.017462 (mark price: 0.017445)
Price change: Up +20.80% over 24 hours (equivalent to approximately ¥0.1168)
24-hour range: High 0.017659, low 0.014363
Trading volume: 1.379 billion TRUTH traded in 24 hours, with a trading value of 22.1218 million USDT
Auxiliary indicators: AVL 0.014896, RSI(6) reading 61.62
II. Monthly Technical Analysis
Long-term trend and pattern: The monthly chart shows that this asset previously reached an all-time high of 0.052158 before undergoing a sharp decline. It stabilized after reaching a low of 0.007574. The current monthly candlestick is a green bullish candle, indicating a recovery rally from the bottom. The chart also displays an “S” marker (typically indicating a close/sell signal).
Moving average (AVL) status: The current price (0.017462) is clearly above the monthly AVL (0.014896), and the moving average appears to be flattening. This indicates that the rebound from the bottom has broken above the long-term moving average, with support strengthening.
Momentum indicator (RSI): The current RSI(6) is 61.62, in relatively strong territory (above 50), indicating that bullish momentum is recovering. Compared with the previous rally, it has not yet reached the overbought threshold of 70, leaving some room to rise, though this should be monitored closely.
Key support and resistance:
Support below: The initial support is near the monthly AVL (around 0.01490), with strong support at the previous low of 0.007574.
Resistance above: The 24-hour high of 0.017659 is close to the current resistance. Stronger resistance lies at previous monthly highs, such as 0.024962 and the all-time high of 0.052158.
III. Overall Observations and Comparison
Overall, TRUTH is in a rebound phase after stabilizing at the bottom on the monthly timeframe. Its 24-hour gain of over 20% indicates active short-term capital flows. Similar to BAT in its previous rally, TRUTH has staged a strong rebound from low levels. However, TRUTH has only just broken above the AVL moving average, and its RSI (61.62) is slightly below BAT’s (66.91), suggesting it is in the middle stage of a rebound. In the short term, watch for selling pressure near the 24-hour high. If the price retests but holds above the AVL moving average, the trend will remain tilted to the upside.
255
·
--
Bearish
#BTA I. Key Prices and Data
Latest price: 0.17688 (mark price: 0.17715)
Price change: +17.52% over 24 hours (equivalent to approximately ¥1.18)
24-hour range: High 0.19317, low 0.14333
Trading volume: 959 million BAT traded over 24 hours, with a turnover of 169 million USDT
Additional indicators: AVL 0.14209; RSI(6) reading: 66.91
II. Monthly Chart Technical Analysis
Long-term trend and pattern: The monthly chart shows that the asset experienced a prolonged decline before beginning to form a base and rebound after touching a historical relative low of 0.05500. The current monthly candlestick is a clear green bullish candle, with its upper wick reaching a recent resistance zone. An “S” marker appears on the right (typically indicating a close/sell signal).
Moving average (AVL) status: The current price (0.17688) is above the monthly AVL (0.14209), indicating that long-term moving-average support is holding and the bullish trend has recovered somewhat on the monthly timeframe.
Momentum indicator (RSI): The current RSI(6) is 66.91, in the 50–70 strength zone and nearing the overbought threshold (70). This indicates strong bullish momentum on the monthly timeframe, though near-term choppiness should also be expected if the indicator stalls at elevated levels or retreats.
Key support and resistance:
Support below: Initial support is near the AVL line (around 0.14200), with strong support at the previous low of 0.05500.
Resistance above: The 24-hour high of 0.19317 and previous monthly highs (such as around 0.25599) are likely to pose resistance to further gains.
III. Overall Assessment
Overall, BAT is in a strong rebound from low levels on the monthly timeframe, with clear signs of a long-term bottom. The current price has broken above moving-average resistance, and trading volume has provided good confirmation (a 24-hour gain of over 17%). However, with the RSI nearing overbought territory and the price approaching recent highs, be mindful of pullback risk when chasing short-term gains.
#BTA I. Key Prices and Data
Latest price: 0.17688 (mark price: 0.17715)
Price change: +17.52% over 24 hours (equivalent to approximately ¥1.18)
24-hour range: High 0.19317, low 0.14333
Trading volume: 959 million BAT traded over 24 hours, with a turnover of 169 million USDT
Additional indicators: AVL 0.14209; RSI(6) reading: 66.91
II. Monthly Chart Technical Analysis
Long-term trend and pattern: The monthly chart shows that the asset experienced a prolonged decline before beginning to form a base and rebound after touching a historical relative low of 0.05500. The current monthly candlestick is a clear green bullish candle, with its upper wick reaching a recent resistance zone. An “S” marker appears on the right (typically indicating a close/sell signal).
Moving average (AVL) status: The current price (0.17688) is above the monthly AVL (0.14209), indicating that long-term moving-average support is holding and the bullish trend has recovered somewhat on the monthly timeframe.
Momentum indicator (RSI): The current RSI(6) is 66.91, in the 50–70 strength zone and nearing the overbought threshold (70). This indicates strong bullish momentum on the monthly timeframe, though near-term choppiness should also be expected if the indicator stalls at elevated levels or retreats.
Key support and resistance:
Support below: Initial support is near the AVL line (around 0.14200), with strong support at the previous low of 0.05500.
Resistance above: The 24-hour high of 0.19317 and previous monthly highs (such as around 0.25599) are likely to pose resistance to further gains.
III. Overall Assessment
Overall, BAT is in a strong rebound from low levels on the monthly timeframe, with clear signs of a long-term bottom. The current price has broken above moving-average resistance, and trading volume has provided good confirmation (a 24-hour gain of over 17%). However, with the RSI nearing overbought territory and the price approaching recent highs, be mindful of pullback risk when chasing short-term gains.
Latest price: 0.17688 (mark price: 0.17715)
Price change: +17.52% over 24 hours (equivalent to approximately ¥1.18)
24-hour range: High 0.19317, low 0.14333
Trading volume: 959 million BAT traded over 24 hours, with a turnover of 169 million USDT
Additional indicators: AVL 0.14209; RSI(6) reading: 66.91
II. Monthly Chart Technical Analysis
Long-term trend and pattern: The monthly chart shows that the asset experienced a prolonged decline before beginning to form a base and rebound after touching a historical relative low of 0.05500. The current monthly candlestick is a clear green bullish candle, with its upper wick reaching a recent resistance zone. An “S” marker appears on the right (typically indicating a close/sell signal).
Moving average (AVL) status: The current price (0.17688) is above the monthly AVL (0.14209), indicating that long-term moving-average support is holding and the bullish trend has recovered somewhat on the monthly timeframe.
Momentum indicator (RSI): The current RSI(6) is 66.91, in the 50–70 strength zone and nearing the overbought threshold (70). This indicates strong bullish momentum on the monthly timeframe, though near-term choppiness should also be expected if the indicator stalls at elevated levels or retreats.
Key support and resistance:
Support below: Initial support is near the AVL line (around 0.14200), with strong support at the previous low of 0.05500.
Resistance above: The 24-hour high of 0.19317 and previous monthly highs (such as around 0.25599) are likely to pose resistance to further gains.
III. Overall Assessment
Overall, BAT is in a strong rebound from low levels on the monthly timeframe, with clear signs of a long-term bottom. The current price has broken above moving-average resistance, and trading volume has provided good confirmation (a 24-hour gain of over 17%). However, with the RSI nearing overbought territory and the price approaching recent highs, be mindful of pullback risk when chasing short-term gains.
215
·
--
#LUMI Core Price and Volume Data
Latest price: 0.12119 USDT (approximately ¥0.81197), up 50.66% in 24 hours.
Mark price: 0.12084 USDT.
24-hour extremes: High of 0.13952 USDT and low of 0.07958 USDT.
24-hour volume: 1.062 billion LUMIA traded, with a turnover of 126 million USDT. Trading volume rose significantly alongside the sharp price increase.
Daily Candlestick Pattern and Trend
Overall trend: After starting a volatile upward move from a low of 0.06742, the price recently (around October 9) formed a massive bullish candle on sharply increased volume, surging straight to a high of 0.13952.
Current pattern: The price has retreated to around 0.12119, leaving a long upper wick on the daily chart. This indicates selling pressure at higher levels, and the market is currently consolidating after its sharp rally.
Moving average reference: The AVL indicator shown on the chart reads 0.11832, and the current price is above this reference line.
Technical Indicator Status (RSI)
RSI(6) reading: Currently 80.04.
Signal meaning: The RSI has clearly broken above the 70 overbought threshold and entered deeply overbought territory. This reflects extremely bullish short-term sentiment, while also indicating that the price has moved far from its average and may need a technical pullback or sideways consolidation.
Key Price Levels
Resistance above: 0.13952 (24-hour high/top of the long upper wick), 0.14313 (upper limit of the chart scale).
Support below: 0.11832 (AVL reference line/near the lower edge of the current candlestick body), 0.11140 (next chart tick), 0.07958 (24-hour low/initial rally area).
Overall Market Characteristics and Risks
The asset is showing signs of a sharp short-term surge and deeply overbought conditions, making this a highly volatile market. Since this is perpetual contract trading, extreme market conditions and sharp price spikes or wicks (such as the long upper wick) can make high leverage especially risky, potentially leading to large unrealized gains or losses and forced liquidation. With the price stalling or retreating on high volume at elevated levels, chasing the rally carries considerable pullback risk. Closely monitor changes in volume and the strength of buying support at lower support levels.
#LUMI Core Price and Volume Data
Latest price: 0.12119 USDT (approximately ¥0.81197), up 50.66% in 24 hours.
Mark price: 0.12084 USDT.
24-hour extremes: High of 0.13952 USDT and low of 0.07958 USDT.
24-hour volume: 1.062 billion LUMIA traded, with a turnover of 126 million USDT. Trading volume rose significantly alongside the sharp price increase.
Daily Candlestick Pattern and Trend
Overall trend: After starting a volatile upward move from a low of 0.06742, the price recently (around October 9) formed a massive bullish candle on sharply increased volume, surging straight to a high of 0.13952.
Current pattern: The price has retreated to around 0.12119, leaving a long upper wick on the daily chart. This indicates selling pressure at higher levels, and the market is currently consolidating after its sharp rally.
Moving average reference: The AVL indicator shown on the chart reads 0.11832, and the current price is above this reference line.
Technical Indicator Status (RSI)
RSI(6) reading: Currently 80.04.
Signal meaning: The RSI has clearly broken above the 70 overbought threshold and entered deeply overbought territory. This reflects extremely bullish short-term sentiment, while also indicating that the price has moved far from its average and may need a technical pullback or sideways consolidation.
Key Price Levels
Resistance above: 0.13952 (24-hour high/top of the long upper wick), 0.14313 (upper limit of the chart scale).
Support below: 0.11832 (AVL reference line/near the lower edge of the current candlestick body), 0.11140 (next chart tick), 0.07958 (24-hour low/initial rally area).
Overall Market Characteristics and Risks
The asset is showing signs of a sharp short-term surge and deeply overbought conditions, making this a highly volatile market. Since this is perpetual contract trading, extreme market conditions and sharp price spikes or wicks (such as the long upper wick) can make high leverage especially risky, potentially leading to large unrealized gains or losses and forced liquidation. With the price stalling or retreating on high volume at elevated levels, chasing the rally carries considerable pullback risk. Closely monitor changes in volume and the strength of buying support at lower support levels.
Latest price: 0.12119 USDT (approximately ¥0.81197), up 50.66% in 24 hours.
Mark price: 0.12084 USDT.
24-hour extremes: High of 0.13952 USDT and low of 0.07958 USDT.
24-hour volume: 1.062 billion LUMIA traded, with a turnover of 126 million USDT. Trading volume rose significantly alongside the sharp price increase.
Daily Candlestick Pattern and Trend
Overall trend: After starting a volatile upward move from a low of 0.06742, the price recently (around October 9) formed a massive bullish candle on sharply increased volume, surging straight to a high of 0.13952.
Current pattern: The price has retreated to around 0.12119, leaving a long upper wick on the daily chart. This indicates selling pressure at higher levels, and the market is currently consolidating after its sharp rally.
Moving average reference: The AVL indicator shown on the chart reads 0.11832, and the current price is above this reference line.
Technical Indicator Status (RSI)
RSI(6) reading: Currently 80.04.
Signal meaning: The RSI has clearly broken above the 70 overbought threshold and entered deeply overbought territory. This reflects extremely bullish short-term sentiment, while also indicating that the price has moved far from its average and may need a technical pullback or sideways consolidation.
Key Price Levels
Resistance above: 0.13952 (24-hour high/top of the long upper wick), 0.14313 (upper limit of the chart scale).
Support below: 0.11832 (AVL reference line/near the lower edge of the current candlestick body), 0.11140 (next chart tick), 0.07958 (24-hour low/initial rally area).
Overall Market Characteristics and Risks
The asset is showing signs of a sharp short-term surge and deeply overbought conditions, making this a highly volatile market. Since this is perpetual contract trading, extreme market conditions and sharp price spikes or wicks (such as the long upper wick) can make high leverage especially risky, potentially leading to large unrealized gains or losses and forced liquidation. With the price stalling or retreating on high volume at elevated levels, chasing the rally carries considerable pullback risk. Closely monitor changes in volume and the strength of buying support at lower support levels.
103
·
--
Bearish
#MAGIC Core Price and Volume Data
Latest price: 0.12382 USDT (mark price also at 0.12382)
24h change: +90.79% (approximately ¥0.8283)
24h high/low: 0.12650 / 0.06476 USDT
24h volume/turnover: 2.534 billion MAGIC / 255 million USDT
Additional indicator: AVL value is 0.10099
Candlestick Patterns and Trend Characteristics
Strong one-way rally: The daily chart shows a continuous upward trend. Recently, a very long-bodied green bullish candle appeared, with price surging on heavy volume from the previous low (marked at 0.04059) to a high of 0.12650, setting a new short-term high.
Rising price and volume: Alongside the extreme price rally, 24-hour trading volume increased significantly, indicating exceptionally active market trading.
Technical Indicator Status
RSI(6) severely overbought: The current RSI(6) reading is as high as 92.29994, deep in overbought territory (>80). This indicates extremely exuberant short-term bullish sentiment and that price has moved far from its average, creating a strong likelihood of a technical pullback or high-level consolidation as traders take profits.
Deviation from moving averages/channels: The current price is substantially above the AVL (0.10099) below it and the previous consolidation range, making short-term chasing risky.
Key Support and Resistance Levels (Based on Chart Analysis and Data)
Resistance above: The current high of around 0.12650 is immediate intraday resistance. If price breaks through, the next area to watch is higher, where there is less overhead supply.
Support below:
First support: Around the current AVL line at 0.10099 and the midpoint of the large bullish candle.
Second support: The previous consolidation platform and the large bullish candle's starting area, around 0.07400–0.09300.
Extreme support: The 24h low of 0.06476 and the previous swing low of 0.04059.
Overall Assessment and Risk Warning
Market characterization: The market is in the late stage of an extreme primary uptrend or an accelerating blow-off rally, with exceptionally high volatility.
Futures risk: As a perpetual contract, funding rates, leverage risk, and the probability of sharp wick moves can all increase significantly in extreme market conditions. With the RSI overbought and the daily gain approaching 100%, chasing longs at these levels could easily lead to a substantial drawdown.
Trading perspective: Long holders should beware of a pullback after the surge and monitor whether the previous high holds. Those without a position should avoid blindly chasing the rally and wait for a pullback to stabilize or indicators to normalize.
#MAGIC Core Price and Volume Data
Latest price: 0.12382 USDT (mark price also at 0.12382)
24h change: +90.79% (approximately ¥0.8283)
24h high/low: 0.12650 / 0.06476 USDT
24h volume/turnover: 2.534 billion MAGIC / 255 million USDT
Additional indicator: AVL value is 0.10099
Candlestick Patterns and Trend Characteristics
Strong one-way rally: The daily chart shows a continuous upward trend. Recently, a very long-bodied green bullish candle appeared, with price surging on heavy volume from the previous low (marked at 0.04059) to a high of 0.12650, setting a new short-term high.
Rising price and volume: Alongside the extreme price rally, 24-hour trading volume increased significantly, indicating exceptionally active market trading.
Technical Indicator Status
RSI(6) severely overbought: The current RSI(6) reading is as high as 92.29994, deep in overbought territory (>80). This indicates extremely exuberant short-term bullish sentiment and that price has moved far from its average, creating a strong likelihood of a technical pullback or high-level consolidation as traders take profits.
Deviation from moving averages/channels: The current price is substantially above the AVL (0.10099) below it and the previous consolidation range, making short-term chasing risky.
Key Support and Resistance Levels (Based on Chart Analysis and Data)
Resistance above: The current high of around 0.12650 is immediate intraday resistance. If price breaks through, the next area to watch is higher, where there is less overhead supply.
Support below:
First support: Around the current AVL line at 0.10099 and the midpoint of the large bullish candle.
Second support: The previous consolidation platform and the large bullish candle's starting area, around 0.07400–0.09300.
Extreme support: The 24h low of 0.06476 and the previous swing low of 0.04059.
Overall Assessment and Risk Warning
Market characterization: The market is in the late stage of an extreme primary uptrend or an accelerating blow-off rally, with exceptionally high volatility.
Futures risk: As a perpetual contract, funding rates, leverage risk, and the probability of sharp wick moves can all increase significantly in extreme market conditions. With the RSI overbought and the daily gain approaching 100%, chasing longs at these levels could easily lead to a substantial drawdown.
Trading perspective: Long holders should beware of a pullback after the surge and monitor whether the previous high holds. Those without a position should avoid blindly chasing the rally and wait for a pullback to stabilize or indicators to normalize.
Latest price: 0.12382 USDT (mark price also at 0.12382)
24h change: +90.79% (approximately ¥0.8283)
24h high/low: 0.12650 / 0.06476 USDT
24h volume/turnover: 2.534 billion MAGIC / 255 million USDT
Additional indicator: AVL value is 0.10099
Candlestick Patterns and Trend Characteristics
Strong one-way rally: The daily chart shows a continuous upward trend. Recently, a very long-bodied green bullish candle appeared, with price surging on heavy volume from the previous low (marked at 0.04059) to a high of 0.12650, setting a new short-term high.
Rising price and volume: Alongside the extreme price rally, 24-hour trading volume increased significantly, indicating exceptionally active market trading.
Technical Indicator Status
RSI(6) severely overbought: The current RSI(6) reading is as high as 92.29994, deep in overbought territory (>80). This indicates extremely exuberant short-term bullish sentiment and that price has moved far from its average, creating a strong likelihood of a technical pullback or high-level consolidation as traders take profits.
Deviation from moving averages/channels: The current price is substantially above the AVL (0.10099) below it and the previous consolidation range, making short-term chasing risky.
Key Support and Resistance Levels (Based on Chart Analysis and Data)
Resistance above: The current high of around 0.12650 is immediate intraday resistance. If price breaks through, the next area to watch is higher, where there is less overhead supply.
Support below:
First support: Around the current AVL line at 0.10099 and the midpoint of the large bullish candle.
Second support: The previous consolidation platform and the large bullish candle's starting area, around 0.07400–0.09300.
Extreme support: The 24h low of 0.06476 and the previous swing low of 0.04059.
Overall Assessment and Risk Warning
Market characterization: The market is in the late stage of an extreme primary uptrend or an accelerating blow-off rally, with exceptionally high volatility.
Futures risk: As a perpetual contract, funding rates, leverage risk, and the probability of sharp wick moves can all increase significantly in extreme market conditions. With the RSI overbought and the daily gain approaching 100%, chasing longs at these levels could easily lead to a substantial drawdown.
Trading perspective: Long holders should beware of a pullback after the surge and monitor whether the previous high holds. Those without a position should avoid blindly chasing the rally and wait for a pullback to stabilize or indicators to normalize.
1
654
·
--
Bearish
#US Price and Basic Data
Latest price: 0.02929230 USDT (approximately ¥0.1955), up +99.40% in 24 hours (nearly doubled).
Mark price: 0.029207 USDT.
24-hour extremes: high 0.030100, low 0.014079.
24-hour trading activity: volume of 9.25 billion US, turnover of 209 million USDT, indicating exceptionally active trading.
Indicator values: AVL is 0.024047; current RSI(6) is 68.43.
Market Pattern and Price Action
Deep V-shaped reversal + primary uptrend: The daily chart resembles a roller coaster. After starting from a low of 0.010049, the price surged to 0.040265 before falling sharply. Recently, it rallied strongly again from around 0.015, forming a second major uptrend after a deep V-shaped reversal. The current price has recovered most of its previous losses.
Chart signals: An "S" (sell) marker appears near the 0.040265 peak on the candlestick chart, while a "B" (buy) marker appears at a relative low after the pullback. This indicates that the asset is highly volatile and its momentum shifts quickly.
Overbought, but not extreme: RSI(6) is 68.43, near overbought territory (not yet at an extreme value like KAIA's 89). Bullish momentum remains strong, but watch for signs of momentum fading.
Volume and price action: The nearly 100% 24-hour gain was accompanied by 209 million USDT in trading volume, indicating a breakout on heavy volume. However, the current price is approaching the resistance zone near the previous high of 0.030100.
Key Levels to Watch
Resistance above: 0.030100 (24-hour high) → 0.035128 → 0.040265 (previous high and strong resistance).
Support below: First support at the AVL indicator level of 0.024047 and 0.021833; strong support around the deep V-shaped rally's starting zone of 0.015186–0.014079 (24-hour low).
Futures Trading Risk Warning
This is currently a perpetual contract, and the asset has gained nearly 100% in a single day, with an intraday range of approximately 114% (0.014079 → 0.030100). The price is testing the previous high's resistance zone. A breakout above 0.030100 on heavy volume could open up further upside; if rejected, a sharp reversal—surging, wicking, then plunging—is highly likely. Highly leveraged positions face liquidation risk in either direction, so carefully manage position size and stop-losses.
#US Price and Basic Data
Latest price: 0.02929230 USDT (approximately ¥0.1955), up +99.40% in 24 hours (nearly doubled).
Mark price: 0.029207 USDT.
24-hour extremes: high 0.030100, low 0.014079.
24-hour trading activity: volume of 9.25 billion US, turnover of 209 million USDT, indicating exceptionally active trading.
Indicator values: AVL is 0.024047; current RSI(6) is 68.43.
Market Pattern and Price Action
Deep V-shaped reversal + primary uptrend: The daily chart resembles a roller coaster. After starting from a low of 0.010049, the price surged to 0.040265 before falling sharply. Recently, it rallied strongly again from around 0.015, forming a second major uptrend after a deep V-shaped reversal. The current price has recovered most of its previous losses.
Chart signals: An "S" (sell) marker appears near the 0.040265 peak on the candlestick chart, while a "B" (buy) marker appears at a relative low after the pullback. This indicates that the asset is highly volatile and its momentum shifts quickly.
Overbought, but not extreme: RSI(6) is 68.43, near overbought territory (not yet at an extreme value like KAIA's 89). Bullish momentum remains strong, but watch for signs of momentum fading.
Volume and price action: The nearly 100% 24-hour gain was accompanied by 209 million USDT in trading volume, indicating a breakout on heavy volume. However, the current price is approaching the resistance zone near the previous high of 0.030100.
Key Levels to Watch
Resistance above: 0.030100 (24-hour high) → 0.035128 → 0.040265 (previous high and strong resistance).
Support below: First support at the AVL indicator level of 0.024047 and 0.021833; strong support around the deep V-shaped rally's starting zone of 0.015186–0.014079 (24-hour low).
Futures Trading Risk Warning
This is currently a perpetual contract, and the asset has gained nearly 100% in a single day, with an intraday range of approximately 114% (0.014079 → 0.030100). The price is testing the previous high's resistance zone. A breakout above 0.030100 on heavy volume could open up further upside; if rejected, a sharp reversal—surging, wicking, then plunging—is highly likely. Highly leveraged positions face liquidation risk in either direction, so carefully manage position size and stop-losses.
Latest price: 0.02929230 USDT (approximately ¥0.1955), up +99.40% in 24 hours (nearly doubled).
Mark price: 0.029207 USDT.
24-hour extremes: high 0.030100, low 0.014079.
24-hour trading activity: volume of 9.25 billion US, turnover of 209 million USDT, indicating exceptionally active trading.
Indicator values: AVL is 0.024047; current RSI(6) is 68.43.
Market Pattern and Price Action
Deep V-shaped reversal + primary uptrend: The daily chart resembles a roller coaster. After starting from a low of 0.010049, the price surged to 0.040265 before falling sharply. Recently, it rallied strongly again from around 0.015, forming a second major uptrend after a deep V-shaped reversal. The current price has recovered most of its previous losses.
Chart signals: An "S" (sell) marker appears near the 0.040265 peak on the candlestick chart, while a "B" (buy) marker appears at a relative low after the pullback. This indicates that the asset is highly volatile and its momentum shifts quickly.
Overbought, but not extreme: RSI(6) is 68.43, near overbought territory (not yet at an extreme value like KAIA's 89). Bullish momentum remains strong, but watch for signs of momentum fading.
Volume and price action: The nearly 100% 24-hour gain was accompanied by 209 million USDT in trading volume, indicating a breakout on heavy volume. However, the current price is approaching the resistance zone near the previous high of 0.030100.
Key Levels to Watch
Resistance above: 0.030100 (24-hour high) → 0.035128 → 0.040265 (previous high and strong resistance).
Support below: First support at the AVL indicator level of 0.024047 and 0.021833; strong support around the deep V-shaped rally's starting zone of 0.015186–0.014079 (24-hour low).
Futures Trading Risk Warning
This is currently a perpetual contract, and the asset has gained nearly 100% in a single day, with an intraday range of approximately 114% (0.014079 → 0.030100). The price is testing the previous high's resistance zone. A breakout above 0.030100 on heavy volume could open up further upside; if rejected, a sharp reversal—surging, wicking, then plunging—is highly likely. Highly leveraged positions face liquidation risk in either direction, so carefully manage position size and stop-losses.
6
796
Log in to explore more content
Join global crypto users on Binance Square
⚡️ Get latest and useful information about crypto.
💬 Trusted by the world’s largest crypto exchange.
👍 Discover real insights from verified creators.
Email / Phone number
Trending Topics
BinanceWithdrawalScamWarning
44,117 views
673 Discussing
Binance Warns Users of Withdrawal Scams as Services Resume: It Will Never Charge Fees, Sell Queue Spots or Ask You to Move Funds to a “Vault”
Binance News
·15 Likes
·8.2k views
USMidtermElections
609,510 views
3,241 Discussing
USOctoberNFP-AreRateCutsStillPossible
49,765 views
543 Discussing