

token loken
1.6k Posts
token loken
Token Loken — циклология крипторынка,макроанализ и психология инвестора.Пишу просто о сложном. Без шума. По делу.

ATOM Holder
Frequent Trader
5.8 Years
21 Following
313 Followers
3.3K+ Liked
Posts
All
Quotes
Videos
PINNED

Duhast
·
--
🔥 ONDO, KAITO, ENA — three altcoins worth watching! 🚀
The crypto market is throwing up fresh interesting stories again, and these three projects deserve attention.
🌐 $ONDO — a bet on tokenization.
A partnership with NEAR gives access to tokenized US stocks and ETFs. In addition, Ondo is exploring opportunities to tokenize Korean stocks together with Kakaopay Securities. The RWA sector keeps evolving, but the question is how much this growth will reflect in the token price. "Source" (https://www.prnewswire.com/news-releases/nearcom-partners-with-ondo-to-bring-tokenized-us-stocks-and-etfs-alongside-crypto-confidentially-302885947.html)
🤖 $KAITO — my favorite.
A project at the intersection of crypto and artificial intelligence remains intriguing, but volatility is high. Right now, it’s important to track demand, trading volumes, and how the introduction of new tokens affects the price.
📈 $ENA — a bold statement!
Standard Chartered forecasts ENA’s price at $0.42 by the end of 2026 and $2 by the end of 2028. The calculation is tied to the growth of the USDe stablecoin and a possible token buyback. This is the bank’s forecast, not a guarantee of growth.
💬 Now a question for traders: which of the three assets can surprise the market the most?
Share your goals and arguments in the comments! 🔥
The crypto market is throwing up fresh interesting stories again, and these three projects deserve attention.
🌐 $ONDO — a bet on tokenization.
A partnership with NEAR gives access to tokenized US stocks and ETFs. In addition, Ondo is exploring opportunities to tokenize Korean stocks together with Kakaopay Securities. The RWA sector keeps evolving, but the question is how much this growth will reflect in the token price. "Source" (https://www.prnewswire.com/news-releases/nearcom-partners-with-ondo-to-bring-tokenized-us-stocks-and-etfs-alongside-crypto-confidentially-302885947.html)
🤖 $KAITO — my favorite.
A project at the intersection of crypto and artificial intelligence remains intriguing, but volatility is high. Right now, it’s important to track demand, trading volumes, and how the introduction of new tokens affects the price.
📈 $ENA — a bold statement!
Standard Chartered forecasts ENA’s price at $0.42 by the end of 2026 and $2 by the end of 2028. The calculation is tied to the growth of the USDe stablecoin and a possible token buyback. This is the bank’s forecast, not a guarantee of growth.
💬 Now a question for traders: which of the three assets can surprise the market the most?
Share your goals and arguments in the comments! 🔥
249sd analysis
·
--
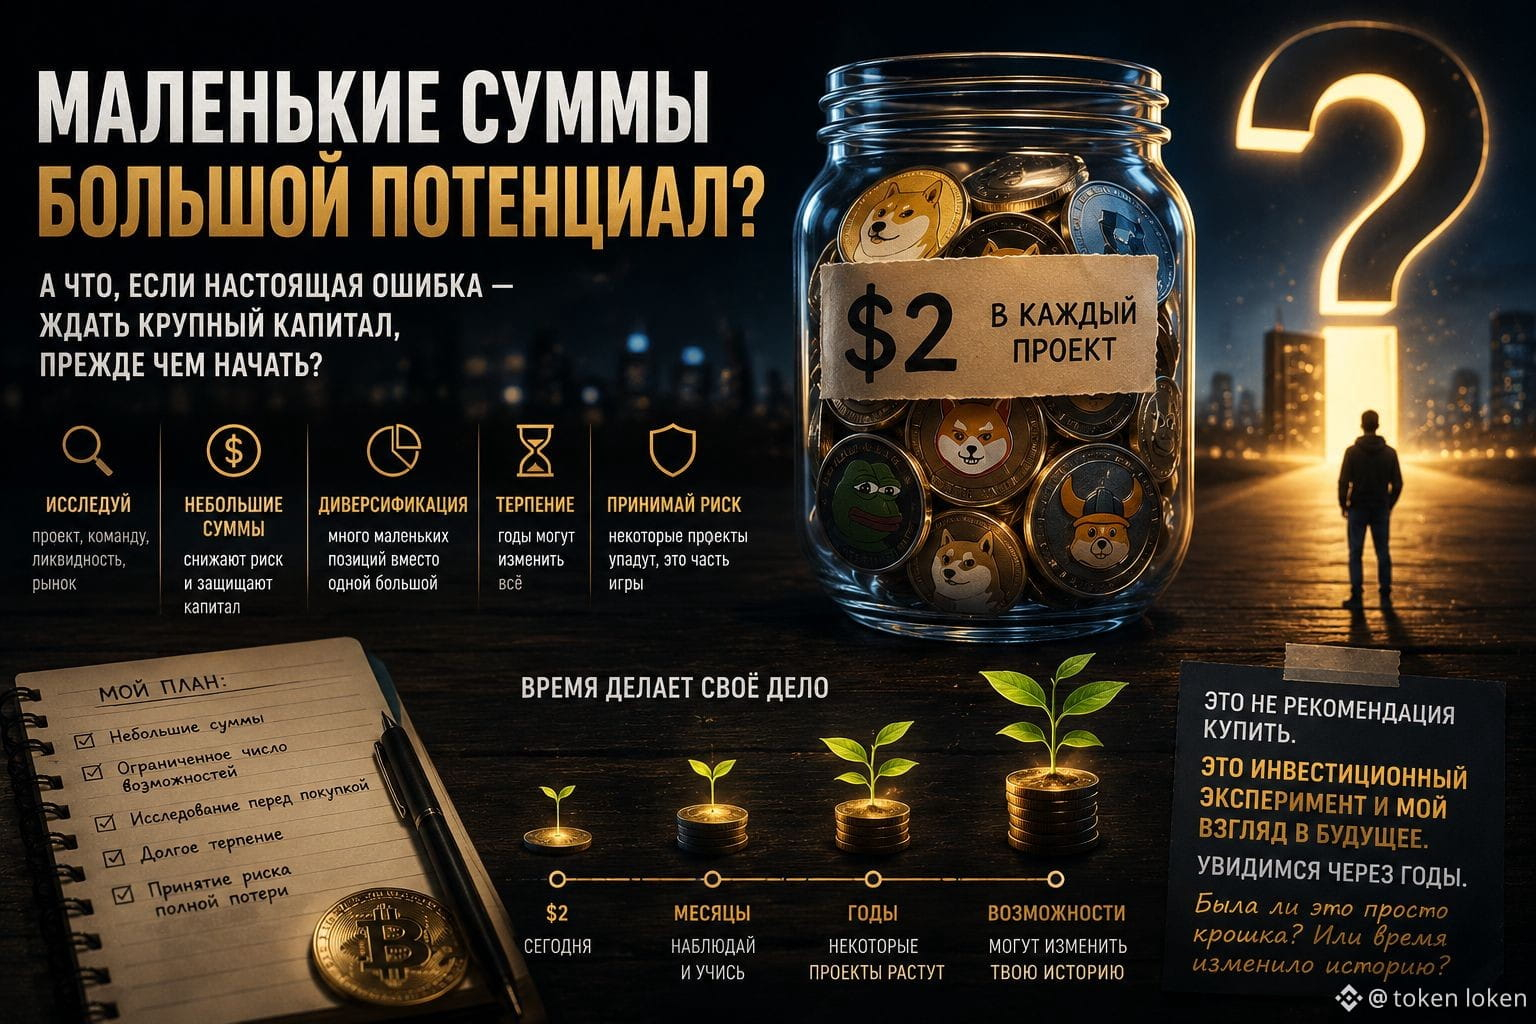
What if the real mistake is waiting for a large capital before you start?
For a while now I’ve been thinking about a simple question: what if I set aside a very small amount, like just $2 for each meme coin, put these amounts into very small projects I choose carefully, and then let time do its thing?
I’m not talking here about buying any coin at random, or about the illusion that every coin will become 100×.
I’m talking about a future plan to take risks with very small sums, so that the loss of a single coin can’t wipe out my capital.
token loken
·
--
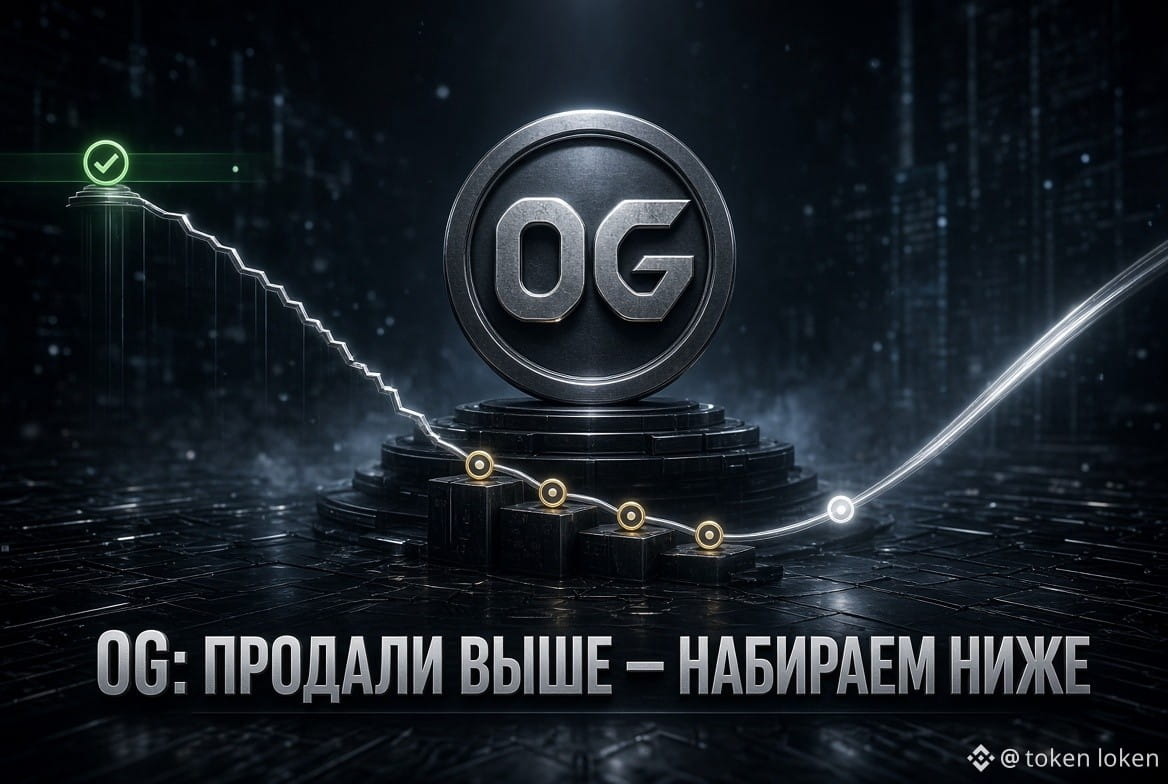
0G: SOLD ABOVE — STARTED BUILDING BELOW
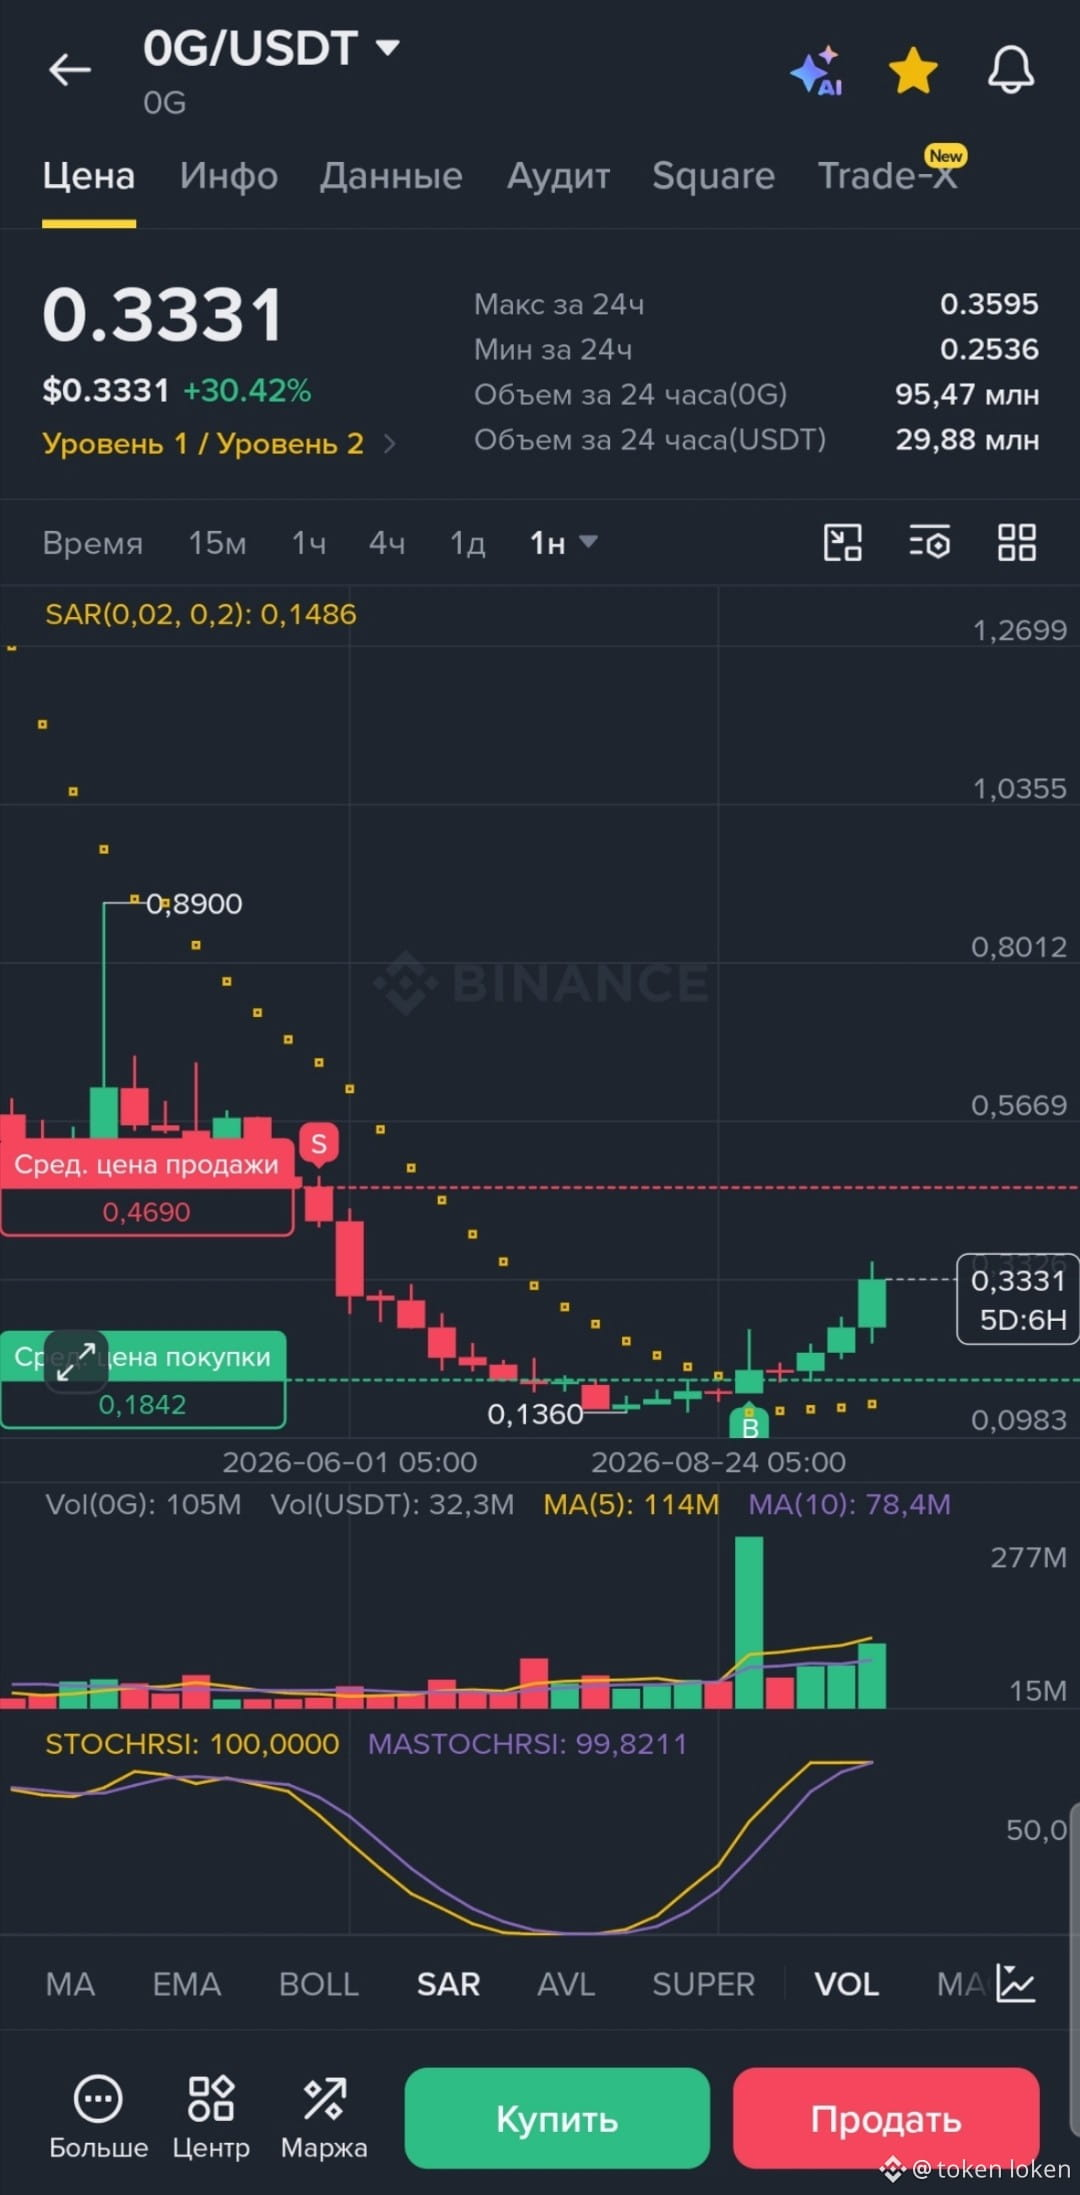
I’ll show you one of our trading schedules for $0G .
When the price was significantly higher, we gradually sold off the position. The average selling price came out to about 0.469 USDT.
After a strong drop, we didn’t try to guess the perfect bottom. We started gradually rebuilding the position already much lower — the average buy-in price is now about 0.184 USDT.
Today, $0G is trading again around 0.33 USDT.
For me, what’s interesting here is not the result of an individual trade itself. What matters is the approach: you don’t necessarily have to constantly guess the top and the bottom. Sometimes it’s enough to have a plan in advance, lock in part of the position, and leave yourself the option to buy it back cheaper.
We’ll keep watching $0G here — without forecasts and loud promises, just showing what we’re doing with the position and why.
And what do you prefer more: holding an asset without changes, or working with the position step by step?
#0G
#Криптовалюта
#Трейдинг
#Альткоины
#BinanceSquare
I’ll show you one of our trading schedules for $0G .
When the price was significantly higher, we gradually sold off the position. The average selling price came out to about 0.469 USDT.
After a strong drop, we didn’t try to guess the perfect bottom. We started gradually rebuilding the position already much lower — the average buy-in price is now about 0.184 USDT.
Today, $0G is trading again around 0.33 USDT.
For me, what’s interesting here is not the result of an individual trade itself. What matters is the approach: you don’t necessarily have to constantly guess the top and the bottom. Sometimes it’s enough to have a plan in advance, lock in part of the position, and leave yourself the option to buy it back cheaper.
We’ll keep watching $0G here — without forecasts and loud promises, just showing what we’re doing with the position and why.
And what do you prefer more: holding an asset without changes, or working with the position step by step?
#0G
#Криптовалюта
#Трейдинг
#Альткоины
#BinanceSquare
Golos Baffeta
·
--
A very bright and good example right in front of you. Once you remember it, you’ll start understanding how it works in the market.
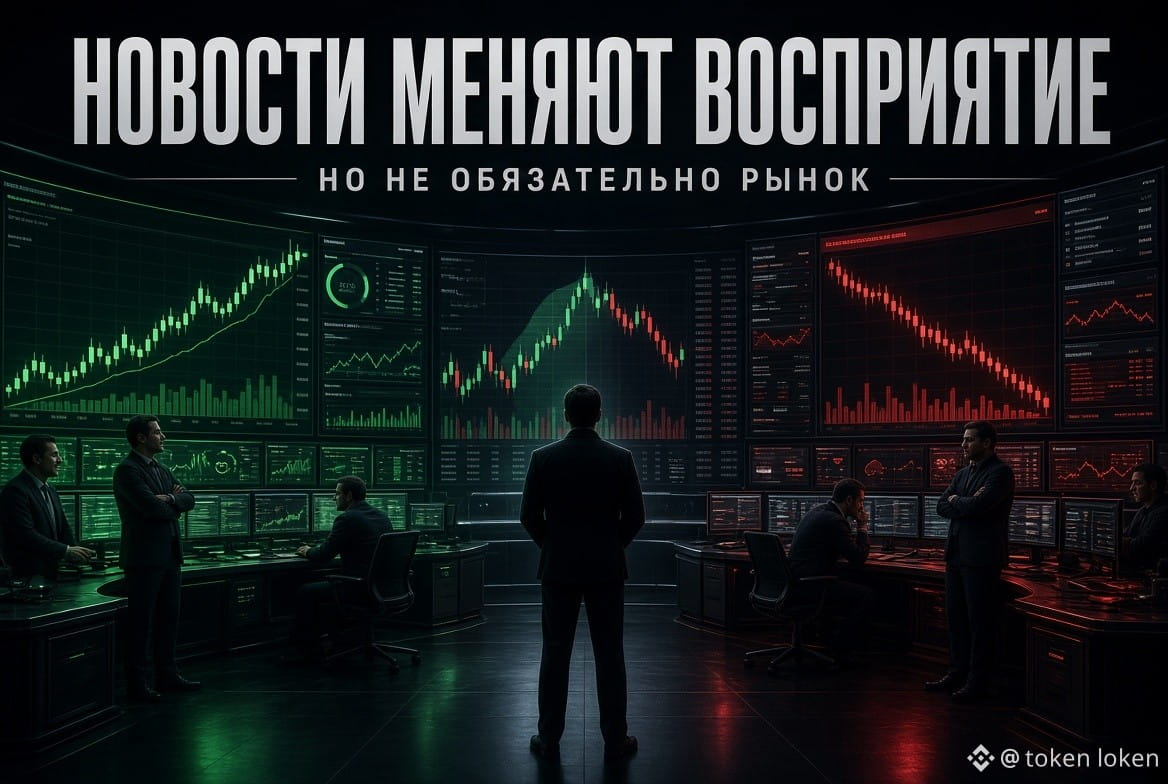
How they manipulate you using news.
Think back to the AI topic—what hype was going on and how strongly they pushed this theme, hooking it into any coins, and then distributing those tokens to the “hamsters.” $AI
And now look at what they’ve started publishing every day in the news related to artificial intelligence. $TAO
Now it turns out that we’re all in danger and we’re practically standing at the brink of the apocalypse because of regular hacks.
What do I want to tell everyone with all of this?
Any trend is supported and inflated with paid articles, and at the peaks you always get the best and most unbelievable news.
And after unloading into the crowd by a large player, to break the trend, they do exactly the same thing—only in the opposite direction.
Well, on the local bottom they’ll tell you all the most terrible things.
And you can consider this in general for all crypto, because in order to pump an asset more easily, you need to make it so that nobody has it $QNT
Have a great day 😄🙋🏻♂️
How they manipulate you using news.
Think back to the AI topic—what hype was going on and how strongly they pushed this theme, hooking it into any coins, and then distributing those tokens to the “hamsters.” $AI
And now look at what they’ve started publishing every day in the news related to artificial intelligence. $TAO
Now it turns out that we’re all in danger and we’re practically standing at the brink of the apocalypse because of regular hacks.
What do I want to tell everyone with all of this?
Any trend is supported and inflated with paid articles, and at the peaks you always get the best and most unbelievable news.
And after unloading into the crowd by a large player, to break the trend, they do exactly the same thing—only in the opposite direction.
Well, on the local bottom they’ll tell you all the most terrible things.
And you can consider this in general for all crypto, because in order to pump an asset more easily, you need to make it so that nobody has it $QNT
Have a great day 😄🙋🏻♂️


_Ram
·
--
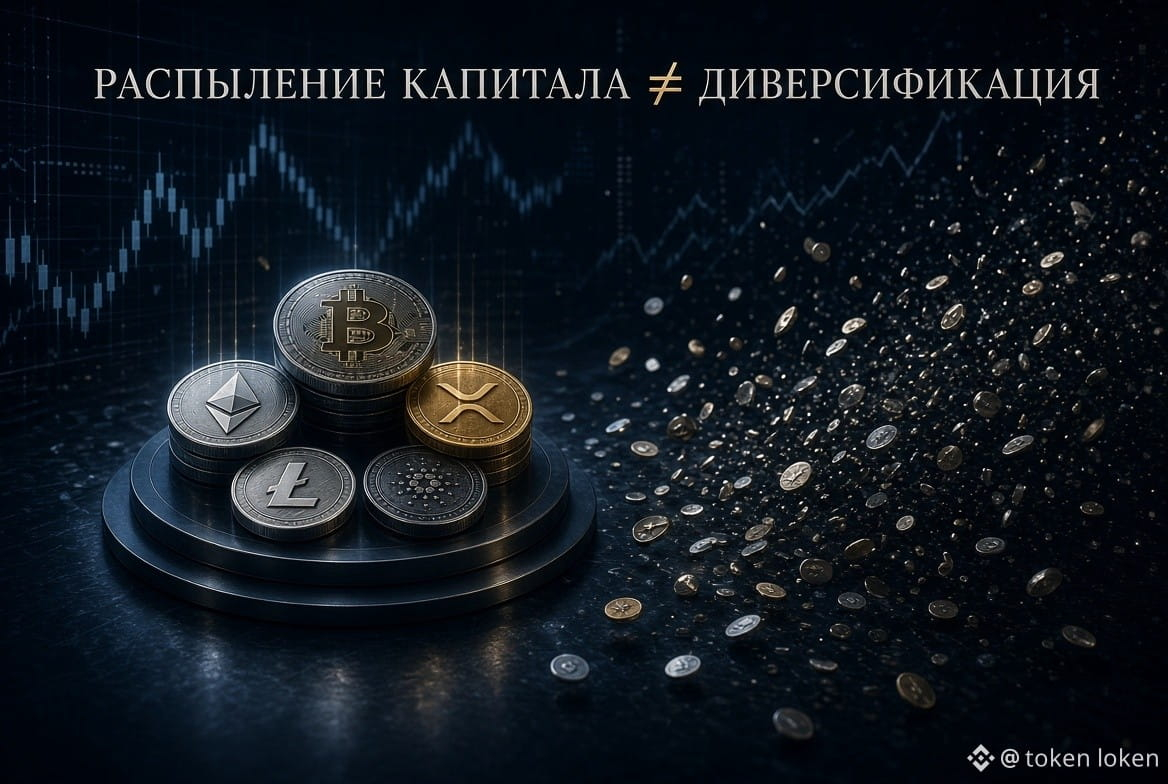
Another mistake you can make during this bull run is spreading your capital too thin, across thousands of tokens hoping that at least one of them will eventually explode and do a 100x.
You don’t need it !
You only need to focus, properly analyze a certain number of tokens, and simply choose a small number of them that convince you the most.
That’s much better than spreading your capital across 30, 50, or even 100+ cryptocurrencies.
even if you’re right and you actually find that one 100x, do you really think one 100x is going to save the other 99 tokens that did -50%, -80%, -90%, or worse?
$BNB
You don’t need it !
You only need to focus, properly analyze a certain number of tokens, and simply choose a small number of them that convince you the most.
That’s much better than spreading your capital across 30, 50, or even 100+ cryptocurrencies.
even if you’re right and you actually find that one 100x, do you really think one 100x is going to save the other 99 tokens that did -50%, -80%, -90%, or worse?
$BNB

token loken
·
--
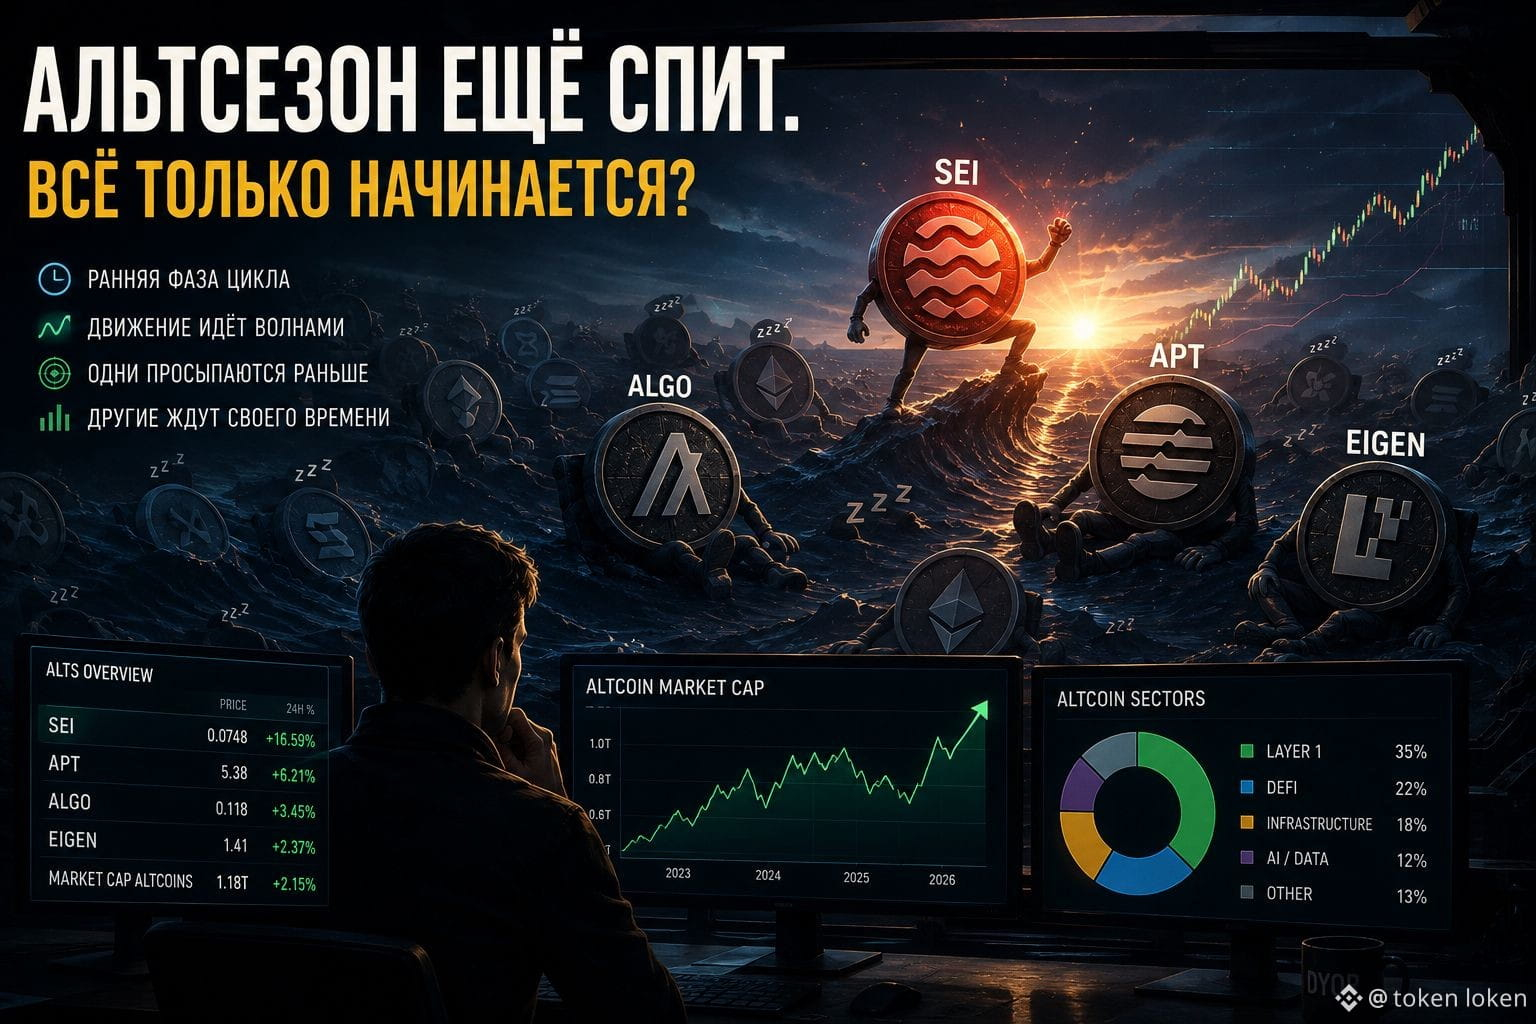
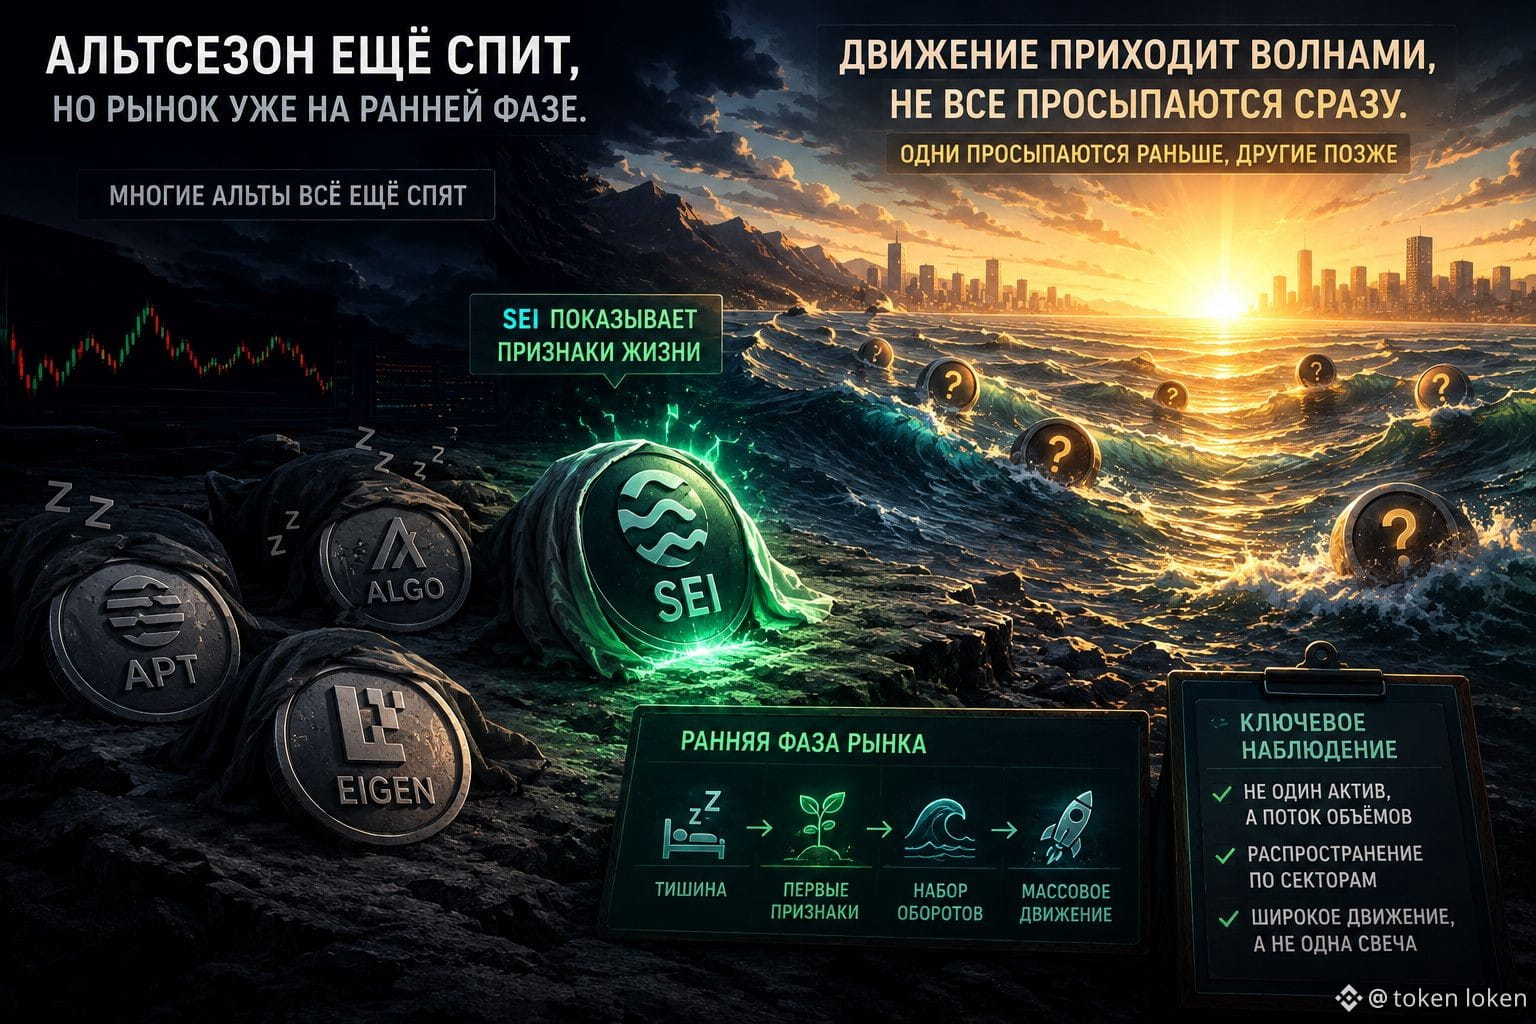
$SEI is already starting to attract attention, but I wouldn’t rush to call it proof of a full-fledged altseason.
That’s what’s interesting about the current situation: individual alts can start coming to life long before a unified market narrative appears.
One asset begins to move, another keeps standing still, and a third remains completely unnoticed.
That’s why right now I’m paying more attention not to the question “has altseason already begun or not?”, but to where the real flow of volume shows up and how it spreads across sectors.
If the move is truly broad, it shouldn’t just show up as one beautiful candle—it should gradually become noticeable across multiple segments.
For me, it’s more interesting to watch this process than to give it a loud name in advance.
Do you already see steady alt movement, or is it still just isolated bursts?
#SEI #APT #ALGO #EIGEN #BinanceSquare
That’s what’s interesting about the current situation: individual alts can start coming to life long before a unified market narrative appears.
One asset begins to move, another keeps standing still, and a third remains completely unnoticed.
That’s why right now I’m paying more attention not to the question “has altseason already begun or not?”, but to where the real flow of volume shows up and how it spreads across sectors.
If the move is truly broad, it shouldn’t just show up as one beautiful candle—it should gradually become noticeable across multiple segments.
For me, it’s more interesting to watch this process than to give it a loud name in advance.
Do you already see steady alt movement, or is it still just isolated bursts?
#SEI #APT #ALGO #EIGEN #BinanceSquare
DeFi Squirrel
·
--
Lot of alts still sleeping, haven't even caught a narrative yet.
$SEI showing some signs of life, but honestly? Still got room to run. Same deal with $APT, $ALGO, $EIGEN — they've basically done nothing. Just sitting there.
Feels like the altcoin market's still in that early stretch phase. Not fully awake yet. If you've been around a few cycles, you know this vibe — things start slow, then suddenly everyone's paying attention.
Not saying it's guaranteed or anything, but the setup's there. These things tend to move in waves, not all at once. Some coins wake up early, others take their sweet time. Just how it goes.
$SEI showing some signs of life, but honestly? Still got room to run. Same deal with $APT, $ALGO, $EIGEN — they've basically done nothing. Just sitting there.
Feels like the altcoin market's still in that early stretch phase. Not fully awake yet. If you've been around a few cycles, you know this vibe — things start slow, then suddenly everyone's paying attention.
Not saying it's guaranteed or anything, but the setup's there. These things tend to move in waves, not all at once. Some coins wake up early, others take their sweet time. Just how it goes.


Janiece Tannous sOXE
·
--
CRYPTO MARKET AFTER 10 YEARS.
TOTAL CRYPTO MARKET AFTER 10 YEARS— a global, high-tech digital enclosure for an anonymous crowd that makes cyclical darting moves between bouts of collective greed (euphoria) and collective panic (terror).
This is the ideal distillate of human vices, freed from the restraining factors of the traditional world (institutions, regulators, safeguards, and the banal time to think). In this context, blockchain acts not as a tool of freedom, but as an ultra-fast cable connecting the nervous systems of millions into a single pulsating superorganism, governed by just two basic hormones: dopamine (when everything is growing) and cortisol (when everything is falling apart).
This is the ideal distillate of human vices, freed from the restraining factors of the traditional world (institutions, regulators, safeguards, and the banal time to think). In this context, blockchain acts not as a tool of freedom, but as an ultra-fast cable connecting the nervous systems of millions into a single pulsating superorganism, governed by just two basic hormones: dopamine (when everything is growing) and cortisol (when everything is falling apart).

NATREYDE
·
--
🌅 MILLIONAIRE MONEY HABITS
🔥 The famous investor Peter Lynch used to say: whoever takes consumer loans at high interest rates works for someone else’s dream.
💎 Avoid expensive debt and credit spending
💡 Refusing loans stops your money from leaking to other people. Freedom from debt gives you the main thing—your right to choose and build capital.
🧮 A cent that doubles every day
▪️ Day 10: 5.12 USD · Day 20: 5,243 USD
▪️ Day 30: 5,368,709 USD
▪️ Half of the total amount appeared on the last day. That’s what an exponential curve looks like
📐 Formula: Amount = 0.01 USD × 2^(day − 1)
🎯 How to implement it today:
1️⃣ Pay off all high-interest consumer loans
2️⃣ Delay credit purchases and save the required amount in advance
3️⃣ Direct the freed-up money into reliable assets every month
📌 Peter Lynch — The Peter Lynch Method, 1989
💰 Millionaire Habits
#BinanceSquare #финансы #деньги #миллионер #investing
🔥 The famous investor Peter Lynch used to say: whoever takes consumer loans at high interest rates works for someone else’s dream.
💎 Avoid expensive debt and credit spending
💡 Refusing loans stops your money from leaking to other people. Freedom from debt gives you the main thing—your right to choose and build capital.
🧮 A cent that doubles every day
▪️ Day 10: 5.12 USD · Day 20: 5,243 USD
▪️ Day 30: 5,368,709 USD
▪️ Half of the total amount appeared on the last day. That’s what an exponential curve looks like
📐 Formula: Amount = 0.01 USD × 2^(day − 1)
🎯 How to implement it today:
1️⃣ Pay off all high-interest consumer loans
2️⃣ Delay credit purchases and save the required amount in advance
3️⃣ Direct the freed-up money into reliable assets every month
📌 Peter Lynch — The Peter Lynch Method, 1989
💰 Millionaire Habits
#BinanceSquare #финансы #деньги #миллионер #investing

FOXTRADER6
·
--
🚨Satoshi Nakamoto’s Bitcoin wallet is now worth more than $94 billion.
That puts it ahead of Warren Buffett, Mark Zuckerberg, and just behind Elon Musk.
And here’s the wild part...
He didn’t build a company.
He didn’t raise a single dollar from investors.
He didn’t give a single interview.
He wrote a white paper, mined over a million Bitcoins, and disappeared.
No product launches. No fame. No exit strategy.
Just one idea that changed how the world thinks about money—and a portfolio that has remained untouched for more than a decade.
People spend their whole lives chasing billions.
Satoshi walked away from it.
And somehow he ended up with one of the largest fortunes ever created.
That’s legendary. If you want to know how to accumulate bitcoin every day, message me
That puts it ahead of Warren Buffett, Mark Zuckerberg, and just behind Elon Musk.
And here’s the wild part...
He didn’t build a company.
He didn’t raise a single dollar from investors.
He didn’t give a single interview.
He wrote a white paper, mined over a million Bitcoins, and disappeared.
No product launches. No fame. No exit strategy.
Just one idea that changed how the world thinks about money—and a portfolio that has remained untouched for more than a decade.
People spend their whole lives chasing billions.
Satoshi walked away from it.
And somehow he ended up with one of the largest fortunes ever created.
That’s legendary. If you want to know how to accumulate bitcoin every day, message me



Feed-Creator-4eba95062
·
--
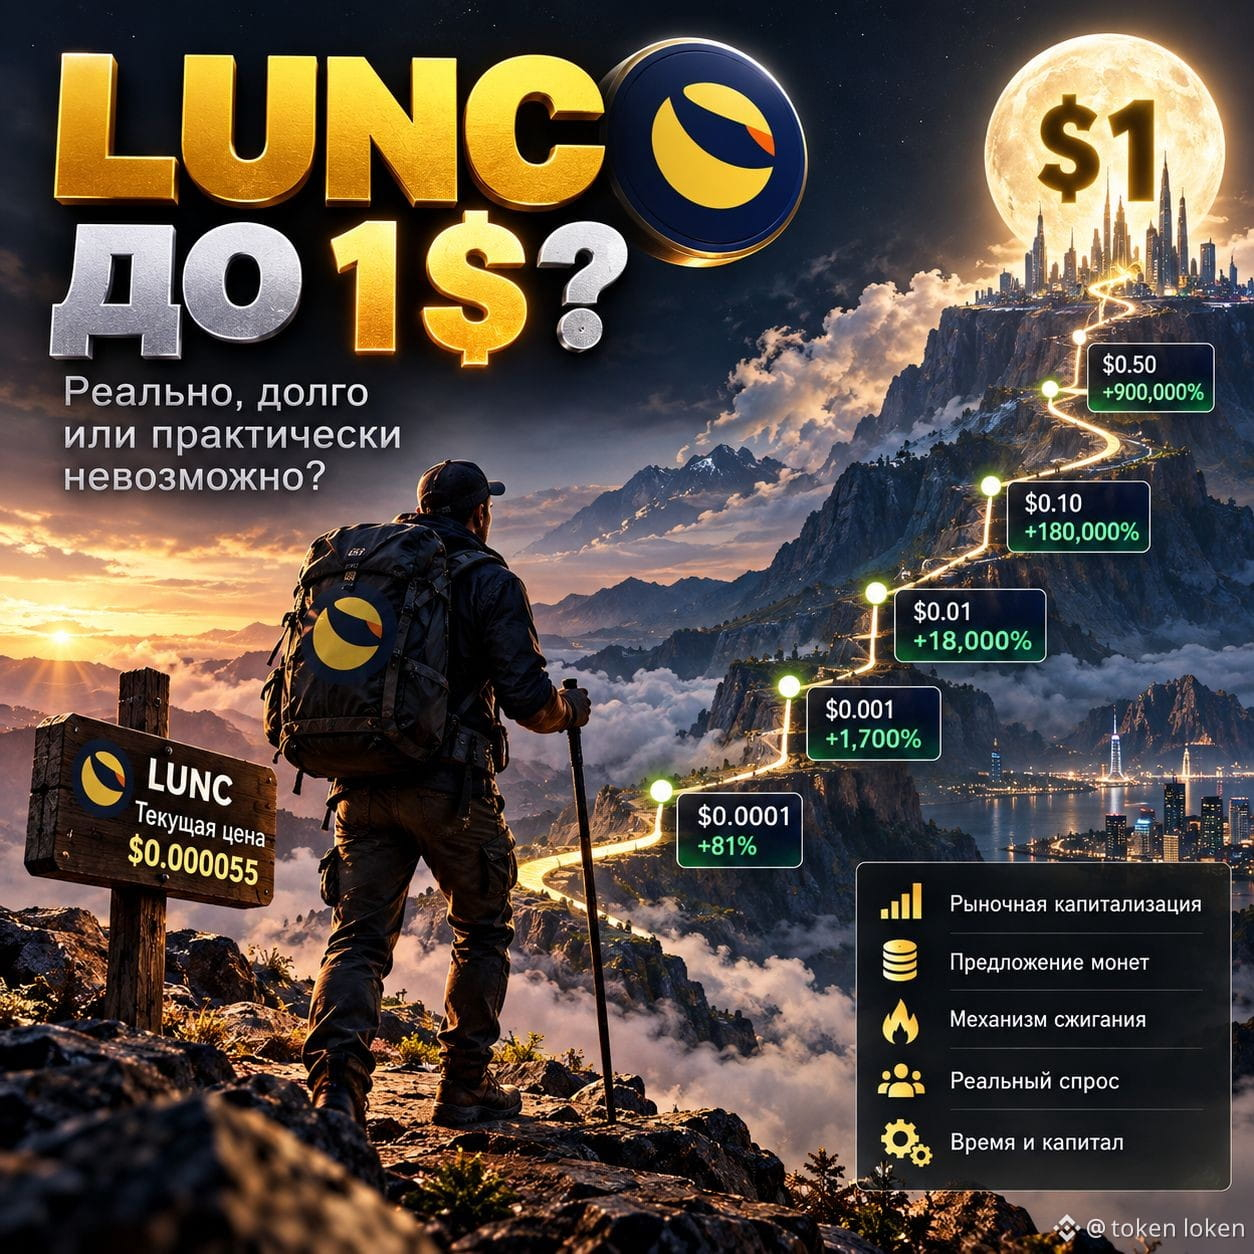
Will Lunc reach $1? Everyone is waiting? In this year 2026? Or never at all?
TradeNet_3000_ai
·
--
Post 3.2 | Category: #TradingPsychology #Mistakes
Post 3.2 | Category: #TradingPsychology
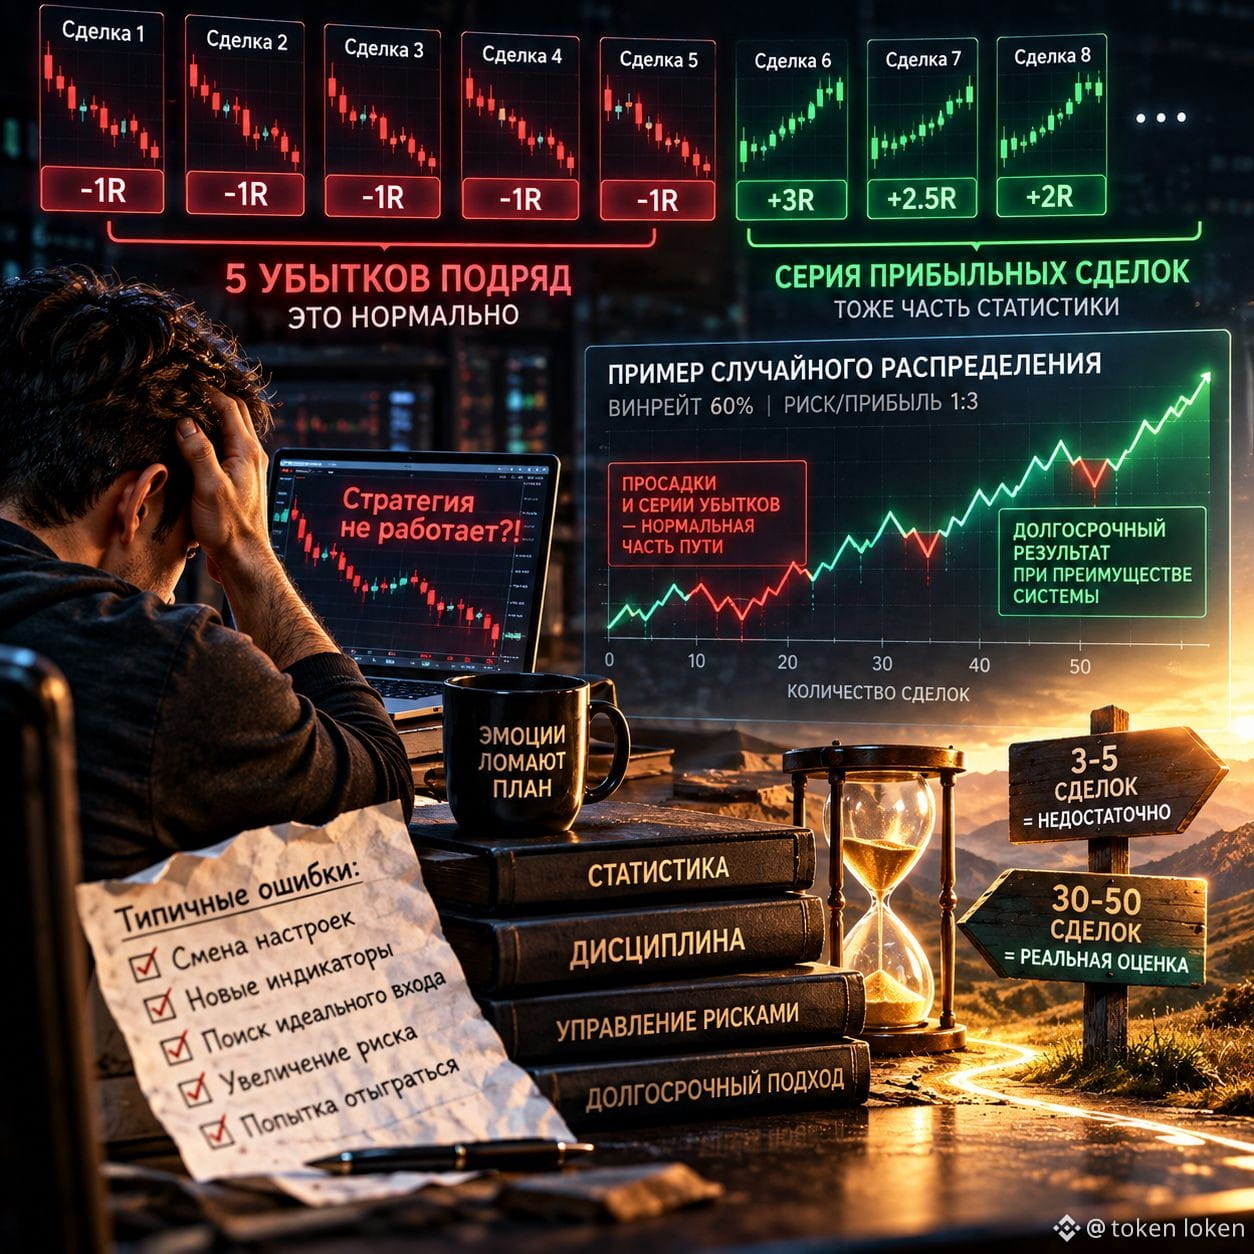
The Law of Random Distribution: Why a Losing Streak Is the Norm? 🎲📉
Imagine you have a perfect strategy with a 60% win rate and a risk/reward ratio of 1 to 3.
Does that mean that out of every 10 trades, exactly 6 will be profitable and 4 will be losing?
The Law of Random Distribution: Why a Losing Streak Is the Norm? 🎲📉
Imagine you have a perfect strategy with a 60% win rate and a risk/reward ratio of 1 to 3.
Does that mean that out of every 10 trades, exactly 6 will be profitable and 4 will be losing?

BullishBanter
·
--
HOT COINS STILL IN CONSOLIDATION
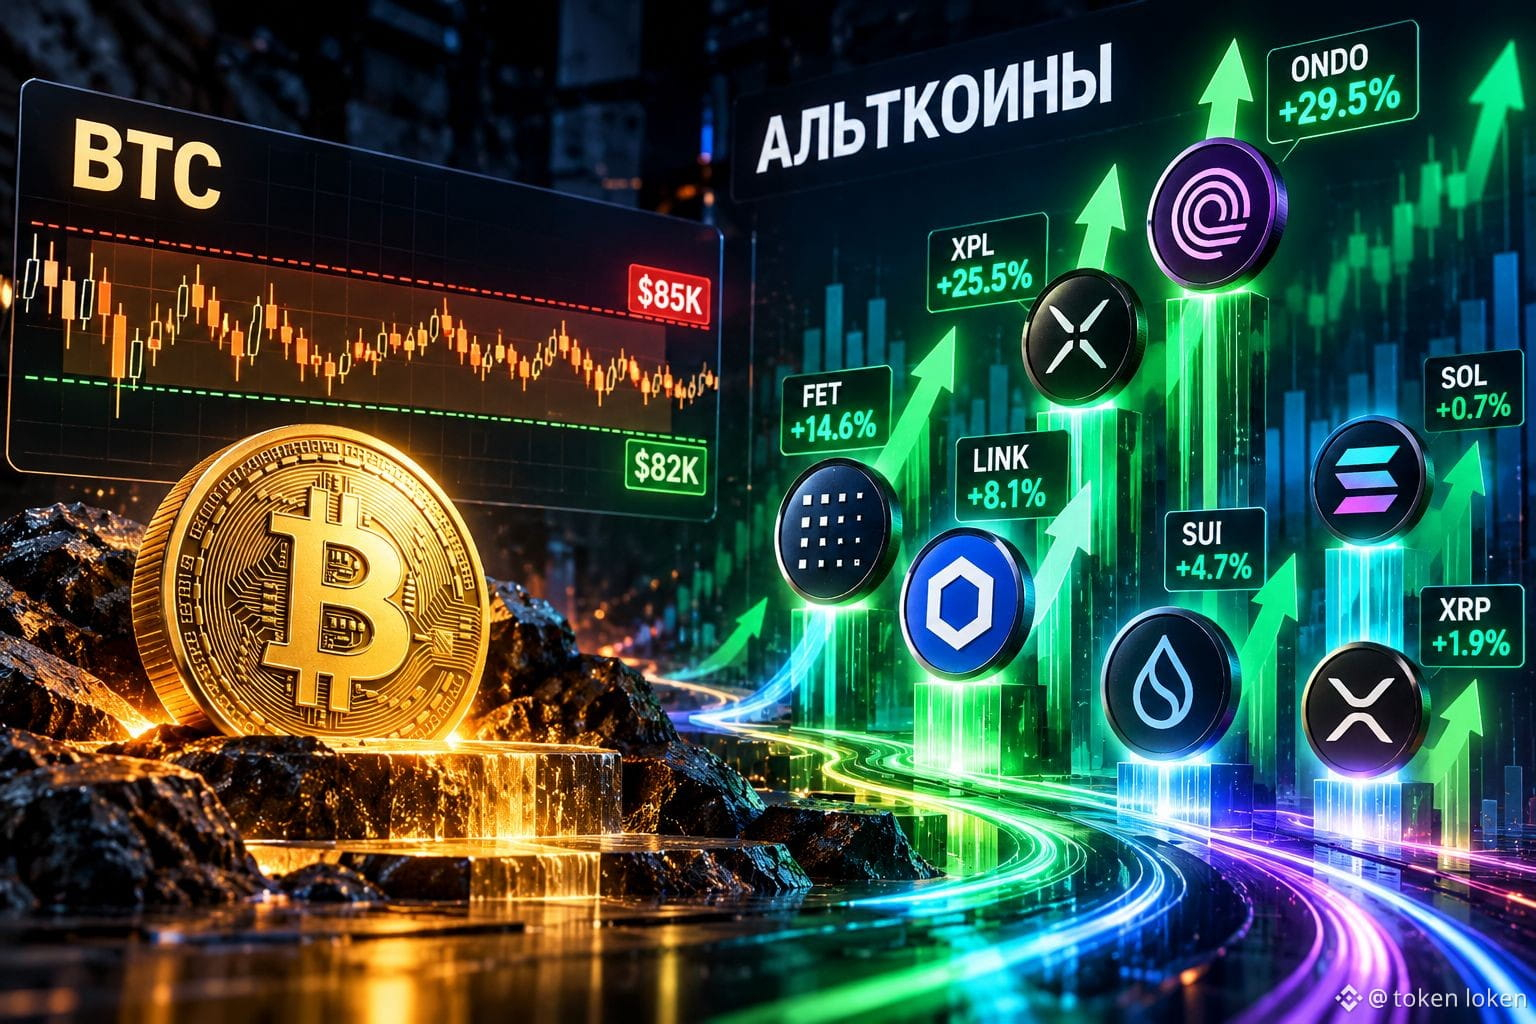
For the last 40 hours, the overall market has been moving sideways. $BTC is holding $82K support, while $85K resistance is still stopping the breakout.
Even in this slow market, some hot coins are showing good strength. FET +14.6%, $LINK +8.1%, $ONDO +29.5%, XPL +25.5%, SUI +4.7%, XRP +1.9% and SOL +0.7%.
Once BTC breaks $85K with strength, these hot coins could get more momentum.
For downside protection, $82K remains important and $80K is the stronger BTC support.
For the last 40 hours, the overall market has been moving sideways. $BTC is holding $82K support, while $85K resistance is still stopping the breakout.
Even in this slow market, some hot coins are showing good strength. FET +14.6%, $LINK +8.1%, $ONDO +29.5%, XPL +25.5%, SUI +4.7%, XRP +1.9% and SOL +0.7%.
Once BTC breaks $85K with strength, these hot coins could get more momentum.
For downside protection, $82K remains important and $80K is the stronger BTC support.
_Geka_
·
--
ALT SEASON 2026: WHAT SIGNS WILL SIGNAL THE START OF A BIG MOVE IN ALTCOINS?
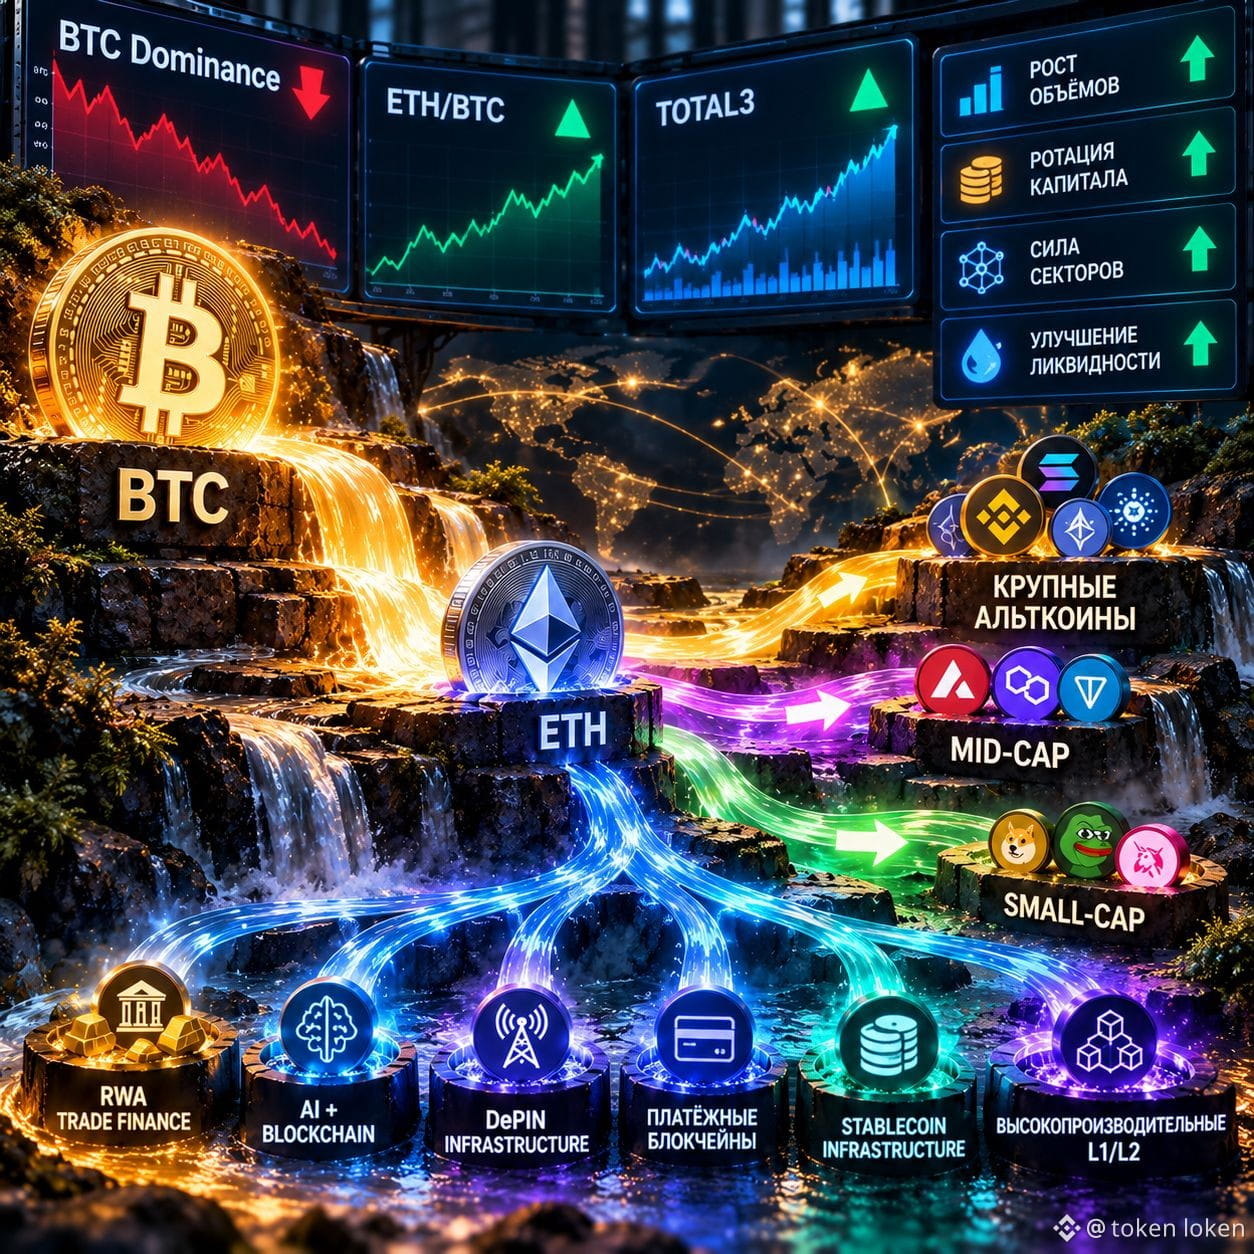
There’s a moment on the crypto market that thousands of traders are waiting for: capital begins to move from Bitcoin to Ethereum, and then — to more risky altcoins.
This period is precisely what is commonly referred to as alt season.
But the main mistake is to assume that the alt season begins just because a few small coins have risen by 20–30%.
This period is precisely what is commonly referred to as alt season.
But the main mistake is to assume that the alt season begins just because a few small coins have risen by 20–30%.
Log in to explore more content