
DigitalTrading2407
1.1k Posts

DigitalTrading2407
Report
Block User
Tổng hợp Bitcoin theo phiên Á Âu Mỹ #BTC $BTC
Open Trade
Occasional Trader
11.7 Months
7 Following
80 Followers
559 Liked
Posts
Portfolio
All
Quotes
Videos
🔥 BTC/USDT STRATEGY FOR THE U.S. SESSION (4H TIMEFRAME) 🔥
💵 Current price: $65,526.02
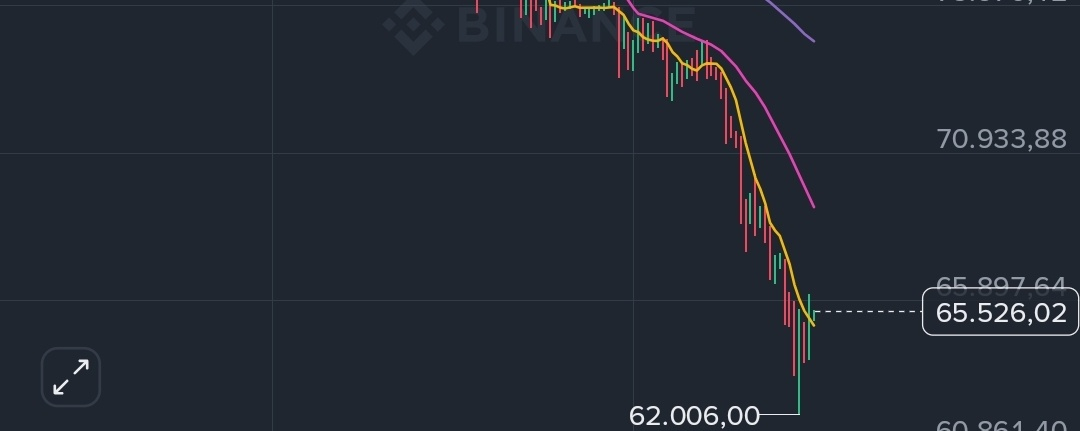
📉 Trend: Technical recovery after a sweep of the lows. On the 4H timeframe, after a deep pullback to the $62,006.00 low, the bulls pushed the price slightly above the MA(7) at $65,047.89. However, the overall structure remains weighed down below the major resistance bands: MA(25) at $69,094.60 and MA(99) at $74,763.06. The MACD indicator is showing a significant contraction in the red histogram (MACD at -93.00), signaling that selling pressure is temporarily easing as the market enters a consolidating recovery phase.
$BTC
🔥 BTC/USDT STRATEGY FOR THE U.S. SESSION (4H TIMEFRAME) 🔥
💵 Current price: $65,526.02
📉 Trend: Technical recovery after a sweep of the lows. On the 4H timeframe, after a deep pullback to the $62,006.00 low, the bulls pushed the price slightly above the MA(7) at $65,047.89. However, the overall structure remains weighed down below the major resistance bands: MA(25) at $69,094.60 and MA(99) at $74,763.06. The MACD indicator is showing a significant contraction in the red histogram (MACD at -93.00), signaling that selling pressure is temporarily easing as the market enters a consolidating recovery phase.
$BTC
💵 Current price: $65,526.02
📉 Trend: Technical recovery after a sweep of the lows. On the 4H timeframe, after a deep pullback to the $62,006.00 low, the bulls pushed the price slightly above the MA(7) at $65,047.89. However, the overall structure remains weighed down below the major resistance bands: MA(25) at $69,094.60 and MA(99) at $74,763.06. The MACD indicator is showing a significant contraction in the red histogram (MACD at -93.00), signaling that selling pressure is temporarily easing as the market enters a consolidating recovery phase.
$BTC
1.3k
Article
BTC trend remains bearish🔥 BTC/USDT STRATEGY — U.S. SESSION (4H TIME FRAME) 🔥
💵 Current price: $65.526,02
📉 Trend: Technical rebound after a sweep of the lows. On the 4H chart, after dropping to a deep low of $62.006,00, the bulls pushed the price slightly above the MA(7) at $65.047,89. However, the overall structure remains weighed down below the major resistance bands: MA(25) at $69.094,60 and MA(99) at $74.763,06. The MACD indicator is showing a significant contraction in the red histogram (MACD at -93,00), signaling that selling pressure is temporarily easing as the market enters a consolidative rebound.
BTC trend remains bearish
🔥 BTC/USDT STRATEGY — U.S. SESSION (4H TIME FRAME) 🔥
💵 Current price: $65.526,02
📉 Trend: Technical rebound after a sweep of the lows. On the 4H chart, after dropping to a deep low of $62.006,00, the bulls pushed the price slightly above the MA(7) at $65.047,89. However, the overall structure remains weighed down below the major resistance bands: MA(25) at $69.094,60 and MA(99) at $74.763,06. The MACD indicator is showing a significant contraction in the red histogram (MACD at -93,00), signaling that selling pressure is temporarily easing as the market enters a consolidative rebound.
💵 Current price: $65.526,02
📉 Trend: Technical rebound after a sweep of the lows. On the 4H chart, after dropping to a deep low of $62.006,00, the bulls pushed the price slightly above the MA(7) at $65.047,89. However, the overall structure remains weighed down below the major resistance bands: MA(25) at $69.094,60 and MA(99) at $74.763,06. The MACD indicator is showing a significant contraction in the red histogram (MACD at -93,00), signaling that selling pressure is temporarily easing as the market enters a consolidative rebound.
190
·
--
Bearish
See translation
🔥 CHIẾN LƯỢC BTC/USDT PHIÊN MỸ (KHUNG 4H) 🔥
💵 Giá hiện tại: $65.526,02
📉 Xu hướng: Hồi phục kỹ thuật sau cú quét đáy. Trên khung 4H, sau khi rũ bỏ về đáy sâu $62.006,00, phe Bò (Bullish) đã đẩy giá cắt lên nhẹ trên đường MA(7) ở mốc $65.047,89. Tuy nhiên, cấu trúc tổng thể vẫn bị đè nặng dưới các dải kháng cự lớn MA(25) ở $69.094,60 và MA(99) ở $74.763,06. Chỉ báo MACD đang thu ngắn đáng kể dải Histogram đỏ (MACD đạt -93,00), báo hiệu áp lực xả tạm thời hạ nhiệt để bước vào nhịp hồi tích lũy.
🔴 KỊCH BẢN BÁN (SHORT) - THUẬN XU HƯỚNG LỚN PHÍA TRÊN:
• Entry: $67.000 - $68.500 (Vùng kháng cự hợp lưu của đỉnh 24h $67.067,50 và đường cản MA25)
• Take Profit: $64.500 - Xa hơn là vùng $63.000
• Stop Loss: Trên $69.500
🟢 KỊCH BẢN MUA (LONG) - BẮT SÓNG HỒI TÍCH LŨY:
• Entry: $63.500 - $64.800 (Vùng kiểm tra lại nền giá tích lũy sau nhịp rút chân)
• Take Profit: Về lại mốc $66.800 - $68.000
• Stop Loss: Dưới $62.000
⚠️ Lưu ý: Volume giao dịch toàn thị trường duy trì ở mức cực kỳ sôi động (KL 24h đạt tới 2,70B USD) với biên độ dao động rộng từ $62.006 đến $67.067. Hạn chế tối đa việc fomo đuổi lệnh ở vùng giá lửng lơ hiện tại, hãy kiên nhẫn đợi giá kiểm tra các vùng biên Entry để tối ưu tỷ lệ R:R!
#Bitcoin #BTC #Crypto #Trading #USSession $BTC
{future}(BTCUSDT)
🔥 CHIẾN LƯỢC BTC/USDT PHIÊN MỸ (KHUNG 4H) 🔥
💵 Giá hiện tại: $65.526,02
📉 Xu hướng: Hồi phục kỹ thuật sau cú quét đáy. Trên khung 4H, sau khi rũ bỏ về đáy sâu $62.006,00, phe Bò (Bullish) đã đẩy giá cắt lên nhẹ trên đường MA(7) ở mốc $65.047,89. Tuy nhiên, cấu trúc tổng thể vẫn bị đè nặng dưới các dải kháng cự lớn MA(25) ở $69.094,60 và MA(99) ở $74.763,06. Chỉ báo MACD đang thu ngắn đáng kể dải Histogram đỏ (MACD đạt -93,00), báo hiệu áp lực xả tạm thời hạ nhiệt để bước vào nhịp hồi tích lũy.
🔴 KỊCH BẢN BÁN (SHORT) - THUẬN XU HƯỚNG LỚN PHÍA TRÊN:
• Entry: $67.000 - $68.500 (Vùng kháng cự hợp lưu của đỉnh 24h $67.067,50 và đường cản MA25)
• Take Profit: $64.500 - Xa hơn là vùng $63.000
• Stop Loss: Trên $69.500
🟢 KỊCH BẢN MUA (LONG) - BẮT SÓNG HỒI TÍCH LŨY:
• Entry: $63.500 - $64.800 (Vùng kiểm tra lại nền giá tích lũy sau nhịp rút chân)
• Take Profit: Về lại mốc $66.800 - $68.000
• Stop Loss: Dưới $62.000
⚠️ Lưu ý: Volume giao dịch toàn thị trường duy trì ở mức cực kỳ sôi động (KL 24h đạt tới 2,70B USD) với biên độ dao động rộng từ $62.006 đến $67.067. Hạn chế tối đa việc fomo đuổi lệnh ở vùng giá lửng lơ hiện tại, hãy kiên nhẫn đợi giá kiểm tra các vùng biên Entry để tối ưu tỷ lệ R:R!
#Bitcoin #BTC #Crypto #Trading #USSession $BTC
💵 Giá hiện tại: $65.526,02
📉 Xu hướng: Hồi phục kỹ thuật sau cú quét đáy. Trên khung 4H, sau khi rũ bỏ về đáy sâu $62.006,00, phe Bò (Bullish) đã đẩy giá cắt lên nhẹ trên đường MA(7) ở mốc $65.047,89. Tuy nhiên, cấu trúc tổng thể vẫn bị đè nặng dưới các dải kháng cự lớn MA(25) ở $69.094,60 và MA(99) ở $74.763,06. Chỉ báo MACD đang thu ngắn đáng kể dải Histogram đỏ (MACD đạt -93,00), báo hiệu áp lực xả tạm thời hạ nhiệt để bước vào nhịp hồi tích lũy.
🔴 KỊCH BẢN BÁN (SHORT) - THUẬN XU HƯỚNG LỚN PHÍA TRÊN:
• Entry: $67.000 - $68.500 (Vùng kháng cự hợp lưu của đỉnh 24h $67.067,50 và đường cản MA25)
• Take Profit: $64.500 - Xa hơn là vùng $63.000
• Stop Loss: Trên $69.500
🟢 KỊCH BẢN MUA (LONG) - BẮT SÓNG HỒI TÍCH LŨY:
• Entry: $63.500 - $64.800 (Vùng kiểm tra lại nền giá tích lũy sau nhịp rút chân)
• Take Profit: Về lại mốc $66.800 - $68.000
• Stop Loss: Dưới $62.000
⚠️ Lưu ý: Volume giao dịch toàn thị trường duy trì ở mức cực kỳ sôi động (KL 24h đạt tới 2,70B USD) với biên độ dao động rộng từ $62.006 đến $67.067. Hạn chế tối đa việc fomo đuổi lệnh ở vùng giá lửng lơ hiện tại, hãy kiên nhẫn đợi giá kiểm tra các vùng biên Entry để tối ưu tỷ lệ R:R!
#Bitcoin #BTC #Crypto #Trading #USSession $BTC
228
🔥 BTC/USDT ASIAN SESSION STRATEGY (4H TIMEFRAME) 🔥
💵 Current price: $62.576,42
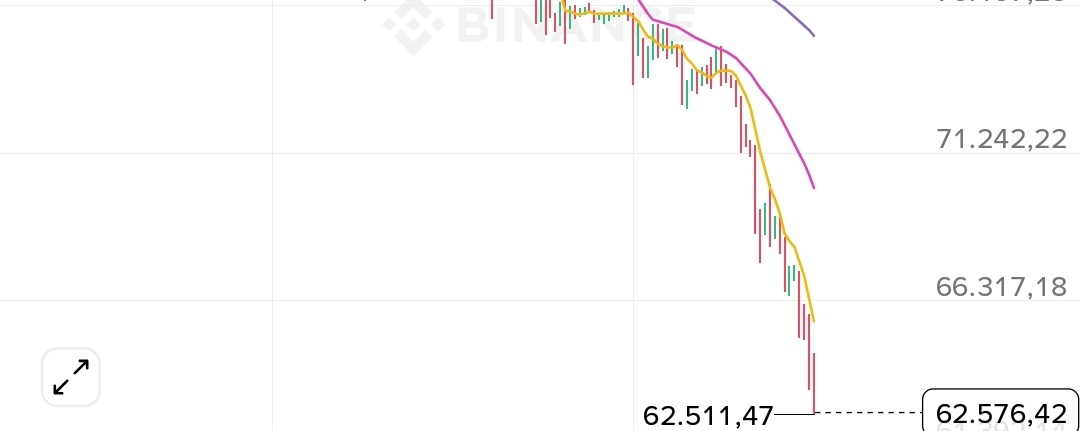
📉 Trend: Bears (Bearish) are selling off aggressively. On the 4H chart, the price just plunged vertically (-8,52%), breaking through all support levels to a new low of $62.511,47 and sitting far below the dynamic resistance cluster: MA(7) at $65.627,13, MA(25) at $70.083,10, and MA(99) at $75.166,46. The MACD is plunging steeply below the zero line (MACD at -505,97), with the red Histogram expanding to an extreme, confirming that panic selling pressure is completely dominating the market.
🔴 SHORT SCENARIO — IN THE DIRECTION OF THE PRIMARY TREND:
• Entry: $64.200 - $65.600 $BTC
🔥 BTC/USDT ASIAN SESSION STRATEGY (4H TIMEFRAME) 🔥
💵 Current price: $62.576,42
📉 Trend: Bears (Bearish) are selling off aggressively. On the 4H chart, the price just plunged vertically (-8,52%), breaking through all support levels to a new low of $62.511,47 and sitting far below the dynamic resistance cluster: MA(7) at $65.627,13, MA(25) at $70.083,10, and MA(99) at $75.166,46. The MACD is plunging steeply below the zero line (MACD at -505,97), with the red Histogram expanding to an extreme, confirming that panic selling pressure is completely dominating the market.
🔴 SHORT SCENARIO — IN THE DIRECTION OF THE PRIMARY TREND:
• Entry: $64.200 - $65.600 $BTC
💵 Current price: $62.576,42
📉 Trend: Bears (Bearish) are selling off aggressively. On the 4H chart, the price just plunged vertically (-8,52%), breaking through all support levels to a new low of $62.511,47 and sitting far below the dynamic resistance cluster: MA(7) at $65.627,13, MA(25) at $70.083,10, and MA(99) at $75.166,46. The MACD is plunging steeply below the zero line (MACD at -505,97), with the red Histogram expanding to an extreme, confirming that panic selling pressure is completely dominating the market.
🔴 SHORT SCENARIO — IN THE DIRECTION OF THE PRIMARY TREND:
• Entry: $64.200 - $65.600 $BTC
454
Article
BTC breaks support, plunges deep🔥 BTC/USDT ASIA SESSION STRATEGY (4H TIMEFRAME) 🔥
💵 Current price: $62,576.42
📉 Trend: Bears (Bearish) are selling off aggressively. On the 4H timeframe, the price just plunged vertically (-8.52%), breaking through all support levels to a new low of $62,511.47 and sitting far below the dynamic resistance cluster: MA(7) at $65,627.13, MA(25) at $70,083.10, and MA(99) at $75,166.46. The MACD is plunging deep below zero (MACD at -505.97), with the red Histogram expanding to an extreme, confirming that panic selling pressure has completely taken control of the market.
BTC breaks support, plunges deep
🔥 BTC/USDT ASIA SESSION STRATEGY (4H TIMEFRAME) 🔥
💵 Current price: $62,576.42
📉 Trend: Bears (Bearish) are selling off aggressively. On the 4H timeframe, the price just plunged vertically (-8.52%), breaking through all support levels to a new low of $62,511.47 and sitting far below the dynamic resistance cluster: MA(7) at $65,627.13, MA(25) at $70,083.10, and MA(99) at $75,166.46. The MACD is plunging deep below zero (MACD at -505.97), with the red Histogram expanding to an extreme, confirming that panic selling pressure has completely taken control of the market.
💵 Current price: $62,576.42
📉 Trend: Bears (Bearish) are selling off aggressively. On the 4H timeframe, the price just plunged vertically (-8.52%), breaking through all support levels to a new low of $62,511.47 and sitting far below the dynamic resistance cluster: MA(7) at $65,627.13, MA(25) at $70,083.10, and MA(99) at $75,166.46. The MACD is plunging deep below zero (MACD at -505.97), with the red Histogram expanding to an extreme, confirming that panic selling pressure has completely taken control of the market.
62
·
--
Bearish
🔥 BTC/USDT ASIAN SESSION STRATEGY (4H TIMEFRAME) 🔥
💵 Current price: $62.576,42
📉 Trend: Bears (Bearish) are selling off aggressively. On the 4H timeframe, price has just plunged vertically (-8,52%), breaking through all support levels to a new low of $62.511,47 and sitting far below the dynamic resistance cluster: MA(7) at $65.627,13, MA(25) at $70.083,10, and MA(99) at $75.166,46. The MACD is plunging steeply below the 0 level (MACD reached -505,97), with the red histogram expanding to an extreme, confirming that panic selling pressure has taken complete control of the market.
🔴 SHORT SCENARIO - FOLLOWING THE DOMINANT TREND:
• Entry: $64.200 - $65.600 (Technical rebound zone to retest the MA7 dynamic resistance)
• Take Profit: $62.511 (24h low) - Further down, the psychological support zone at $60.000
• Stop Loss: Above $66.300
🟢 LONG SCENARIO - CATCHING AN OVERSOLD BOUNCE (HIGH RISK):
• Entry: $60.500 - $62.000 (Only scale in with small buy orders if price sweeps deeply below the previous low and a clear candle with a long lower wick appears)
• Take Profit: Back to the $64.000 - $65.500 range
• Stop Loss: Below $59.800
⚠️ Note: Sell volume across the market is surging dramatically (24h volume has reached 2,33B USD), with a series of solid red 4H candles with long bodies. Absolutely do not try to catch a falling knife with a Long at the current price while the market has shown no signs of stabilizing or forming a base!
#Bitcoin #BTC #Crypto #Trading #AsianSession $BTC
{future}(BTCUSDT)
🔥 BTC/USDT ASIAN SESSION STRATEGY (4H TIMEFRAME) 🔥
💵 Current price: $62.576,42
📉 Trend: Bears (Bearish) are selling off aggressively. On the 4H timeframe, price has just plunged vertically (-8,52%), breaking through all support levels to a new low of $62.511,47 and sitting far below the dynamic resistance cluster: MA(7) at $65.627,13, MA(25) at $70.083,10, and MA(99) at $75.166,46. The MACD is plunging steeply below the 0 level (MACD reached -505,97), with the red histogram expanding to an extreme, confirming that panic selling pressure has taken complete control of the market.
🔴 SHORT SCENARIO - FOLLOWING THE DOMINANT TREND:
• Entry: $64.200 - $65.600 (Technical rebound zone to retest the MA7 dynamic resistance)
• Take Profit: $62.511 (24h low) - Further down, the psychological support zone at $60.000
• Stop Loss: Above $66.300
🟢 LONG SCENARIO - CATCHING AN OVERSOLD BOUNCE (HIGH RISK):
• Entry: $60.500 - $62.000 (Only scale in with small buy orders if price sweeps deeply below the previous low and a clear candle with a long lower wick appears)
• Take Profit: Back to the $64.000 - $65.500 range
• Stop Loss: Below $59.800
⚠️ Note: Sell volume across the market is surging dramatically (24h volume has reached 2,33B USD), with a series of solid red 4H candles with long bodies. Absolutely do not try to catch a falling knife with a Long at the current price while the market has shown no signs of stabilizing or forming a base!
#Bitcoin #BTC #Crypto #Trading #AsianSession $BTC
💵 Current price: $62.576,42
📉 Trend: Bears (Bearish) are selling off aggressively. On the 4H timeframe, price has just plunged vertically (-8,52%), breaking through all support levels to a new low of $62.511,47 and sitting far below the dynamic resistance cluster: MA(7) at $65.627,13, MA(25) at $70.083,10, and MA(99) at $75.166,46. The MACD is plunging steeply below the 0 level (MACD reached -505,97), with the red histogram expanding to an extreme, confirming that panic selling pressure has taken complete control of the market.
🔴 SHORT SCENARIO - FOLLOWING THE DOMINANT TREND:
• Entry: $64.200 - $65.600 (Technical rebound zone to retest the MA7 dynamic resistance)
• Take Profit: $62.511 (24h low) - Further down, the psychological support zone at $60.000
• Stop Loss: Above $66.300
🟢 LONG SCENARIO - CATCHING AN OVERSOLD BOUNCE (HIGH RISK):
• Entry: $60.500 - $62.000 (Only scale in with small buy orders if price sweeps deeply below the previous low and a clear candle with a long lower wick appears)
• Take Profit: Back to the $64.000 - $65.500 range
• Stop Loss: Below $59.800
⚠️ Note: Sell volume across the market is surging dramatically (24h volume has reached 2,33B USD), with a series of solid red 4H candles with long bodies. Absolutely do not try to catch a falling knife with a Long at the current price while the market has shown no signs of stabilizing or forming a base!
#Bitcoin #BTC #Crypto #Trading #AsianSession $BTC
363
🚨 BTC/USDT ASIAN SESSION UPDATE: BREAKS BELOW $67,568 LOW, PLUNGES TO $66,915 - BEARISH MOMENTUM SHOWS SIGNS OF STALLING
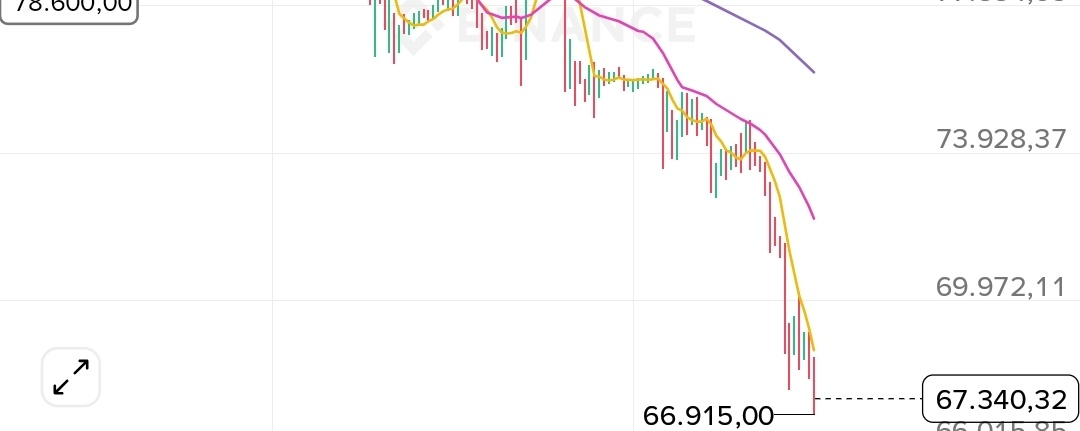
After an unsuccessful technical rebound to $70,479, Bitcoin continued to face selling pressure from the U.S. session into the start of the Asian session, breaking below the previous low to set a new low at $66,915 before bouncing back to around $67,340.
🔍 ASIAN SESSION TECHNICAL DATA (4H CHART):
• Current price: ~$67,340.32 (Down -4.40% over the past 24 hours and down -1.98% since the start of the day).
• Breakdown & Elevated trading volume: The 24-hour range spans from a high of $70,479.98 to a new low of $66,915.00. $BTC
🚨 BTC/USDT ASIAN SESSION UPDATE: BREAKS BELOW $67,568 LOW, PLUNGES TO $66,915 - BEARISH MOMENTUM SHOWS SIGNS OF STALLING
After an unsuccessful technical rebound to $70,479, Bitcoin continued to face selling pressure from the U.S. session into the start of the Asian session, breaking below the previous low to set a new low at $66,915 before bouncing back to around $67,340.
🔍 ASIAN SESSION TECHNICAL DATA (4H CHART):
• Current price: ~$67,340.32 (Down -4.40% over the past 24 hours and down -1.98% since the start of the day).
• Breakdown & Elevated trading volume: The 24-hour range spans from a high of $70,479.98 to a new low of $66,915.00. $BTC
After an unsuccessful technical rebound to $70,479, Bitcoin continued to face selling pressure from the U.S. session into the start of the Asian session, breaking below the previous low to set a new low at $66,915 before bouncing back to around $67,340.
🔍 ASIAN SESSION TECHNICAL DATA (4H CHART):
• Current price: ~$67,340.32 (Down -4.40% over the past 24 hours and down -1.98% since the start of the day).
• Breakdown & Elevated trading volume: The 24-hour range spans from a high of $70,479.98 to a new low of $66,915.00. $BTC
522
Article
BTC plunges across Asian, European, and US sessions🚨 BTC/USDT ASIAN SESSION UPDATE: BREAKS BELOW 67,568 USD LOW, PLUNGES TO 66,915 USD - BEARISH MOMENTUM SHOWS SIGNS OF STALLING
After a failed technical rebound that reached 70,479 USD, Bitcoin continued to face selling pressure from the US session into the start of the Asian session, breaking below the previous low to set a new low at 66,915 USD before recovering to around 67,340 USD.
🔍 ASIAN SESSION TECHNICAL INDICATORS (4H CHART):
• Current price: ~67,340.32 USD (down 4.40% over the past 24 hours and down 1.98% since the start of the day).
BTC plunges across Asian, European, and US sessions
🚨 BTC/USDT ASIAN SESSION UPDATE: BREAKS BELOW 67,568 USD LOW, PLUNGES TO 66,915 USD - BEARISH MOMENTUM SHOWS SIGNS OF STALLING
After a failed technical rebound that reached 70,479 USD, Bitcoin continued to face selling pressure from the US session into the start of the Asian session, breaking below the previous low to set a new low at 66,915 USD before recovering to around 67,340 USD.
🔍 ASIAN SESSION TECHNICAL INDICATORS (4H CHART):
• Current price: ~67,340.32 USD (down 4.40% over the past 24 hours and down 1.98% since the start of the day).
After a failed technical rebound that reached 70,479 USD, Bitcoin continued to face selling pressure from the US session into the start of the Asian session, breaking below the previous low to set a new low at 66,915 USD before recovering to around 67,340 USD.
🔍 ASIAN SESSION TECHNICAL INDICATORS (4H CHART):
• Current price: ~67,340.32 USD (down 4.40% over the past 24 hours and down 1.98% since the start of the day).
61
🚨 BTC/USDT ASIAN SESSION UPDATE: BREAKS BELOW 67,568 USD, PLUNGES TO 66,915 USD - SELLING MOMENTUM SHOWS SIGNS OF EASING
After an unsuccessful technical rebound to 70,479 USD, Bitcoin continued to face selling pressure from the US session into the start of the Asian session, breaking below the previous low to set a new low at 66,915 USD before recovering to around 67,340 USD.
🔍 ASIAN SESSION TECHNICAL METRICS (4H CHART):
• Current price: ~67,340.32 USD (Down -4.40% over the past 24 hours and down -1.98% since the start of the new day).
• Breakdown and sustained high liquidity: The 24-hour range spanned from a high of 70,479.98 USD to a new low of 66,915.00 USD. 24-hour trading volume remains very high at 2.05 billion USDT (29,755 BTC), indicating that dip buyers are still strongly absorbing sell orders at lower price levels.
• MA system: Price remains below MA(7) = 68,641.67 USD and well below MA(25) = 72,173.76 USD. However, the gap between the price and MA(7) is starting to narrow compared with the previous sell-off.
• A small bright spot from MACD: Although the DIF (-1,788.96) and DEA (-1,408.55) lines remain deep below the zero line, the red Histogram bar has narrowed from -476.49 (previous session) to -380.41. This is an early sign that extreme selling momentum may be slowing.
⚠️ STRATEGIC PRICE ZONES & MARKET SENTIMENT:
• Market cost basis: Still anchored at 78,600 USD (more than 11,200 USD above the current price), indicating that the psychological pressure of holding unrealized losses continues to weigh heavily on medium-term buyers.
• New support and resistance: The newly established low of 66,915 USD is the nearest line of defense. Above, MA(7) at 68,641 USD and the psychological 70,000 USD level are acting as short-term resistance.
$BTC
{future}(BTCUSDT)
🚨 BTC/USDT ASIAN SESSION UPDATE: BREAKS BELOW 67,568 USD, PLUNGES TO 66,915 USD - SELLING MOMENTUM SHOWS SIGNS OF EASING
After an unsuccessful technical rebound to 70,479 USD, Bitcoin continued to face selling pressure from the US session into the start of the Asian session, breaking below the previous low to set a new low at 66,915 USD before recovering to around 67,340 USD.
🔍 ASIAN SESSION TECHNICAL METRICS (4H CHART):
• Current price: ~67,340.32 USD (Down -4.40% over the past 24 hours and down -1.98% since the start of the new day).
• Breakdown and sustained high liquidity: The 24-hour range spanned from a high of 70,479.98 USD to a new low of 66,915.00 USD. 24-hour trading volume remains very high at 2.05 billion USDT (29,755 BTC), indicating that dip buyers are still strongly absorbing sell orders at lower price levels.
• MA system: Price remains below MA(7) = 68,641.67 USD and well below MA(25) = 72,173.76 USD. However, the gap between the price and MA(7) is starting to narrow compared with the previous sell-off.
• A small bright spot from MACD: Although the DIF (-1,788.96) and DEA (-1,408.55) lines remain deep below the zero line, the red Histogram bar has narrowed from -476.49 (previous session) to -380.41. This is an early sign that extreme selling momentum may be slowing.
⚠️ STRATEGIC PRICE ZONES & MARKET SENTIMENT:
• Market cost basis: Still anchored at 78,600 USD (more than 11,200 USD above the current price), indicating that the psychological pressure of holding unrealized losses continues to weigh heavily on medium-term buyers.
• New support and resistance: The newly established low of 66,915 USD is the nearest line of defense. Above, MA(7) at 68,641 USD and the psychological 70,000 USD level are acting as short-term resistance.
$BTC
After an unsuccessful technical rebound to 70,479 USD, Bitcoin continued to face selling pressure from the US session into the start of the Asian session, breaking below the previous low to set a new low at 66,915 USD before recovering to around 67,340 USD.
🔍 ASIAN SESSION TECHNICAL METRICS (4H CHART):
• Current price: ~67,340.32 USD (Down -4.40% over the past 24 hours and down -1.98% since the start of the new day).
• Breakdown and sustained high liquidity: The 24-hour range spanned from a high of 70,479.98 USD to a new low of 66,915.00 USD. 24-hour trading volume remains very high at 2.05 billion USDT (29,755 BTC), indicating that dip buyers are still strongly absorbing sell orders at lower price levels.
• MA system: Price remains below MA(7) = 68,641.67 USD and well below MA(25) = 72,173.76 USD. However, the gap between the price and MA(7) is starting to narrow compared with the previous sell-off.
• A small bright spot from MACD: Although the DIF (-1,788.96) and DEA (-1,408.55) lines remain deep below the zero line, the red Histogram bar has narrowed from -476.49 (previous session) to -380.41. This is an early sign that extreme selling momentum may be slowing.
⚠️ STRATEGIC PRICE ZONES & MARKET SENTIMENT:
• Market cost basis: Still anchored at 78,600 USD (more than 11,200 USD above the current price), indicating that the psychological pressure of holding unrealized losses continues to weigh heavily on medium-term buyers.
• New support and resistance: The newly established low of 66,915 USD is the nearest line of defense. Above, MA(7) at 68,641 USD and the psychological 70,000 USD level are acting as short-term resistance.
$BTC
96
🚨 BTC/USDT EUROPEAN SESSION UPDATE: SHARP DROP TO 67,568 USD - LIQUIDATIONS SURGE TO 2.03 BILLION USDT
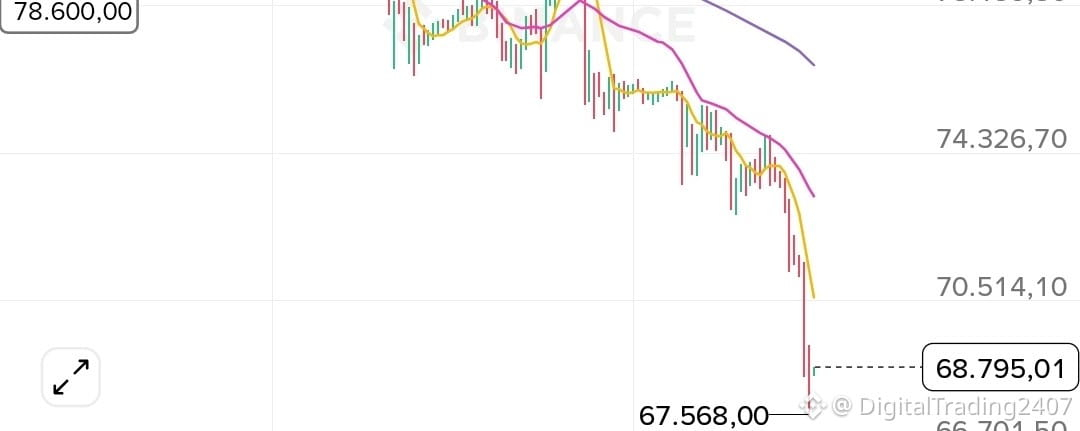
Selling pressure continued to spread from the Asian session into the start of the European session. Bitcoin failed to hold the 69,900 USD level and was dumped straight down to a new low of 67,568 USD before making a slight rebound to around 68,795 USD.
🔍 EUROPEAN SESSION TECHNICAL DATA (4H TIMEFRAME):
• Current price: ~68,795.01 USD (Down sharply -6.57% over the past 24 hours and down -4.12% since the start of the new day).
• Volume surge & low sweep: The 24-hour high was 73,634.44 USD, while the low was swept all the way down to 67,568.00 USD. $BTC
🚨 BTC/USDT EUROPEAN SESSION UPDATE: SHARP DROP TO 67,568 USD - LIQUIDATIONS SURGE TO 2.03 BILLION USDT
Selling pressure continued to spread from the Asian session into the start of the European session. Bitcoin failed to hold the 69,900 USD level and was dumped straight down to a new low of 67,568 USD before making a slight rebound to around 68,795 USD.
🔍 EUROPEAN SESSION TECHNICAL DATA (4H TIMEFRAME):
• Current price: ~68,795.01 USD (Down sharply -6.57% over the past 24 hours and down -4.12% since the start of the new day).
• Volume surge & low sweep: The 24-hour high was 73,634.44 USD, while the low was swept all the way down to 67,568.00 USD. $BTC
Selling pressure continued to spread from the Asian session into the start of the European session. Bitcoin failed to hold the 69,900 USD level and was dumped straight down to a new low of 67,568 USD before making a slight rebound to around 68,795 USD.
🔍 EUROPEAN SESSION TECHNICAL DATA (4H TIMEFRAME):
• Current price: ~68,795.01 USD (Down sharply -6.57% over the past 24 hours and down -4.12% since the start of the new day).
• Volume surge & low sweep: The 24-hour high was 73,634.44 USD, while the low was swept all the way down to 67,568.00 USD. $BTC
321
Article
BTC Plunges Too Deep in the European Session🚨 BTC/USDT EUROPEAN SESSION UPDATE: PLUNGES TO 67,568 USD - LIQUIDATIONS EXPLODE, HITTING 2.03 BILLION USDT
Selling pressure continued to spread from the Asian session into the early European session. Bitcoin failed to hold the 69,900 USD level and was dumped straight down to a new low of 67,568 USD before a slight rebound brought it back to around 68,795 USD.
🔍 EUROPEAN SESSION TECHNICAL INDICATORS (4H CHART):
• Current price: ~68,795.01 USD (down sharply -6.57% over the past 24 hours and -4.12% since the start of the day).
BTC Plunges Too Deep in the European Session
🚨 BTC/USDT EUROPEAN SESSION UPDATE: PLUNGES TO 67,568 USD - LIQUIDATIONS EXPLODE, HITTING 2.03 BILLION USDT
Selling pressure continued to spread from the Asian session into the early European session. Bitcoin failed to hold the 69,900 USD level and was dumped straight down to a new low of 67,568 USD before a slight rebound brought it back to around 68,795 USD.
🔍 EUROPEAN SESSION TECHNICAL INDICATORS (4H CHART):
• Current price: ~68,795.01 USD (down sharply -6.57% over the past 24 hours and -4.12% since the start of the day).
Selling pressure continued to spread from the Asian session into the early European session. Bitcoin failed to hold the 69,900 USD level and was dumped straight down to a new low of 67,568 USD before a slight rebound brought it back to around 68,795 USD.
🔍 EUROPEAN SESSION TECHNICAL INDICATORS (4H CHART):
• Current price: ~68,795.01 USD (down sharply -6.57% over the past 24 hours and -4.12% since the start of the day).
30
·
--
Bearish
🚨 BTC/USDT EUROPEAN SESSION UPDATE: PLUNGES TO 67,568 USD - LIQUIDATION VOLUME SOARS TO 2.03 BILLION USDT
Sell-off pressure continued to spread from the Asian session into the start of the European session. Bitcoin failed to hold the 69,900 USD level and was sold off straight down to a new low of 67,568 USD before making a slight rebound to around 68,795 USD.
🔍 EUROPEAN SESSION TECHNICAL INDICATORS (4H CHART):
• Current price: ~68,795.01 USD (down sharply by 6.57% over the past 24 hours and down 4.12% since the start of the day).
• Volume surge & low sweep: The 24-hour high was 73,634.44 USD, while the low was swept down to 67,568.00 USD. 24-hour trading volume surged to a record 2.03 billion USDT (28,804 BTC), confirming a large-scale leveraged liquidation event, accompanied by dip-buying demand entering below 68,000 USD.
• Moving average system: Price continued to plunge, moving far below MA(7) = 70,595.46 USD and MA(25) = 73,214.33 USD. The widening slopes of the short-term moving averages indicate that the downtrend is at an extreme level.
• MACD indicator: The DIF (-1,507.70) and DEA (-1,031.21) lines plunged to record lows below the zero line, with the red Histogram bars widening (-476.49). Downward momentum remains firmly dominant, with no reversal divergence signal yet.
⚠️ STRATEGIC PRICE ZONES & MARKET SENTIMENT:
• Market cost basis: Still anchored at 78,600 USD (nearly 10,000 USD above the current price), reflecting the heavy losses suffered by most medium-term long positions.
• New support & resistance: The newly established low of 67,568 USD is the nearest line of defense. Above, the psychological 70,000 USD level and the MA(7) at 70,595 USD are acting as strong resistance to any recovery.
$BTC
{future}(BTCUSDT)
🚨 BTC/USDT EUROPEAN SESSION UPDATE: PLUNGES TO 67,568 USD - LIQUIDATION VOLUME SOARS TO 2.03 BILLION USDT
Sell-off pressure continued to spread from the Asian session into the start of the European session. Bitcoin failed to hold the 69,900 USD level and was sold off straight down to a new low of 67,568 USD before making a slight rebound to around 68,795 USD.
🔍 EUROPEAN SESSION TECHNICAL INDICATORS (4H CHART):
• Current price: ~68,795.01 USD (down sharply by 6.57% over the past 24 hours and down 4.12% since the start of the day).
• Volume surge & low sweep: The 24-hour high was 73,634.44 USD, while the low was swept down to 67,568.00 USD. 24-hour trading volume surged to a record 2.03 billion USDT (28,804 BTC), confirming a large-scale leveraged liquidation event, accompanied by dip-buying demand entering below 68,000 USD.
• Moving average system: Price continued to plunge, moving far below MA(7) = 70,595.46 USD and MA(25) = 73,214.33 USD. The widening slopes of the short-term moving averages indicate that the downtrend is at an extreme level.
• MACD indicator: The DIF (-1,507.70) and DEA (-1,031.21) lines plunged to record lows below the zero line, with the red Histogram bars widening (-476.49). Downward momentum remains firmly dominant, with no reversal divergence signal yet.
⚠️ STRATEGIC PRICE ZONES & MARKET SENTIMENT:
• Market cost basis: Still anchored at 78,600 USD (nearly 10,000 USD above the current price), reflecting the heavy losses suffered by most medium-term long positions.
• New support & resistance: The newly established low of 67,568 USD is the nearest line of defense. Above, the psychological 70,000 USD level and the MA(7) at 70,595 USD are acting as strong resistance to any recovery.
$BTC
Sell-off pressure continued to spread from the Asian session into the start of the European session. Bitcoin failed to hold the 69,900 USD level and was sold off straight down to a new low of 67,568 USD before making a slight rebound to around 68,795 USD.
🔍 EUROPEAN SESSION TECHNICAL INDICATORS (4H CHART):
• Current price: ~68,795.01 USD (down sharply by 6.57% over the past 24 hours and down 4.12% since the start of the day).
• Volume surge & low sweep: The 24-hour high was 73,634.44 USD, while the low was swept down to 67,568.00 USD. 24-hour trading volume surged to a record 2.03 billion USDT (28,804 BTC), confirming a large-scale leveraged liquidation event, accompanied by dip-buying demand entering below 68,000 USD.
• Moving average system: Price continued to plunge, moving far below MA(7) = 70,595.46 USD and MA(25) = 73,214.33 USD. The widening slopes of the short-term moving averages indicate that the downtrend is at an extreme level.
• MACD indicator: The DIF (-1,507.70) and DEA (-1,031.21) lines plunged to record lows below the zero line, with the red Histogram bars widening (-476.49). Downward momentum remains firmly dominant, with no reversal divergence signal yet.
⚠️ STRATEGIC PRICE ZONES & MARKET SENTIMENT:
• Market cost basis: Still anchored at 78,600 USD (nearly 10,000 USD above the current price), reflecting the heavy losses suffered by most medium-term long positions.
• New support & resistance: The newly established low of 67,568 USD is the nearest line of defense. Above, the psychological 70,000 USD level and the MA(7) at 70,595 USD are acting as strong resistance to any recovery.
$BTC
325
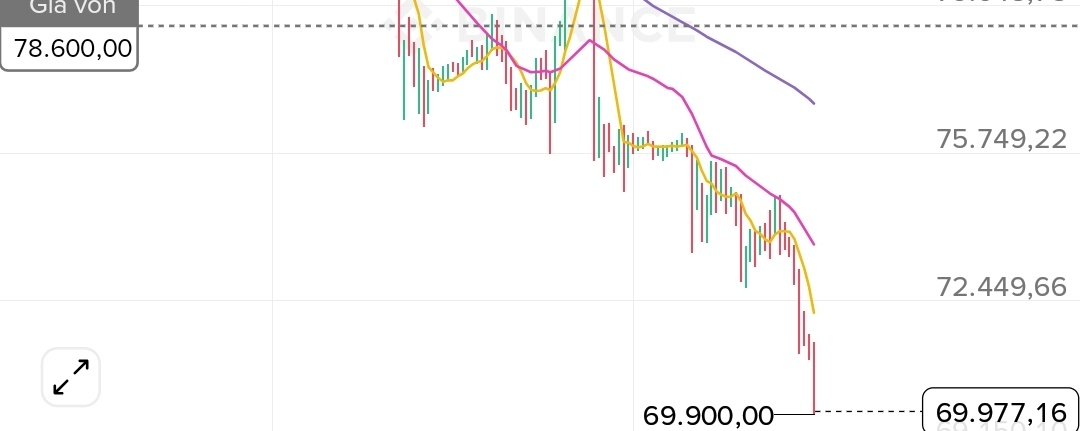
🚨 BTC/USDT ASIA SESSION UPDATE: SHARP CRASH BELOW THE PSYCHOLOGICAL $70,000 LEVEL — WIDESPREAD SELL-OFF
The scenario of breaking below the critical $72,727 low during the US session has officially triggered a wave of cascading liquidations. Bitcoin entered the Asia session with a long-bodied red candle, breached the psychological support level of $70,000, and hit a new low of $69,900.
🔍 ASIA SESSION TECHNICAL DATA (4H CHART):
• Current price: ~$69,977.16 (down 5.25% over the past 24 hours, with a further 2.52% drop right at the start of the new day).
• Selling pressure & new low: The 24-hour high of $73,884.01 was met with a sharp sell-off, pushing the price down to a new low of $69,900.00.$BTC
🚨 BTC/USDT ASIA SESSION UPDATE: SHARP CRASH BELOW THE PSYCHOLOGICAL $70,000 LEVEL — WIDESPREAD SELL-OFF
The scenario of breaking below the critical $72,727 low during the US session has officially triggered a wave of cascading liquidations. Bitcoin entered the Asia session with a long-bodied red candle, breached the psychological support level of $70,000, and hit a new low of $69,900.
🔍 ASIA SESSION TECHNICAL DATA (4H CHART):
• Current price: ~$69,977.16 (down 5.25% over the past 24 hours, with a further 2.52% drop right at the start of the new day).
• Selling pressure & new low: The 24-hour high of $73,884.01 was met with a sharp sell-off, pushing the price down to a new low of $69,900.00.$BTC
The scenario of breaking below the critical $72,727 low during the US session has officially triggered a wave of cascading liquidations. Bitcoin entered the Asia session with a long-bodied red candle, breached the psychological support level of $70,000, and hit a new low of $69,900.
🔍 ASIA SESSION TECHNICAL DATA (4H CHART):
• Current price: ~$69,977.16 (down 5.25% over the past 24 hours, with a further 2.52% drop right at the start of the new day).
• Selling pressure & new low: The 24-hour high of $73,884.01 was met with a sharp sell-off, pushing the price down to a new low of $69,900.00.$BTC
106
Article
BTC plunges sharply🚨 BTC/USDT ASIAN SESSION UPDATE: SHARP CRASH BREAKS THE PSYCHOLOGICAL $70,000 LEVEL — WIDESPREAD SELL-OFF
The scenario of breaking below the critical $72,727 low during the U.S. session has officially triggered a wave of cascading liquidations. Bitcoin entered the Asian session with a long-bodied red candle, breaking through the psychological $70,000 support level and hitting a new low of $69,900.
🔍 ASIAN SESSION TECHNICAL INDICATORS (4H CHART):
• Current price: ~69,977.16 USD (down 5.25% over the past 24 hours and falling another 2.52% at the start of the new day).
BTC plunges sharply
🚨 BTC/USDT ASIAN SESSION UPDATE: SHARP CRASH BREAKS THE PSYCHOLOGICAL $70,000 LEVEL — WIDESPREAD SELL-OFF
The scenario of breaking below the critical $72,727 low during the U.S. session has officially triggered a wave of cascading liquidations. Bitcoin entered the Asian session with a long-bodied red candle, breaking through the psychological $70,000 support level and hitting a new low of $69,900.
🔍 ASIAN SESSION TECHNICAL INDICATORS (4H CHART):
• Current price: ~69,977.16 USD (down 5.25% over the past 24 hours and falling another 2.52% at the start of the new day).
The scenario of breaking below the critical $72,727 low during the U.S. session has officially triggered a wave of cascading liquidations. Bitcoin entered the Asian session with a long-bodied red candle, breaking through the psychological $70,000 support level and hitting a new low of $69,900.
🔍 ASIAN SESSION TECHNICAL INDICATORS (4H CHART):
• Current price: ~69,977.16 USD (down 5.25% over the past 24 hours and falling another 2.52% at the start of the new day).
53
·
--
Bearish
🚨 BTC/USDT ASIAN SESSION UPDATE: SHARP CRASH BELOW THE PSYCHOLOGICAL $70,000 LEVEL – WIDESPREAD SELL-OFF
The scenario of breaking below the critical $72,727 low during the U.S. session has officially triggered a wave of cascading liquidations. Bitcoin entered the Asian session with a long-bodied red candle, breaking through the psychological support level of $70,000 and hitting a new low of $69,900.
🔍 ASIAN SESSION TECHNICAL INDICATORS (4H CHART):
• Current price: ~$69,977.16 (down -5.25% over the past 24 hours and falling another -2.52% at the start of the new day).
• Selling pressure & new low: The 24-hour high of $73,884.01 was followed by a sharp sell-off to a low of $69,900.00. 24-hour trading volume surged to 1.33 billion USDT (the latest 4H candle alone recorded volume of up to 326 million USDT), confirming panic selling and the liquidation of long positions.
• Moving average system: The price has plunged, falling well below both MA(7) = $72,179.92 and MA(25) = $73,708.16. Short-term moving averages are plunging steeply, creating extreme downward pressure.
• MACD plunges: The DIF line (-1,073.54) and DEA (-781.41) have sunk deep below the zero line, with the red Histogram bar expanding to a record level (-292.13). Downward momentum is at an extreme oversold level, with no bottoming signal yet.
⚠️ STRATEGIC PRICE ZONES & MARKET SENTIMENT:
• Market cost basis: Still anchored high at $78,600 (now more than $8,600 above the market price), leaving most short-term long positions deeply in the red.
• New support & resistance: The $69,900–$70,000 range is now the final psychological boundary. Above it, the $72,180 area (MA7) has turned into firm resistance.
$BTC
{future}(BTCUSDT)
🚨 BTC/USDT ASIAN SESSION UPDATE: SHARP CRASH BELOW THE PSYCHOLOGICAL $70,000 LEVEL – WIDESPREAD SELL-OFF
The scenario of breaking below the critical $72,727 low during the U.S. session has officially triggered a wave of cascading liquidations. Bitcoin entered the Asian session with a long-bodied red candle, breaking through the psychological support level of $70,000 and hitting a new low of $69,900.
🔍 ASIAN SESSION TECHNICAL INDICATORS (4H CHART):
• Current price: ~$69,977.16 (down -5.25% over the past 24 hours and falling another -2.52% at the start of the new day).
• Selling pressure & new low: The 24-hour high of $73,884.01 was followed by a sharp sell-off to a low of $69,900.00. 24-hour trading volume surged to 1.33 billion USDT (the latest 4H candle alone recorded volume of up to 326 million USDT), confirming panic selling and the liquidation of long positions.
• Moving average system: The price has plunged, falling well below both MA(7) = $72,179.92 and MA(25) = $73,708.16. Short-term moving averages are plunging steeply, creating extreme downward pressure.
• MACD plunges: The DIF line (-1,073.54) and DEA (-781.41) have sunk deep below the zero line, with the red Histogram bar expanding to a record level (-292.13). Downward momentum is at an extreme oversold level, with no bottoming signal yet.
⚠️ STRATEGIC PRICE ZONES & MARKET SENTIMENT:
• Market cost basis: Still anchored high at $78,600 (now more than $8,600 above the market price), leaving most short-term long positions deeply in the red.
• New support & resistance: The $69,900–$70,000 range is now the final psychological boundary. Above it, the $72,180 area (MA7) has turned into firm resistance.
$BTC
The scenario of breaking below the critical $72,727 low during the U.S. session has officially triggered a wave of cascading liquidations. Bitcoin entered the Asian session with a long-bodied red candle, breaking through the psychological support level of $70,000 and hitting a new low of $69,900.
🔍 ASIAN SESSION TECHNICAL INDICATORS (4H CHART):
• Current price: ~$69,977.16 (down -5.25% over the past 24 hours and falling another -2.52% at the start of the new day).
• Selling pressure & new low: The 24-hour high of $73,884.01 was followed by a sharp sell-off to a low of $69,900.00. 24-hour trading volume surged to 1.33 billion USDT (the latest 4H candle alone recorded volume of up to 326 million USDT), confirming panic selling and the liquidation of long positions.
• Moving average system: The price has plunged, falling well below both MA(7) = $72,179.92 and MA(25) = $73,708.16. Short-term moving averages are plunging steeply, creating extreme downward pressure.
• MACD plunges: The DIF line (-1,073.54) and DEA (-781.41) have sunk deep below the zero line, with the red Histogram bar expanding to a record level (-292.13). Downward momentum is at an extreme oversold level, with no bottoming signal yet.
⚠️ STRATEGIC PRICE ZONES & MARKET SENTIMENT:
• Market cost basis: Still anchored high at $78,600 (now more than $8,600 above the market price), leaving most short-term long positions deeply in the red.
• New support & resistance: The $69,900–$70,000 range is now the final psychological boundary. Above it, the $72,180 area (MA7) has turned into firm resistance.
$BTC
343
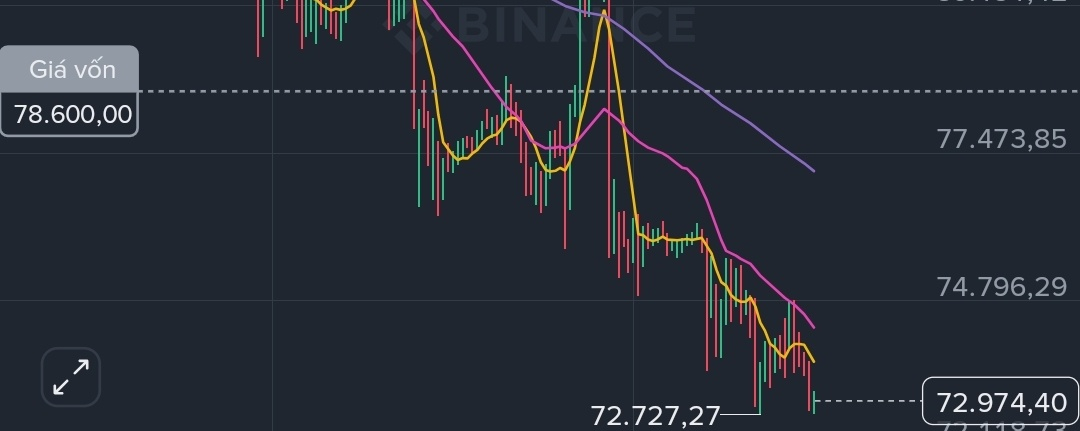
🚨 BTC/USDT U.S. SESSION UPDATE: BREAKS BELOW $73,000 – TESTS CRITICAL $72,727 LOW
The bearish scenario from the European session has now officially played out! The bulls ran out of steam, sending the price through the $73,390 support zone and straight toward the previous low of $72,727, just ahead of a highly volatile U.S. session.
🔍 U.S. SESSION TECHNICALS (4H CHART):
• Current price: ~$72,974.40 (down 1.41% over the past 24 hours and 1.74% since the start of the day).
• Near the previous low: The 24-hour low just touched $72,734.71, less than $8 away from the deepest low of the crash ($72,727.27).
$BTC
🚨 BTC/USDT U.S. SESSION UPDATE: BREAKS BELOW $73,000 – TESTS CRITICAL $72,727 LOW
The bearish scenario from the European session has now officially played out! The bulls ran out of steam, sending the price through the $73,390 support zone and straight toward the previous low of $72,727, just ahead of a highly volatile U.S. session.
🔍 U.S. SESSION TECHNICALS (4H CHART):
• Current price: ~$72,974.40 (down 1.41% over the past 24 hours and 1.74% since the start of the day).
• Near the previous low: The 24-hour low just touched $72,734.71, less than $8 away from the deepest low of the crash ($72,727.27).
$BTC
The bearish scenario from the European session has now officially played out! The bulls ran out of steam, sending the price through the $73,390 support zone and straight toward the previous low of $72,727, just ahead of a highly volatile U.S. session.
🔍 U.S. SESSION TECHNICALS (4H CHART):
• Current price: ~$72,974.40 (down 1.41% over the past 24 hours and 1.74% since the start of the day).
• Near the previous low: The 24-hour low just touched $72,734.71, less than $8 away from the deepest low of the crash ($72,727.27).
$BTC
1
162
Article
BTC Faces High Risk During U.S. Session🚨 BTC/USDT U.S. SESSION UPDATE: BREAKS BELOW $73,000 - TESTING THE CRITICAL $72,727 LOW
The bearish scenario from the European session has officially played out! The bulls have run out of steam, pushing the price below the $73,390 support zone and sending it straight toward the previous low of $72,727 just ahead of the volatile U.S. session.
🔍 U.S. SESSION TECHNICAL INDICATORS (4H TIMEFRAME):
• Current price: ~72,974.40 USD (down -1.41% over the past 24 hours and -1.74% since the start of the day).
BTC Faces High Risk During U.S. Session
🚨 BTC/USDT U.S. SESSION UPDATE: BREAKS BELOW $73,000 - TESTING THE CRITICAL $72,727 LOW
The bearish scenario from the European session has officially played out! The bulls have run out of steam, pushing the price below the $73,390 support zone and sending it straight toward the previous low of $72,727 just ahead of the volatile U.S. session.
🔍 U.S. SESSION TECHNICAL INDICATORS (4H TIMEFRAME):
• Current price: ~72,974.40 USD (down -1.41% over the past 24 hours and -1.74% since the start of the day).
The bearish scenario from the European session has officially played out! The bulls have run out of steam, pushing the price below the $73,390 support zone and sending it straight toward the previous low of $72,727 just ahead of the volatile U.S. session.
🔍 U.S. SESSION TECHNICAL INDICATORS (4H TIMEFRAME):
• Current price: ~72,974.40 USD (down -1.41% over the past 24 hours and -1.74% since the start of the day).
7
·
--
Bearish
🚨 BTC/USDT US SESSION UPDATE: BREAKS BELOW 73.000 USD — TESTING THE CRITICAL 72.727 USD LOW
The bearish scenario from the European session has now been triggered! The bulls have lost momentum, sending the price below the 73.390 USD support zone and plunging toward the previous low of 72.727 USD just ahead of a volatile US session.
🔍 US SESSION TECHNICAL INDICATORS (4H CHART):
• Current price: ~72.974,40 USD (down -1,41% over the past 24 hours and -1,74% since the start of the day).
• Nearing the previous low: The 24-hour low just touched 72.734,71 USD, less than 8 USD away from the deepest low of the crash (72.727,27 USD). 24-hour trading volume dipped slightly to 944,90 million USDT.
• MACD turns bearish: As warned, the recovery attempt has failed. The DIF line (-618,82) has officially crossed below the DEA line (-601,59), turning the Histogram bar red (-17,23). Bearish momentum is returning with force.
• Moving average system: Price has been pushed well below MA(7) = 73.686,00 USD and MA(25) = 74.307,95 USD. Short-term moving averages continue to slope downward, putting direct pressure on the price.
⚠️ STRATEGIC PRICE ZONES & MARKET SENTIMENT:
• Make-or-break level: 72.727 USD is the bulls’ last line of defense. If this level breaks, the bottoming structure will collapse completely, triggering a new wave of long liquidations.
• Market cost basis: Still anchored high at 78.600 USD (nearly 5.600 USD above the current price), indicating that selling pressure from buyers who entered near the top remains a looming threat.
🔮 US SESSION OUTLOOK:
• Scenario 1 (High risk): US session flows continue to sell off, pushing the price below the 72.727 USD low. $BTC
{future}(BTCUSDT)
🚨 BTC/USDT US SESSION UPDATE: BREAKS BELOW 73.000 USD — TESTING THE CRITICAL 72.727 USD LOW
The bearish scenario from the European session has now been triggered! The bulls have lost momentum, sending the price below the 73.390 USD support zone and plunging toward the previous low of 72.727 USD just ahead of a volatile US session.
🔍 US SESSION TECHNICAL INDICATORS (4H CHART):
• Current price: ~72.974,40 USD (down -1,41% over the past 24 hours and -1,74% since the start of the day).
• Nearing the previous low: The 24-hour low just touched 72.734,71 USD, less than 8 USD away from the deepest low of the crash (72.727,27 USD). 24-hour trading volume dipped slightly to 944,90 million USDT.
• MACD turns bearish: As warned, the recovery attempt has failed. The DIF line (-618,82) has officially crossed below the DEA line (-601,59), turning the Histogram bar red (-17,23). Bearish momentum is returning with force.
• Moving average system: Price has been pushed well below MA(7) = 73.686,00 USD and MA(25) = 74.307,95 USD. Short-term moving averages continue to slope downward, putting direct pressure on the price.
⚠️ STRATEGIC PRICE ZONES & MARKET SENTIMENT:
• Make-or-break level: 72.727 USD is the bulls’ last line of defense. If this level breaks, the bottoming structure will collapse completely, triggering a new wave of long liquidations.
• Market cost basis: Still anchored high at 78.600 USD (nearly 5.600 USD above the current price), indicating that selling pressure from buyers who entered near the top remains a looming threat.
🔮 US SESSION OUTLOOK:
• Scenario 1 (High risk): US session flows continue to sell off, pushing the price below the 72.727 USD low. $BTC
The bearish scenario from the European session has now been triggered! The bulls have lost momentum, sending the price below the 73.390 USD support zone and plunging toward the previous low of 72.727 USD just ahead of a volatile US session.
🔍 US SESSION TECHNICAL INDICATORS (4H CHART):
• Current price: ~72.974,40 USD (down -1,41% over the past 24 hours and -1,74% since the start of the day).
• Nearing the previous low: The 24-hour low just touched 72.734,71 USD, less than 8 USD away from the deepest low of the crash (72.727,27 USD). 24-hour trading volume dipped slightly to 944,90 million USDT.
• MACD turns bearish: As warned, the recovery attempt has failed. The DIF line (-618,82) has officially crossed below the DEA line (-601,59), turning the Histogram bar red (-17,23). Bearish momentum is returning with force.
• Moving average system: Price has been pushed well below MA(7) = 73.686,00 USD and MA(25) = 74.307,95 USD. Short-term moving averages continue to slope downward, putting direct pressure on the price.
⚠️ STRATEGIC PRICE ZONES & MARKET SENTIMENT:
• Make-or-break level: 72.727 USD is the bulls’ last line of defense. If this level breaks, the bottoming structure will collapse completely, triggering a new wave of long liquidations.
• Market cost basis: Still anchored high at 78.600 USD (nearly 5.600 USD above the current price), indicating that selling pressure from buyers who entered near the top remains a looming threat.
🔮 US SESSION OUTLOOK:
• Scenario 1 (High risk): US session flows continue to sell off, pushing the price below the 72.727 USD low. $BTC
126
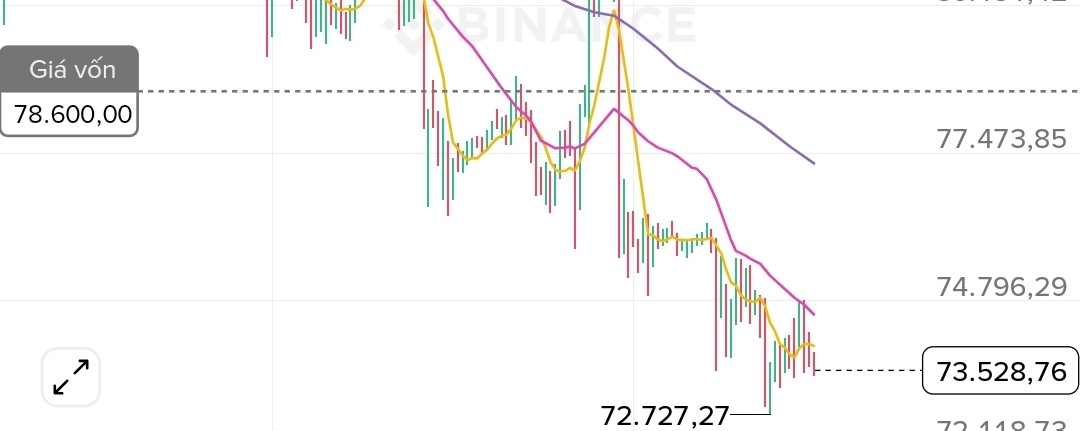
⚖️ BTC/USDT EUROPEAN SESSION UPDATE: EXTREMELY TIGHT CONSOLIDATION — A BREAKOUT FROM THE TRADING RANGE IS AWAITED
After a quiet Asian session that failed to break through short-term resistance, Bitcoin enters the European session in a state of extreme price compression. The incoming flow of funds from European markets is expected to break the current equilibrium.
🔍 EUROPEAN SESSION TECHNICAL DATA (4H TIME FRAME):
• Current price: ~73,528.76 USD (Trading sideways with ultra-tight volatility of -0.08% over the past 24 hours, down -0.98% since the start of the day).
• Price compression & liquidity exhaustion: 24-hour trading volume continues to decline, reaching exactly 1.00 billion USDT
$BTC
⚖️ BTC/USDT EUROPEAN SESSION UPDATE: EXTREMELY TIGHT CONSOLIDATION — A BREAKOUT FROM THE TRADING RANGE IS AWAITED
After a quiet Asian session that failed to break through short-term resistance, Bitcoin enters the European session in a state of extreme price compression. The incoming flow of funds from European markets is expected to break the current equilibrium.
🔍 EUROPEAN SESSION TECHNICAL DATA (4H TIME FRAME):
• Current price: ~73,528.76 USD (Trading sideways with ultra-tight volatility of -0.08% over the past 24 hours, down -0.98% since the start of the day).
• Price compression & liquidity exhaustion: 24-hour trading volume continues to decline, reaching exactly 1.00 billion USDT
$BTC
After a quiet Asian session that failed to break through short-term resistance, Bitcoin enters the European session in a state of extreme price compression. The incoming flow of funds from European markets is expected to break the current equilibrium.
🔍 EUROPEAN SESSION TECHNICAL DATA (4H TIME FRAME):
• Current price: ~73,528.76 USD (Trading sideways with ultra-tight volatility of -0.08% over the past 24 hours, down -0.98% since the start of the day).
• Price compression & liquidity exhaustion: 24-hour trading volume continues to decline, reaching exactly 1.00 billion USDT
$BTC
196
Article
BTC Tightens Its Range in the European Session⚖️ BTC/USDT EUROPEAN SESSION UPDATE: EXTREMELY TIGHT RANGE COMPRESSION — AWAITING A BREAKOUT FROM THE CONSOLIDATION ZONE
After a quiet Asian session in which Bitcoin failed to break through short-term resistance, it enters the European session in a state of extreme price compression. The incoming flow of funds from European markets could break the current equilibrium.
🔍 EUROPEAN SESSION TECHNICAL INDICATORS (4H CHART):
• Current price: ~$73,528.76 (Trading sideways within an extremely tight range, down 0.08% over the past 24 hours and 0.98% since the start of the day).
BTC Tightens Its Range in the European Session
⚖️ BTC/USDT EUROPEAN SESSION UPDATE: EXTREMELY TIGHT RANGE COMPRESSION — AWAITING A BREAKOUT FROM THE CONSOLIDATION ZONE
After a quiet Asian session in which Bitcoin failed to break through short-term resistance, it enters the European session in a state of extreme price compression. The incoming flow of funds from European markets could break the current equilibrium.
🔍 EUROPEAN SESSION TECHNICAL INDICATORS (4H CHART):
• Current price: ~$73,528.76 (Trading sideways within an extremely tight range, down 0.08% over the past 24 hours and 0.98% since the start of the day).
After a quiet Asian session in which Bitcoin failed to break through short-term resistance, it enters the European session in a state of extreme price compression. The incoming flow of funds from European markets could break the current equilibrium.
🔍 EUROPEAN SESSION TECHNICAL INDICATORS (4H CHART):
• Current price: ~$73,528.76 (Trading sideways within an extremely tight range, down 0.08% over the past 24 hours and 0.98% since the start of the day).
29
Log in to explore more content
Join global crypto users on Binance Square
⚡️ Get latest and useful information about crypto.
💬 Trusted by the world’s largest crypto exchange.
👍 Discover real insights from verified creators.
Email / Phone number
Trending Topics
CryptoSelloffTriggersMultipleWhaleLiquidations
85,411 views
1,000 Discussing
Crypto Liquidations Top $2B in 24 Hours as 329,000 Traders Are Wiped Out
Binance News
·31 Likes
·32.8k views
USSpotXRPETFsSeeLargestWeeklyOutflowIn8Months
98,905 views
1,112 Discussing
WillFOMCMinutesReinforceRateHikeExpectations?
20,127 views
415 Discussing