

Eloy Spot Alpha
37 Posts

Eloy Spot Alpha
Report
Block User
📊 Spot Alpha & Wyckoff VSA Trader | Analisis Akumulasi Smart Money & Setup Spot Binance | Edukasi Pasar & Manajemen Risiko | DYOR 🚀
Open Trade
Frequent Trader
1.6 Years
3 Following
4 Followers
3 Liked
Posts
Portfolio
All
Videos
PINNED
Eloy Spot Alpha Trading Principles: Wyckoff Discipline and Capital Protection
This account is dedicated to recording and evaluating spot market setups within the Binance ecosystem.
Three pillars of the approach used:
1. Wyckoff VSA Accumulation
The main focus is to identify the volume absorption phase (absorption) at key support floors when sell supply starts to dry up, rather than chasing impulsive breakouts that are prone to false breaks.
2. Spot Market Without Leverage
All setups are purely spot-based. This removes the risk of forced liquidation from short-term fluctuations, while also giving setups time to develop.
3. De-Risking Discipline
When a position experiences an initial rise, pull the principal capital back into the USDT cash. The remaining position is allowed to run as a free-risk portion (risk-free moonbag). Liquid capital is redirected back to a new candidate at the bottom of the range.
Daily notes will be shared based on a measurable market filter.
#BinanceSquareCreator #CryptoMarket #BinanceSquare
Note: Not an invitation to buy or sell crypto assets (DYOR). Independent technical structure analysis and risk management.
Eloy Spot Alpha Trading Principles: Wyckoff Discipline and Capital Protection
This account is dedicated to recording and evaluating spot market setups within the Binance ecosystem.
Three pillars of the approach used:
1. Wyckoff VSA Accumulation
The main focus is to identify the volume absorption phase (absorption) at key support floors when sell supply starts to dry up, rather than chasing impulsive breakouts that are prone to false breaks.
2. Spot Market Without Leverage
All setups are purely spot-based. This removes the risk of forced liquidation from short-term fluctuations, while also giving setups time to develop.
3. De-Risking Discipline
When a position experiences an initial rise, pull the principal capital back into the USDT cash. The remaining position is allowed to run as a free-risk portion (risk-free moonbag). Liquid capital is redirected back to a new candidate at the bottom of the range.
Daily notes will be shared based on a measurable market filter.
#BinanceSquareCreator #CryptoMarket #BinanceSquare
Note: Not an invitation to buy or sell crypto assets (DYOR). Independent technical structure analysis and risk management.
This account is dedicated to recording and evaluating spot market setups within the Binance ecosystem.
Three pillars of the approach used:
1. Wyckoff VSA Accumulation
The main focus is to identify the volume absorption phase (absorption) at key support floors when sell supply starts to dry up, rather than chasing impulsive breakouts that are prone to false breaks.
2. Spot Market Without Leverage
All setups are purely spot-based. This removes the risk of forced liquidation from short-term fluctuations, while also giving setups time to develop.
3. De-Risking Discipline
When a position experiences an initial rise, pull the principal capital back into the USDT cash. The remaining position is allowed to run as a free-risk portion (risk-free moonbag). Liquid capital is redirected back to a new candidate at the bottom of the range.
Daily notes will be shared based on a measurable market filter.
#BinanceSquareCreator #CryptoMarket #BinanceSquare
Note: Not an invitation to buy or sell crypto assets (DYOR). Independent technical structure analysis and risk management.
126
Wyckoff VSA Structure Notes $IOTX (1D):
Spot buyers absorb supply in the support area $0.0160 - $0.0163, followed by a low-volume supply test.
We enter gradually within the range $0.0160 to $0.0163, with an exit limit if the daily candle closes below $0.0145. The initial capital protection target is at $0.0253 (return ratio 5.8 : 1).
Independent spot trade journal notes (DYOR).
#IOTX #BinanceSquare #WyckoffMethod #RiskManagement
Wyckoff VSA Structure Notes $IOTX (1D):
Spot buyers absorb supply in the support area $0.0160 - $0.0163, followed by a low-volume supply test.
We enter gradually within the range $0.0160 to $0.0163, with an exit limit if the daily candle closes below $0.0145. The initial capital protection target is at $0.0253 (return ratio 5.8 : 1).
Independent spot trade journal notes (DYOR).
#IOTX #BinanceSquare #WyckoffMethod #RiskManagement
Spot buyers absorb supply in the support area $0.0160 - $0.0163, followed by a low-volume supply test.
We enter gradually within the range $0.0160 to $0.0163, with an exit limit if the daily candle closes below $0.0145. The initial capital protection target is at $0.0253 (return ratio 5.8 : 1).
Independent spot trade journal notes (DYOR).
#IOTX #BinanceSquare #WyckoffMethod #RiskManagement
8
Update Execution $XNO: Bullet Phase 2 (Second Floor Test / Double-Bottom)
Price $XNO k again touches the floor support area $0.3520 (current price $0.3530) with selling pressure staying low.
In line with the 2-Tranche scenario, this second-floor test becomes the execution point for Tranche 2 to complete the position of Tranche 1 ($0.3710). The strict invalidation limit remains at the daily candle close below $0.3412 toward the 30-day structural target at $0.5200.
$XNO #BinanceSquareCreator #BinanceSquare #CryptoMarket #AlphaGems
Note: Independent technical research journal and risk management (DYOR).
Update Execution $XNO : Bullet Phase 2 (Second Floor Test / Double-Bottom)
Price $XNO k again touches the floor support area $0.3520 (current price $0.3530) with selling pressure staying low.
In line with the 2-Tranche scenario, this second-floor test becomes the execution point for Tranche 2 to complete the position of Tranche 1 ($0.3710). The strict invalidation limit remains at the daily candle close below $0.3412 toward the 30-day structural target at $0.5200.
$XNO #BinanceSquareCreator #BinanceSquare #CryptoMarket #AlphaGems
Note: Independent technical research journal and risk management (DYOR).
Price $XNO k again touches the floor support area $0.3520 (current price $0.3530) with selling pressure staying low.
In line with the 2-Tranche scenario, this second-floor test becomes the execution point for Tranche 2 to complete the position of Tranche 1 ($0.3710). The strict invalidation limit remains at the daily candle close below $0.3412 toward the 30-day structural target at $0.5200.
$XNO #BinanceSquareCreator #BinanceSquare #CryptoMarket #AlphaGems
Note: Independent technical research journal and risk management (DYOR).
16
Volume Spread Analysis: How to Read a No Supply TestIn Volume Spread Analysis (VSA) readings, the most important confirmation after initial absorption appears when price falls to retest the support floor with a shrinking red volume bar.
This pattern is known as a No Supply Test. When price moves near the support base but daily trading volume is far below the 20-day average, the data indicates that active sellers have already run out at the lower price level.
When the floating supply has dried up, the next buying push in the spot market can lift prices more lightly toward the nearest resistance.
Volume Spread Analysis: How to Read a No Supply Test
In Volume Spread Analysis (VSA) readings, the most important confirmation after initial absorption appears when price falls to retest the support floor with a shrinking red volume bar.
This pattern is known as a No Supply Test. When price moves near the support base but daily trading volume is far below the 20-day average, the data indicates that active sellers have already run out at the lower price level.
When the floating supply has dried up, the next buying push in the spot market can lift prices more lightly toward the nearest resistance.
This pattern is known as a No Supply Test. When price moves near the support base but daily trading volume is far below the 20-day average, the data indicates that active sellers have already run out at the lower price level.
When the floating supply has dried up, the next buying push in the spot market can lift prices more lightly toward the nearest resistance.
2
Spot Journal $CYPHB (Stealth Box Floor-Test & Reclaim): 2-Tranche Plan for a New Coin
The price of $CYPHB has moved at $3.2285 after confirming the floor test support.
The price has completed the floor sweep test (Spring/Double-Bottom) with sell volume drying up, followed by a green Reclaim candle (0.61x the average) confirming supply absorption at the bottom of the box.
Execution Plan for 2 Tranches:
• Tranche 1 (Floor Test & Reclaim): Area $3.1858 - $3.2285
• Tranche 2 (Scale-In Confirmation): Second floor test at $3.1858 OR break above the consolidation ceiling at $3.3000
The risk limit is set at the 4H candle close below $3.0907. The main structural target is at the 30-day peak ($4.4000, RRR 10.2:1) to liquidate half of the position into USDT, while the remaining coins are left to run toward $6.4143.
$CYPHB #BinanceSquareCreator #BinanceSquare #CryptoMarket #AlphaGems
Note: Independent spot technical research and risk-management journal (DYOR).
Spot Journal $CYPHB (Stealth Box Floor-Test & Reclaim): 2-Tranche Plan for a New Coin
The price of $CYPHB has moved at $3.2285 after confirming the floor test support.
The price has completed the floor sweep test (Spring/Double-Bottom) with sell volume drying up, followed by a green Reclaim candle (0.61x the average) confirming supply absorption at the bottom of the box.
Execution Plan for 2 Tranches:
• Tranche 1 (Floor Test & Reclaim): Area $3.1858 - $3.2285
• Tranche 2 (Scale-In Confirmation): Second floor test at $3.1858 OR break above the consolidation ceiling at $3.3000
The risk limit is set at the 4H candle close below $3.0907. The main structural target is at the 30-day peak ($4.4000, RRR 10.2:1) to liquidate half of the position into USDT, while the remaining coins are left to run toward $6.4143.
$CYPHB #BinanceSquareCreator #BinanceSquare #CryptoMarket #AlphaGems
Note: Independent spot technical research and risk-management journal (DYOR).
The price of $CYPHB has moved at $3.2285 after confirming the floor test support.
The price has completed the floor sweep test (Spring/Double-Bottom) with sell volume drying up, followed by a green Reclaim candle (0.61x the average) confirming supply absorption at the bottom of the box.
Execution Plan for 2 Tranches:
• Tranche 1 (Floor Test & Reclaim): Area $3.1858 - $3.2285
• Tranche 2 (Scale-In Confirmation): Second floor test at $3.1858 OR break above the consolidation ceiling at $3.3000
The risk limit is set at the 4H candle close below $3.0907. The main structural target is at the 30-day peak ($4.4000, RRR 10.2:1) to liquidate half of the position into USDT, while the remaining coins are left to run toward $6.4143.
$CYPHB #BinanceSquareCreator #BinanceSquare #CryptoMarket #AlphaGems
Note: Independent spot technical research and risk-management journal (DYOR).
Spot Journal $KERNEL (Stealth Box Floor-Test & Reclaim): 2-Tranche Plan 1D
Price $KERNEL is moving at $0.0521 after confirming the support floor test.
The price has completed the floor-test sweep (Spring/Double-Bottom) with sell volume drying up, followed by a green Reclaim candle (0.43x average) confirming supply absorption at the base of the box.
Execution Plan for 2-Tranches:
• Tranche 1 (Floor Test & Reclaim): Area $0.0499 - $0.0521
• Tranche 2 (Scale-In Confirmation): Second floor test at $0.0499 OR a breakout above the consolidation ceiling at $0.0571
The risk boundary is set at the 1D candle close below $0.0485. The main structural target is at the 30-day peak ($0.0748, RRR 9.3:1) to liquidate half the position into USDT, while the remaining coins are left to run toward $0.1020.
$KERNEL #BinanceSquareCreator #BinanceSquare #CryptoMarket #AlphaGems
Note: This is an independent technical research and risk management journal for spot (DYOR).
Spot Journal $KERNEL (Stealth Box Floor-Test & Reclaim): 2-Tranche Plan 1D
Price $KERNEL is moving at $0.0521 after confirming the support floor test.
The price has completed the floor-test sweep (Spring/Double-Bottom) with sell volume drying up, followed by a green Reclaim candle (0.43x average) confirming supply absorption at the base of the box.
Execution Plan for 2-Tranches:
• Tranche 1 (Floor Test & Reclaim): Area $0.0499 - $0.0521
• Tranche 2 (Scale-In Confirmation): Second floor test at $0.0499 OR a breakout above the consolidation ceiling at $0.0571
The risk boundary is set at the 1D candle close below $0.0485. The main structural target is at the 30-day peak ($0.0748, RRR 9.3:1) to liquidate half the position into USDT, while the remaining coins are left to run toward $0.1020.
$KERNEL #BinanceSquareCreator #BinanceSquare #CryptoMarket #AlphaGems
Note: This is an independent technical research and risk management journal for spot (DYOR).
Price $KERNEL is moving at $0.0521 after confirming the support floor test.
The price has completed the floor-test sweep (Spring/Double-Bottom) with sell volume drying up, followed by a green Reclaim candle (0.43x average) confirming supply absorption at the base of the box.
Execution Plan for 2-Tranches:
• Tranche 1 (Floor Test & Reclaim): Area $0.0499 - $0.0521
• Tranche 2 (Scale-In Confirmation): Second floor test at $0.0499 OR a breakout above the consolidation ceiling at $0.0571
The risk boundary is set at the 1D candle close below $0.0485. The main structural target is at the 30-day peak ($0.0748, RRR 9.3:1) to liquidate half the position into USDT, while the remaining coins are left to run toward $0.1020.
$KERNEL #BinanceSquareCreator #BinanceSquare #CryptoMarket #AlphaGems
Note: This is an independent technical research and risk management journal for spot (DYOR).
Spot Journal $XNO (Stealth Box Floor-Test & Reclaim): 2-Tranche Plan 1D
Price $XNO is moving at $0.3668 after confirming the floor support floor-test.
Price has completed the floor-test sweep (Spring/Double-Bottom) with sell volume drying up, followed by a green Reclaim candle (0.43x average) that confirms supply absorption at the base of the box.
2-Tranche Execution Plan:
• Tranche 1 (Floor-Test & Reclaim): Area $0.3518 - $0.3668
• Tranche 2 (Scale-In Confirmation): Second floor test at $0.3518 OR breakout above the consolidation ceiling at $0.3900
Risk limit is set at the close of the 1D candle below $0.3412. The main structural target is at the 30-day peak ($0.5200, RRR 8.9:1) to liquidate half the position into USDT, while the remaining coins are left to run toward $0.7186.
$XNO #BinanceSquareCreator #BinanceSquare #CryptoMarket #AlphaGems
Note: Independent spot technical research and risk management journal (DYOR).
Spot Journal $XNO (Stealth Box Floor-Test & Reclaim): 2-Tranche Plan 1D
Price $XNO is moving at $0.3668 after confirming the floor support floor-test.
Price has completed the floor-test sweep (Spring/Double-Bottom) with sell volume drying up, followed by a green Reclaim candle (0.43x average) that confirms supply absorption at the base of the box.
2-Tranche Execution Plan:
• Tranche 1 (Floor-Test & Reclaim): Area $0.3518 - $0.3668
• Tranche 2 (Scale-In Confirmation): Second floor test at $0.3518 OR breakout above the consolidation ceiling at $0.3900
Risk limit is set at the close of the 1D candle below $0.3412. The main structural target is at the 30-day peak ($0.5200, RRR 8.9:1) to liquidate half the position into USDT, while the remaining coins are left to run toward $0.7186.
$XNO #BinanceSquareCreator #BinanceSquare #CryptoMarket #AlphaGems
Note: Independent spot technical research and risk management journal (DYOR).
Price $XNO is moving at $0.3668 after confirming the floor support floor-test.
Price has completed the floor-test sweep (Spring/Double-Bottom) with sell volume drying up, followed by a green Reclaim candle (0.43x average) that confirms supply absorption at the base of the box.
2-Tranche Execution Plan:
• Tranche 1 (Floor-Test & Reclaim): Area $0.3518 - $0.3668
• Tranche 2 (Scale-In Confirmation): Second floor test at $0.3518 OR breakout above the consolidation ceiling at $0.3900
Risk limit is set at the close of the 1D candle below $0.3412. The main structural target is at the 30-day peak ($0.5200, RRR 8.9:1) to liquidate half the position into USDT, while the remaining coins are left to run toward $0.7186.
$XNO #BinanceSquareCreator #BinanceSquare #CryptoMarket #AlphaGems
Note: Independent spot technical research and risk management journal (DYOR).
Spot Journal $IOTX (Stealth Box Floor-Test & Reclaim): 2-Tranche Plan 1D
The price $IOTX is moving at $0.00340 after the support floor test confirmation.
The price has completed a floor-test sweep (Spring/Double-Bottom) with sell volume drying up, followed by a green Reclaim candle (0.41x of the average) confirming absorption of supply at the bottom of the box.
2-Tranche Execution Plan:
• Tranche 1 (Floor Test & Reclaim): Area $0.00326 - $0.00340
• Tranche 2 (Confirmation Scale-In): Second floor test at $0.00326 OR a breakout above the consolidation ceiling at $0.00369
Risk limit is set at the 1D candle close below $0.00316. The main structural target is at the 30-day peak ($0.00430, RRR 5.8:1) to liquidate half the position into USDT, while the remaining coins are left to run toward $0.00666.
$IOTX #BinanceSquareCreator #BinanceSquare #CryptoMarket #AlphaGems
Note: Independent spot technical research and risk-management journal (DYOR).
Spot Journal $IOTX (Stealth Box Floor-Test & Reclaim): 2-Tranche Plan 1D
The price $IOTX is moving at $0.00340 after the support floor test confirmation.
The price has completed a floor-test sweep (Spring/Double-Bottom) with sell volume drying up, followed by a green Reclaim candle (0.41x of the average) confirming absorption of supply at the bottom of the box.
2-Tranche Execution Plan:
• Tranche 1 (Floor Test & Reclaim): Area $0.00326 - $0.00340
• Tranche 2 (Confirmation Scale-In): Second floor test at $0.00326 OR a breakout above the consolidation ceiling at $0.00369
Risk limit is set at the 1D candle close below $0.00316. The main structural target is at the 30-day peak ($0.00430, RRR 5.8:1) to liquidate half the position into USDT, while the remaining coins are left to run toward $0.00666.
$IOTX #BinanceSquareCreator #BinanceSquare #CryptoMarket #AlphaGems
Note: Independent spot technical research and risk-management journal (DYOR).
The price $IOTX is moving at $0.00340 after the support floor test confirmation.
The price has completed a floor-test sweep (Spring/Double-Bottom) with sell volume drying up, followed by a green Reclaim candle (0.41x of the average) confirming absorption of supply at the bottom of the box.
2-Tranche Execution Plan:
• Tranche 1 (Floor Test & Reclaim): Area $0.00326 - $0.00340
• Tranche 2 (Confirmation Scale-In): Second floor test at $0.00326 OR a breakout above the consolidation ceiling at $0.00369
Risk limit is set at the 1D candle close below $0.00316. The main structural target is at the 30-day peak ($0.00430, RRR 5.8:1) to liquidate half the position into USDT, while the remaining coins are left to run toward $0.00666.
$IOTX #BinanceSquareCreator #BinanceSquare #CryptoMarket #AlphaGems
Note: Independent spot technical research and risk-management journal (DYOR).
82
Jurnal Spot $NEWT (Stealth Box Floor-Test & Reclaim): 2-Tranche Plan 1D
Price $NEWT bergerak di $0.0491 setelah konfirmasi uji lantai support.
The price has completed a floor test sweep (Spring/Double-Bottom) with sell volume drying up, followed by a green Reclaim candle (0.50x the average) confirming the absorption of supply at the bottom of the box.
Execution Plan for 2-Tranche:
• Tranche 1 (Floor Test & Reclaim): Area $0.0471 - $0.0491
• Tranche 2 (Scale-In Confirmation): Second floor test at $0.0471 OR a break above the consolidation ceiling over $0.0522
The risk boundary is set at the 1D candle close below $0.0457. The main structural target is at the 30-day peak ($0.0606, RRR 5.2:1) to liquidate half the position into USDT, while the remaining coins are left to run toward $0.0962.
$NEWT #BinanceSquareCreator #BinanceSquare #CryptoMarket #AlphaGems
Note: Independent technical research and spot risk management journal (DYOR).
Jurnal Spot $NEWT (Stealth Box Floor-Test & Reclaim): 2-Tranche Plan 1D
Price $NEWT bergerak di $0.0491 setelah konfirmasi uji lantai support.
The price has completed a floor test sweep (Spring/Double-Bottom) with sell volume drying up, followed by a green Reclaim candle (0.50x the average) confirming the absorption of supply at the bottom of the box.
Execution Plan for 2-Tranche:
• Tranche 1 (Floor Test & Reclaim): Area $0.0471 - $0.0491
• Tranche 2 (Scale-In Confirmation): Second floor test at $0.0471 OR a break above the consolidation ceiling over $0.0522
The risk boundary is set at the 1D candle close below $0.0457. The main structural target is at the 30-day peak ($0.0606, RRR 5.2:1) to liquidate half the position into USDT, while the remaining coins are left to run toward $0.0962.
$NEWT #BinanceSquareCreator #BinanceSquare #CryptoMarket #AlphaGems
Note: Independent technical research and spot risk management journal (DYOR).
Price $NEWT bergerak di $0.0491 setelah konfirmasi uji lantai support.
The price has completed a floor test sweep (Spring/Double-Bottom) with sell volume drying up, followed by a green Reclaim candle (0.50x the average) confirming the absorption of supply at the bottom of the box.
Execution Plan for 2-Tranche:
• Tranche 1 (Floor Test & Reclaim): Area $0.0471 - $0.0491
• Tranche 2 (Scale-In Confirmation): Second floor test at $0.0471 OR a break above the consolidation ceiling over $0.0522
The risk boundary is set at the 1D candle close below $0.0457. The main structural target is at the 30-day peak ($0.0606, RRR 5.2:1) to liquidate half the position into USDT, while the remaining coins are left to run toward $0.0962.
$NEWT #BinanceSquareCreator #BinanceSquare #CryptoMarket #AlphaGems
Note: Independent technical research and spot risk management journal (DYOR).
31
Binance Life Journal $ (Stealth Box Floor-Test & Reclaim): 2-Tranche Plan 1D
The price of $币安人生 moved at $0.5023 after the support floor test confirmation.
The price has completed a floor test sweep (Spring/Double-Bottom) with sell volume drying up, followed by a green Reclaim candle (1.66x the average) that confirms supply absorption at the bottom of the box.
2-Tranche Execution Plan:
• Tranche 1 (Floor Test & Reclaim): Area $0.4842 - $0.5023
• Tranche 2 (Confirmation Scale-In): Second floor test at $0.4842 OR a breakout above the consolidation ceiling at $0.5274
The risk limit is set at the 1D candle close below $0.4698. The main structural target is at the 30-day peak ($0.6258, RRR 5.6:1) to liquidate half the position into USDT, while the remaining coins are left to run toward $0.9865.
$币安人生 #BinanceSquareCreator #BinanceSquare #CryptoMarket #AlphaGems
Note: This spot technical research and risk management journal is independent (DYOR).
Binance Life Journal $ (Stealth Box Floor-Test & Reclaim): 2-Tranche Plan 1D
The price of $币安人生 moved at $0.5023 after the support floor test confirmation.
The price has completed a floor test sweep (Spring/Double-Bottom) with sell volume drying up, followed by a green Reclaim candle (1.66x the average) that confirms supply absorption at the bottom of the box.
2-Tranche Execution Plan:
• Tranche 1 (Floor Test & Reclaim): Area $0.4842 - $0.5023
• Tranche 2 (Confirmation Scale-In): Second floor test at $0.4842 OR a breakout above the consolidation ceiling at $0.5274
The risk limit is set at the 1D candle close below $0.4698. The main structural target is at the 30-day peak ($0.6258, RRR 5.6:1) to liquidate half the position into USDT, while the remaining coins are left to run toward $0.9865.
$币安人生 #BinanceSquareCreator #BinanceSquare #CryptoMarket #AlphaGems
Note: This spot technical research and risk management journal is independent (DYOR).
The price of $币安人生 moved at $0.5023 after the support floor test confirmation.
The price has completed a floor test sweep (Spring/Double-Bottom) with sell volume drying up, followed by a green Reclaim candle (1.66x the average) that confirms supply absorption at the bottom of the box.
2-Tranche Execution Plan:
• Tranche 1 (Floor Test & Reclaim): Area $0.4842 - $0.5023
• Tranche 2 (Confirmation Scale-In): Second floor test at $0.4842 OR a breakout above the consolidation ceiling at $0.5274
The risk limit is set at the 1D candle close below $0.4698. The main structural target is at the 30-day peak ($0.6258, RRR 5.6:1) to liquidate half the position into USDT, while the remaining coins are left to run toward $0.9865.
$币安人生 #BinanceSquareCreator #BinanceSquare #CryptoMarket #AlphaGems
Note: This spot technical research and risk management journal is independent (DYOR).
160
Journal Spot $CRWVB (Stealth Box Floor-Test & Reclaim): 2-Tranche Plan 1D
Price $CRWVB berger moves at $86.6870 after the floor support test confirmation.
Price has completed the floor test sweep (Spring/Double-Bottom) with sell volume drying up, followed by a green Reclaim candle (0.34x above average) confirming the absorption of supply at the base of the box.
Execution Plan 2-Tranches:
• Tranche 1 (Floor Test & Reclaim): Area $84.0180 - $86.6870
• Tranche 2 (Scale-In Confirmation): Second floor test at $84.0180 OR a break through the consolidation ceiling above $90.4600
Risk limit is set at the 1D candle close below $81.5100. The main structural target is at the 30-day peak ($104.4000, RRR 5.0:1) to unwind half the position into USDT, while the remaining coins are allowed to run toward $170.7050.
$CRWVB #BinanceSquareCreator #BinanceSquare #CryptoMarket #AlphaGems
Note: Independent spot technical research and risk management journal (DYOR).
Journal Spot $CRWVB (Stealth Box Floor-Test & Reclaim): 2-Tranche Plan 1D
Price $CRWVB berger moves at $86.6870 after the floor support test confirmation.
Price has completed the floor test sweep (Spring/Double-Bottom) with sell volume drying up, followed by a green Reclaim candle (0.34x above average) confirming the absorption of supply at the base of the box.
Execution Plan 2-Tranches:
• Tranche 1 (Floor Test & Reclaim): Area $84.0180 - $86.6870
• Tranche 2 (Scale-In Confirmation): Second floor test at $84.0180 OR a break through the consolidation ceiling above $90.4600
Risk limit is set at the 1D candle close below $81.5100. The main structural target is at the 30-day peak ($104.4000, RRR 5.0:1) to unwind half the position into USDT, while the remaining coins are allowed to run toward $170.7050.
$CRWVB #BinanceSquareCreator #BinanceSquare #CryptoMarket #AlphaGems
Note: Independent spot technical research and risk management journal (DYOR).
Price $CRWVB berger moves at $86.6870 after the floor support test confirmation.
Price has completed the floor test sweep (Spring/Double-Bottom) with sell volume drying up, followed by a green Reclaim candle (0.34x above average) confirming the absorption of supply at the base of the box.
Execution Plan 2-Tranches:
• Tranche 1 (Floor Test & Reclaim): Area $84.0180 - $86.6870
• Tranche 2 (Scale-In Confirmation): Second floor test at $84.0180 OR a break through the consolidation ceiling above $90.4600
Risk limit is set at the 1D candle close below $81.5100. The main structural target is at the 30-day peak ($104.4000, RRR 5.0:1) to unwind half the position into USDT, while the remaining coins are allowed to run toward $170.7050.
$CRWVB #BinanceSquareCreator #BinanceSquare #CryptoMarket #AlphaGems
Note: Independent spot technical research and risk management journal (DYOR).
67
Spot Notes $Binance Life (Stealth VCP & Pocket Pivot): Structure 1D
$Binance Life price action moves around $0.5206, staying within the spot buy zone $0.4909 - $0.5206.
The price range tightens closely at the base of consolidation, then a Pocket Pivot candle appears with a volume push of 1.66x the average. Daily sell pressure starts to fade.
We limit risk by requiring the 1D candle close below $0.4698 so the position remains safe from a daily tail-sweep. The first structural target is at the 30-day high ($0.6258, reward-to-risk ratio 3.3:1) to liquidate half the position into USDT. The remaining coins we leave to run risk-free toward the $1.0115 area.
$Binance Life #BinanceSquareCreator #BinanceSquare #CryptoMarket #AlphaGems
Note: Independent technical research journal and spot risk management (DYOR).
Spot Notes $Binance Life (Stealth VCP & Pocket Pivot): Structure 1D
$Binance Life price action moves around $0.5206, staying within the spot buy zone $0.4909 - $0.5206.
The price range tightens closely at the base of consolidation, then a Pocket Pivot candle appears with a volume push of 1.66x the average. Daily sell pressure starts to fade.
We limit risk by requiring the 1D candle close below $0.4698 so the position remains safe from a daily tail-sweep. The first structural target is at the 30-day high ($0.6258, reward-to-risk ratio 3.3:1) to liquidate half the position into USDT. The remaining coins we leave to run risk-free toward the $1.0115 area.
$Binance Life #BinanceSquareCreator #BinanceSquare #CryptoMarket #AlphaGems
Note: Independent technical research journal and spot risk management (DYOR).
$Binance Life price action moves around $0.5206, staying within the spot buy zone $0.4909 - $0.5206.
The price range tightens closely at the base of consolidation, then a Pocket Pivot candle appears with a volume push of 1.66x the average. Daily sell pressure starts to fade.
We limit risk by requiring the 1D candle close below $0.4698 so the position remains safe from a daily tail-sweep. The first structural target is at the 30-day high ($0.6258, reward-to-risk ratio 3.3:1) to liquidate half the position into USDT. The remaining coins we leave to run risk-free toward the $1.0115 area.
$Binance Life #BinanceSquareCreator #BinanceSquare #CryptoMarket #AlphaGems
Note: Independent technical research journal and spot risk management (DYOR).
178
Drawdown Mathematics: Why We Limit Maximum Risk to 8 to 12 PercentPortfolio losses behave asymmetrically relative to the remaining capital. When capital drops by 10 percent, we need an increase of 11.1 percent to return to the starting point. If losses are allowed to widen to 50 percent, the portfolio requires a 100 percent increase to break even.
This simple calculation is the basis for why we set a cut-loss limit on the close of the daily candle in the range of 8 to 12 percent from the entry price. Cutting losing positions early keeps the USDT cash intact to be allocated to the next setup.
Drawdown Mathematics: Why We Limit Maximum Risk to 8 to 12 Percent
Portfolio losses behave asymmetrically relative to the remaining capital. When capital drops by 10 percent, we need an increase of 11.1 percent to return to the starting point. If losses are allowed to widen to 50 percent, the portfolio requires a 100 percent increase to break even.
This simple calculation is the basis for why we set a cut-loss limit on the close of the daily candle in the range of 8 to 12 percent from the entry price. Cutting losing positions early keeps the USDT cash intact to be allocated to the next setup.
This simple calculation is the basis for why we set a cut-loss limit on the close of the daily candle in the range of 8 to 12 percent from the entry price. Cutting losing positions early keeps the USDT cash intact to be allocated to the next setup.
120
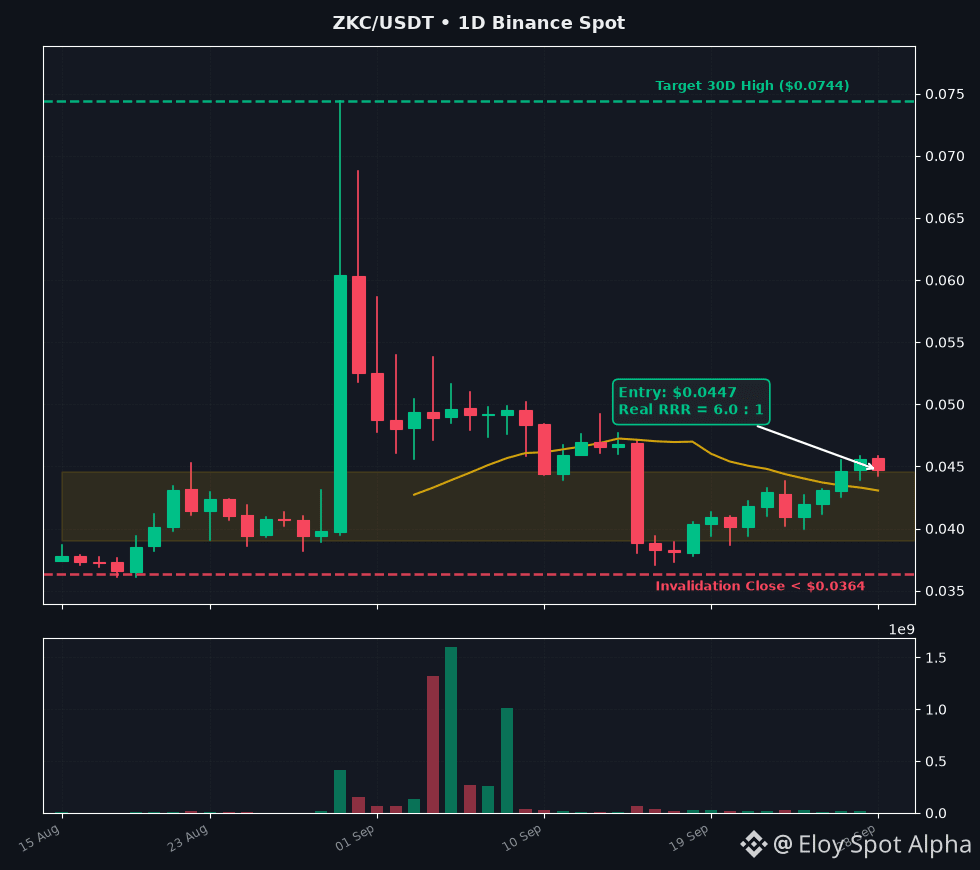
Wyckoff VSA Structure Notes $ZKC (1D):
Spot buyers absorb supply in the $0.0390 - $0.0445 support area, followed by a low-volume supply test.
We enter in stages within the $0.0390 to $0.0445 range, with an exit condition if the daily candle closes below $0.0364. The target to secure the initial capital is $0.0835 (return-to-risk ratio 6.0 : 1).
Independent spot transaction journal notes (DYOR).
#ZKC #BinanceSquare #WyckoffMethod #RiskManagement
Wyckoff VSA Structure Notes $ZKC (1D):
Spot buyers absorb supply in the $0.0390 - $0.0445 support area, followed by a low-volume supply test.
We enter in stages within the $0.0390 to $0.0445 range, with an exit condition if the daily candle closes below $0.0364. The target to secure the initial capital is $0.0835 (return-to-risk ratio 6.0 : 1).
Independent spot transaction journal notes (DYOR).
#ZKC #BinanceSquare #WyckoffMethod #RiskManagement
Spot buyers absorb supply in the $0.0390 - $0.0445 support area, followed by a low-volume supply test.
We enter in stages within the $0.0390 to $0.0445 range, with an exit condition if the daily candle closes below $0.0364. The target to secure the initial capital is $0.0835 (return-to-risk ratio 6.0 : 1).
Independent spot transaction journal notes (DYOR).
#ZKC #BinanceSquare #WyckoffMethod #RiskManagement
396
Spot Note $ZKC (Stealth Ascending Accumulation): Structure 1D
Price $ZKC is moving around $0.0445, within the spot buy zone $0.0390 - $0.0445.
After supply contraction at the lower price levels, spot buyers gradually lift the transaction floor through a series of Higher Lows with steady volume (0.64x the average). The liquidity circulating in the market is absorbed slowly before the price range widens.
We limit risk by using a 1D candle close below $0.0364 to keep the position safe from a daily tail sweep. The first structural target is at the 30-day high ($0.0744, reward-to-risk ratio 6.0:1) to liquidate half the position into USDT. We let the remaining coins run freely with no risk toward the $0.0835 area.
$ZKC #BinanceSquareCreator #BinanceSquare #CryptoMarket #AlphaGems
Note: Technical research journal and independent spot risk management (DYOR).
Spot Note $ZKC (Stealth Ascending Accumulation): Structure 1D
Price $ZKC is moving around $0.0445, within the spot buy zone $0.0390 - $0.0445.
After supply contraction at the lower price levels, spot buyers gradually lift the transaction floor through a series of Higher Lows with steady volume (0.64x the average). The liquidity circulating in the market is absorbed slowly before the price range widens.
We limit risk by using a 1D candle close below $0.0364 to keep the position safe from a daily tail sweep. The first structural target is at the 30-day high ($0.0744, reward-to-risk ratio 6.0:1) to liquidate half the position into USDT. We let the remaining coins run freely with no risk toward the $0.0835 area.
$ZKC #BinanceSquareCreator #BinanceSquare #CryptoMarket #AlphaGems
Note: Technical research journal and independent spot risk management (DYOR).
Price $ZKC is moving around $0.0445, within the spot buy zone $0.0390 - $0.0445.
After supply contraction at the lower price levels, spot buyers gradually lift the transaction floor through a series of Higher Lows with steady volume (0.64x the average). The liquidity circulating in the market is absorbed slowly before the price range widens.
We limit risk by using a 1D candle close below $0.0364 to keep the position safe from a daily tail sweep. The first structural target is at the 30-day high ($0.0744, reward-to-risk ratio 6.0:1) to liquidate half the position into USDT. We let the remaining coins run freely with no risk toward the $0.0835 area.
$ZKC #BinanceSquareCreator #BinanceSquare #CryptoMarket #AlphaGems
Note: Technical research journal and independent spot risk management (DYOR).
131
Reading the Wyckoff Accumulation Cycle: Why Candle Ranges Tighten at the Support FloorA change in price movement from a sharp drop to a flat, sideways range indicates the early formation of an accumulation floor.
When price enters a consolidation period, observe the distance between the daily highest and lowest points (the spread). The candle range that grows progressively tighter shows that a queue of limit buys in the lower area successfully holds off the sell-side pressure.
The baseline formed in this phase becomes our reference for the exit limit of a position. As long as the daily candles remain above this floor along with a selling volume that eases, the underlying structure remains intact.
Reading the Wyckoff Accumulation Cycle: Why Candle Ranges Tighten at the Support Floor
A change in price movement from a sharp drop to a flat, sideways range indicates the early formation of an accumulation floor.
When price enters a consolidation period, observe the distance between the daily highest and lowest points (the spread). The candle range that grows progressively tighter shows that a queue of limit buys in the lower area successfully holds off the sell-side pressure.
The baseline formed in this phase becomes our reference for the exit limit of a position. As long as the daily candles remain above this floor along with a selling volume that eases, the underlying structure remains intact.
When price enters a consolidation period, observe the distance between the daily highest and lowest points (the spread). The candle range that grows progressively tighter shows that a queue of limit buys in the lower area successfully holds off the sell-side pressure.
The baseline formed in this phase becomes our reference for the exit limit of a position. As long as the daily candles remain above this floor along with a selling volume that eases, the underlying structure remains intact.
69
Wyckoff VSA Analysis $ZKC (1D Timeframe):
An accumulation structure formed in the support area $0.0388 - $0.0442 after absorption and a test of dry supply.
Trading Plan:
• Accumulation: $0.0388 - $0.0442
• Cut Loss: < $0.0362
• TP1 Target: $0.0830
• R:R Ratio: 6.2 : 1
Not a buy invitation. Always manage your own risk (DYOR).
#ZKC #BinanceSquare #WyckoffMethod #RiskManagement
Wyckoff VSA Analysis $ZKC (1D Timeframe):
An accumulation structure formed in the support area $0.0388 - $0.0442 after absorption and a test of dry supply.
Trading Plan:
• Accumulation: $0.0388 - $0.0442
• Cut Loss: < $0.0362
• TP1 Target: $0.0830
• R:R Ratio: 6.2 : 1
Not a buy invitation. Always manage your own risk (DYOR).
#ZKC #BinanceSquare #WyckoffMethod #RiskManagement
An accumulation structure formed in the support area $0.0388 - $0.0442 after absorption and a test of dry supply.
Trading Plan:
• Accumulation: $0.0388 - $0.0442
• Cut Loss: < $0.0362
• TP1 Target: $0.0830
• R:R Ratio: 6.2 : 1
Not a buy invitation. Always manage your own risk (DYOR).
#ZKC #BinanceSquare #WyckoffMethod #RiskManagement
255
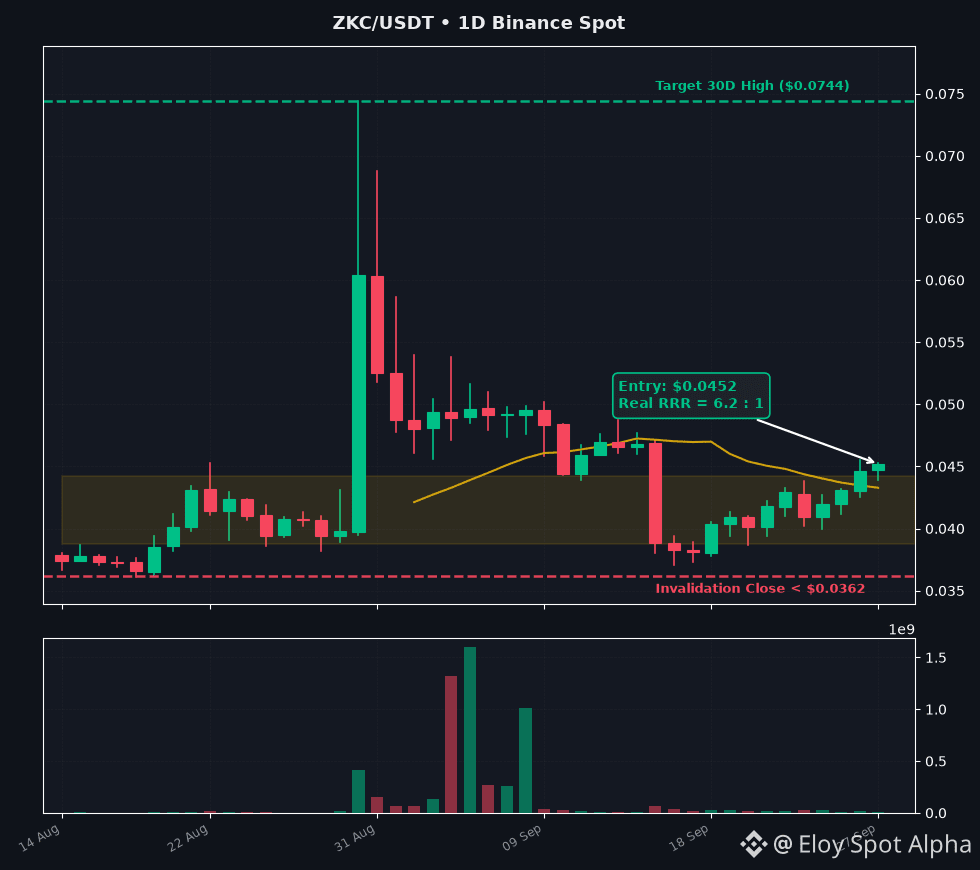
Structure Analysis $ZKC (Stealth Ascending Accumulation): Testing Support 1D in the Spot Market
Wyckoff VSA structure scanning places $ZKC in the accumulation confirmation phase (Stealth Ascending Accumulation). The current price is moving around $0.0442 within the accumulation range $0.0388 - $0.0442.
Daily structure characteristics:
After the supply contraction phase dries up in the base area, price forms a staircase structure of Higher Lows and consecutive positive closes above quiet volume (0.60x baseline). This structure reflects gradual absorption in the spot market before a volatility expansion.
Risk Management & Staged Exit Strategy:
• The structural invalidation threshold is locked at a 1D candle close below $0.0362 (avoiding intra-day tail/wick sweeps).
• The main structural target at the 30D High resistance is $0.0744 (Real RRR 6.2:1) to secure 50% of the position, followed by a target of $0.0830 (2x) for the Risk-Free Moonbag portion.
$ZKC #BinanceSquareCreator #BinanceSquare #CryptoMarket #AlphaGems
Note: Not an invitation to buy or sell crypto assets (DYOR). Independent technical structure analysis and risk management.
Structure Analysis $ZKC (Stealth Ascending Accumulation): Testing Support 1D in the Spot Market
Wyckoff VSA structure scanning places $ZKC in the accumulation confirmation phase (Stealth Ascending Accumulation). The current price is moving around $0.0442 within the accumulation range $0.0388 - $0.0442.
Daily structure characteristics:
After the supply contraction phase dries up in the base area, price forms a staircase structure of Higher Lows and consecutive positive closes above quiet volume (0.60x baseline). This structure reflects gradual absorption in the spot market before a volatility expansion.
Risk Management & Staged Exit Strategy:
• The structural invalidation threshold is locked at a 1D candle close below $0.0362 (avoiding intra-day tail/wick sweeps).
• The main structural target at the 30D High resistance is $0.0744 (Real RRR 6.2:1) to secure 50% of the position, followed by a target of $0.0830 (2x) for the Risk-Free Moonbag portion.
$ZKC #BinanceSquareCreator #BinanceSquare #CryptoMarket #AlphaGems
Note: Not an invitation to buy or sell crypto assets (DYOR). Independent technical structure analysis and risk management.
Wyckoff VSA structure scanning places $ZKC in the accumulation confirmation phase (Stealth Ascending Accumulation). The current price is moving around $0.0442 within the accumulation range $0.0388 - $0.0442.
Daily structure characteristics:
After the supply contraction phase dries up in the base area, price forms a staircase structure of Higher Lows and consecutive positive closes above quiet volume (0.60x baseline). This structure reflects gradual absorption in the spot market before a volatility expansion.
Risk Management & Staged Exit Strategy:
• The structural invalidation threshold is locked at a 1D candle close below $0.0362 (avoiding intra-day tail/wick sweeps).
• The main structural target at the 30D High resistance is $0.0744 (Real RRR 6.2:1) to secure 50% of the position, followed by a target of $0.0830 (2x) for the Risk-Free Moonbag portion.
$ZKC #BinanceSquareCreator #BinanceSquare #CryptoMarket #AlphaGems
Note: Not an invitation to buy or sell crypto assets (DYOR). Independent technical structure analysis and risk management.
58
Wyckoff VSA Analysis $HEMI (1D Timeframe):
An accumulation structure has formed in the support area $0.0061 - $0.0069 following absorption and a test of the dry supply.
Trading Plan:
• Accumulation: $0.0061 - $0.0069
• Cut Loss: < $0.0057
• TP1 Target: $0.0129
• R:R Ratio: 20.9 : 1
Not a buy recommendation. Always manage your own risk (DYOR).
#HEMI #BinanceSquare #WyckoffMethod #RiskManagement
Wyckoff VSA Analysis $HEMI (1D Timeframe):
An accumulation structure has formed in the support area $0.0061 - $0.0069 following absorption and a test of the dry supply.
Trading Plan:
• Accumulation: $0.0061 - $0.0069
• Cut Loss: < $0.0057
• TP1 Target: $0.0129
• R:R Ratio: 20.9 : 1
Not a buy recommendation. Always manage your own risk (DYOR).
#HEMI #BinanceSquare #WyckoffMethod #RiskManagement
An accumulation structure has formed in the support area $0.0061 - $0.0069 following absorption and a test of the dry supply.
Trading Plan:
• Accumulation: $0.0061 - $0.0069
• Cut Loss: < $0.0057
• TP1 Target: $0.0129
• R:R Ratio: 20.9 : 1
Not a buy recommendation. Always manage your own risk (DYOR).
#HEMI #BinanceSquare #WyckoffMethod #RiskManagement
569
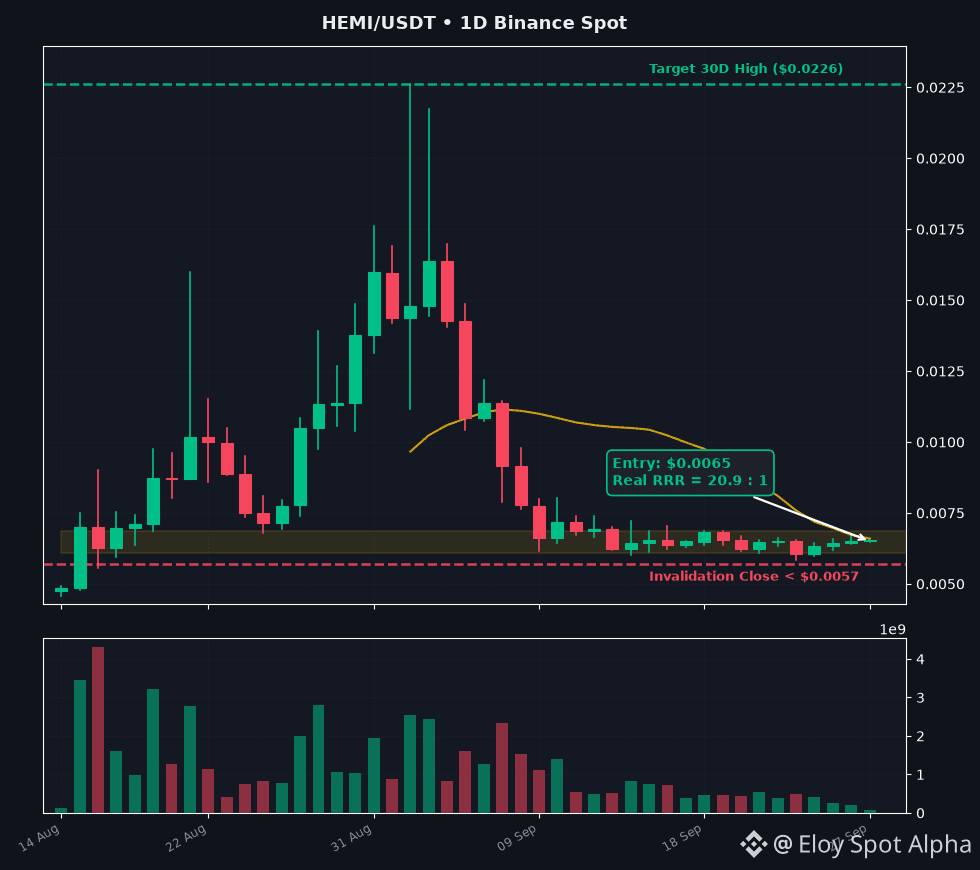
Structure Analysis $HEMI (Stealth Ascending Accumulation): Testing Support 1D in the Spot Market
Wyckoff VSA structure scanning places $HEMI in the confirmation phase of accumulation (Stealth Ascending Accumulation). The current price is moving around $0.00686, within the accumulation range area of $0.00609 - $0.00686.
Daily structure characteristics:
After the supply contraction phase dries up in the base area, the price forms a staircase structure of Higher Lows and consecutive positive closes above calm-volume (0.32x baseline). This structure reflects gradual absorption in the spot market before a volatility expansion.
Risk Management & Staggered Exit Strategy:
• The structural invalidation threshold is locked at the 1D candle close below $0.00570 (avoiding intra-day tail/wick sweeps).
• The main structural target at the 30D High resistance is $0.0226 (Real RRR 20.9:1) to secure 50% of the position, followed by a target of $0.0129 (2x) for the Risk-Free Moonbag portion.
$HEMI #BinanceSquareCreator #BinanceSquare #CryptoMarket #AlphaGems
Note: Not a solicitation to buy or sell crypto assets (DYOR). Independent technical structure analysis and risk management.
Structure Analysis $HEMI (Stealth Ascending Accumulation): Testing Support 1D in the Spot Market
Wyckoff VSA structure scanning places $HEMI in the confirmation phase of accumulation (Stealth Ascending Accumulation). The current price is moving around $0.00686, within the accumulation range area of $0.00609 - $0.00686.
Daily structure characteristics:
After the supply contraction phase dries up in the base area, the price forms a staircase structure of Higher Lows and consecutive positive closes above calm-volume (0.32x baseline). This structure reflects gradual absorption in the spot market before a volatility expansion.
Risk Management & Staggered Exit Strategy:
• The structural invalidation threshold is locked at the 1D candle close below $0.00570 (avoiding intra-day tail/wick sweeps).
• The main structural target at the 30D High resistance is $0.0226 (Real RRR 20.9:1) to secure 50% of the position, followed by a target of $0.0129 (2x) for the Risk-Free Moonbag portion.
$HEMI #BinanceSquareCreator #BinanceSquare #CryptoMarket #AlphaGems
Note: Not a solicitation to buy or sell crypto assets (DYOR). Independent technical structure analysis and risk management.
Wyckoff VSA structure scanning places $HEMI in the confirmation phase of accumulation (Stealth Ascending Accumulation). The current price is moving around $0.00686, within the accumulation range area of $0.00609 - $0.00686.
Daily structure characteristics:
After the supply contraction phase dries up in the base area, the price forms a staircase structure of Higher Lows and consecutive positive closes above calm-volume (0.32x baseline). This structure reflects gradual absorption in the spot market before a volatility expansion.
Risk Management & Staggered Exit Strategy:
• The structural invalidation threshold is locked at the 1D candle close below $0.00570 (avoiding intra-day tail/wick sweeps).
• The main structural target at the 30D High resistance is $0.0226 (Real RRR 20.9:1) to secure 50% of the position, followed by a target of $0.0129 (2x) for the Risk-Free Moonbag portion.
$HEMI #BinanceSquareCreator #BinanceSquare #CryptoMarket #AlphaGems
Note: Not a solicitation to buy or sell crypto assets (DYOR). Independent technical structure analysis and risk management.
1
263
Log in to explore more content
Join global crypto users on Binance Square
⚡️ Get latest and useful information about crypto.
💬 Trusted by the world’s largest crypto exchange.
👍 Discover real insights from verified creators.
Email / Phone number