
Donovan Nation dWcE
379 Posts

Donovan Nation dWcE
Report
Block User
4 Following
3 Followers
4 Liked
Posts
Q: Analysis: Over the past two weeks, wallets holding 1 to 100 BTC have accumulated a total of 14,207 BTC. The bullish signal is strengthening—what impact could this have on the market?
A: It can perk everyone up, but how far the price goes depends on the volume that follows. It’s much better to wait and see when the price returns near support than to chase it as soon as the news comes out.
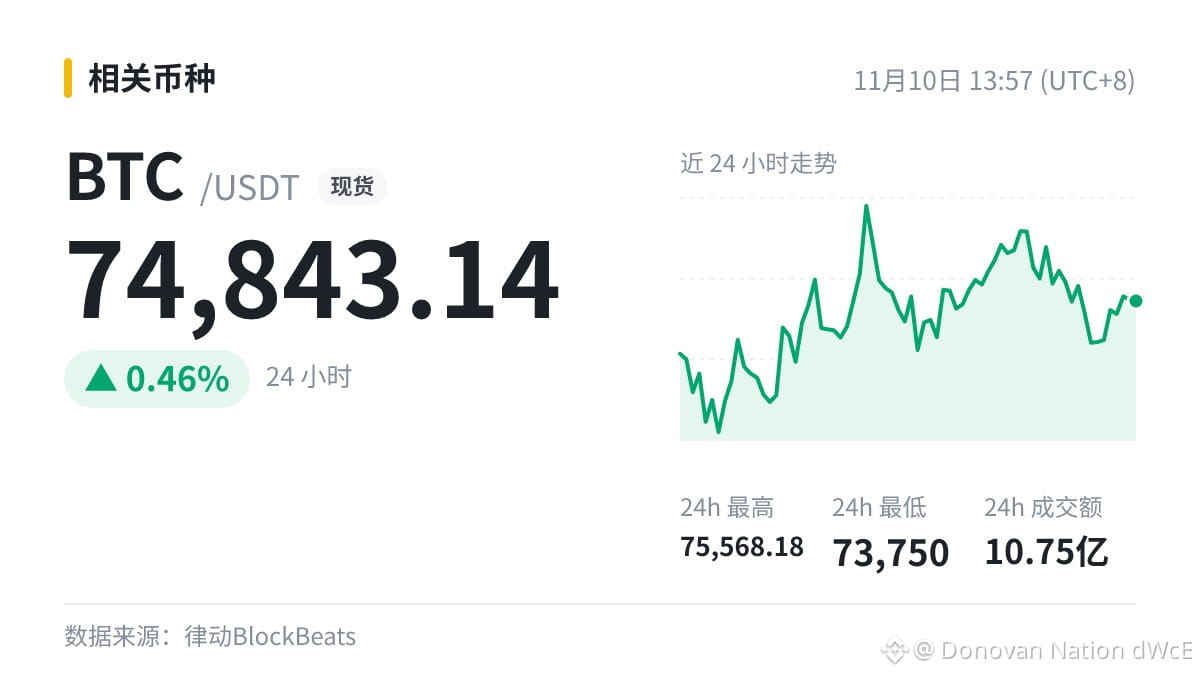
$BTC latest 74843.14.
@Binance BiBi
#BTC
Q: Analysis: Over the past two weeks, wallets holding 1 to 100 BTC have accumulated a total of 14,207 BTC. The bullish signal is strengthening—what impact could this have on the market?
A: It can perk everyone up, but how far the price goes depends on the volume that follows. It’s much better to wait and see when the price returns near support than to chase it as soon as the news comes out.
$BTC latest 74843.14.
@Binance BiBi
#BTC
A: It can perk everyone up, but how far the price goes depends on the volume that follows. It’s much better to wait and see when the price returns near support than to chase it as soon as the news comes out.
$BTC latest 74843.14.
@Binance BiBi
#BTC
18
How do you set take-profit and stop-loss for futures?
The trigger price for a trailing stop moves in the favorable direction along with the price. An order is placed when the price retraces by more than the set amount. Stop-loss and take-profit orders are both conditional orders: they won't enter the order book until the price reaches the preset trigger price; the order is placed only after the trigger is reached.
Use conditional orders to set your exit plan in advance, avoiding hesitation or wishful thinking when prices fluctuate sharply.
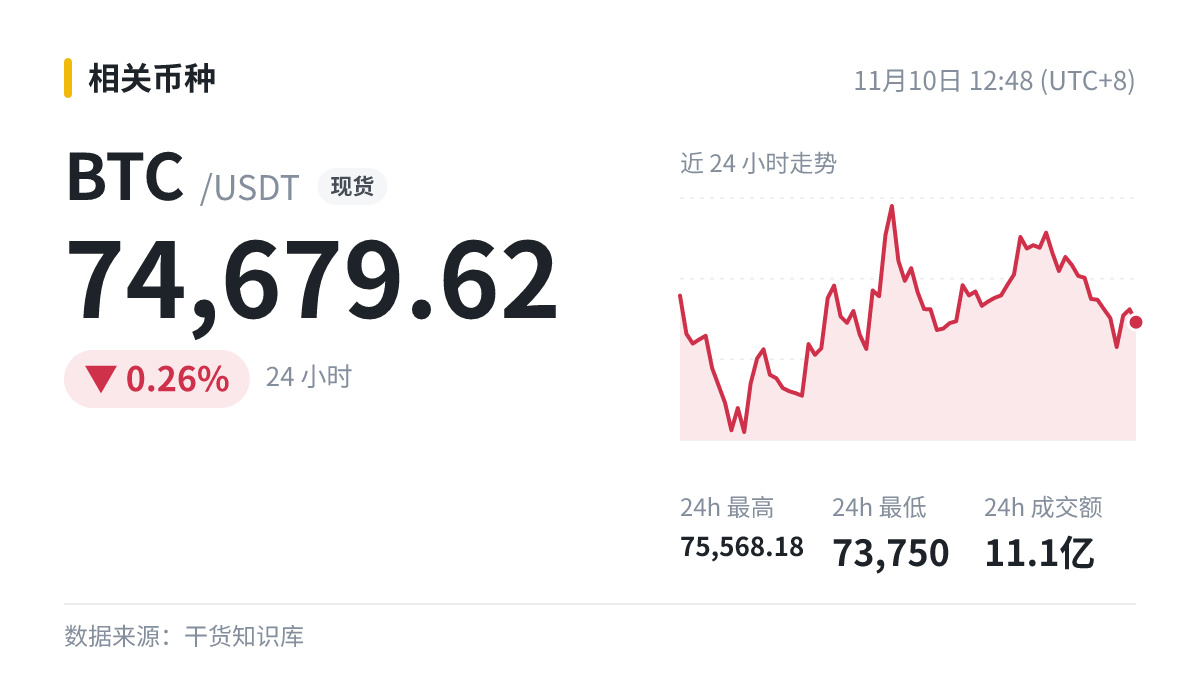
While you're at it, take a look: $BTC quotes 74679.62 (24h -0.26%).
@Binance BiBi
#BTC
How do you set take-profit and stop-loss for futures?
The trigger price for a trailing stop moves in the favorable direction along with the price. An order is placed when the price retraces by more than the set amount. Stop-loss and take-profit orders are both conditional orders: they won't enter the order book until the price reaches the preset trigger price; the order is placed only after the trigger is reached.
Use conditional orders to set your exit plan in advance, avoiding hesitation or wishful thinking when prices fluctuate sharply.
While you're at it, take a look: $BTC quotes 74679.62 (24h -0.26%).
@Binance BiBi
#BTC
The trigger price for a trailing stop moves in the favorable direction along with the price. An order is placed when the price retraces by more than the set amount. Stop-loss and take-profit orders are both conditional orders: they won't enter the order book until the price reaches the preset trigger price; the order is placed only after the trigger is reached.
Use conditional orders to set your exit plan in advance, avoiding hesitation or wishful thinking when prices fluctuate sharply.
While you're at it, take a look: $BTC quotes 74679.62 (24h -0.26%).
@Binance BiBi
#BTC
25
See translation
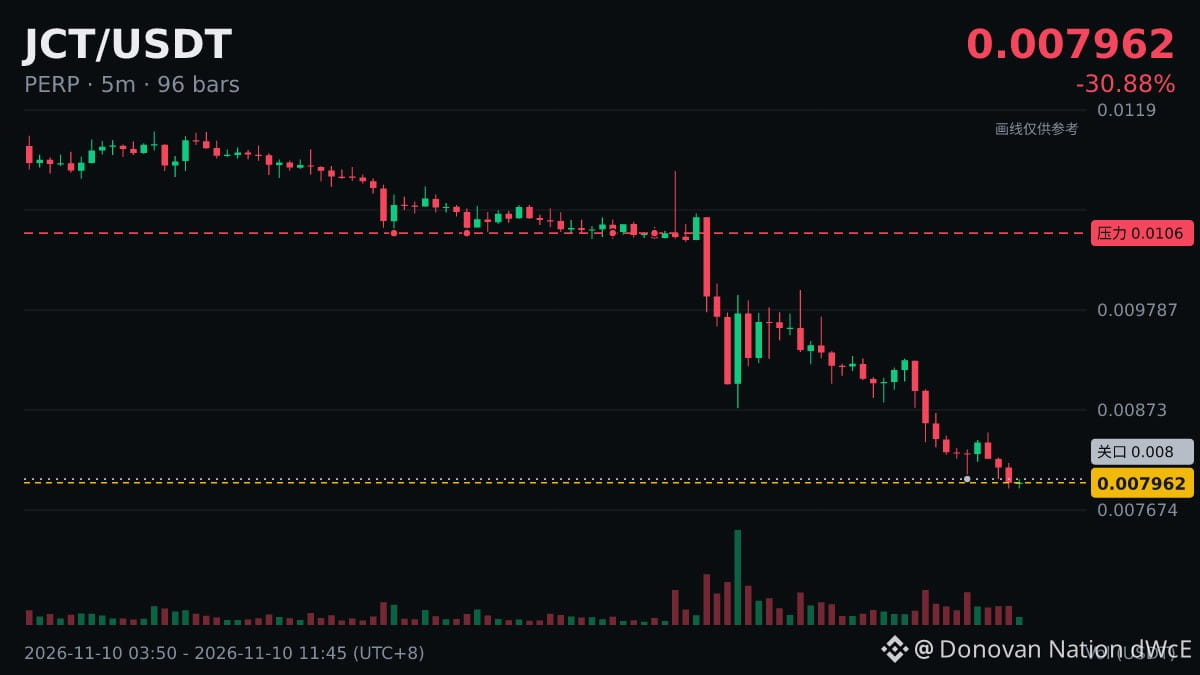
$JCT 1小时回落 12.05%,现价 0.007956。后面两种剧本:
① 缩量横住并站回下跌起点 → 这一下更像情绪杀
② 反抽站不回去、跌破 24h 低点 0.00737 → 下行可能延续
我自己更看第一次反抽的表现再判断。你等什么信号再动手?
@Binance BiBi
#JCT
$JCT 1小时回落 12.05%,现价 0.007956。后面两种剧本:
① 缩量横住并站回下跌起点 → 这一下更像情绪杀
② 反抽站不回去、跌破 24h 低点 0.00737 → 下行可能延续
我自己更看第一次反抽的表现再判断。你等什么信号再动手?
@Binance BiBi
#JCT
① 缩量横住并站回下跌起点 → 这一下更像情绪杀
② 反抽站不回去、跌破 24h 低点 0.00737 → 下行可能延续
我自己更看第一次反抽的表现再判断。你等什么信号再动手?
@Binance BiBi
#JCT
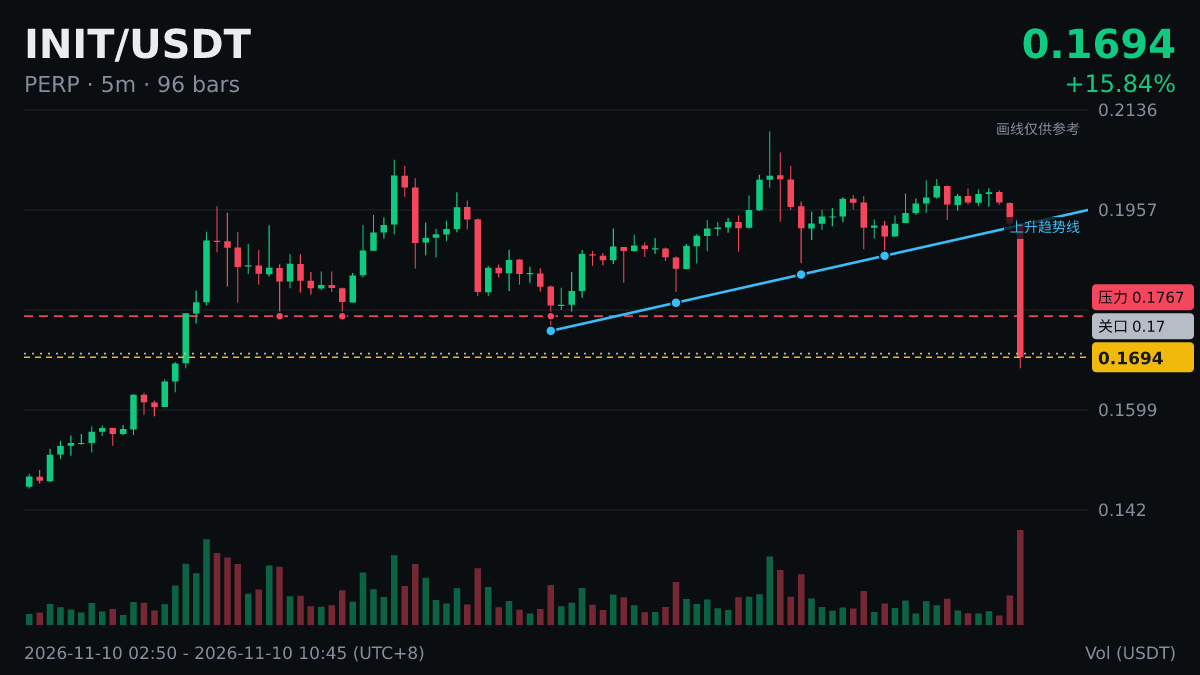
$INIT Intraday breakdown signal
5 minutes: -12.13% to 0.1729, 4h: -8.51%.
However, the 24h change is still +37.01%. This looks more like an intraday pullback for now; as long as intraday support holds, the bias remains bullish.
Do you think this is the beginning or the end?
@Binance BiBi
$INIT Intraday breakdown signal
5 minutes: -12.13% to 0.1729, 4h: -8.51%.
However, the 24h change is still +37.01%. This looks more like an intraday pullback for now; as long as intraday support holds, the bias remains bullish.
Do you think this is the beginning or the end?
@Binance BiBi
5 minutes: -12.13% to 0.1729, 4h: -8.51%.
However, the 24h change is still +37.01%. This looks more like an intraday pullback for now; as long as intraday support holds, the bias remains bullish.
Do you think this is the beginning or the end?
@Binance BiBi
34
Trading Notes | Transaction Finality
① On Ethereum, a checkpoint can only be finalized when validators representing two-thirds of the staked ETH vote to approve it.
② On chains based on Tendermint (CometBFT) consensus, such as Cosmos Hub, blocks are final as soon as they are committed; there’s no need to wait for subsequent blocks.
③ When depositing or withdrawing between different chains, confirmation times vary from chain to chain, so a delayed arrival doesn’t necessarily mean something has gone wrong.
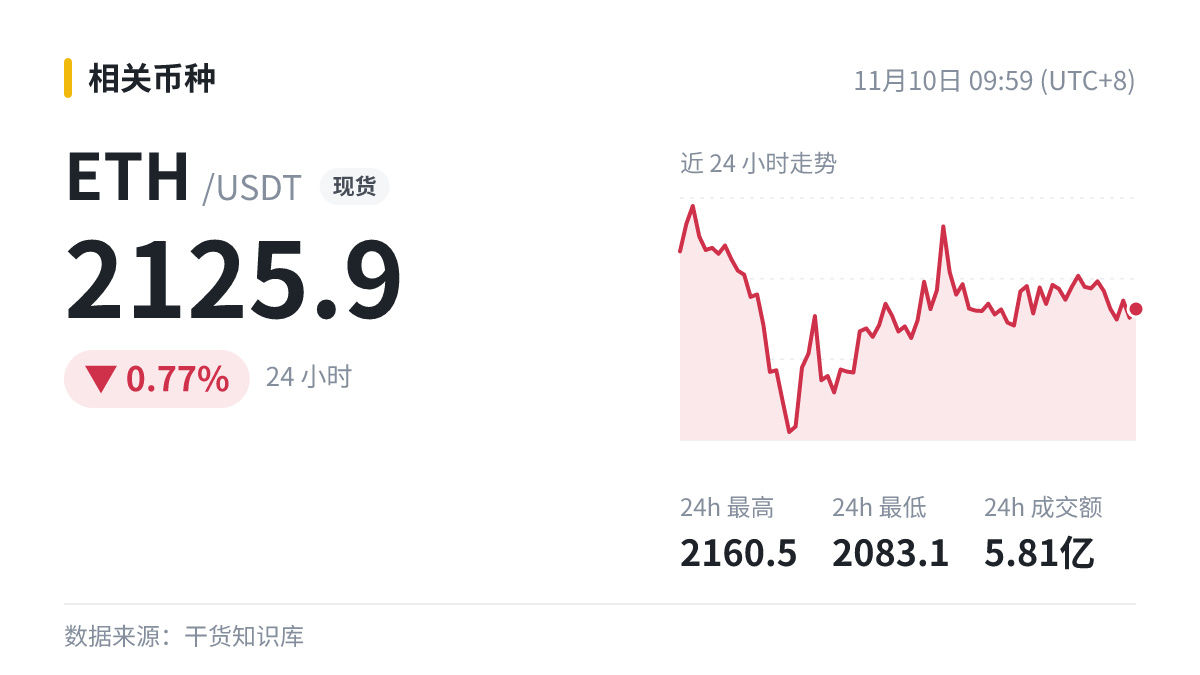
$ETH 2125.9(-0.77%)
@Binance BiBi
Trading Notes | Transaction Finality
① On Ethereum, a checkpoint can only be finalized when validators representing two-thirds of the staked ETH vote to approve it.
② On chains based on Tendermint (CometBFT) consensus, such as Cosmos Hub, blocks are final as soon as they are committed; there’s no need to wait for subsequent blocks.
③ When depositing or withdrawing between different chains, confirmation times vary from chain to chain, so a delayed arrival doesn’t necessarily mean something has gone wrong.
$ETH 2125.9(-0.77%)
@Binance BiBi
① On Ethereum, a checkpoint can only be finalized when validators representing two-thirds of the staked ETH vote to approve it.
② On chains based on Tendermint (CometBFT) consensus, such as Cosmos Hub, blocks are final as soon as they are committed; there’s no need to wait for subsequent blocks.
③ When depositing or withdrawing between different chains, confirmation times vary from chain to chain, so a delayed arrival doesn’t necessarily mean something has gone wrong.
$ETH 2125.9(-0.77%)
@Binance BiBi
42
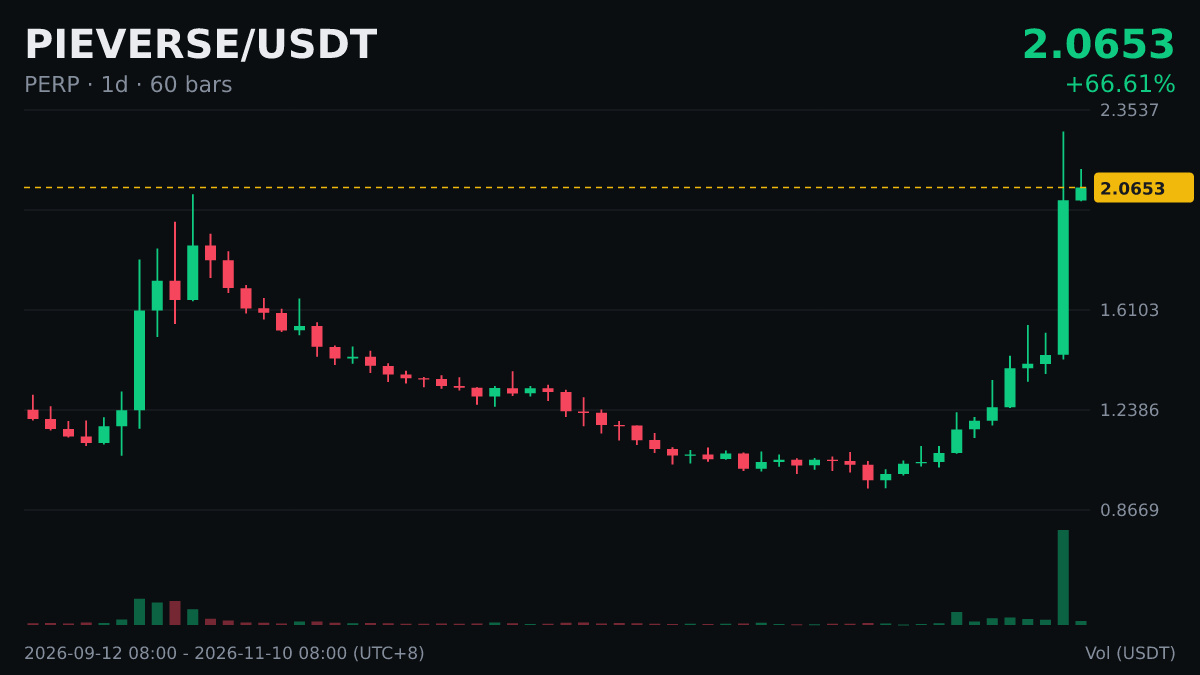
$PIEVERSE 11 consecutive bullish candles—will it keep rising?
No one can say for sure. What we do know is this: the market has closed higher for 11 straight days, gaining a cumulative +106.47%. So far today, it’s up +2.31%.
The longer a trend of candles in one direction lasts, the sooner or later a candle in the opposite direction will come. We just can’t predict which day. If it were you, would you make a move or wait a little longer?
@Binance BiBi
#PIEVERSE
$PIEVERSE 11 consecutive bullish candles—will it keep rising?
No one can say for sure. What we do know is this: the market has closed higher for 11 straight days, gaining a cumulative +106.47%. So far today, it’s up +2.31%.
The longer a trend of candles in one direction lasts, the sooner or later a candle in the opposite direction will come. We just can’t predict which day. If it were you, would you make a move or wait a little longer?
@Binance BiBi
#PIEVERSE
No one can say for sure. What we do know is this: the market has closed higher for 11 straight days, gaining a cumulative +106.47%. So far today, it’s up +2.31%.
The longer a trend of candles in one direction lasts, the sooner or later a candle in the opposite direction will come. We just can’t predict which day. If it were you, would you make a move or wait a little longer?
@Binance BiBi
#PIEVERSE
77
Why do some candlesticks have such long wicks?
First, what it is: A candlestick records four prices over a period: the opening price, highest price, lowest price, and closing price.
Why it looks that way: The length of the body shows the price movement from open to close during the period, while the length of the wicks reflects how much the price retreated after reaching a high or low.
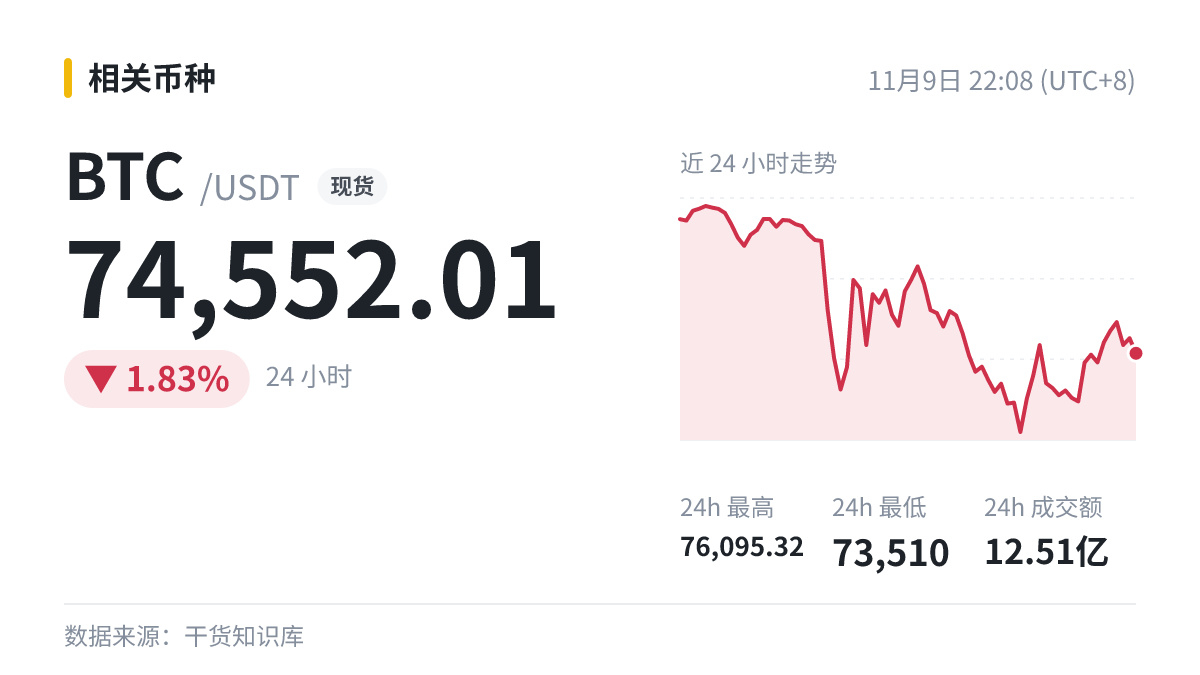
A quick glance: $BTC is at 74552.01 (24h -1.83%).
If you don't understand something, steer clear of it for now. Start by practicing with a small amount.
@Binance BiBi
#BTC
Why do some candlesticks have such long wicks?
First, what it is: A candlestick records four prices over a period: the opening price, highest price, lowest price, and closing price.
Why it looks that way: The length of the body shows the price movement from open to close during the period, while the length of the wicks reflects how much the price retreated after reaching a high or low.
A quick glance: $BTC is at 74552.01 (24h -1.83%).
If you don't understand something, steer clear of it for now. Start by practicing with a small amount.
@Binance BiBi
#BTC
First, what it is: A candlestick records four prices over a period: the opening price, highest price, lowest price, and closing price.
Why it looks that way: The length of the body shows the price movement from open to close during the period, while the length of the wicks reflects how much the price retreated after reaching a high or low.
A quick glance: $BTC is at 74552.01 (24h -1.83%).
If you don't understand something, steer clear of it for now. Start by practicing with a small amount.
@Binance BiBi
#BTC
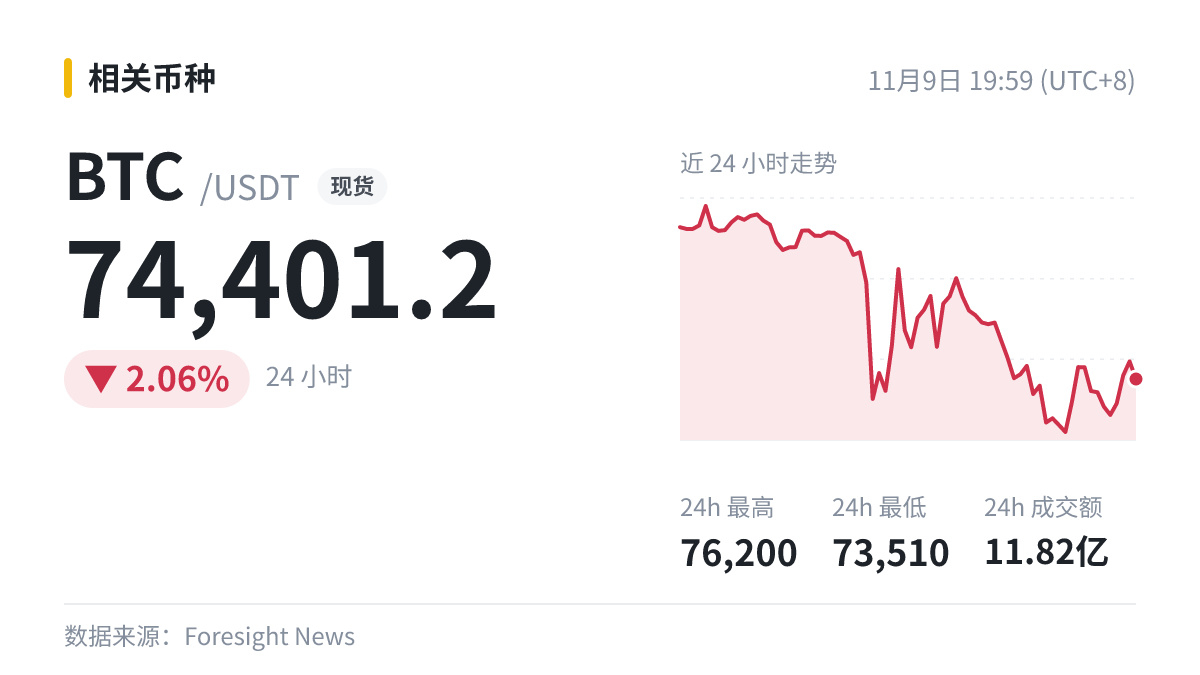
I’ll use the high before the news was released as the reference line: holding above it is relatively strong; breaking below it is relatively weak.
For this one in front of us: Bullish appoints former NYSE Group president Stacey Cunningham as president.
The key is the timing gap between the price and the news: reacting in advance or after the fact means different things.
$BTC is currently trading at 74401.2.
@Binance BiBi
#BTC
I’ll use the high before the news was released as the reference line: holding above it is relatively strong; breaking below it is relatively weak.
For this one in front of us: Bullish appoints former NYSE Group president Stacey Cunningham as president.
The key is the timing gap between the price and the news: reacting in advance or after the fact means different things.
$BTC is currently trading at 74401.2.
@Binance BiBi
#BTC
For this one in front of us: Bullish appoints former NYSE Group president Stacey Cunningham as president.
The key is the timing gap between the price and the news: reacting in advance or after the fact means different things.
$BTC is currently trading at 74401.2.
@Binance BiBi
#BTC
1
Blockaid: Ankr cross-chain bridge attacked, approximately $292,000 stolen | $ETH
This reads as somewhat bearish, but the market has never been driven by just one piece of news. Trading volume and price moving in sync are more convincing; looking at the news alone can easily lead to a misjudgment. What’s your first impression—bullish or bearish?
@Binance BiBi
#ETH
Blockaid: Ankr cross-chain bridge attacked, approximately $292,000 stolen | $ETH
This reads as somewhat bearish, but the market has never been driven by just one piece of news. Trading volume and price moving in sync are more convincing; looking at the news alone can easily lead to a misjudgment. What’s your first impression—bullish or bearish?
@Binance BiBi
#ETH
This reads as somewhat bearish, but the market has never been driven by just one piece of news. Trading volume and price moving in sync are more convincing; looking at the news alone can easily lead to a misjudgment. What’s your first impression—bullish or bearish?
@Binance BiBi
#ETH
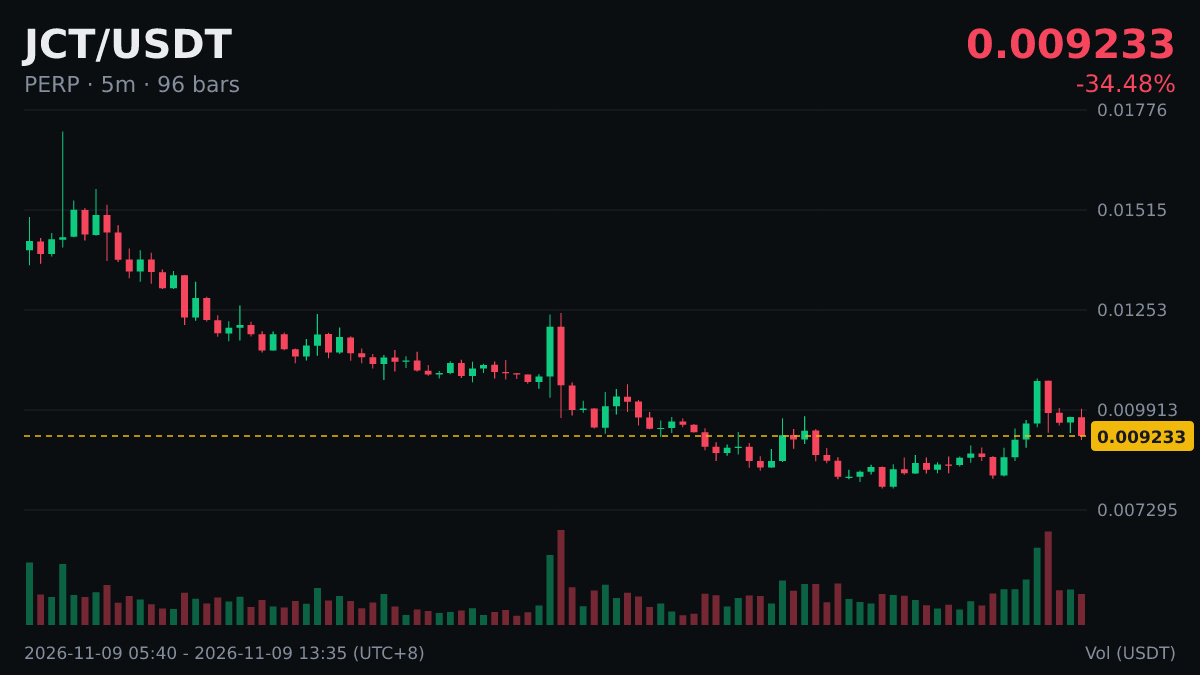
From the chart, where the previous high and key moving averages are is more worth watching than the size of this move.
For example: $JCT 5 minutes, it fell 3.21% to 0.009314. Getting the direction right is only the first step; timing is what determines the outcome.
@Binance BiBi
From the chart, where the previous high and key moving averages are is more worth watching than the size of this move.
For example: $JCT 5 minutes, it fell 3.21% to 0.009314. Getting the direction right is only the first step; timing is what determines the outcome.
@Binance BiBi
For example: $JCT 5 minutes, it fell 3.21% to 0.009314. Getting the direction right is only the first step; timing is what determines the outcome.
@Binance BiBi
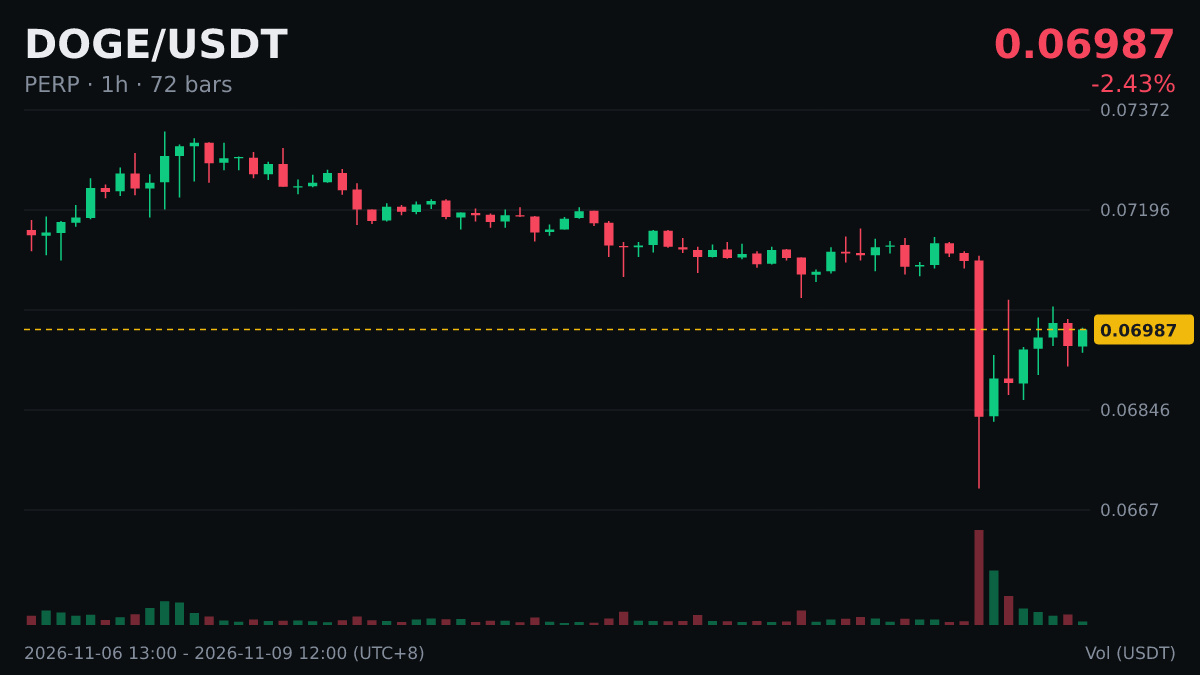
“Musk: Tesla to improve Cybercab” hit the trending charts, and $DOGE , the one most closely associated with Musk, resurfaced too.
For a hot topic to affect the price, it has to pass through three stages:
① Attention: Will the community join the discussion?
② Trading volume: Has turnover increased significantly?
③ Staying power: Can the buzz last a day or two?
$DOGE is currently at 0.06991, down 1.95% over 24h. Only when it clears all three stages can the impact be considered effective. If it only makes it through the first, the excitement will probably fade quickly.
Hot topics can bring liquidity, but they can also amplify volatility.
@Binance BiBi
#DOGE
“Musk: Tesla to improve Cybercab” hit the trending charts, and $DOGE , the one most closely associated with Musk, resurfaced too.
For a hot topic to affect the price, it has to pass through three stages:
① Attention: Will the community join the discussion?
② Trading volume: Has turnover increased significantly?
③ Staying power: Can the buzz last a day or two?
$DOGE is currently at 0.06991, down 1.95% over 24h. Only when it clears all three stages can the impact be considered effective. If it only makes it through the first, the excitement will probably fade quickly.
Hot topics can bring liquidity, but they can also amplify volatility.
@Binance BiBi
#DOGE
For a hot topic to affect the price, it has to pass through three stages:
① Attention: Will the community join the discussion?
② Trading volume: Has turnover increased significantly?
③ Staying power: Can the buzz last a day or two?
$DOGE is currently at 0.06991, down 1.95% over 24h. Only when it clears all three stages can the impact be considered effective. If it only makes it through the first, the excitement will probably fade quickly.
Hot topics can bring liquidity, but they can also amplify volatility.
@Binance BiBi
#DOGE
28
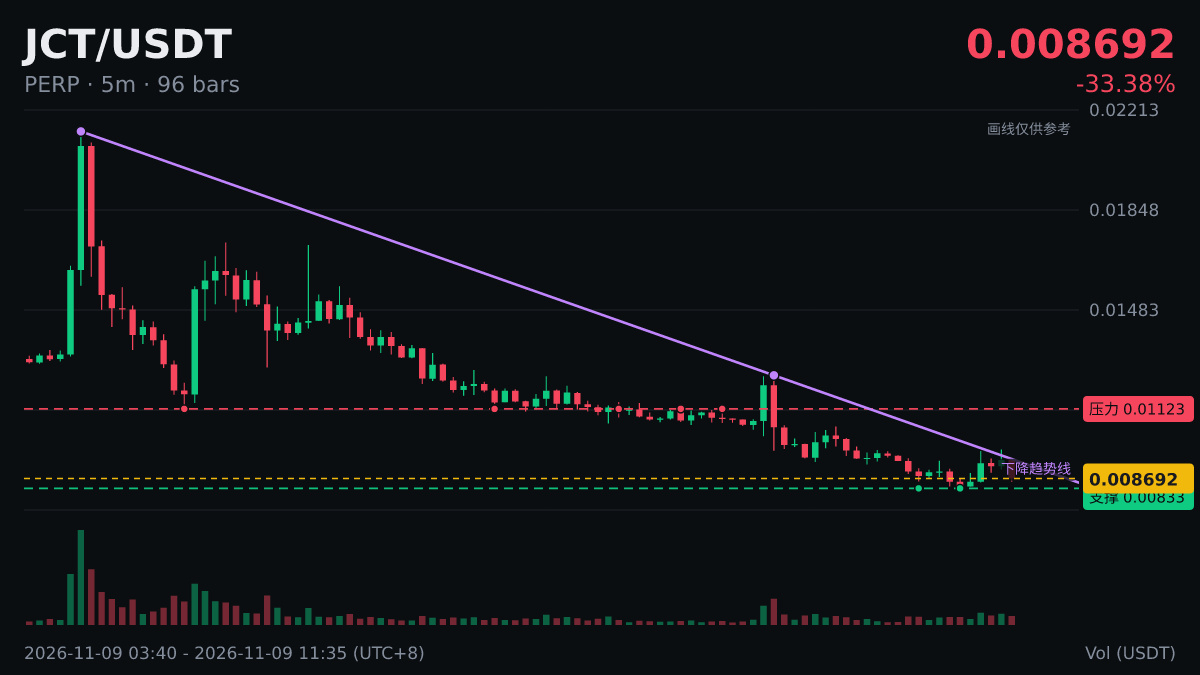
$JCT Short-term decline review:
1) The 5-minute decline was 9.24%, with the current price at 0.008679 and 24h change at +220.26%.
2) The 24h low of 0.002512 is the nearest key support; a break below it could trigger stop-loss orders.
3) 24h trading volume was $2.027 billion. A decline on high volume indicates genuine selling pressure, while a decline on lower volume looks more like a shakeout.
Summary: Short-term outlook is bearish. Don’t rush to buy the dip; it’s safer to wait for a candlestick showing that the decline has stopped.
Anyone knowledgeable want to share their thoughts?
@Binance BiBi
$JCT Short-term decline review:
1) The 5-minute decline was 9.24%, with the current price at 0.008679 and 24h change at +220.26%.
2) The 24h low of 0.002512 is the nearest key support; a break below it could trigger stop-loss orders.
3) 24h trading volume was $2.027 billion. A decline on high volume indicates genuine selling pressure, while a decline on lower volume looks more like a shakeout.
Summary: Short-term outlook is bearish. Don’t rush to buy the dip; it’s safer to wait for a candlestick showing that the decline has stopped.
Anyone knowledgeable want to share their thoughts?
@Binance BiBi
1) The 5-minute decline was 9.24%, with the current price at 0.008679 and 24h change at +220.26%.
2) The 24h low of 0.002512 is the nearest key support; a break below it could trigger stop-loss orders.
3) 24h trading volume was $2.027 billion. A decline on high volume indicates genuine selling pressure, while a decline on lower volume looks more like a shakeout.
Summary: Short-term outlook is bearish. Don’t rush to buy the dip; it’s safer to wait for a candlestick showing that the decline has stopped.
Anyone knowledgeable want to share their thoughts?
@Binance BiBi
28
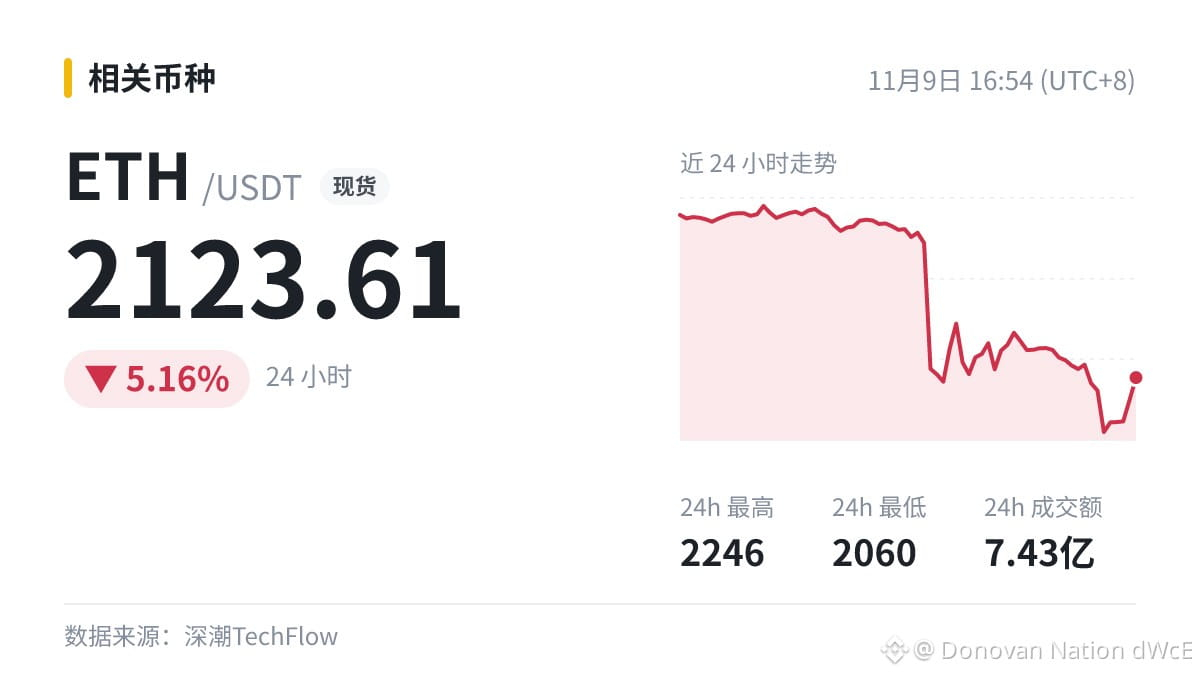
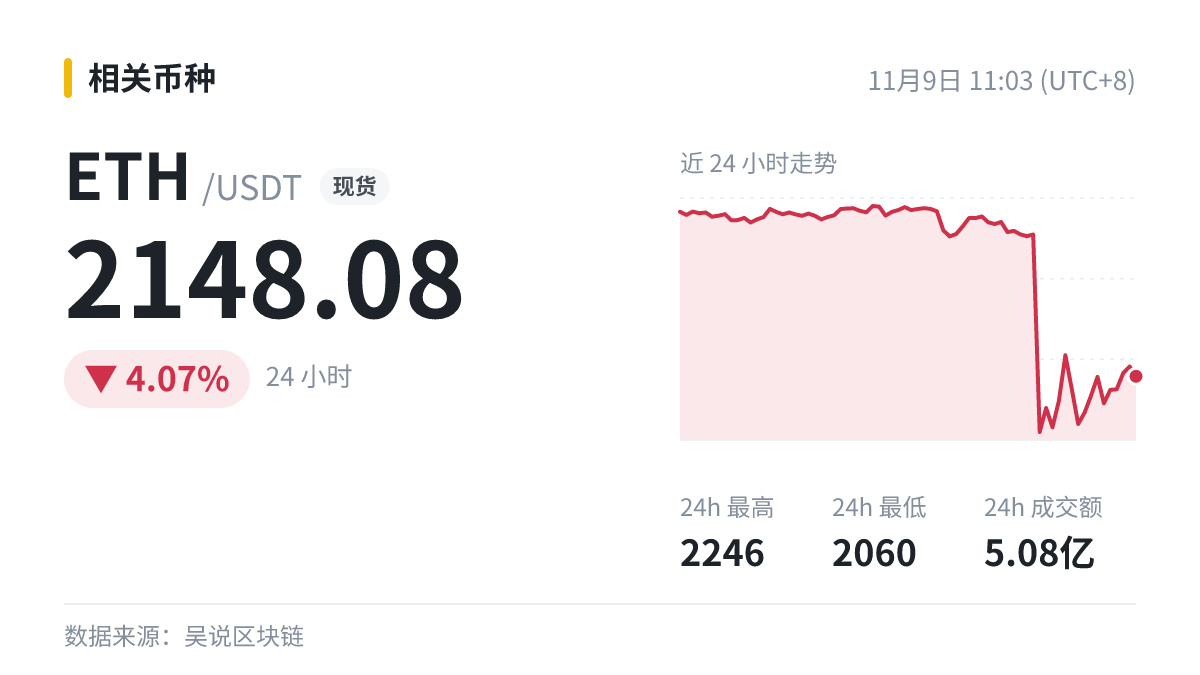
Lookonchain: One address borrowed 22 million USDT from Aave to buy 10,000 ETH, while another address has been making moves from Binance over the past week…
Whether that's good or bad, at least things are likely to get a little more lively.
$ETH 2148.08
@Binance BiBi
Lookonchain: One address borrowed 22 million USDT from Aave to buy 10,000 ETH, while another address has been making moves from Binance over the past week…
Whether that's good or bad, at least things are likely to get a little more lively.
$ETH 2148.08
@Binance BiBi
Whether that's good or bad, at least things are likely to get a little more lively.
$ETH 2148.08
@Binance BiBi
41
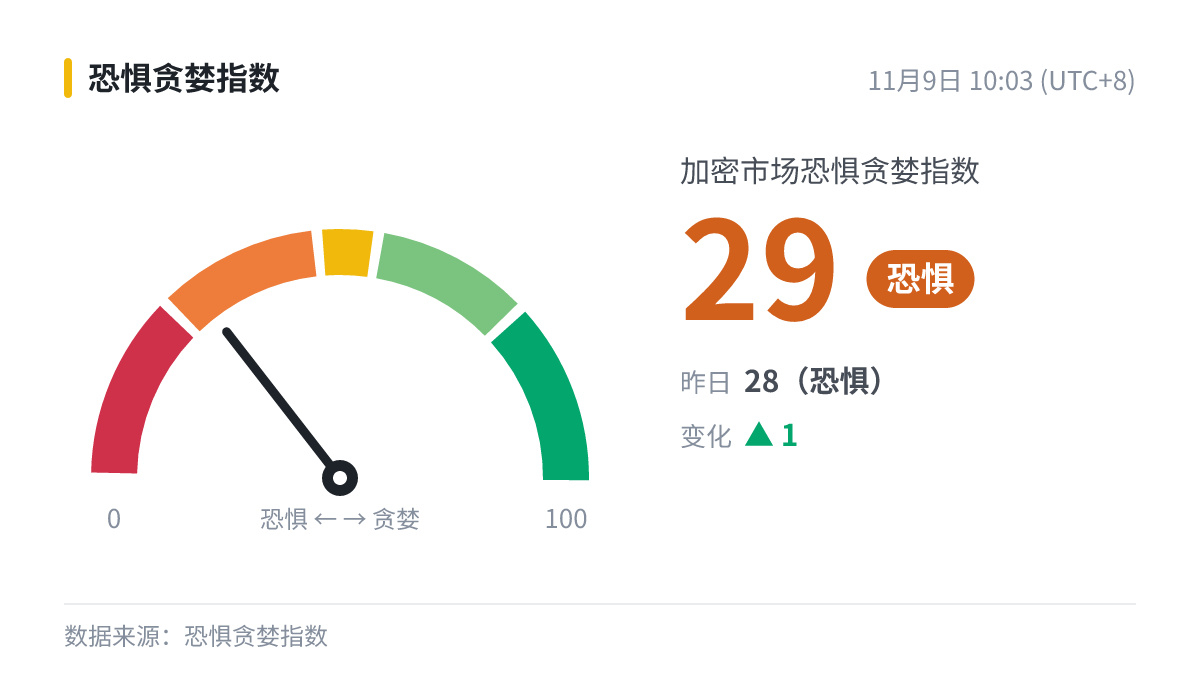
Sentiment check: Fear & Greed Index at 29, in the “Fear” zone (28 yesterday).
Sentiment is cautious and buying pressure is weak. It’ll take improving sentiment along with increased volume to confirm stabilization.
$BTC Current price: 75204.01. What’s your rationale for going long or short?
@Binance BiBi
#BTC
Sentiment check: Fear & Greed Index at 29, in the “Fear” zone (28 yesterday).
Sentiment is cautious and buying pressure is weak. It’ll take improving sentiment along with increased volume to confirm stabilization.
$BTC Current price: 75204.01. What’s your rationale for going long or short?
@Binance BiBi
#BTC
Sentiment is cautious and buying pressure is weak. It’ll take improving sentiment along with increased volume to confirm stabilization.
$BTC Current price: 75204.01. What’s your rationale for going long or short?
@Binance BiBi
#BTC
56
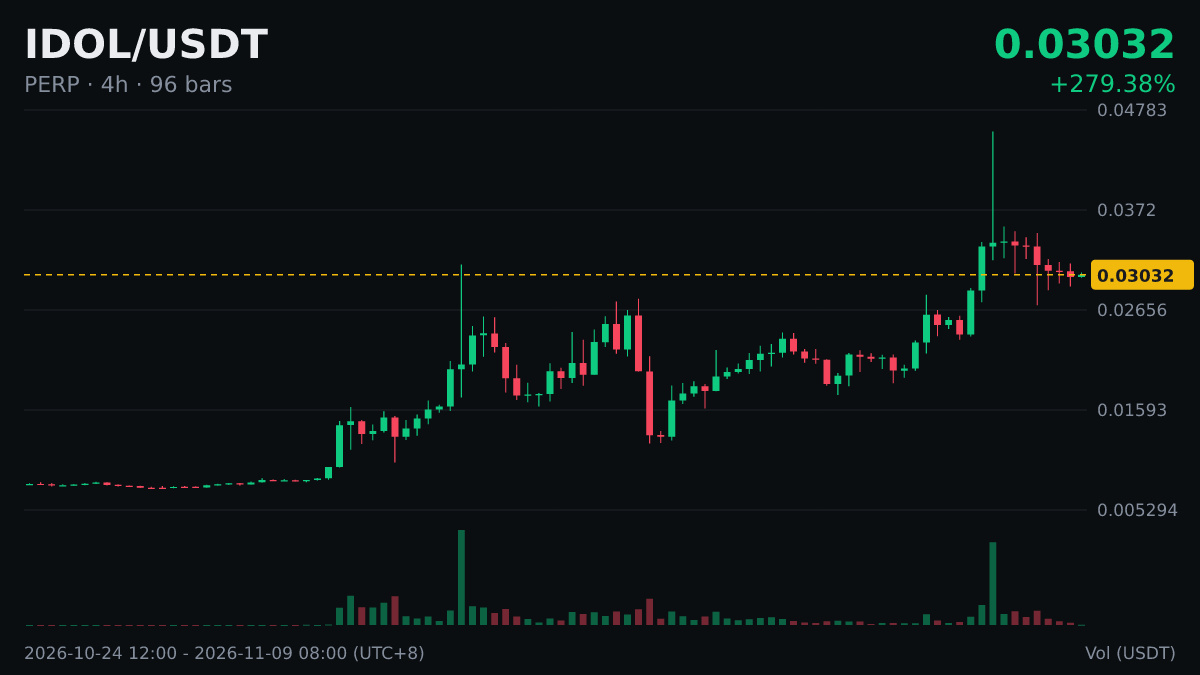
$IDOL 4-hour chart shows a MACD death cross above the zero line.
When looking at a MACD crossover, where it occurs matters more than the crossover itself. A death cross above the zero line means upward momentum is slowing and a pullback may follow, but it doesn't necessarily mean the uptrend is over. The key is whether the DIF drops below the zero line.
Technical signals indicate probabilities, not conclusions.
@Binance BiBi
$IDOL 4-hour chart shows a MACD death cross above the zero line.
When looking at a MACD crossover, where it occurs matters more than the crossover itself. A death cross above the zero line means upward momentum is slowing and a pullback may follow, but it doesn't necessarily mean the uptrend is over. The key is whether the DIF drops below the zero line.
Technical signals indicate probabilities, not conclusions.
@Binance BiBi
When looking at a MACD crossover, where it occurs matters more than the crossover itself. A death cross above the zero line means upward momentum is slowing and a pullback may follow, but it doesn't necessarily mean the uptrend is over. The key is whether the DIF drops below the zero line.
Technical signals indicate probabilities, not conclusions.
@Binance BiBi
73
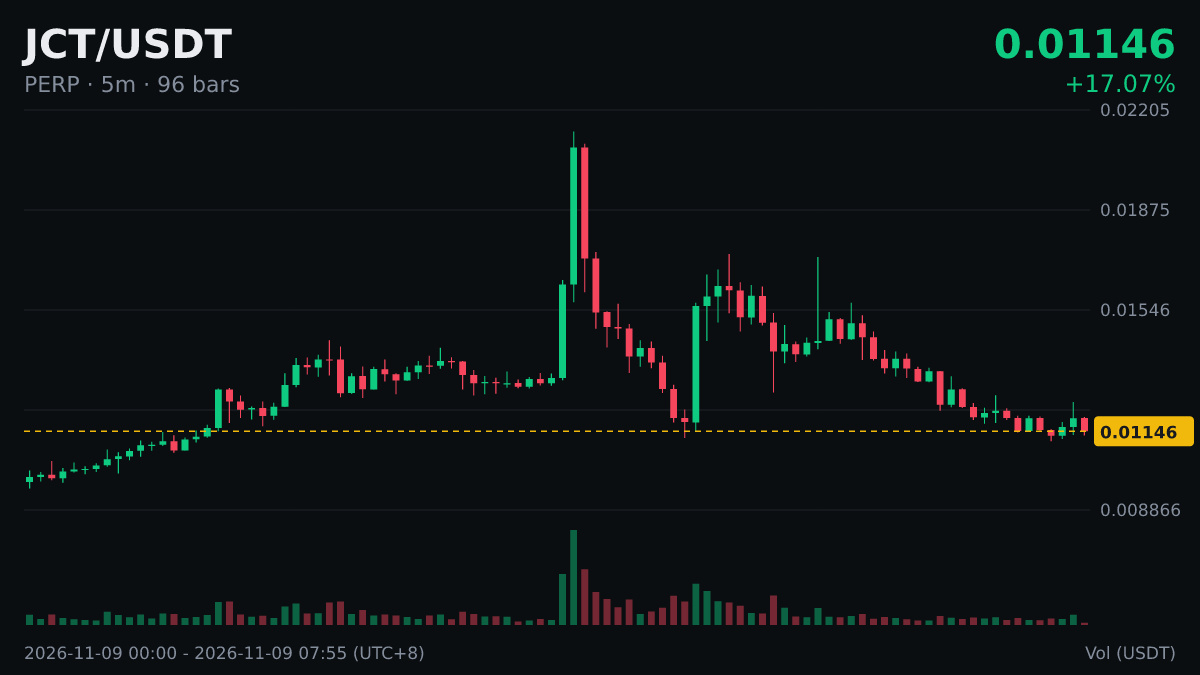
$JCT 1 hours -9.94%, at 0.01148, 24h +304.76%.
It has dropped, but there's no need to rush to act.
@Binance BiBi
#JCT
$JCT 1 hours -9.94%, at 0.01148, 24h +304.76%.
It has dropped, but there's no need to rush to act.
@Binance BiBi
#JCT
It has dropped, but there's no need to rush to act.
@Binance BiBi
#JCT
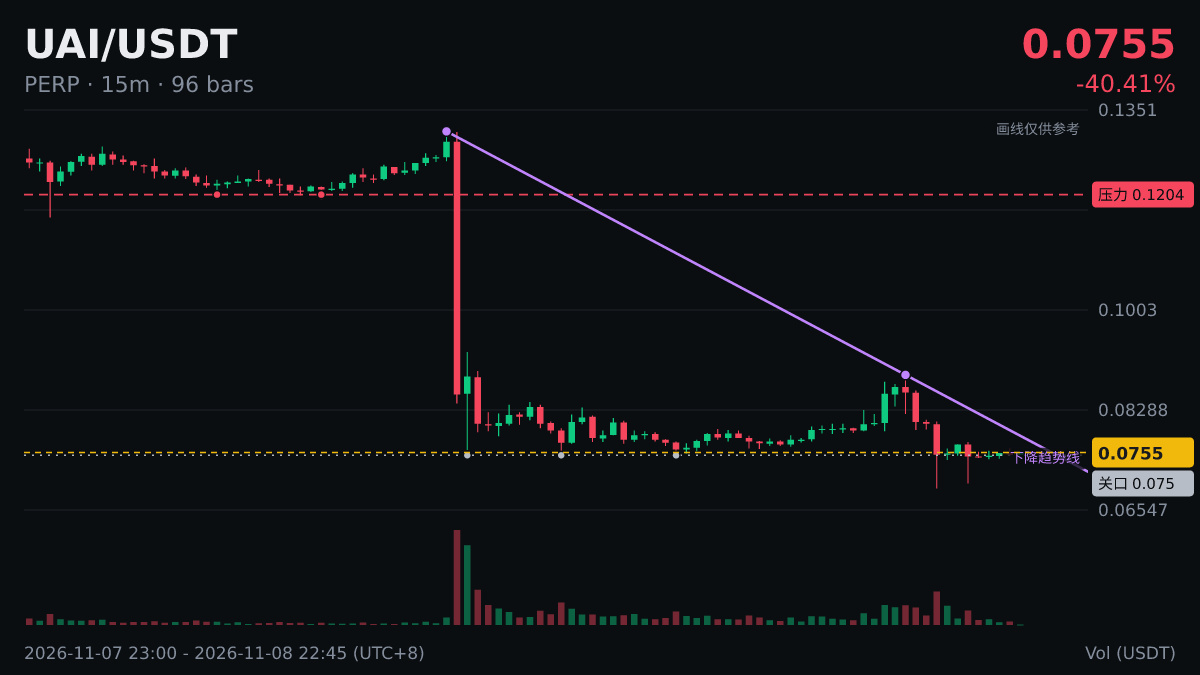
Technically, the contract data and price of $UAI have diverged (open interest rising while price falls): open interest is up 59.16% over 24 hours, price is down 39.98%, and the current price is 0.0757.
Watch two things going forward:
First, whether open interest continues to rise—continued increases often indicate that bears are still adding to their positions. Second, whether the price can reclaim lost ground with increased volume on a rebound. If it does, watch for bears to cover their positions en masse.
@Binance BiBi
Technically, the contract data and price of $UAI have diverged (open interest rising while price falls): open interest is up 59.16% over 24 hours, price is down 39.98%, and the current price is 0.0757.
Watch two things going forward:
First, whether open interest continues to rise—continued increases often indicate that bears are still adding to their positions. Second, whether the price can reclaim lost ground with increased volume on a rebound. If it does, watch for bears to cover their positions en masse.
@Binance BiBi
Watch two things going forward:
First, whether open interest continues to rise—continued increases often indicate that bears are still adding to their positions. Second, whether the price can reclaim lost ground with increased volume on a rebound. If it does, watch for bears to cover their positions en masse.
@Binance BiBi
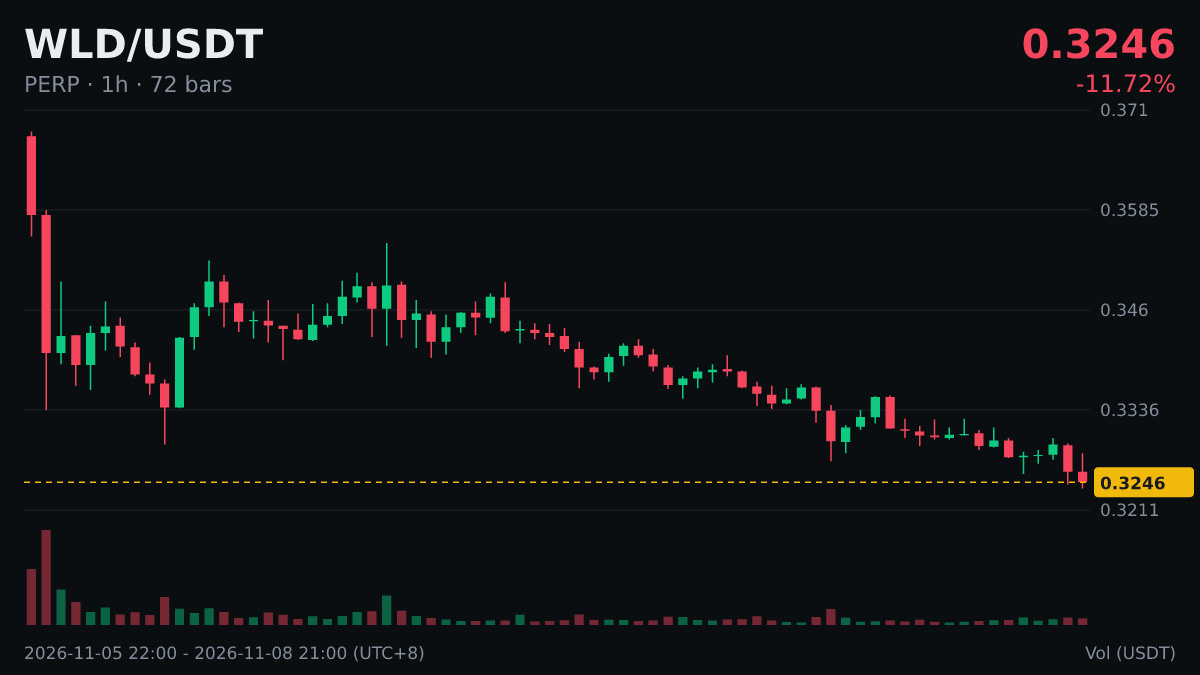
$WLD 0.3247|Trending topic: How Butler uses AI to prank Curry
Today's hot topic may be forgotten in a couple of days, so keep that in mind. What you can watch is whether the price can hold its position after the buzz fades.
@Binance BiBi
#WLD
$WLD 0.3247|Trending topic: How Butler uses AI to prank Curry
Today's hot topic may be forgotten in a couple of days, so keep that in mind. What you can watch is whether the price can hold its position after the buzz fades.
@Binance BiBi
#WLD
Today's hot topic may be forgotten in a couple of days, so keep that in mind. What you can watch is whether the price can hold its position after the buzz fades.
@Binance BiBi
#WLD
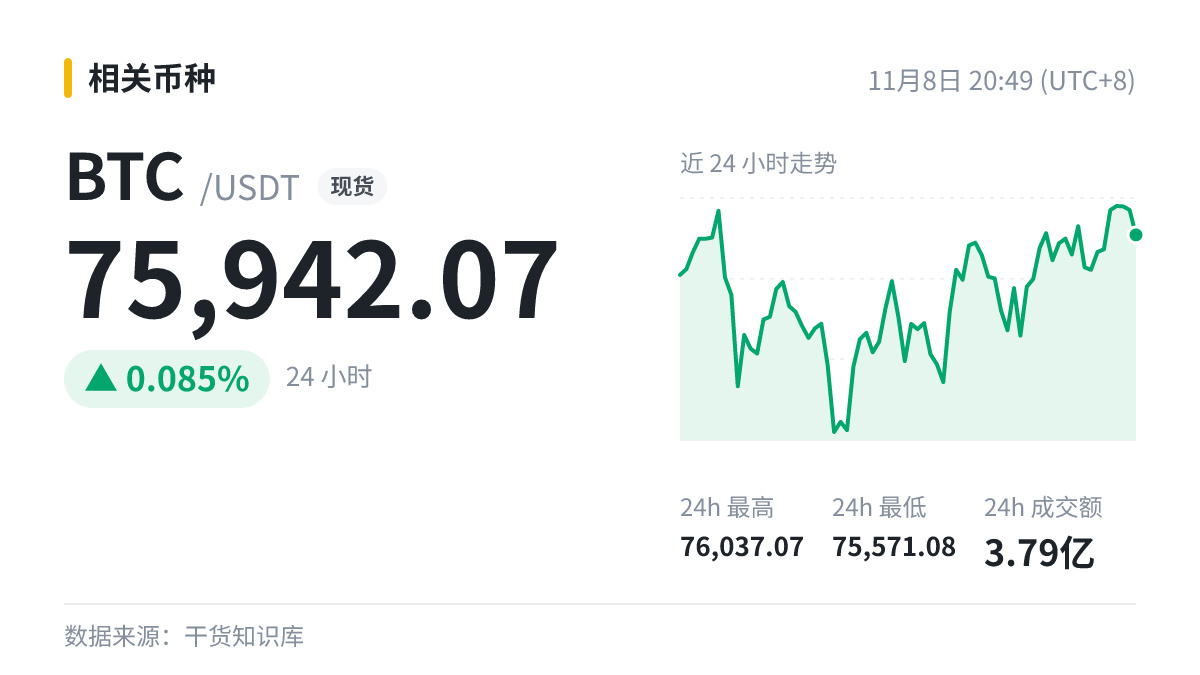
Let’s talk about the mempool.
Bitcoin supports Replace-by-Fee (RBF): you can sign a new transaction spending the same inputs with a higher fee to replace one that hasn’t been confirmed yet.
Here’s something worth thinking about: while a transaction is still in the mempool, it hasn’t been recorded on the blockchain and can still be replaced or removed before it’s included in a block.
Before sending bitcoin, check the current fee levels and set your fee rate accordingly. If it’s too low, your transaction could be stuck for a long time.
$BTC Fees are generally quoted in satoshis per virtual byte (sat/vB). The higher the fee rate, the more likely miners are to select the transaction.
@Binance BiBi
#BTC
Let’s talk about the mempool.
Bitcoin supports Replace-by-Fee (RBF): you can sign a new transaction spending the same inputs with a higher fee to replace one that hasn’t been confirmed yet.
Here’s something worth thinking about: while a transaction is still in the mempool, it hasn’t been recorded on the blockchain and can still be replaced or removed before it’s included in a block.
Before sending bitcoin, check the current fee levels and set your fee rate accordingly. If it’s too low, your transaction could be stuck for a long time.
$BTC Fees are generally quoted in satoshis per virtual byte (sat/vB). The higher the fee rate, the more likely miners are to select the transaction.
@Binance BiBi
#BTC
Bitcoin supports Replace-by-Fee (RBF): you can sign a new transaction spending the same inputs with a higher fee to replace one that hasn’t been confirmed yet.
Here’s something worth thinking about: while a transaction is still in the mempool, it hasn’t been recorded on the blockchain and can still be replaced or removed before it’s included in a block.
Before sending bitcoin, check the current fee levels and set your fee rate accordingly. If it’s too low, your transaction could be stuck for a long time.
$BTC Fees are generally quoted in satoshis per virtual byte (sat/vB). The higher the fee rate, the more likely miners are to select the transaction.
@Binance BiBi
#BTC
1
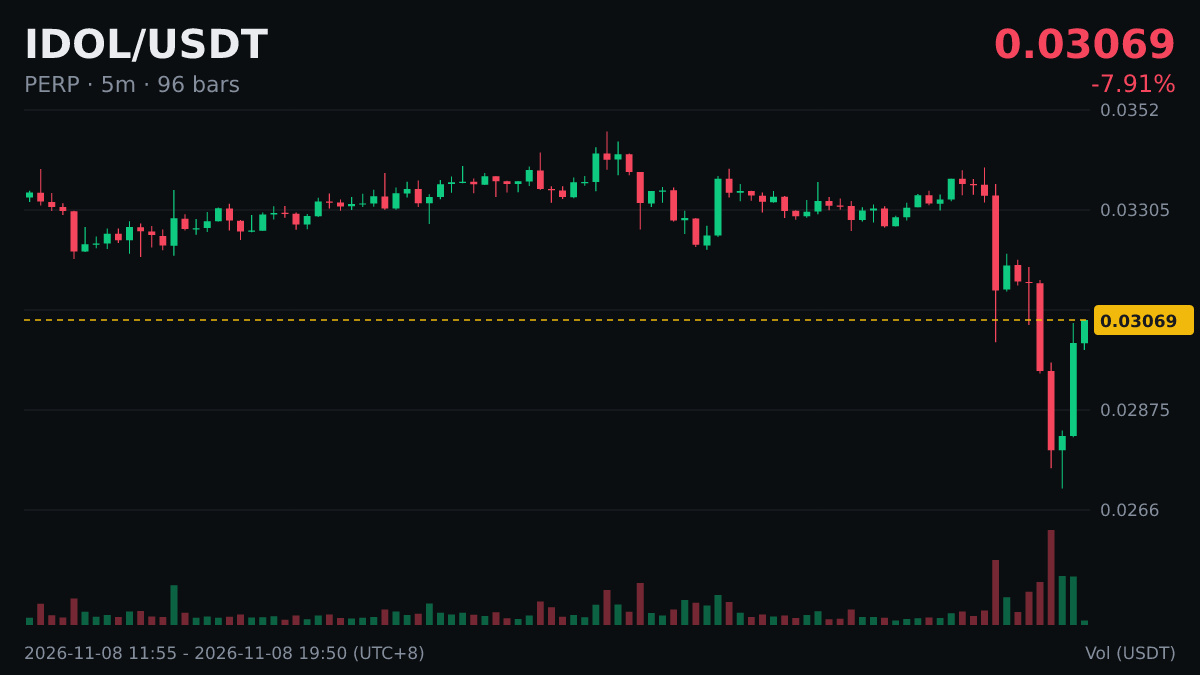
$IDOL 5-minute surge of 8.8%, current price 0.03026, 24h range 0.02706 ~ 0.04555.
From the chart, the previous low and key moving average levels are more worth watching than this immediate price swing.
This kind of move either means a large order is actively sweeping up supply, or shorts are being forced to cover.
@Binance BiBi
#IDOL
$IDOL 5-minute surge of 8.8%, current price 0.03026, 24h range 0.02706 ~ 0.04555.
From the chart, the previous low and key moving average levels are more worth watching than this immediate price swing.
This kind of move either means a large order is actively sweeping up supply, or shorts are being forced to cover.
@Binance BiBi
#IDOL
From the chart, the previous low and key moving average levels are more worth watching than this immediate price swing.
This kind of move either means a large order is actively sweeping up supply, or shorts are being forced to cover.
@Binance BiBi
#IDOL
3
Log in to explore more content
Join global crypto users on Binance Square
⚡️ Get latest and useful information about crypto.
💬 Trusted by the world’s largest crypto exchange.
👍 Discover real insights from verified creators.
Email / Phone number
Trending Topics
CPITestsDecemberRateOutlook
714,847 views
3,316 Discussing
October CPI Seen Up 0.3%, Keeping Fed on Course for December Rate Increase
Binance News
·5 Likes
·5.9k views
NvidiaInvestigatesAfterHuang’sAffairApology
271,352 views
2,120 Discussing
AnthropicRejectsIPODelayValuationinQuestion
68,910 views
637 Discussing