
JANNAT BM_
2.3k Posts

JANNAT BM_
Report
Block User
Alhamdulillah for everything.
136 Following
10.8K+ Followers
4.3K+ Liked
Posts
All
Quotes
Videos
PINNED



·
--
Bullish
#solana
$SOL is starting to look really interesting here.
{future}(SOLUSDT)
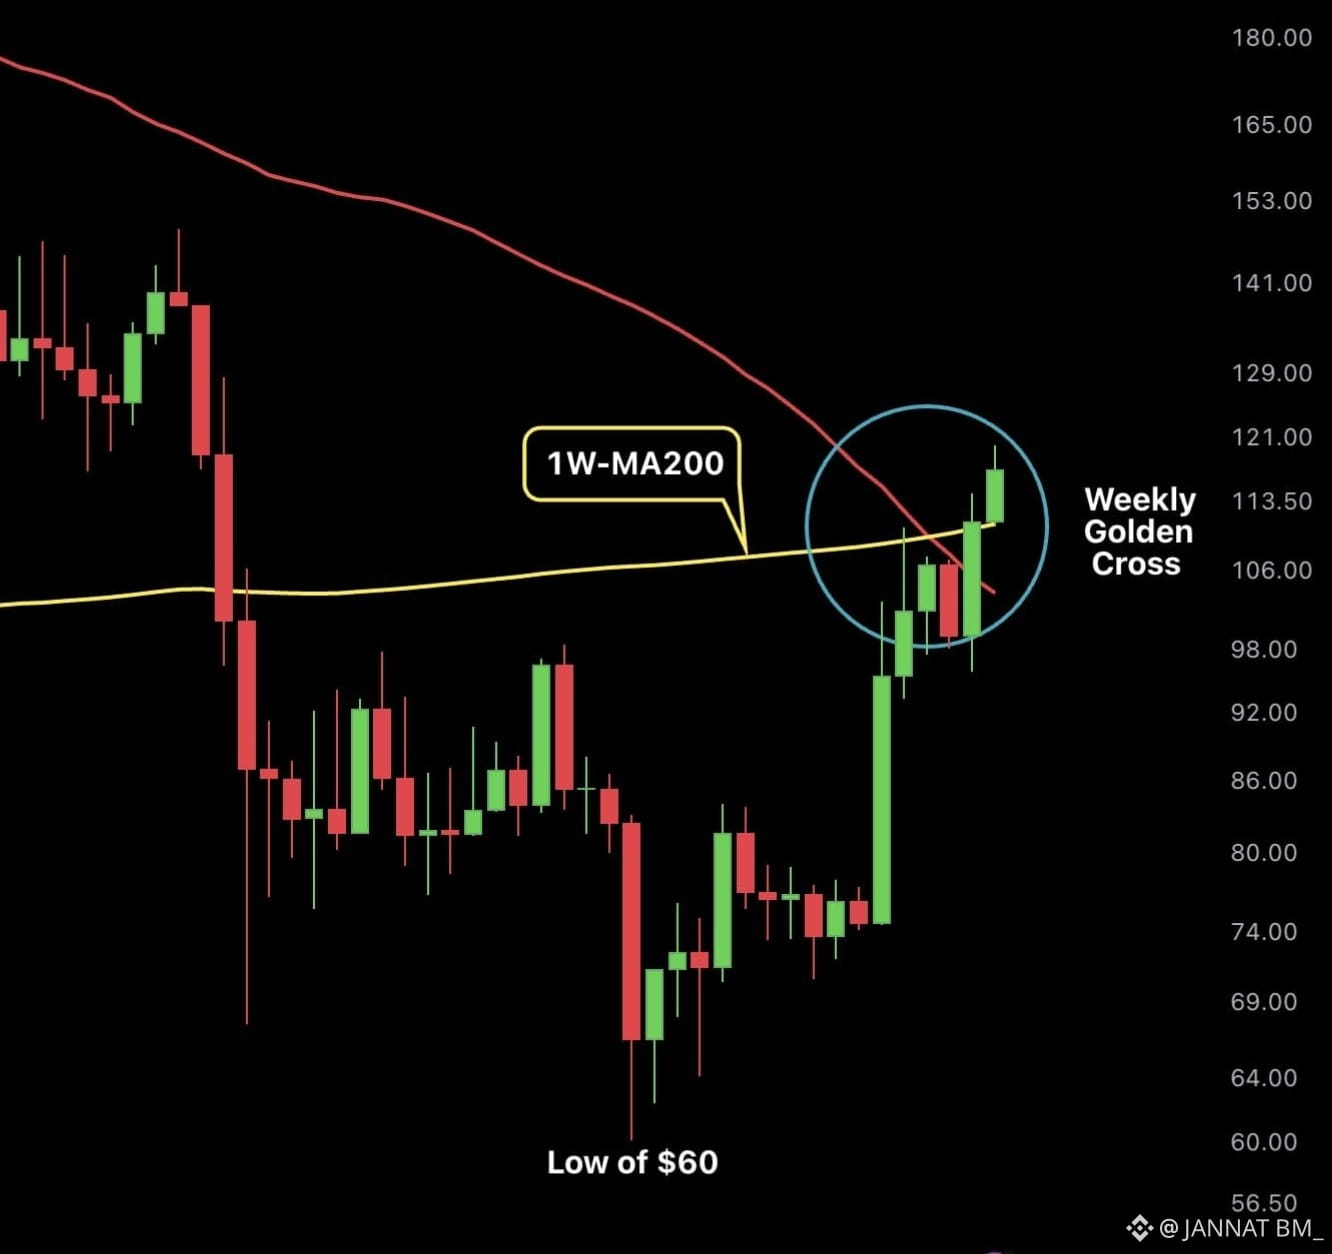
Reclaiming the weekly MA200, touching $120 for the first time in 8 months, and now seeing a weekly golden cros take shape. That combination definitely gets my attention. It doesn’t guarantee the bottom is in, but the structure is clearly improving. If momentum continues, SOL could be entering a much stronger phase.
#solana
$SOL is starting to look really interesting here.
Reclaiming the weekly MA200, touching $120 for the first time in 8 months, and now seeing a weekly golden cros take shape. That combination definitely gets my attention. It doesn’t guarantee the bottom is in, but the structure is clearly improving. If momentum continues, SOL could be entering a much stronger phase.
$SOL is starting to look really interesting here.
Reclaiming the weekly MA200, touching $120 for the first time in 8 months, and now seeing a weekly golden cros take shape. That combination definitely gets my attention. It doesn’t guarantee the bottom is in, but the structure is clearly improving. If momentum continues, SOL could be entering a much stronger phase.

149
·
--
This is starting to look interesting for altcoins.
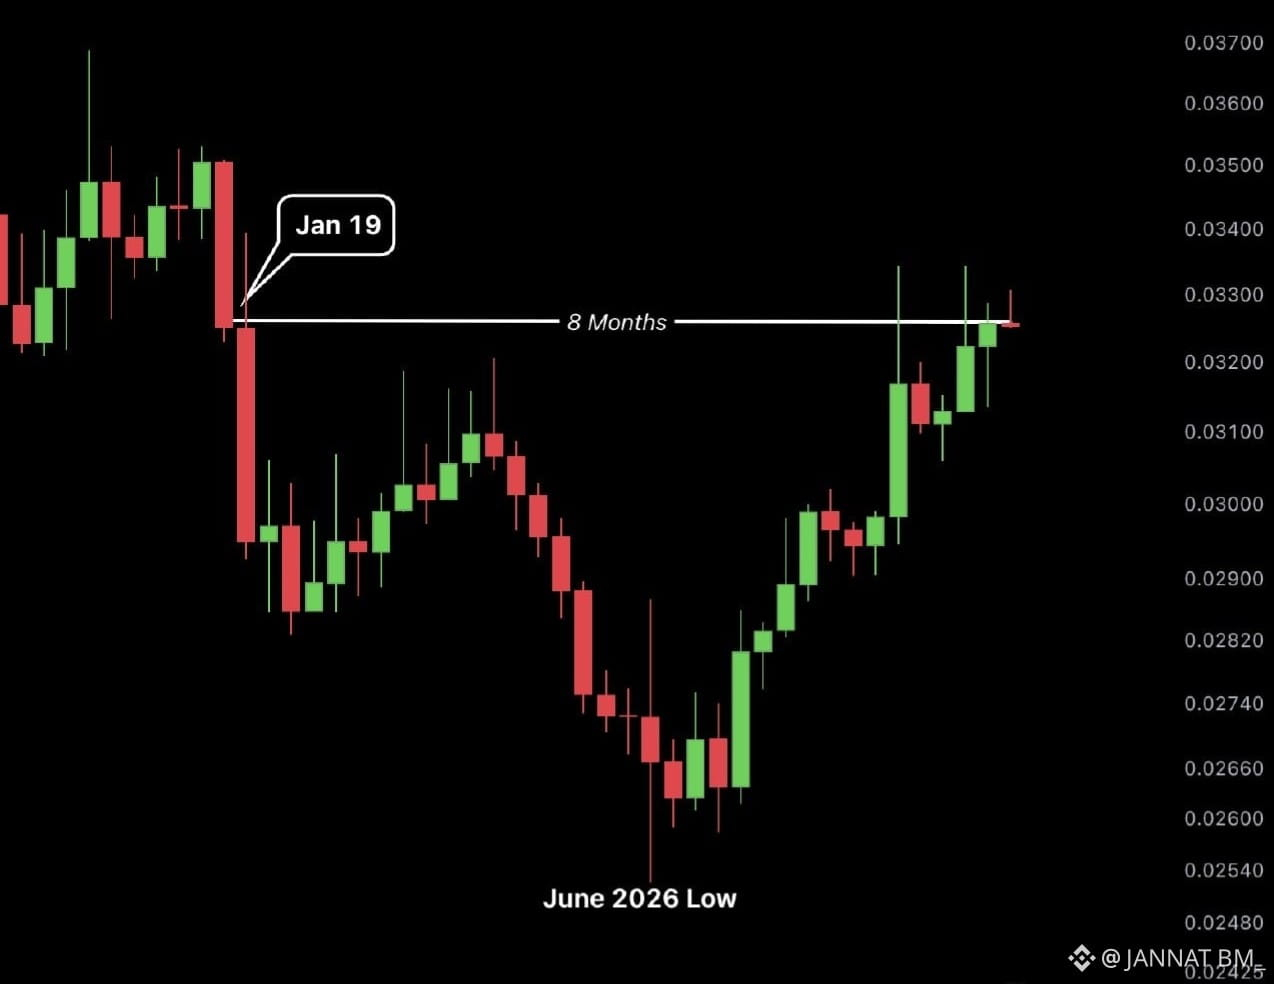
$ETH /$BTC just posted its highest weekly close in eight months, and that’s a signal worth paying attention to. It suggests Ethereum is gaining strength relative to Bitcoin, while buyers are gradualy showing more interest across the altcoin market. What catches my attention is the potential shift in capital flow. If ETH continues holding this strength and the broader market follows, more liquidity could rotate into altcoins. Still, I wouldn’t assume the move is guaranteed. Momentum can change quickly in crypto, especially after a strong weekly close.
For now, I’m watching ETH/BTC closely. If this trend keeps building, the altcoin market could become much more active.
This is starting to look interesting for altcoins.
$ETH /$BTC just posted its highest weekly close in eight months, and that’s a signal worth paying attention to. It suggests Ethereum is gaining strength relative to Bitcoin, while buyers are gradualy showing more interest across the altcoin market. What catches my attention is the potential shift in capital flow. If ETH continues holding this strength and the broader market follows, more liquidity could rotate into altcoins. Still, I wouldn’t assume the move is guaranteed. Momentum can change quickly in crypto, especially after a strong weekly close.
For now, I’m watching ETH/BTC closely. If this trend keeps building, the altcoin market could become much more active.
$ETH /$BTC just posted its highest weekly close in eight months, and that’s a signal worth paying attention to. It suggests Ethereum is gaining strength relative to Bitcoin, while buyers are gradualy showing more interest across the altcoin market. What catches my attention is the potential shift in capital flow. If ETH continues holding this strength and the broader market follows, more liquidity could rotate into altcoins. Still, I wouldn’t assume the move is guaranteed. Momentum can change quickly in crypto, especially after a strong weekly close.
For now, I’m watching ETH/BTC closely. If this trend keeps building, the altcoin market could become much more active.
2
121
·
--
Pair: $COOKIE USDT 🟢
Direction: LONG
Leverage: Cross 20X
Entry: 0.01374— 0.01312
TP1: 0.01426
TP2: 0.01490
TP3: 0.01567
SL: 0.01304.
$COOKIE
Pair: $COOKIE USDT 🟢
Direction: LONG
Leverage: Cross 20X
Entry: 0.01374— 0.01312
TP1: 0.01426
TP2: 0.01490
TP3: 0.01567
SL: 0.01304.
$COOKIE
Direction: LONG
Leverage: Cross 20X
Entry: 0.01374— 0.01312
TP1: 0.01426
TP2: 0.01490
TP3: 0.01567
SL: 0.01304.
$COOKIE
1
329
·
--
Article
BITCOIN’S NEXT BIG MOVE DEPENDS ON THIS KEY ZONESometimes the hardest part of a Bitcoin move isn’t the breakout itself.
It’s figuring out whether the market is actually changing structure, or simply giving traders another temporary push before the next rejection.
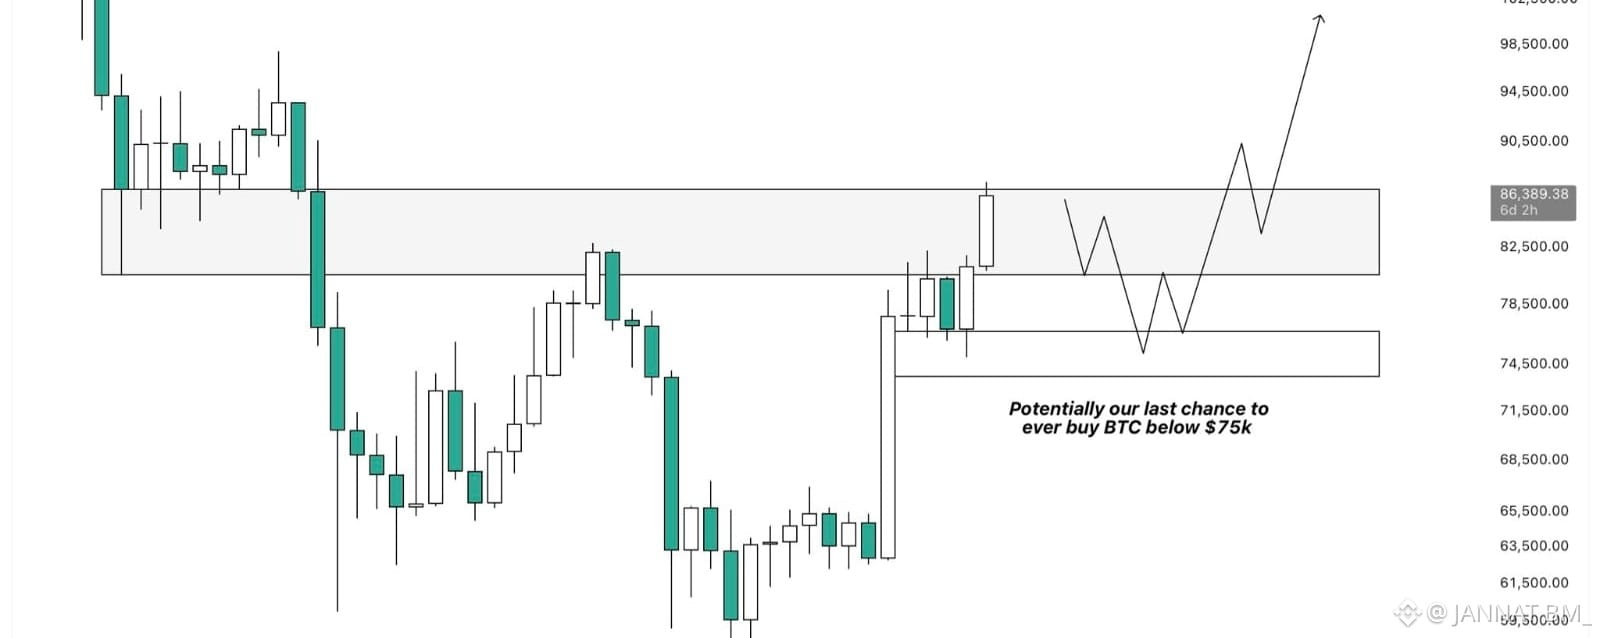
That’s what makes the current BTC setup interesting. Bitcoin is curently retesting a resistance zone that has already played an important role in the higher-timeframe structure. This is not just another random level on the chart. It is a previous breakdown area, and it also rejected BTC back in May when the market formed its last major HTF high.
So naturally, I’m paying much more attention here.
The interesting part is that momentum still looks very strong.
Price has pushed higher with enough strength to bring this resistance back into focus, and if BTC can reclaim the zone properly, the next major area I’m watching is around $97K.
But I don’t think simply trading above the level for a few hours would be enough confirmation.
For me, the more important signal would be a weekly close above $87K.
That would show that Bitcoin didn’t just wick through resistance. It would give the market a stronger reason to believe that this old breakdown area is actually being reclaimed.
At the same time, I’m not convinced that the first attempt has to succeed.
In fact, my expectation is still that BTC could face another rejection from this region before the larger move develops.
And this is where the $74K–$76K area becomes interesting. If BTC gets rejected from the current resistance and starts moving lower, that zone could potentially become a place where buyers step back in. It already represents an important support area, but there is another reason I’m watching it closely.
Liquidity.
A large cluster of long liquidations has built up around that region. If price moves into it, the market could potentialy clear some of that liquidity before finding enough demand for another move higher.
That kind of move can be uncomfortable to watch in real time.
But sometimes the market needs to shake out weaker positions before a cleaner trend can develop.
So, in my view, there are two levels that matter a lot right now.
First, whether BTC can reclaim and eventually confirm above the $87K area on the weekly timeframe.
Second, whether a rejection eventually brings price back toward $74K–$76K and whether buyers defend that region.
If that lower zone holds, it could become the higher low I’m looking for before another larger expansion to the upside.
And honestly, that possibility is what makes this setup so interesting to me.
Could $74K–$76K become the final major opportunity to see Bitcoin trading below $75K, or does the market still have another surprise waiting before the next big move?
$BTC
{future}(BTCUSDT)
$AAPLB
{spot}(AAPLBUSDT)
$NVDAB
{spot}(NVDABUSDT)
#BitcoinSpotETFs$999MNetInflow
BITCOIN’S NEXT BIG MOVE DEPENDS ON THIS KEY ZONE
Sometimes the hardest part of a Bitcoin move isn’t the breakout itself.
It’s figuring out whether the market is actually changing structure, or simply giving traders another temporary push before the next rejection.
That’s what makes the current BTC setup interesting. Bitcoin is curently retesting a resistance zone that has already played an important role in the higher-timeframe structure. This is not just another random level on the chart. It is a previous breakdown area, and it also rejected BTC back in May when the market formed its last major HTF high.
So naturally, I’m paying much more attention here.
The interesting part is that momentum still looks very strong.
Price has pushed higher with enough strength to bring this resistance back into focus, and if BTC can reclaim the zone properly, the next major area I’m watching is around $97K.
But I don’t think simply trading above the level for a few hours would be enough confirmation.
For me, the more important signal would be a weekly close above $87K.
That would show that Bitcoin didn’t just wick through resistance. It would give the market a stronger reason to believe that this old breakdown area is actually being reclaimed.
At the same time, I’m not convinced that the first attempt has to succeed.
In fact, my expectation is still that BTC could face another rejection from this region before the larger move develops.
And this is where the $74K–$76K area becomes interesting. If BTC gets rejected from the current resistance and starts moving lower, that zone could potentially become a place where buyers step back in. It already represents an important support area, but there is another reason I’m watching it closely.
Liquidity.
A large cluster of long liquidations has built up around that region. If price moves into it, the market could potentialy clear some of that liquidity before finding enough demand for another move higher.
That kind of move can be uncomfortable to watch in real time.
But sometimes the market needs to shake out weaker positions before a cleaner trend can develop.
So, in my view, there are two levels that matter a lot right now.
First, whether BTC can reclaim and eventually confirm above the $87K area on the weekly timeframe.
Second, whether a rejection eventually brings price back toward $74K–$76K and whether buyers defend that region.
If that lower zone holds, it could become the higher low I’m looking for before another larger expansion to the upside.
And honestly, that possibility is what makes this setup so interesting to me.
Could $74K–$76K become the final major opportunity to see Bitcoin trading below $75K, or does the market still have another surprise waiting before the next big move?
$BTC
$AAPLB
$NVDAB
#BitcoinSpotETFs$999MNetInflow
It’s figuring out whether the market is actually changing structure, or simply giving traders another temporary push before the next rejection.
That’s what makes the current BTC setup interesting. Bitcoin is curently retesting a resistance zone that has already played an important role in the higher-timeframe structure. This is not just another random level on the chart. It is a previous breakdown area, and it also rejected BTC back in May when the market formed its last major HTF high.
So naturally, I’m paying much more attention here.
The interesting part is that momentum still looks very strong.
Price has pushed higher with enough strength to bring this resistance back into focus, and if BTC can reclaim the zone properly, the next major area I’m watching is around $97K.
But I don’t think simply trading above the level for a few hours would be enough confirmation.
For me, the more important signal would be a weekly close above $87K.
That would show that Bitcoin didn’t just wick through resistance. It would give the market a stronger reason to believe that this old breakdown area is actually being reclaimed.
At the same time, I’m not convinced that the first attempt has to succeed.
In fact, my expectation is still that BTC could face another rejection from this region before the larger move develops.
And this is where the $74K–$76K area becomes interesting. If BTC gets rejected from the current resistance and starts moving lower, that zone could potentially become a place where buyers step back in. It already represents an important support area, but there is another reason I’m watching it closely.
Liquidity.
A large cluster of long liquidations has built up around that region. If price moves into it, the market could potentialy clear some of that liquidity before finding enough demand for another move higher.
That kind of move can be uncomfortable to watch in real time.
But sometimes the market needs to shake out weaker positions before a cleaner trend can develop.
So, in my view, there are two levels that matter a lot right now.
First, whether BTC can reclaim and eventually confirm above the $87K area on the weekly timeframe.
Second, whether a rejection eventually brings price back toward $74K–$76K and whether buyers defend that region.
If that lower zone holds, it could become the higher low I’m looking for before another larger expansion to the upside.
And honestly, that possibility is what makes this setup so interesting to me.
Could $74K–$76K become the final major opportunity to see Bitcoin trading below $75K, or does the market still have another surprise waiting before the next big move?
$BTC
$AAPLB
$NVDAB
#BitcoinSpotETFs$999MNetInflow
4
250
·
--
Bullish
$TAO UPDATE
{future}(TAOUSDT)
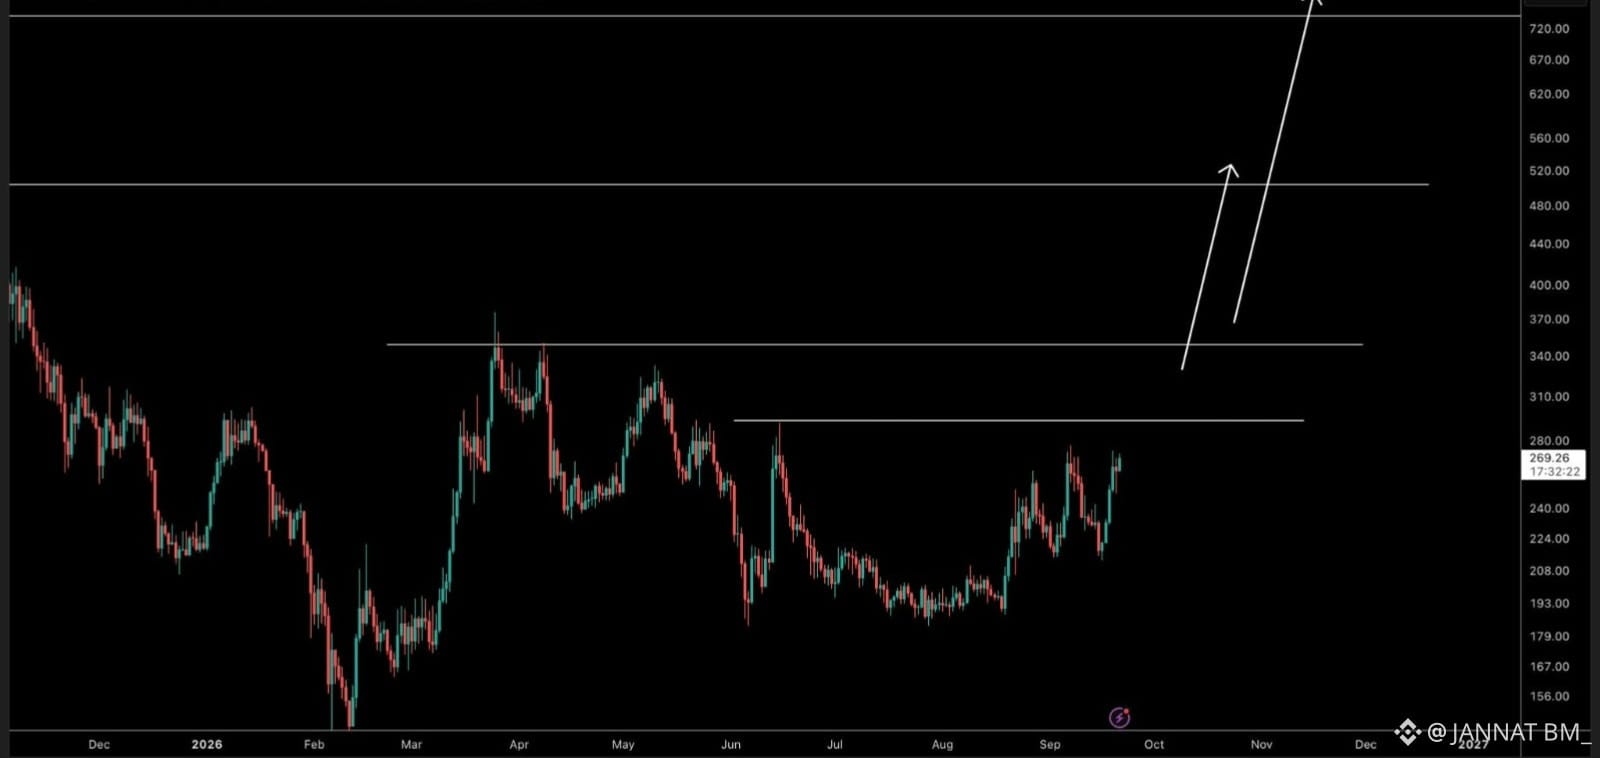
Still looks like a solid spot hold to me. Price is holding well, and I’m watching for those higher targets to get reached. Let’s see how it plays out.
$TAO UPDATE
Still looks like a solid spot hold to me. Price is holding well, and I’m watching for those higher targets to get reached. Let’s see how it plays out.
Still looks like a solid spot hold to me. Price is holding well, and I’m watching for those higher targets to get reached. Let’s see how it plays out.
6
242
·
--

Article
BITCOIN’S HEALTHIEST PUMP MIGHT BE THE QUIETEST ONEA strong pump is easy to recognize.
But the more interesting question is what is happening underneath the price while it moves higher?
Bitcoin breaking above a range is one thing. Seeing that breakout happen without a huge explosion in leverage is something else entirely.
That difference matters.
When BTC moves quickly, traders often look at the candles first. Big green candles create excitement, but they can also hide what is actually driving the move. If the raly is mostly powered by excessive leverage, the structure can become fragile very quickly. A small reversal can trigger liquidations, those liquidations create more selling, and suddenly a move that looked unstoppable starts moving in the opposite direction.
That is why I find the current structure interesting.
BTC has broken above the range highs with strong momentum, but the move is also being supported by aggressive spot buying. At the same time, shorts are being squeezed out of the market.
So there are two forces working together.
Real buyers are stepping in, while bearish positions are being forced to close.
And then there is another detail that caught my attention.
Open interest has remained relatively flat during the move.
For me, that changes the way I look at this breakout.
It suggests that Bitcoin hasn't needed a massive build-up of new leverage to push through the range. The price is moving higher, but we aren't seeing the same kind of aggressive derivatives expansion that can make a rally vulnerable.
Obviously, that doesn't mean the move can't reverse.
Markets can change quickly, and even strong breakouts can face profit-taking or rejection. But compared with a pump driven almost entirely by leveraged positions, this setup currently looks much healthier.
That is the part I keep coming back to.
Bitcoin is showing strength without relying heavily on a fresh wave of leverage.
If spot demand continues to absorb supply and shorts keep getting squeezed, there may still be room for the move to extend.
The next area I’m watching is around $87K.
But I don't think the number itself is the most interesting part.
The bigger question is whether BTC can continue climbing while maintaining this same underlying structure: strong spot participation, short liquidations, and relatively controlled open interest.
Because if that continues, the market isn't just going up.
It may be showing a different kind of demand than we saw during more leverage-heavy rallies.
And that makes me wonder: what happens if Bitcoin keeps breaking higher while leverage stays relatively quiet?
$BTC
{future}(BTCUSDT)
$NVDAB
{spot}(NVDABUSDT)
$GOOGL.US
{stock_us}(GOOGL.US)
#BitcoinHits$85K
BITCOIN’S HEALTHIEST PUMP MIGHT BE THE QUIETEST ONE
A strong pump is easy to recognize.
But the more interesting question is what is happening underneath the price while it moves higher?
Bitcoin breaking above a range is one thing. Seeing that breakout happen without a huge explosion in leverage is something else entirely.
That difference matters.
When BTC moves quickly, traders often look at the candles first. Big green candles create excitement, but they can also hide what is actually driving the move. If the raly is mostly powered by excessive leverage, the structure can become fragile very quickly. A small reversal can trigger liquidations, those liquidations create more selling, and suddenly a move that looked unstoppable starts moving in the opposite direction.
That is why I find the current structure interesting.
BTC has broken above the range highs with strong momentum, but the move is also being supported by aggressive spot buying. At the same time, shorts are being squeezed out of the market.
So there are two forces working together.
Real buyers are stepping in, while bearish positions are being forced to close.
And then there is another detail that caught my attention.
Open interest has remained relatively flat during the move.
For me, that changes the way I look at this breakout.
It suggests that Bitcoin hasn't needed a massive build-up of new leverage to push through the range. The price is moving higher, but we aren't seeing the same kind of aggressive derivatives expansion that can make a rally vulnerable.
Obviously, that doesn't mean the move can't reverse.
Markets can change quickly, and even strong breakouts can face profit-taking or rejection. But compared with a pump driven almost entirely by leveraged positions, this setup currently looks much healthier.
That is the part I keep coming back to.
Bitcoin is showing strength without relying heavily on a fresh wave of leverage.
If spot demand continues to absorb supply and shorts keep getting squeezed, there may still be room for the move to extend.
The next area I’m watching is around $87K.
But I don't think the number itself is the most interesting part.
The bigger question is whether BTC can continue climbing while maintaining this same underlying structure: strong spot participation, short liquidations, and relatively controlled open interest.
Because if that continues, the market isn't just going up.
It may be showing a different kind of demand than we saw during more leverage-heavy rallies.
And that makes me wonder: what happens if Bitcoin keeps breaking higher while leverage stays relatively quiet?
$BTC
$NVDAB
$GOOGL.US
#BitcoinHits$85K
But the more interesting question is what is happening underneath the price while it moves higher?
Bitcoin breaking above a range is one thing. Seeing that breakout happen without a huge explosion in leverage is something else entirely.
That difference matters.
When BTC moves quickly, traders often look at the candles first. Big green candles create excitement, but they can also hide what is actually driving the move. If the raly is mostly powered by excessive leverage, the structure can become fragile very quickly. A small reversal can trigger liquidations, those liquidations create more selling, and suddenly a move that looked unstoppable starts moving in the opposite direction.
That is why I find the current structure interesting.
BTC has broken above the range highs with strong momentum, but the move is also being supported by aggressive spot buying. At the same time, shorts are being squeezed out of the market.
So there are two forces working together.
Real buyers are stepping in, while bearish positions are being forced to close.
And then there is another detail that caught my attention.
Open interest has remained relatively flat during the move.
For me, that changes the way I look at this breakout.
It suggests that Bitcoin hasn't needed a massive build-up of new leverage to push through the range. The price is moving higher, but we aren't seeing the same kind of aggressive derivatives expansion that can make a rally vulnerable.
Obviously, that doesn't mean the move can't reverse.
Markets can change quickly, and even strong breakouts can face profit-taking or rejection. But compared with a pump driven almost entirely by leveraged positions, this setup currently looks much healthier.
That is the part I keep coming back to.
Bitcoin is showing strength without relying heavily on a fresh wave of leverage.
If spot demand continues to absorb supply and shorts keep getting squeezed, there may still be room for the move to extend.
The next area I’m watching is around $87K.
But I don't think the number itself is the most interesting part.
The bigger question is whether BTC can continue climbing while maintaining this same underlying structure: strong spot participation, short liquidations, and relatively controlled open interest.
Because if that continues, the market isn't just going up.
It may be showing a different kind of demand than we saw during more leverage-heavy rallies.
And that makes me wonder: what happens if Bitcoin keeps breaking higher while leverage stays relatively quiet?
$BTC
$NVDAB
$GOOGL.US
#BitcoinHits$85K
6
864
·
--
#Ethereum
ETH BREAKOUT WATCH 🟢🚀
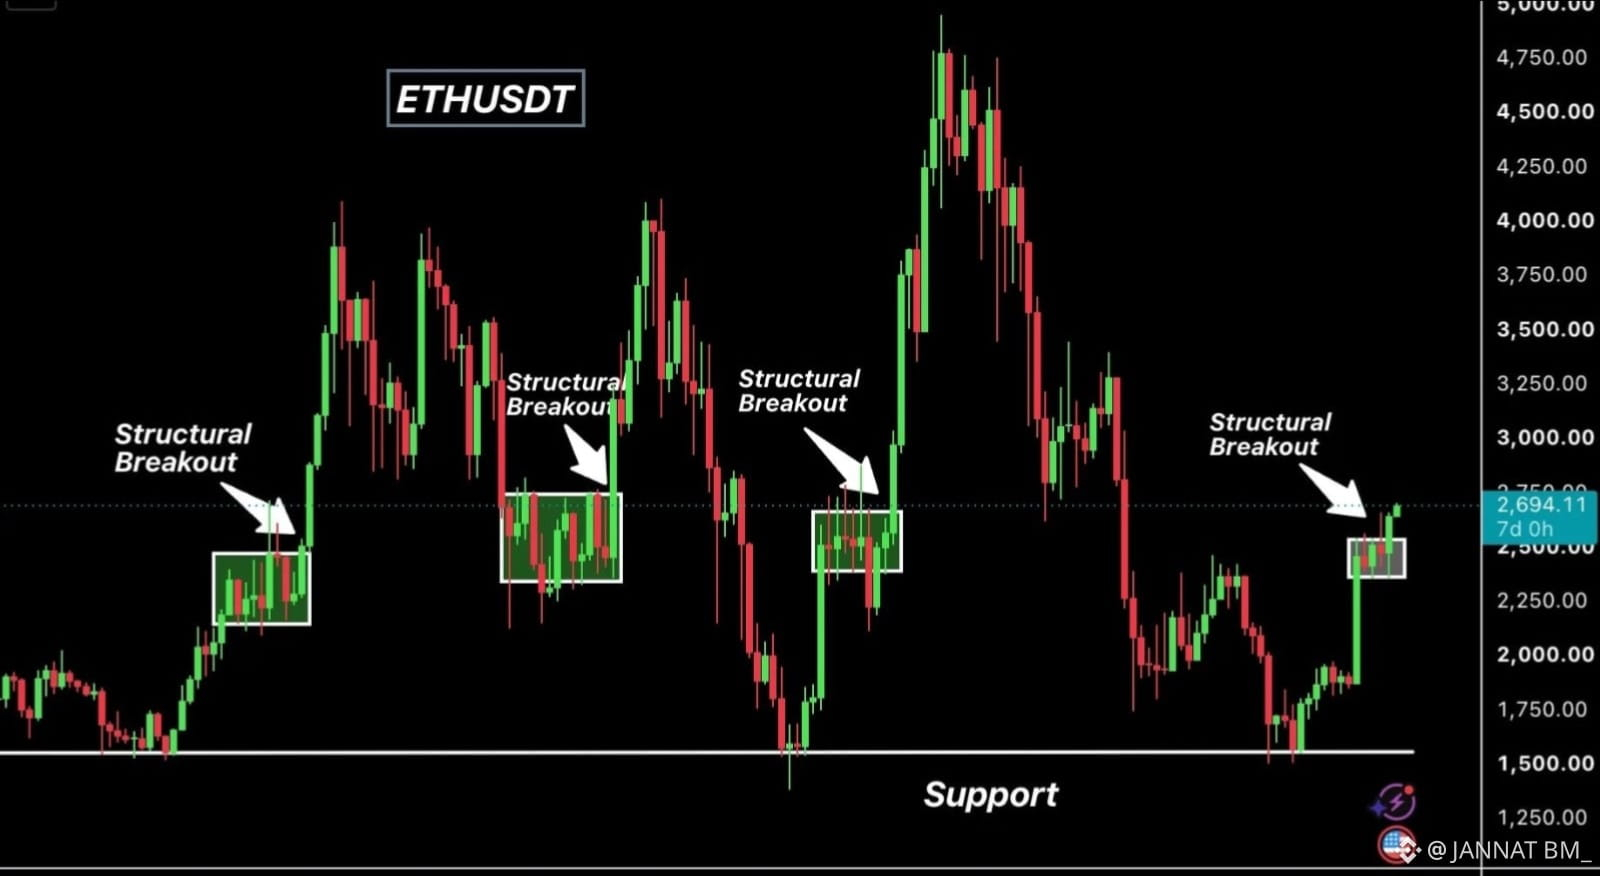
$ETH closed the week up 6.77% and finally broke out of the box that has marked its previous three major breakouts. Each of those breakouts was followed by a strong rally, so this move is defintely worth watching. Now, $1,900 and $1,500 stand out as the key support levels. If ETH can hold above these areas, the next upside zone could be around $3,200–$3,600.
But I wouldn’t ignore the other side. If $ETH falls back below the box next week, this breakout could lose momentum and turn into a failed move.
For now, confirmation matters more than excitement.
$NVDAB
{spot}(NVDABUSDT)
#Ethereum
ETH BREAKOUT WATCH 🟢🚀
$ETH closed the week up 6.77% and finally broke out of the box that has marked its previous three major breakouts. Each of those breakouts was followed by a strong rally, so this move is defintely worth watching. Now, $1,900 and $1,500 stand out as the key support levels. If ETH can hold above these areas, the next upside zone could be around $3,200–$3,600.
But I wouldn’t ignore the other side. If $ETH falls back below the box next week, this breakout could lose momentum and turn into a failed move.
For now, confirmation matters more than excitement.
$NVDAB
ETH BREAKOUT WATCH 🟢🚀
$ETH closed the week up 6.77% and finally broke out of the box that has marked its previous three major breakouts. Each of those breakouts was followed by a strong rally, so this move is defintely worth watching. Now, $1,900 and $1,500 stand out as the key support levels. If ETH can hold above these areas, the next upside zone could be around $3,200–$3,600.
But I wouldn’t ignore the other side. If $ETH falls back below the box next week, this breakout could lose momentum and turn into a failed move.
For now, confirmation matters more than excitement.
$NVDAB
5
188
·
--
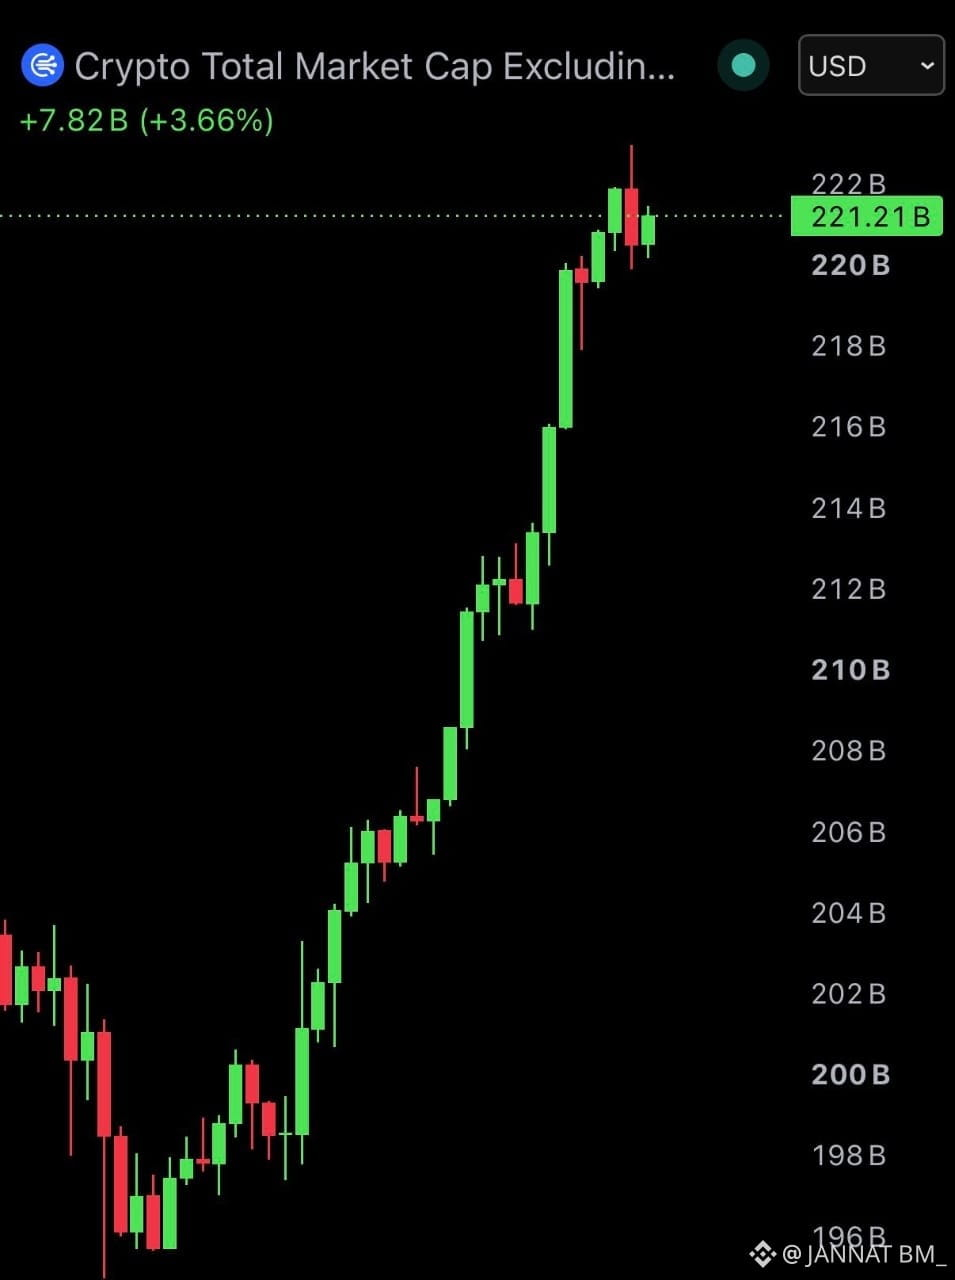
The altcoin market cap just hit $222 billion for the first time in 8 months.
That’s a pretty notable move. Momentum is clearly picking up across the altcoin market, and this could be an importantes sign that liquidity is starting to rotate beyond Bitcoin.
Things are getting interesting.
Send everything.
$NVDA.US
{stock_us}(NVDA.US)
$BR
{alpha}(560xff7d6a96ae471bbcd7713af9cb1feeb16cf56b41)
$XMR
{future}(XMRUSDT)
The altcoin market cap just hit $222 billion for the first time in 8 months.
That’s a pretty notable move. Momentum is clearly picking up across the altcoin market, and this could be an importantes sign that liquidity is starting to rotate beyond Bitcoin.
Things are getting interesting.
Send everything.
$NVDA.US
$BR
$XMR
That’s a pretty notable move. Momentum is clearly picking up across the altcoin market, and this could be an importantes sign that liquidity is starting to rotate beyond Bitcoin.
Things are getting interesting.
Send everything.
$NVDA.US
$BR
$XMR
4
1.6k
·
--
Bullish
#Ethereum
Looks like many people stil aren’t ready for what $ETH could do if a real rally kicks off.
{future}(ETHUSDT)
$BR
{alpha}(560xff7d6a96ae471bbcd7713af9cb1feeb16cf56b41)
$CL
{future}(CLUSDT)
#Ethereum
Looks like many people stil aren’t ready for what $ETH could do if a real rally kicks off.
$BR
$CL
Looks like many people stil aren’t ready for what $ETH could do if a real rally kicks off.
$BR
$CL

5
692
·
--
Article
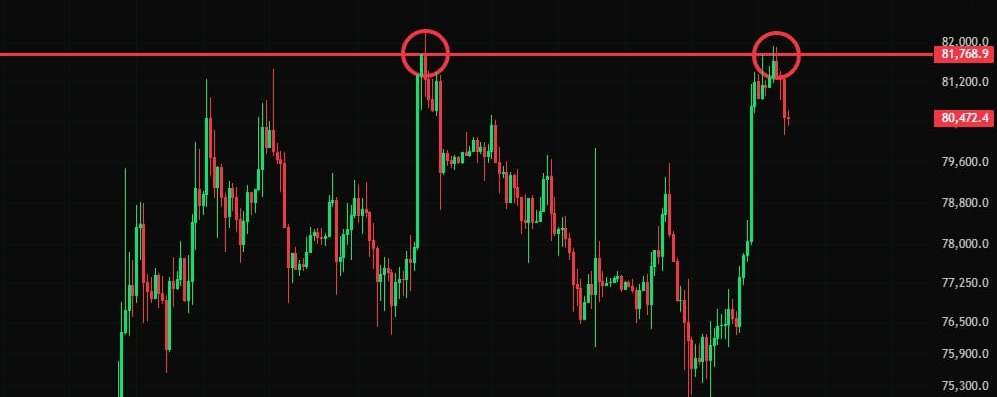
BITCOIN AT A CRITICAL DECISION POINT : $81,812 BREAKOUT OR LIQUIDITY SWEEP LOWER ?Bitcoin is sitting at a level where the next few 4H candles could become very important.
Right now, $81,812 is the key level I’m watching. Price is basically at a decision point, and I think there are two clear scenarios to keep in mind rather than forcing a direction too early. The first scenario is a clean breakout above $81,812. But for me, simply wicking above the level wouldn’t be enough. I’d want to see a proper 4H close above $81,812, followed by several candles holding above it. That kind of confirmation would make the breakout more meaningful and could open the way toward the $87,000 area first.
If BTC manages to build support above that level instead of immediately losing it, the next area I’d be watching is around $93,000. That would represent a much larger continuation from the current structure.
The second scenario is the opposite.
If BTC fails to reclaim and hold $81,812, the market could still have unfinished business below. In that case, another move lower could act as a liquidity sweep rather than an immediate confirmation of a larger bearish trend.
The areas I’m watching on the downside are around $73,000 and $71,000.
This is why I don’t think the current level should be treated casualy. The reaction around $81,812 can tell us a lot about what BTC wants to do next. A breakout followed by sustained 4H closes above the level would support the upside scenario, while continued rejection could bring the lower liquidity zones back into focus.
Personally, I’d rather wait for the market to show its hand than assume that one side has already won.
A clean reclaim is one thing. A quick wick above the level followed by a rejection is something completely different.
So for now, $81,812 remains the line I’m watching most closely.
Above it with confirmation: $87K and potentially $93K come into focus.
Below it: $73K and $71K become the key downside areas to monitor.
The next few 4H candles could be more important than the current candle itself. Patience matters here because chasing either direction before confirmation can make an otherwise simple setup unnecessarily complicated.
I’m keeping both scenarios on the table until BTC gives a clearer signal. The level is obvious, the liquidity zones are clear, and now the market needs to decide which side it wants to take.
The market is volatile, so you have to manage your own risk.
$BTC
$NVDA.US
{stock_us}(NVDA.US)
$GOOGL.US
{stock_us}(GOOGL.US)
BITCOIN AT A CRITICAL DECISION POINT : $81,812 BREAKOUT OR LIQUIDITY SWEEP LOWER ?
Bitcoin is sitting at a level where the next few 4H candles could become very important.
Right now, $81,812 is the key level I’m watching. Price is basically at a decision point, and I think there are two clear scenarios to keep in mind rather than forcing a direction too early. The first scenario is a clean breakout above $81,812. But for me, simply wicking above the level wouldn’t be enough. I’d want to see a proper 4H close above $81,812, followed by several candles holding above it. That kind of confirmation would make the breakout more meaningful and could open the way toward the $87,000 area first.
If BTC manages to build support above that level instead of immediately losing it, the next area I’d be watching is around $93,000. That would represent a much larger continuation from the current structure.
The second scenario is the opposite.
If BTC fails to reclaim and hold $81,812, the market could still have unfinished business below. In that case, another move lower could act as a liquidity sweep rather than an immediate confirmation of a larger bearish trend.
The areas I’m watching on the downside are around $73,000 and $71,000.
This is why I don’t think the current level should be treated casualy. The reaction around $81,812 can tell us a lot about what BTC wants to do next. A breakout followed by sustained 4H closes above the level would support the upside scenario, while continued rejection could bring the lower liquidity zones back into focus.
Personally, I’d rather wait for the market to show its hand than assume that one side has already won.
A clean reclaim is one thing. A quick wick above the level followed by a rejection is something completely different.
So for now, $81,812 remains the line I’m watching most closely.
Above it with confirmation: $87K and potentially $93K come into focus.
Below it: $73K and $71K become the key downside areas to monitor.
The next few 4H candles could be more important than the current candle itself. Patience matters here because chasing either direction before confirmation can make an otherwise simple setup unnecessarily complicated.
I’m keeping both scenarios on the table until BTC gives a clearer signal. The level is obvious, the liquidity zones are clear, and now the market needs to decide which side it wants to take.
The market is volatile, so you have to manage your own risk.
$BTC
$NVDA.US
$GOOGL.US
Right now, $81,812 is the key level I’m watching. Price is basically at a decision point, and I think there are two clear scenarios to keep in mind rather than forcing a direction too early. The first scenario is a clean breakout above $81,812. But for me, simply wicking above the level wouldn’t be enough. I’d want to see a proper 4H close above $81,812, followed by several candles holding above it. That kind of confirmation would make the breakout more meaningful and could open the way toward the $87,000 area first.
If BTC manages to build support above that level instead of immediately losing it, the next area I’d be watching is around $93,000. That would represent a much larger continuation from the current structure.
The second scenario is the opposite.
If BTC fails to reclaim and hold $81,812, the market could still have unfinished business below. In that case, another move lower could act as a liquidity sweep rather than an immediate confirmation of a larger bearish trend.
The areas I’m watching on the downside are around $73,000 and $71,000.
This is why I don’t think the current level should be treated casualy. The reaction around $81,812 can tell us a lot about what BTC wants to do next. A breakout followed by sustained 4H closes above the level would support the upside scenario, while continued rejection could bring the lower liquidity zones back into focus.
Personally, I’d rather wait for the market to show its hand than assume that one side has already won.
A clean reclaim is one thing. A quick wick above the level followed by a rejection is something completely different.
So for now, $81,812 remains the line I’m watching most closely.
Above it with confirmation: $87K and potentially $93K come into focus.
Below it: $73K and $71K become the key downside areas to monitor.
The next few 4H candles could be more important than the current candle itself. Patience matters here because chasing either direction before confirmation can make an otherwise simple setup unnecessarily complicated.
I’m keeping both scenarios on the table until BTC gives a clearer signal. The level is obvious, the liquidity zones are clear, and now the market needs to decide which side it wants to take.
The market is volatile, so you have to manage your own risk.
$BTC
$NVDA.US
$GOOGL.US
6
2.4k
·
--
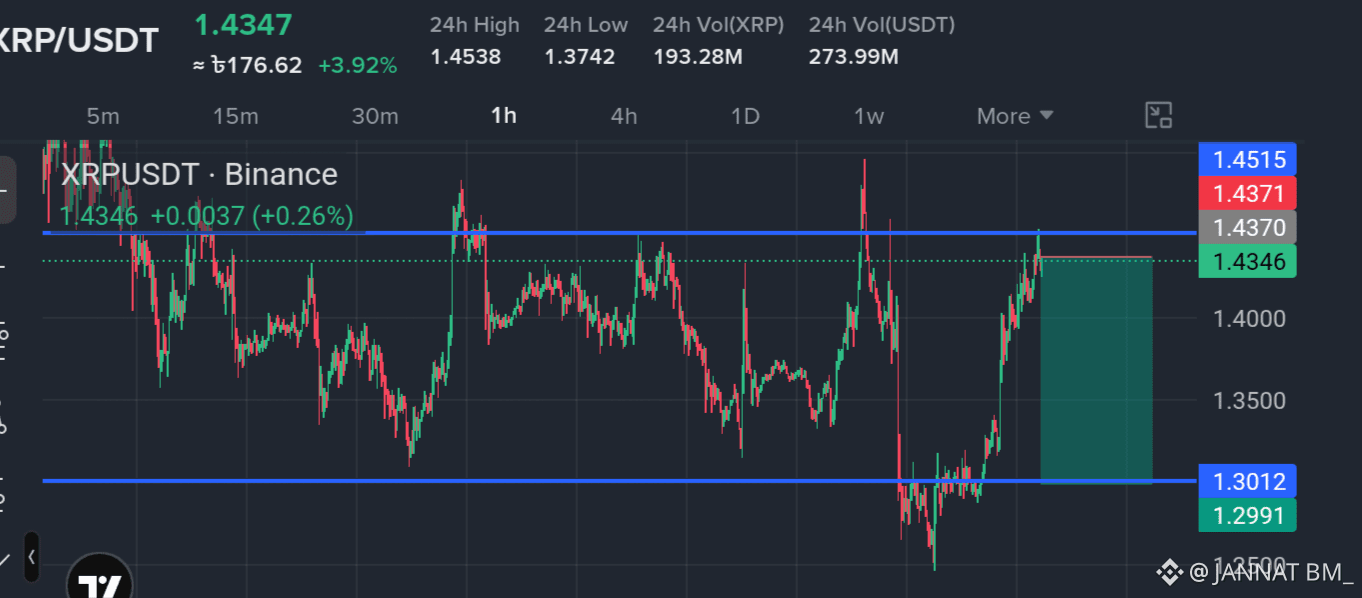
$XRP SHORT SIGNAL 🔴
{future}(XRPUSDT)
XRP is testing the major $1.437 resistance after a strong recovery from the $1.30 support zone.
Entry: $1.437.
TP : $1.30.
Wait for confirmation and manage leverage carefully. The market is volatile, so you have to manage your own risk.
$XRP SHORT SIGNAL 🔴
XRP is testing the major $1.437 resistance after a strong recovery from the $1.30 support zone.
Entry: $1.437.
TP : $1.30.
Wait for confirmation and manage leverage carefully. The market is volatile, so you have to manage your own risk.
XRP is testing the major $1.437 resistance after a strong recovery from the $1.30 support zone.
Entry: $1.437.
TP : $1.30.
Wait for confirmation and manage leverage carefully. The market is volatile, so you have to manage your own risk.
3
352
·
--
$BTC LONG SIGNAL 🟢
{future}(BTCUSDT)
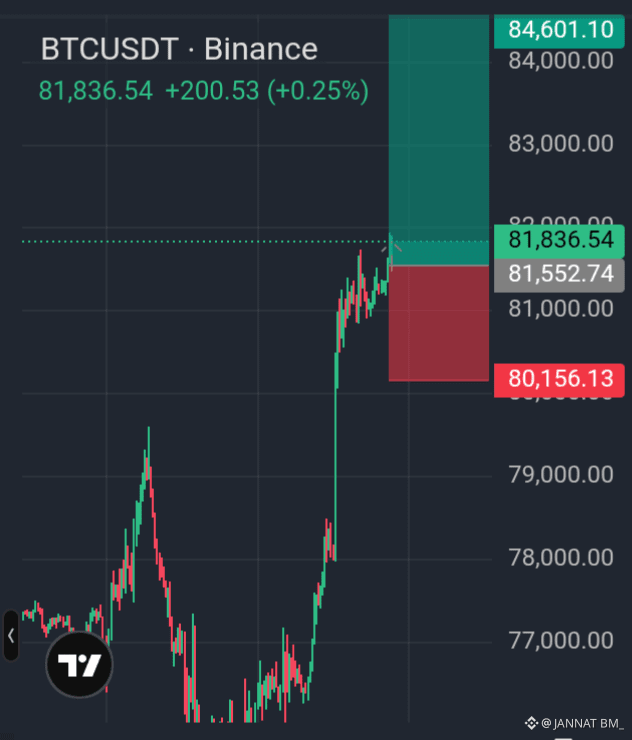
Long setup as BTC holds above the $81,500 area after a strong breakout.
Entry: $81,550
TP1: $83,000
TP2: $84,600
Stop Loss: $80,150
Wait for confirmation around the entry zone and keep leverage controlled. The market is volatile, so you have to manage your own risk.
$BTCS.US
{stock_us}(BTCS.US)
$BTCT.US
{stock_us}(BTCT.US)
$BTC LONG SIGNAL 🟢
Long setup as BTC holds above the $81,500 area after a strong breakout.
Entry: $81,550
TP1: $83,000
TP2: $84,600
Stop Loss: $80,150
Wait for confirmation around the entry zone and keep leverage controlled. The market is volatile, so you have to manage your own risk.
$BTCS.US
$BTCT.US
Long setup as BTC holds above the $81,500 area after a strong breakout.
Entry: $81,550
TP1: $83,000
TP2: $84,600
Stop Loss: $80,150
Wait for confirmation around the entry zone and keep leverage controlled. The market is volatile, so you have to manage your own risk.
$BTCS.US
$BTCT.US
5
949
·
--
$BNB TRADE SIGNAL 🔴
{future}(BNBUSDT)
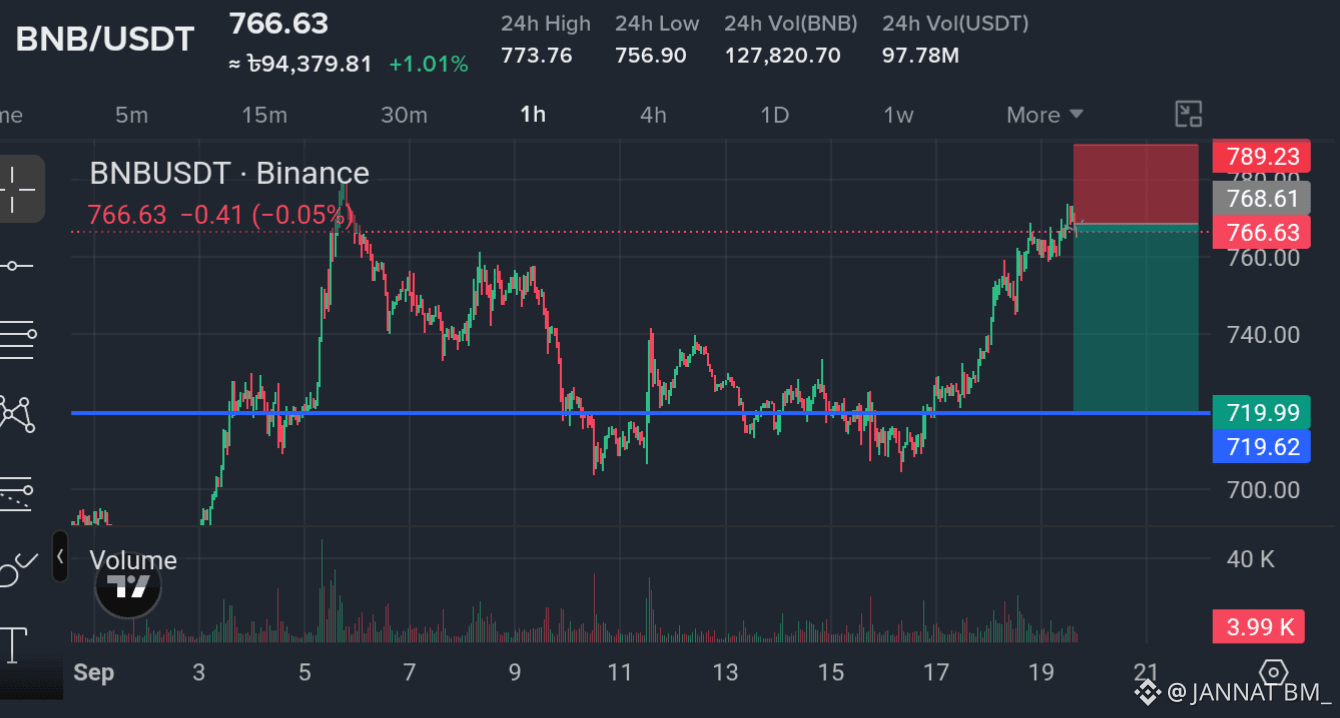
Short setup as price approaches the $766–769 resistance zone.
Entry: $766–769
TP1: $740
TP2: $720
Stop Loss: $789
Wait for rejection/confirmation before entering. Keep risk controlled and avoid excessive leverage. The market is volatile, so you have to manage your own risk.
$NVDAB
{spot}(NVDABUSDT)
$AAPLB
{spot}(AAPLBUSDT)
$BNB TRADE SIGNAL 🔴
Short setup as price approaches the $766–769 resistance zone.
Entry: $766–769
TP1: $740
TP2: $720
Stop Loss: $789
Wait for rejection/confirmation before entering. Keep risk controlled and avoid excessive leverage. The market is volatile, so you have to manage your own risk.
$NVDAB
$AAPLB
Short setup as price approaches the $766–769 resistance zone.
Entry: $766–769
TP1: $740
TP2: $720
Stop Loss: $789
Wait for rejection/confirmation before entering. Keep risk controlled and avoid excessive leverage. The market is volatile, so you have to manage your own risk.
$NVDAB
$AAPLB
2
318
·
--
Article
BITCOIN'S LIQUIDITY SHIFT IS GETTING INTERESTINGHmm, really.....
Sometimes the most interesting part of a market move isn’t the percentage gain.
It’s what happens to liquidity before and after the move.
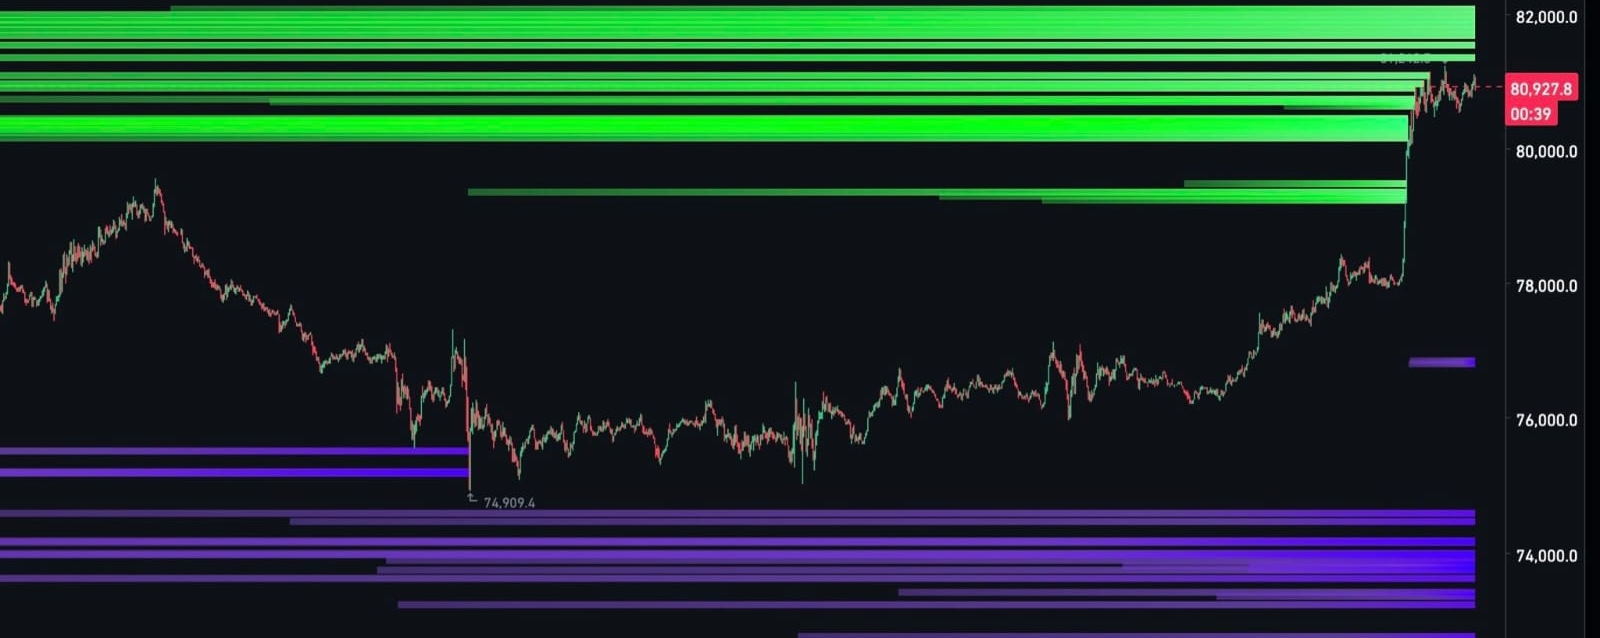
Just two days ago, BTC was still clearing out liquidity below the range around $75K. At that point, the downside was getting most of the attention, and the market was showing us exactly where traders had positioned themselves.
But the picture has changed pretty quickly.
BTC has now moved roughly 6% to the upside, and price is already tapping into the major liquidity cluster that I’ve been watching throughout the week.
That shift matters because liquidity rarely disappears without changing the structure of the market around it. When price was sitting lower, the focus was on the downside liquidity. Now that BTC has moved higher, attention naturaly shifts toward the liquidity sitting above price.
And this is where things start getting interesting.
The previous high around $83K is still sitting there as an obvious area of interest.
From my perspective, the important question isn’t simply whether BTC can keep going up after this move.
The bigger question is what happens when price reaches that previous high.
Does BTC get rejected again?
Or does it finally clear that liquidity and continue pushing higher?
For now, my bias hasn’t changed.
I still believe BTC could sweep the previous high around $83K.
But I’m also watching what happens after that sweep, because taking the high alone doesn’t automatically mean the bearish structure is finished.
The reaction around that level will tell us much more.
If BTC pushes through the previous high with enough strength, then the current bearish structure could potentially be invalidated. That would change the way I look at the entire setup.
And honestly, that’s the part I find most interesting.
A few days ago, the market was focused on what was sitting underneath price.
Now we’re talking about liquidity above it.
That doesn’t mean the market suddenly became predictable. It just means the location of the important levels has changed, and traders need to adjust their attention accordingly.
This is also why I think chasing the move after a 6% upside move can be dangerous.
The better information may come from how BTC behaves around the liquidity cluster rather than from the move itself.
A clean sweep, a rejection, a breakout, or acceptance above the previous high would each tell us something different about the current structure.
For me, $83K remains the level to watch.
If BTC reaches it, I’ll be paying less attention to the excitement around the move and more attention to the reaction.
Because sometimes the real signal isn’t the liquidity being taken.
It’s what price does immediately after.
So the question I’m watching now is simple: if BTC finally takes that previous high around $83K, does the market reject the move again, or are we watching the bearish structure finally lose its grip?
$BTC
$NVDAB
{spot}(NVDABUSDT)
$NVDA.US
{stock_us}(NVDA.US)
BITCOIN'S LIQUIDITY SHIFT IS GETTING INTERESTING
Hmm, really.....
Sometimes the most interesting part of a market move isn’t the percentage gain.
It’s what happens to liquidity before and after the move.
Just two days ago, BTC was still clearing out liquidity below the range around $75K. At that point, the downside was getting most of the attention, and the market was showing us exactly where traders had positioned themselves.
But the picture has changed pretty quickly.
BTC has now moved roughly 6% to the upside, and price is already tapping into the major liquidity cluster that I’ve been watching throughout the week.
That shift matters because liquidity rarely disappears without changing the structure of the market around it. When price was sitting lower, the focus was on the downside liquidity. Now that BTC has moved higher, attention naturaly shifts toward the liquidity sitting above price.
And this is where things start getting interesting.
The previous high around $83K is still sitting there as an obvious area of interest.
From my perspective, the important question isn’t simply whether BTC can keep going up after this move.
The bigger question is what happens when price reaches that previous high.
Does BTC get rejected again?
Or does it finally clear that liquidity and continue pushing higher?
For now, my bias hasn’t changed.
I still believe BTC could sweep the previous high around $83K.
But I’m also watching what happens after that sweep, because taking the high alone doesn’t automatically mean the bearish structure is finished.
The reaction around that level will tell us much more.
If BTC pushes through the previous high with enough strength, then the current bearish structure could potentially be invalidated. That would change the way I look at the entire setup.
And honestly, that’s the part I find most interesting.
A few days ago, the market was focused on what was sitting underneath price.
Now we’re talking about liquidity above it.
That doesn’t mean the market suddenly became predictable. It just means the location of the important levels has changed, and traders need to adjust their attention accordingly.
This is also why I think chasing the move after a 6% upside move can be dangerous.
The better information may come from how BTC behaves around the liquidity cluster rather than from the move itself.
A clean sweep, a rejection, a breakout, or acceptance above the previous high would each tell us something different about the current structure.
For me, $83K remains the level to watch.
If BTC reaches it, I’ll be paying less attention to the excitement around the move and more attention to the reaction.
Because sometimes the real signal isn’t the liquidity being taken.
It’s what price does immediately after.
So the question I’m watching now is simple: if BTC finally takes that previous high around $83K, does the market reject the move again, or are we watching the bearish structure finally lose its grip?
$BTC
$NVDAB
$NVDA.US
Sometimes the most interesting part of a market move isn’t the percentage gain.
It’s what happens to liquidity before and after the move.
Just two days ago, BTC was still clearing out liquidity below the range around $75K. At that point, the downside was getting most of the attention, and the market was showing us exactly where traders had positioned themselves.
But the picture has changed pretty quickly.
BTC has now moved roughly 6% to the upside, and price is already tapping into the major liquidity cluster that I’ve been watching throughout the week.
That shift matters because liquidity rarely disappears without changing the structure of the market around it. When price was sitting lower, the focus was on the downside liquidity. Now that BTC has moved higher, attention naturaly shifts toward the liquidity sitting above price.
And this is where things start getting interesting.
The previous high around $83K is still sitting there as an obvious area of interest.
From my perspective, the important question isn’t simply whether BTC can keep going up after this move.
The bigger question is what happens when price reaches that previous high.
Does BTC get rejected again?
Or does it finally clear that liquidity and continue pushing higher?
For now, my bias hasn’t changed.
I still believe BTC could sweep the previous high around $83K.
But I’m also watching what happens after that sweep, because taking the high alone doesn’t automatically mean the bearish structure is finished.
The reaction around that level will tell us much more.
If BTC pushes through the previous high with enough strength, then the current bearish structure could potentially be invalidated. That would change the way I look at the entire setup.
And honestly, that’s the part I find most interesting.
A few days ago, the market was focused on what was sitting underneath price.
Now we’re talking about liquidity above it.
That doesn’t mean the market suddenly became predictable. It just means the location of the important levels has changed, and traders need to adjust their attention accordingly.
This is also why I think chasing the move after a 6% upside move can be dangerous.
The better information may come from how BTC behaves around the liquidity cluster rather than from the move itself.
A clean sweep, a rejection, a breakout, or acceptance above the previous high would each tell us something different about the current structure.
For me, $83K remains the level to watch.
If BTC reaches it, I’ll be paying less attention to the excitement around the move and more attention to the reaction.
Because sometimes the real signal isn’t the liquidity being taken.
It’s what price does immediately after.
So the question I’m watching now is simple: if BTC finally takes that previous high around $83K, does the market reject the move again, or are we watching the bearish structure finally lose its grip?
$BTC
$NVDAB
$NVDA.US
4
1.4k
·
--
$ZEC ’S 96X RUN IS ABSOLUTELY INSANE
{future}(ZECUSDT)
Just looking at the numbers is wild.
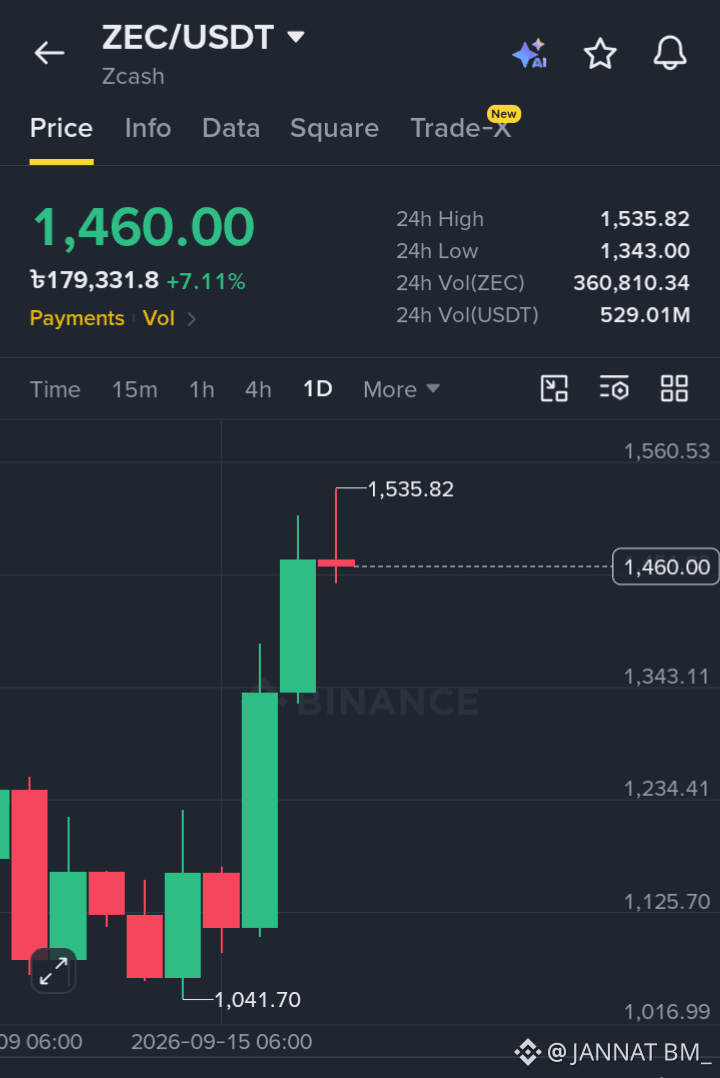
A $10,400 investment in $ZEC around two years ago would be worth more than $1 million today, based on the reported move.
That’s roughly a 96x return in less than two years. Moves like this are a reminder of how extreme crypto cycles can become. But after such a massive run, the bigger question is whether $ZEC can maintain this momentum or needs a period of consolidation.
I’m watching the next move closely.
$ZEC ’S 96X RUN IS ABSOLUTELY INSANE
Just looking at the numbers is wild.
A $10,400 investment in $ZEC around two years ago would be worth more than $1 million today, based on the reported move.
That’s roughly a 96x return in less than two years. Moves like this are a reminder of how extreme crypto cycles can become. But after such a massive run, the bigger question is whether $ZEC can maintain this momentum or needs a period of consolidation.
I’m watching the next move closely.
Just looking at the numbers is wild.
A $10,400 investment in $ZEC around two years ago would be worth more than $1 million today, based on the reported move.
That’s roughly a 96x return in less than two years. Moves like this are a reminder of how extreme crypto cycles can become. But after such a massive run, the bigger question is whether $ZEC can maintain this momentum or needs a period of consolidation.
I’m watching the next move closely.
2
201
·
--
Bullish
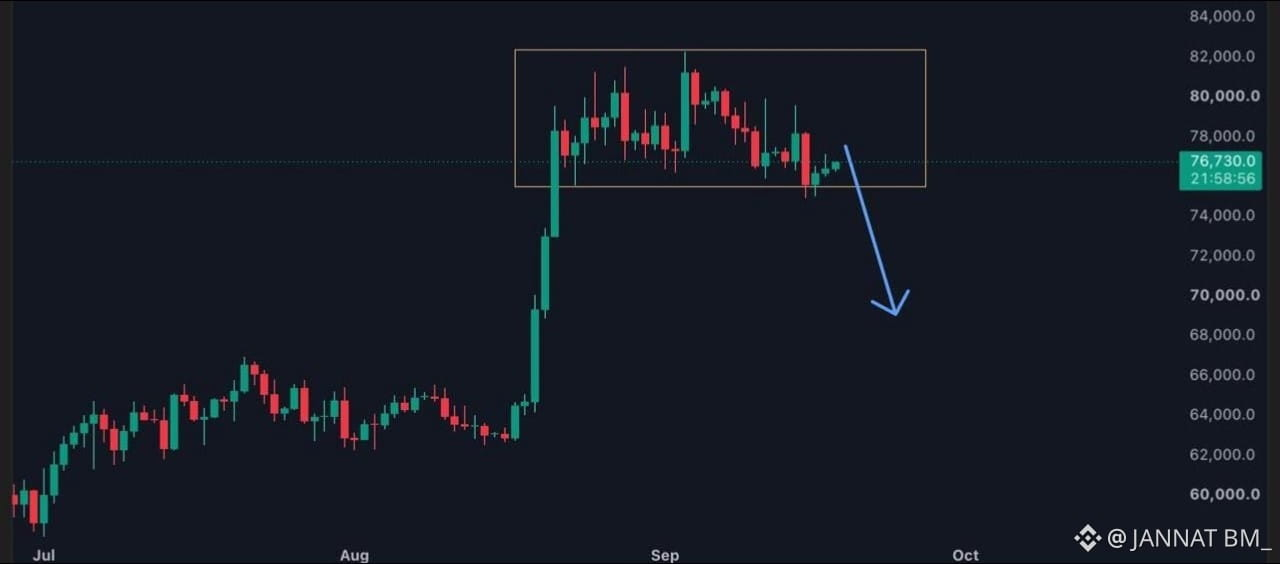
Markets have actually held up pretty well this week despite several important macro events hitting at the same time. The failed CLARITY Act vote added some uncertainty, while the 25bps rate hike also gave risk assets another reason to stay cautious. Still, the broader market has managd to absorb the pressure without a major breakdown.
Now, attention turns to the Bank of Japan’s rate decision, which is coming in just a few hours. This could bring another wave of volatility, especially if the decision or guidance surprises the market.
For me, the key is watching how price reacts rather than chasing the first move.
$BTC
{future}(BTCUSDT)
Markets have actually held up pretty well this week despite several important macro events hitting at the same time. The failed CLARITY Act vote added some uncertainty, while the 25bps rate hike also gave risk assets another reason to stay cautious. Still, the broader market has managd to absorb the pressure without a major breakdown.
Now, attention turns to the Bank of Japan’s rate decision, which is coming in just a few hours. This could bring another wave of volatility, especially if the decision or guidance surprises the market.
For me, the key is watching how price reacts rather than chasing the first move.
$BTC
Now, attention turns to the Bank of Japan’s rate decision, which is coming in just a few hours. This could bring another wave of volatility, especially if the decision or guidance surprises the market.
For me, the key is watching how price reacts rather than chasing the first move.
$BTC
3
194
·
--
Bullish
#solana
$SOL - Update
{future}(SOLUSDT)
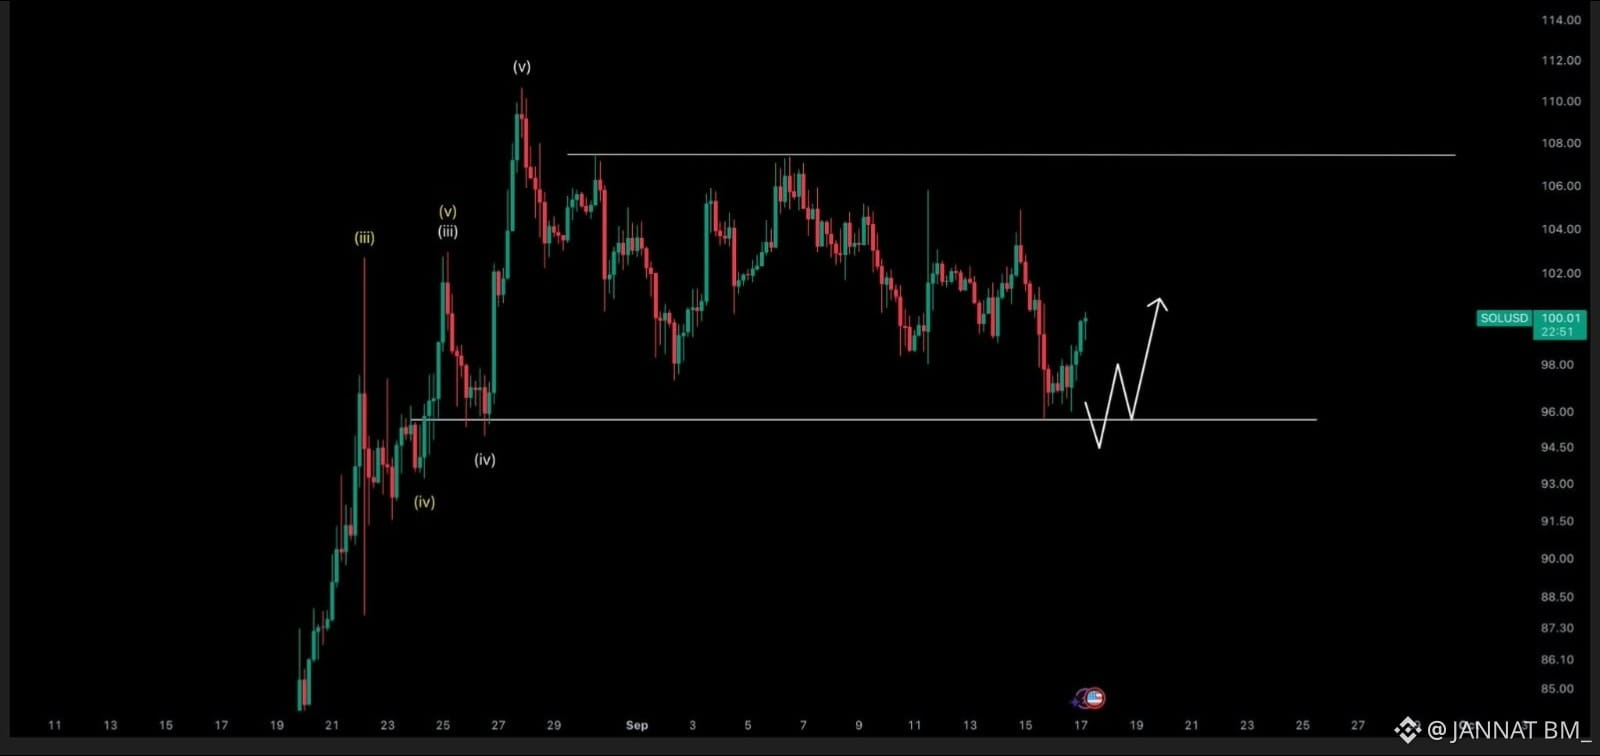
So far, so good. The setup is still playing out as expected. I’d like to see one more push to clear that recent high and take the liquidity above it before we get a deeper move lower. For now, patience is key.
#solana
$SOL - Update
So far, so good. The setup is still playing out as expected. I’d like to see one more push to clear that recent high and take the liquidity above it before we get a deeper move lower. For now, patience is key.
$SOL - Update
So far, so good. The setup is still playing out as expected. I’d like to see one more push to clear that recent high and take the liquidity above it before we get a deeper move lower. For now, patience is key.
4
279
·
--
Article
BITCOIN RANGE BREAKDOWN : WHAT HAPPENS NEXT ?I mean....
Sometimes the hardest part of trading isn’t knowing where price might go. It’s knowing when to stop forcing an opinion.
Bitcoin is a good example of that right now.
For a while, the market had a clear range. Price moved between familiar boundaries, liquidity built on both sides, and traders had levels they could work with. But once a range breaks, the entire structure starts to change.
That’s where things get interesting.
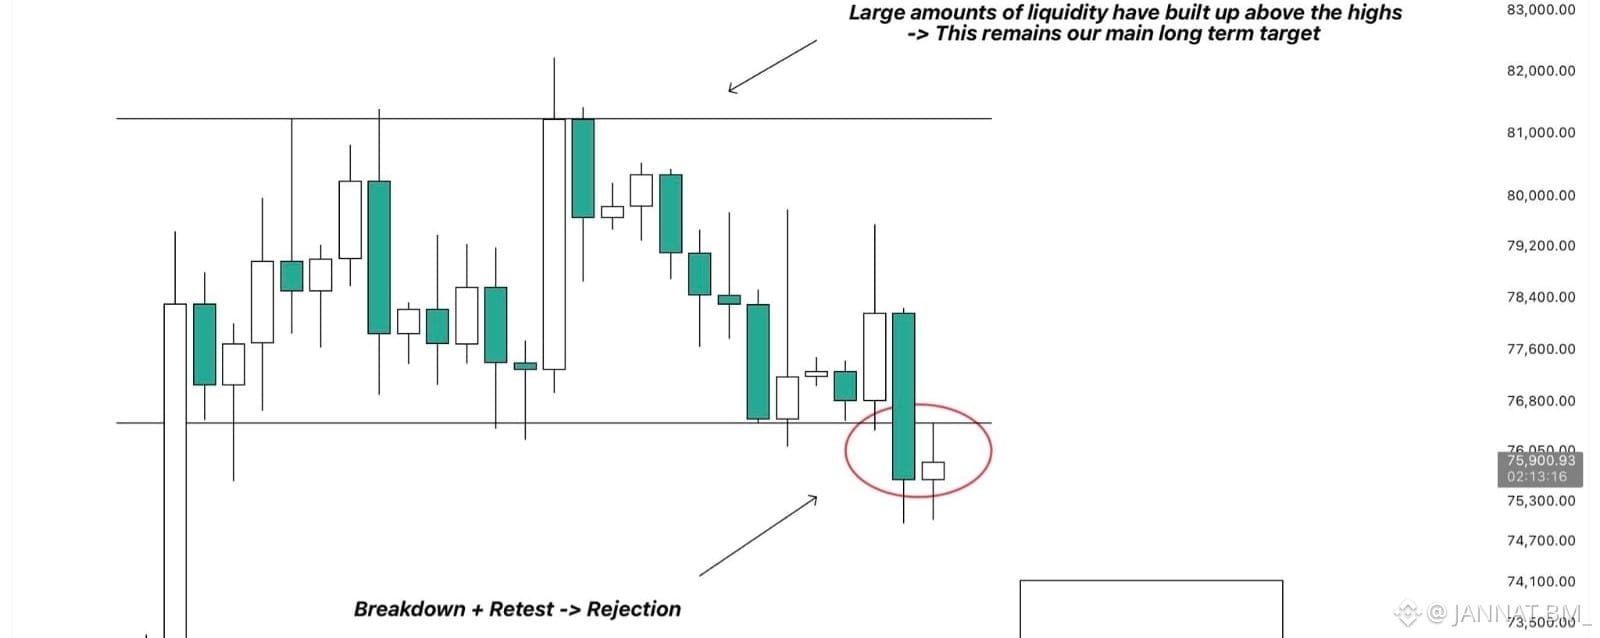
Yesterday’s failed Clarity Act vote was followed by roughly a 3% selloff, and BTC eventually closed the daily candle below the range lows.
A breakdown by itself doesn’t always mean the market has to continue lower. What matters to me is what happens after the breakdown.
And so far, Bitcoin has retested the lower boundary of the old range.
The important part is that this area now appears to be acting as resistance. That changes the short-term picture quite a bit. A level that previously helped define the range can become a barrier once price loses it. If BTC cannot reclaim that area, the market may need to search for lower levels where buyers are willing to step back in.
For me, the next level that matters is $76K.
If today’s daily candle closes back below $76K after this retest, I’ll be watching the $74K–$70K region closely.
That’s also the area where I’m planning to add to my already running swing long.
But I don’t want to assume that simply touching a support zone means the market is ready to reverse.
The reaction matters more than the level itself.
Once price reaches that $74K–$70K area, I’ll be watching for a reclaim of the previous range. If Bitcoin can get back inside the range and start holding it again, the structure would begin to look very different. That’s where I’d start looking for continuation toward the previous highs around $83K.
Until then, I think there’s a strong argument for patience.
This is one of those environments where short-term positions can become unnecessarily difficult. There are breakdowns, retests, liquidity, and plenty of reasons for traders to change their bias every few hours.
Sometimes doing nothing is simply better than trying to trade every move.
For me, the bigger question isn’t whether Bitcoin can bounce from here. It’s whether buyers can actually reclaim the structure that was lost.
Because there’s a big difference between a temporary bounce and a genuine recovery of the range.
And if BTC does move deeper toward $74K–$70K, I’d rather watch how price behaves there than try to predict every candle before it happens.
The market doesn’t owe us a clean setup.
So maybe the real question is: if Bitcoin loses its range today, will the next opportunity come from catching the bottom, or from waiting for the market to prove that the range has been reclaimed?
$BTC
{future}(BTCUSDT)
BITCOIN RANGE BREAKDOWN : WHAT HAPPENS NEXT ?
I mean....
Sometimes the hardest part of trading isn’t knowing where price might go. It’s knowing when to stop forcing an opinion.
Bitcoin is a good example of that right now.
For a while, the market had a clear range. Price moved between familiar boundaries, liquidity built on both sides, and traders had levels they could work with. But once a range breaks, the entire structure starts to change.
That’s where things get interesting.
Yesterday’s failed Clarity Act vote was followed by roughly a 3% selloff, and BTC eventually closed the daily candle below the range lows.
A breakdown by itself doesn’t always mean the market has to continue lower. What matters to me is what happens after the breakdown.
And so far, Bitcoin has retested the lower boundary of the old range.
The important part is that this area now appears to be acting as resistance. That changes the short-term picture quite a bit. A level that previously helped define the range can become a barrier once price loses it. If BTC cannot reclaim that area, the market may need to search for lower levels where buyers are willing to step back in.
For me, the next level that matters is $76K.
If today’s daily candle closes back below $76K after this retest, I’ll be watching the $74K–$70K region closely.
That’s also the area where I’m planning to add to my already running swing long.
But I don’t want to assume that simply touching a support zone means the market is ready to reverse.
The reaction matters more than the level itself.
Once price reaches that $74K–$70K area, I’ll be watching for a reclaim of the previous range. If Bitcoin can get back inside the range and start holding it again, the structure would begin to look very different. That’s where I’d start looking for continuation toward the previous highs around $83K.
Until then, I think there’s a strong argument for patience.
This is one of those environments where short-term positions can become unnecessarily difficult. There are breakdowns, retests, liquidity, and plenty of reasons for traders to change their bias every few hours.
Sometimes doing nothing is simply better than trying to trade every move.
For me, the bigger question isn’t whether Bitcoin can bounce from here. It’s whether buyers can actually reclaim the structure that was lost.
Because there’s a big difference between a temporary bounce and a genuine recovery of the range.
And if BTC does move deeper toward $74K–$70K, I’d rather watch how price behaves there than try to predict every candle before it happens.
The market doesn’t owe us a clean setup.
So maybe the real question is: if Bitcoin loses its range today, will the next opportunity come from catching the bottom, or from waiting for the market to prove that the range has been reclaimed?
$BTC
Sometimes the hardest part of trading isn’t knowing where price might go. It’s knowing when to stop forcing an opinion.
Bitcoin is a good example of that right now.
For a while, the market had a clear range. Price moved between familiar boundaries, liquidity built on both sides, and traders had levels they could work with. But once a range breaks, the entire structure starts to change.
That’s where things get interesting.
Yesterday’s failed Clarity Act vote was followed by roughly a 3% selloff, and BTC eventually closed the daily candle below the range lows.
A breakdown by itself doesn’t always mean the market has to continue lower. What matters to me is what happens after the breakdown.
And so far, Bitcoin has retested the lower boundary of the old range.
The important part is that this area now appears to be acting as resistance. That changes the short-term picture quite a bit. A level that previously helped define the range can become a barrier once price loses it. If BTC cannot reclaim that area, the market may need to search for lower levels where buyers are willing to step back in.
For me, the next level that matters is $76K.
If today’s daily candle closes back below $76K after this retest, I’ll be watching the $74K–$70K region closely.
That’s also the area where I’m planning to add to my already running swing long.
But I don’t want to assume that simply touching a support zone means the market is ready to reverse.
The reaction matters more than the level itself.
Once price reaches that $74K–$70K area, I’ll be watching for a reclaim of the previous range. If Bitcoin can get back inside the range and start holding it again, the structure would begin to look very different. That’s where I’d start looking for continuation toward the previous highs around $83K.
Until then, I think there’s a strong argument for patience.
This is one of those environments where short-term positions can become unnecessarily difficult. There are breakdowns, retests, liquidity, and plenty of reasons for traders to change their bias every few hours.
Sometimes doing nothing is simply better than trying to trade every move.
For me, the bigger question isn’t whether Bitcoin can bounce from here. It’s whether buyers can actually reclaim the structure that was lost.
Because there’s a big difference between a temporary bounce and a genuine recovery of the range.
And if BTC does move deeper toward $74K–$70K, I’d rather watch how price behaves there than try to predict every candle before it happens.
The market doesn’t owe us a clean setup.
So maybe the real question is: if Bitcoin loses its range today, will the next opportunity come from catching the bottom, or from waiting for the market to prove that the range has been reclaimed?
$BTC
3
224
·
--
Is Zcash $ZEC flexin’ its privacy muscles again, or what?
ZEC SHORT ENTRY 🔴
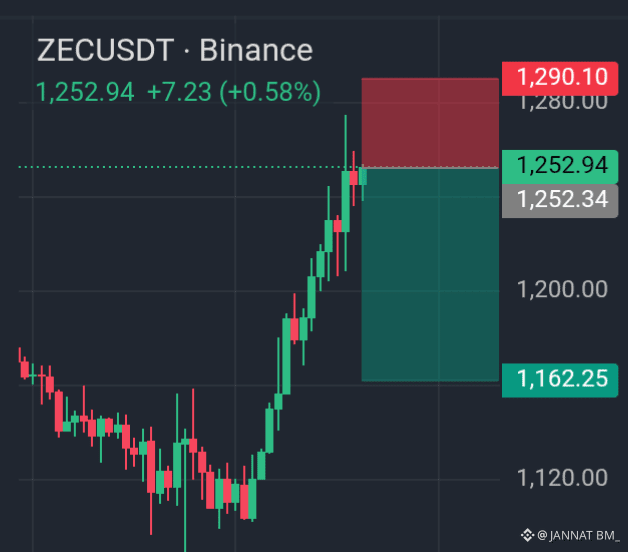
ENTRY : 1.248.0
TP : 1.162.0
SL : 1.290.0
{future}(ZECUSDT)
$ZEC is up +12.14% today, currently sitting around $1,252.94 after touching a 24-hour high of $1,275. The market activity is looking seriously heavy with over $343M USDT moved in 24 hours, and that 1-year performance sitting at an insane +2,379%!
It definitely looks like momentum is warming up after that clean bounce off the lows. But as always in crypto, it pays to let the chart settle before jumping to conclusions.
Are we testing $1,300 next, or is it time for a quick rest? What’s your take?
Is Zcash $ZEC flexin’ its privacy muscles again, or what?
ZEC SHORT ENTRY 🔴
ENTRY : 1.248.0
TP : 1.162.0
SL : 1.290.0
$ZEC is up +12.14% today, currently sitting around $1,252.94 after touching a 24-hour high of $1,275. The market activity is looking seriously heavy with over $343M USDT moved in 24 hours, and that 1-year performance sitting at an insane +2,379%!
It definitely looks like momentum is warming up after that clean bounce off the lows. But as always in crypto, it pays to let the chart settle before jumping to conclusions.
Are we testing $1,300 next, or is it time for a quick rest? What’s your take?
ZEC SHORT ENTRY 🔴
ENTRY : 1.248.0
TP : 1.162.0
SL : 1.290.0
$ZEC is up +12.14% today, currently sitting around $1,252.94 after touching a 24-hour high of $1,275. The market activity is looking seriously heavy with over $343M USDT moved in 24 hours, and that 1-year performance sitting at an insane +2,379%!
It definitely looks like momentum is warming up after that clean bounce off the lows. But as always in crypto, it pays to let the chart settle before jumping to conclusions.
Are we testing $1,300 next, or is it time for a quick rest? What’s your take?
2
2
259
Log in to explore more content
Join global crypto users on Binance Square
⚡️ Get latest and useful information about crypto.
💬 Trusted by the world’s largest crypto exchange.
👍 Discover real insights from verified creators.
Email / Phone number
Trending Topics
AIStocksWhatNext
207,321 views
2,272 Discussing
Share & Win Traffic Reward in our Trending Hashtag Campaign
✨Topic: What Other Investment Opportunities Remain as AI Stocks Keep Rising?
👉How to Join:
Publish a short post or article with hashtag #AIStocksWhatNext
Share whether you’re bullish or bearish, and post your AI stock holdings or trade — using the trade widget may improve your eligibility.
You can also strengthen your post by sharing data or charts, and avoiding AI-generated images.
✍️Create content based on the below angles:
- Nvidia says chip sales will double next year, and top AI companies keep hitting record revenue, the compute spend behind it is just as staggering. Is AI demand really taking off? And how long can it last? AI stocks are up across the board. Is this a real breakout, or just a short-term bounce?
- Industry leaders are calling to slow down AI development, while Trump plans to build an “AI Force”, claiming AI could account for 25% of U.S. GDP in the future. Whose side are you on? Will state-level backing be a long-term win for AI stocks?
- Are you buying AI stocks? Share your AI-related trade/holdings with our trade sharing widget.
⏰Campaign Period:
- 2026-09-22 7:00 - 2026-09-24 4:00 UTC
🎁Reward:
- Qualified posts that comply with the above guidelines and contain more than 100 words will be reviewed and may receive a random traffic boost of 500 to 3,000 views. You will receive a notification from your feed secretary if your post is selected.
- Get a chance to have your article featured on Binance Square Official
Need ideas for your post? Visit the topic page #AIStocksWhatNext or the Square Guide on How to Post for Better Reach.
Binance Square Official
·294 Likes
·636.3k views
BitcoinBreaksAboveMayHighNears$86K
7,184 views
127 Discussing
DogecoinRises15%
18,007 views
675 Discussing