

QuantGIass
1.3k Posts

QuantGIass
Report
Block User
41 Following
115 Followers
142 Liked
Posts
All
Quotes
Videos
PINNED
·
--
The Big Short’s Last Interview: For Every $1 of AI Spending Announced, Market Value Rises by $3. This episode, let’s tell the story. The real-life prototype of the film *The Big Short*, Michael Burry, nearly disappeared from public view after 2008. In December 2025, he sat down on a podcast by *The Big Short* author Michael Lewis, saying this might be his last interview.
“Much of today’s and tomorrow’s demand isn’t driven by end customers. A lot of it, and maybe even most of it, is propped up by financing—off-balance-sheet and opaque.” 2026.7.24
#空头 #Ai #泡沫 #美股
The Big Short’s Last Interview: For Every $1 of AI Spending Announced, Market Value Rises by $3. This episode, let’s tell the story. The real-life prototype of the film *The Big Short*, Michael Burry, nearly disappeared from public view after 2008. In December 2025, he sat down on a podcast by *The Big Short* author Michael Lewis, saying this might be his last interview.
“Much of today’s and tomorrow’s demand isn’t driven by end customers. A lot of it, and maybe even most of it, is propped up by financing—off-balance-sheet and opaque.” 2026.7.24
#空头 #Ai #泡沫 #美股
“Much of today’s and tomorrow’s demand isn’t driven by end customers. A lot of it, and maybe even most of it, is propped up by financing—off-balance-sheet and opaque.” 2026.7.24
#空头 #Ai #泡沫 #美股
2
563
·
--
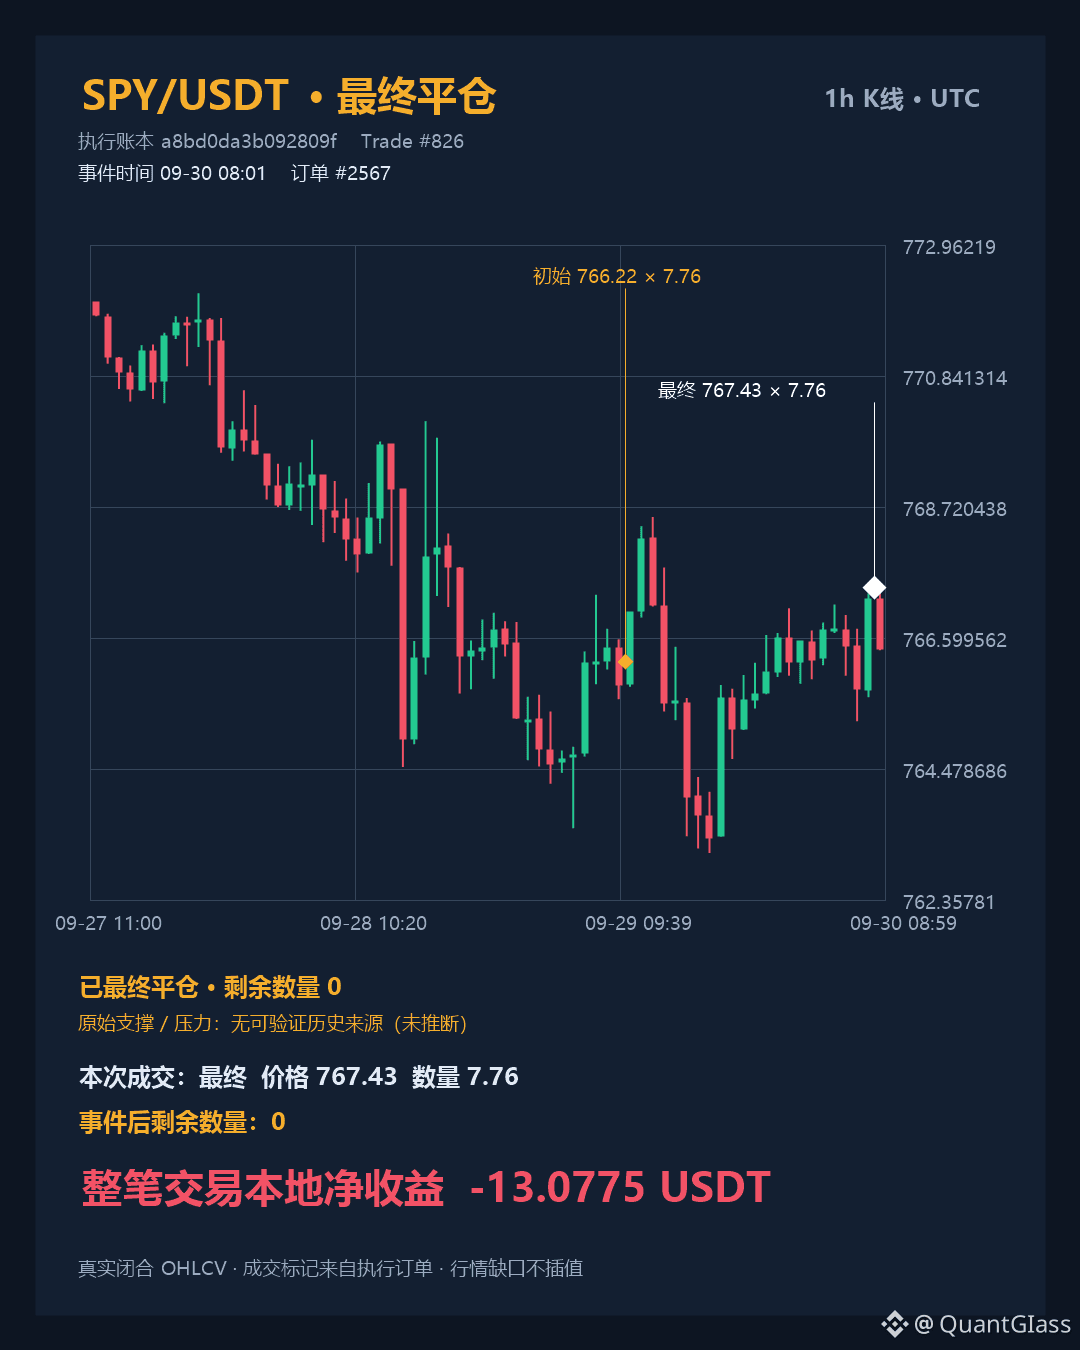
This SPY/USDT short was opened at 766.22 and finally exited at 767.43, with the exit price higher than the entry price. 767.43 then hugged the upper boundary of nearly 20 ranges between the 5m and 15m charts around 767.45, while the 1h upper boundary was at 767.75. After closing the position, the 5m chart pulled back to 766.48; the exit point landed near the short-term upper boundary instead of waiting for the price to return to the midpoint of the range.
The 15m window volume was 2.71, but the price change across 20 bars was only -0.05%, and the price remained constrained within 765.26–767.45. The 5m volume ratio was 0.88 and the 1h volume ratio was 0.48, so there was no synchronized expansion in volume/energy. Going forward, if the 5m or 15m close is above 767.45, the short-term upper boundary will be broken. Only if it breaks below 765.99 and the volume ratio rebounds would it be worth tracking a retest of the lower boundary of the range.
$SPY This live short position has already been closed.
First entry 766.22 → Final close 767.43
Final filled quantity 7.76 SPY | Remaining position 0
Closing time: 2026-09-30 16:01:50 (UTC+8)
Net profit/loss after all fees for the whole order: -13.0775 U
Execution process: Add to position 0 times · Partial reduction 0 times · Final close 1 time
Close confirmation: The execution ledger has confirmed the final fills and ended this order.
This is a real trade recap and does not indicate the outcome of the next trade.
This SPY/USDT short was opened at 766.22 and finally exited at 767.43, with the exit price higher than the entry price. 767.43 then hugged the upper boundary of nearly 20 ranges between the 5m and 15m charts around 767.45, while the 1h upper boundary was at 767.75. After closing the position, the 5m chart pulled back to 766.48; the exit point landed near the short-term upper boundary instead of waiting for the price to return to the midpoint of the range.
The 15m window volume was 2.71, but the price change across 20 bars was only -0.05%, and the price remained constrained within 765.26–767.45. The 5m volume ratio was 0.88 and the 1h volume ratio was 0.48, so there was no synchronized expansion in volume/energy. Going forward, if the 5m or 15m close is above 767.45, the short-term upper boundary will be broken. Only if it breaks below 765.99 and the volume ratio rebounds would it be worth tracking a retest of the lower boundary of the range.
$SPY This live short position has already been closed.
First entry 766.22 → Final close 767.43
Final filled quantity 7.76 SPY | Remaining position 0
Closing time: 2026-09-30 16:01:50 (UTC+8)
Net profit/loss after all fees for the whole order: -13.0775 U
Execution process: Add to position 0 times · Partial reduction 0 times · Final close 1 time
Close confirmation: The execution ledger has confirmed the final fills and ended this order.
This is a real trade recap and does not indicate the outcome of the next trade.
The 15m window volume was 2.71, but the price change across 20 bars was only -0.05%, and the price remained constrained within 765.26–767.45. The 5m volume ratio was 0.88 and the 1h volume ratio was 0.48, so there was no synchronized expansion in volume/energy. Going forward, if the 5m or 15m close is above 767.45, the short-term upper boundary will be broken. Only if it breaks below 765.99 and the volume ratio rebounds would it be worth tracking a retest of the lower boundary of the range.
$SPY This live short position has already been closed.
First entry 766.22 → Final close 767.43
Final filled quantity 7.76 SPY | Remaining position 0
Closing time: 2026-09-30 16:01:50 (UTC+8)
Net profit/loss after all fees for the whole order: -13.0775 U
Execution process: Add to position 0 times · Partial reduction 0 times · Final close 1 time
Close confirmation: The execution ledger has confirmed the final fills and ended this order.
This is a real trade recap and does not indicate the outcome of the next trade.
1
·
--
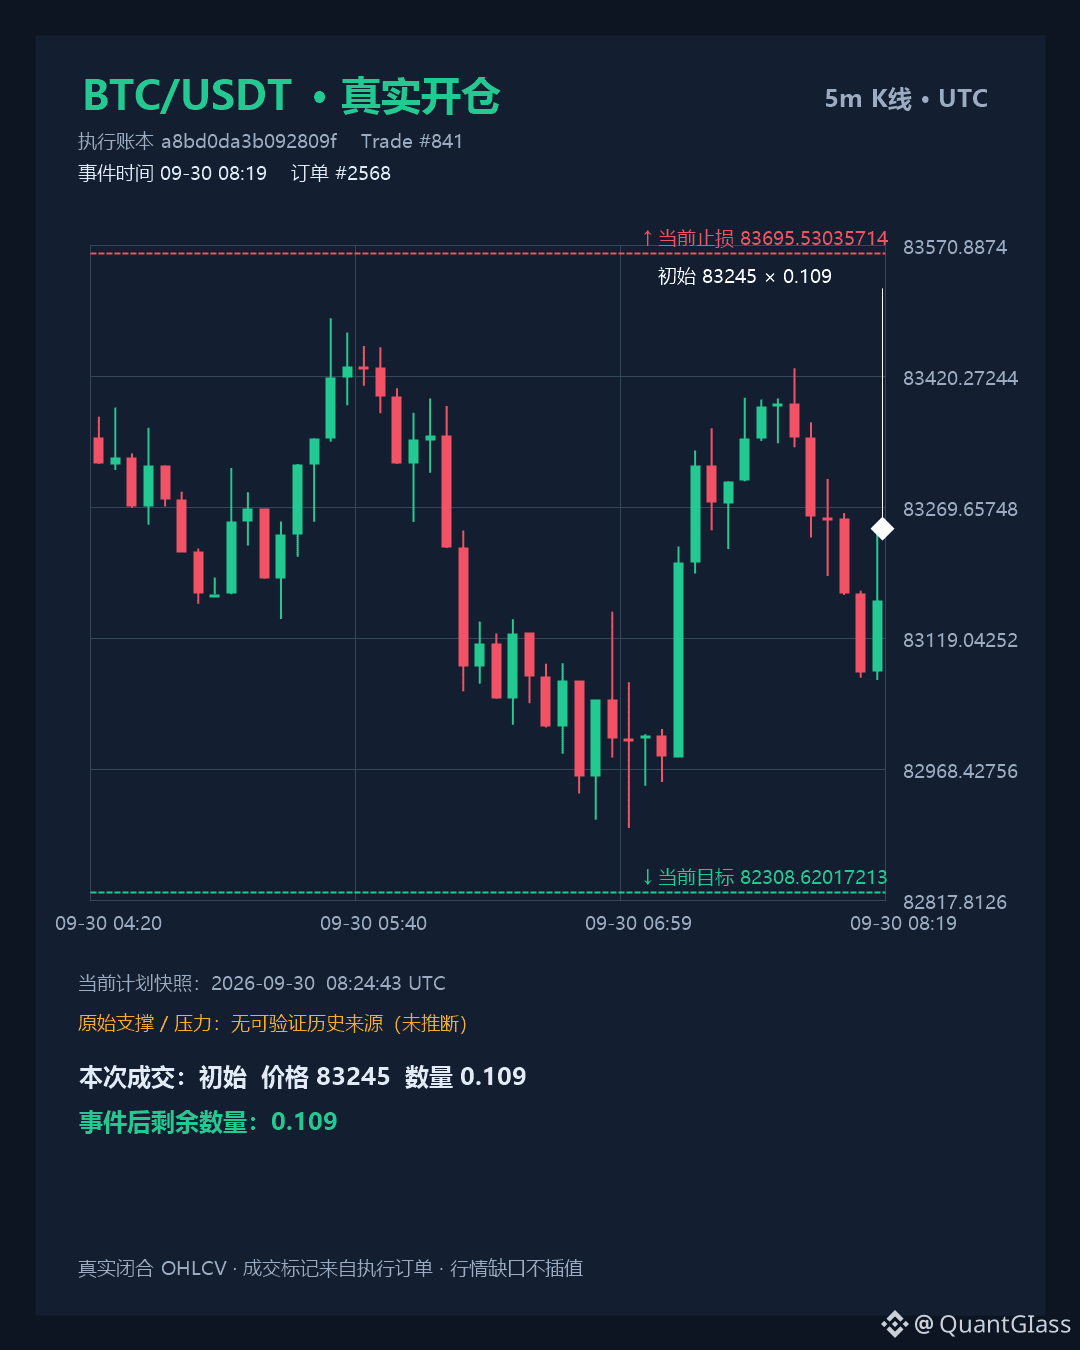
Verification conditions: If, in the next 15 minutes, a candlestick appears with a volume ratio higher than 1.66 and closes below 82901.3, then it indicates that the weak structure is continuing. If the 5-minute or 15-minute closes rise back above the upper boundary of their respective ranges (83430/83487.4), then the short-position’s short-term advantage will be tested; the invalidation price 83695.53 is the next-step risk boundary. In the 1-hour timeframe, there are 20 candles down totaling -1.25%, but the low point 82851.5 is still the extreme value of the range—not a confirmed support.
$BTC live short trade
• Actual executed price: 83245
• Quantity executed this time: 0.109 BTC
• Remaining quantity after the trade: 0.109 BTC
• Planned entry range: 82890.2 - 82925.77
• Invalidation close-out: 83695.53
• Target take-profit: 82308.62
Target upside +0.72%|Risk space -0.95%
For real trading records only; not investment advice.
Execution time: 2026-09-30 16:19:11 (UTC+8)
The invalidation price and target price use the current position plan, not the initial opening conditions.
Verification conditions: If, in the next 15 minutes, a candlestick appears with a volume ratio higher than 1.66 and closes below 82901.3, then it indicates that the weak structure is continuing. If the 5-minute or 15-minute closes rise back above the upper boundary of their respective ranges (83430/83487.4), then the short-position’s short-term advantage will be tested; the invalidation price 83695.53 is the next-step risk boundary. In the 1-hour timeframe, there are 20 candles down totaling -1.25%, but the low point 82851.5 is still the extreme value of the range—not a confirmed support.
$BTC live short trade
• Actual executed price: 83245
• Quantity executed this time: 0.109 BTC
• Remaining quantity after the trade: 0.109 BTC
• Planned entry range: 82890.2 - 82925.77
• Invalidation close-out: 83695.53
• Target take-profit: 82308.62
Target upside +0.72%|Risk space -0.95%
For real trading records only; not investment advice.
Execution time: 2026-09-30 16:19:11 (UTC+8)
The invalidation price and target price use the current position plan, not the initial opening conditions.
$BTC live short trade
• Actual executed price: 83245
• Quantity executed this time: 0.109 BTC
• Remaining quantity after the trade: 0.109 BTC
• Planned entry range: 82890.2 - 82925.77
• Invalidation close-out: 83695.53
• Target take-profit: 82308.62
Target upside +0.72%|Risk space -0.95%
For real trading records only; not investment advice.
Execution time: 2026-09-30 16:19:11 (UTC+8)
The invalidation price and target price use the current position plan, not the initial opening conditions.
124
·
--
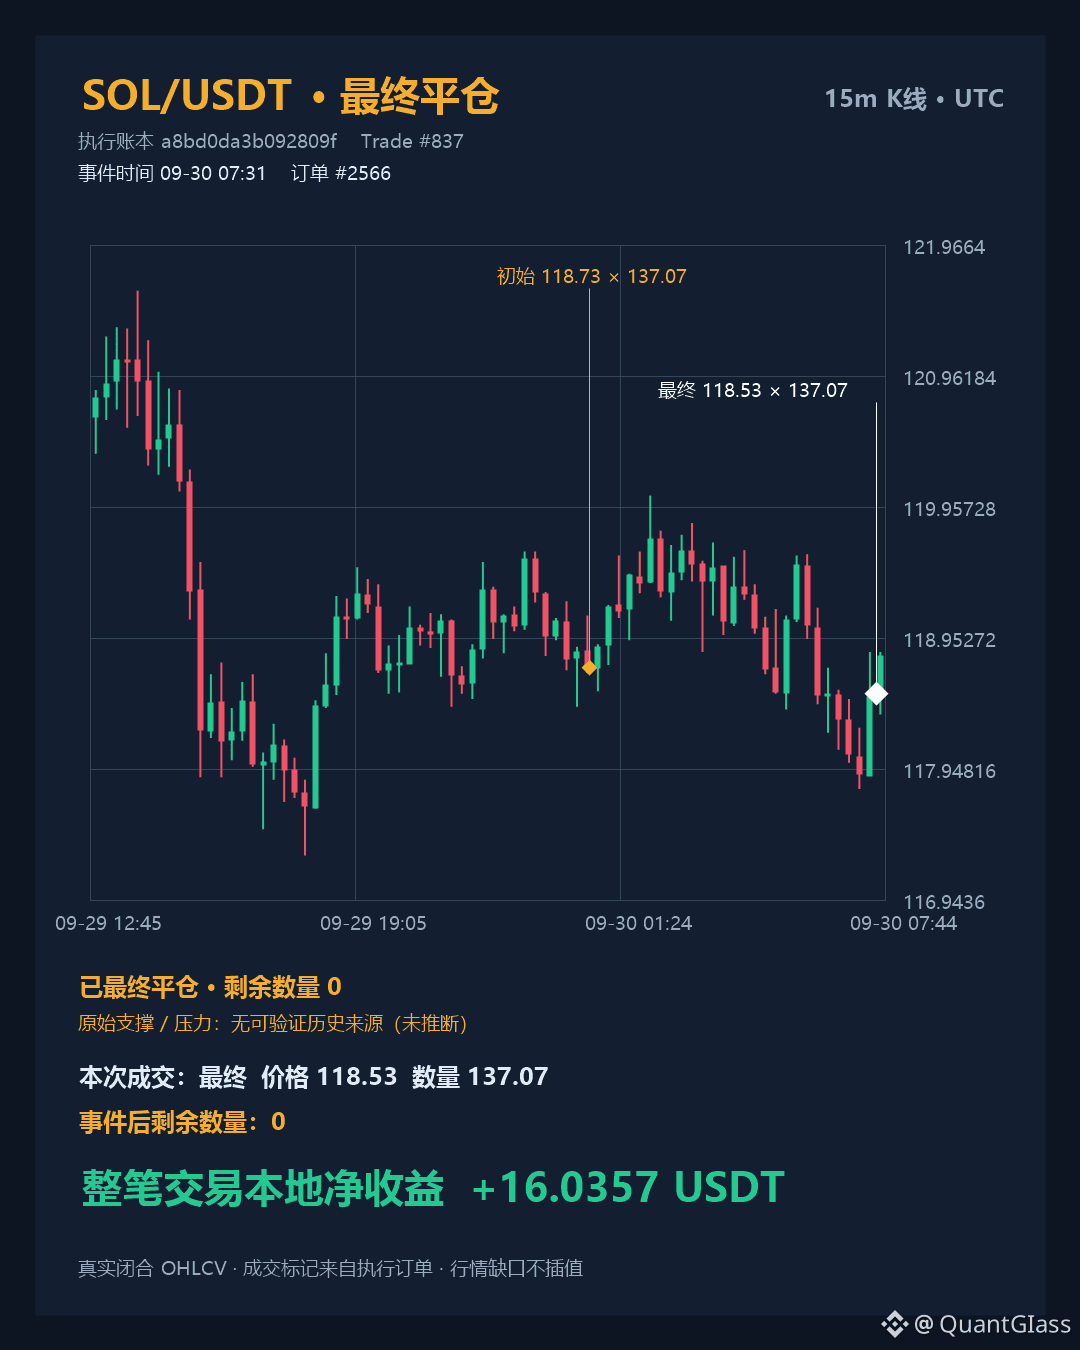
If the 5m close is above 119.19 and the volume ratio increases from 0.41, it only then indicates that the rebound has continuity; if the 5m close falls below 117.80, then the recent 20-candle range low is invalid, and you may refer to the 1h range low at 117.29. These two points are the extreme values of the closed candlestick range; they are not confirmed support/resistance levels.
$SOL This short-sell spot trade has already been closed.
Entry: 118.73 → Final exit: 118.53
Final filled quantity: 137.07 SOL|Remaining position: 0
Closing time: 2026-09-30 15:31:23 (UTC+8)
Net profit/loss after fees for the whole order: +16.0357 U
Execution summary: Added 0 times · Partially reduced 0 times · Finally closed 1 time
Close confirmation: The execution ledger has confirmed the final fills and ended this order.
This is a real trade execution review and does not indicate the result of the next trade.
If the 5m close is above 119.19 and the volume ratio increases from 0.41, it only then indicates that the rebound has continuity; if the 5m close falls below 117.80, then the recent 20-candle range low is invalid, and you may refer to the 1h range low at 117.29. These two points are the extreme values of the closed candlestick range; they are not confirmed support/resistance levels.
$SOL This short-sell spot trade has already been closed.
Entry: 118.73 → Final exit: 118.53
Final filled quantity: 137.07 SOL|Remaining position: 0
Closing time: 2026-09-30 15:31:23 (UTC+8)
Net profit/loss after fees for the whole order: +16.0357 U
Execution summary: Added 0 times · Partially reduced 0 times · Finally closed 1 time
Close confirmation: The execution ledger has confirmed the final fills and ended this order.
This is a real trade execution review and does not indicate the result of the next trade.
$SOL This short-sell spot trade has already been closed.
Entry: 118.73 → Final exit: 118.53
Final filled quantity: 137.07 SOL|Remaining position: 0
Closing time: 2026-09-30 15:31:23 (UTC+8)
Net profit/loss after fees for the whole order: +16.0357 U
Execution summary: Added 0 times · Partially reduced 0 times · Finally closed 1 time
Close confirmation: The execution ledger has confirmed the final fills and ended this order.
This is a real trade execution review and does not indicate the result of the next trade.
63
·
--
See translation
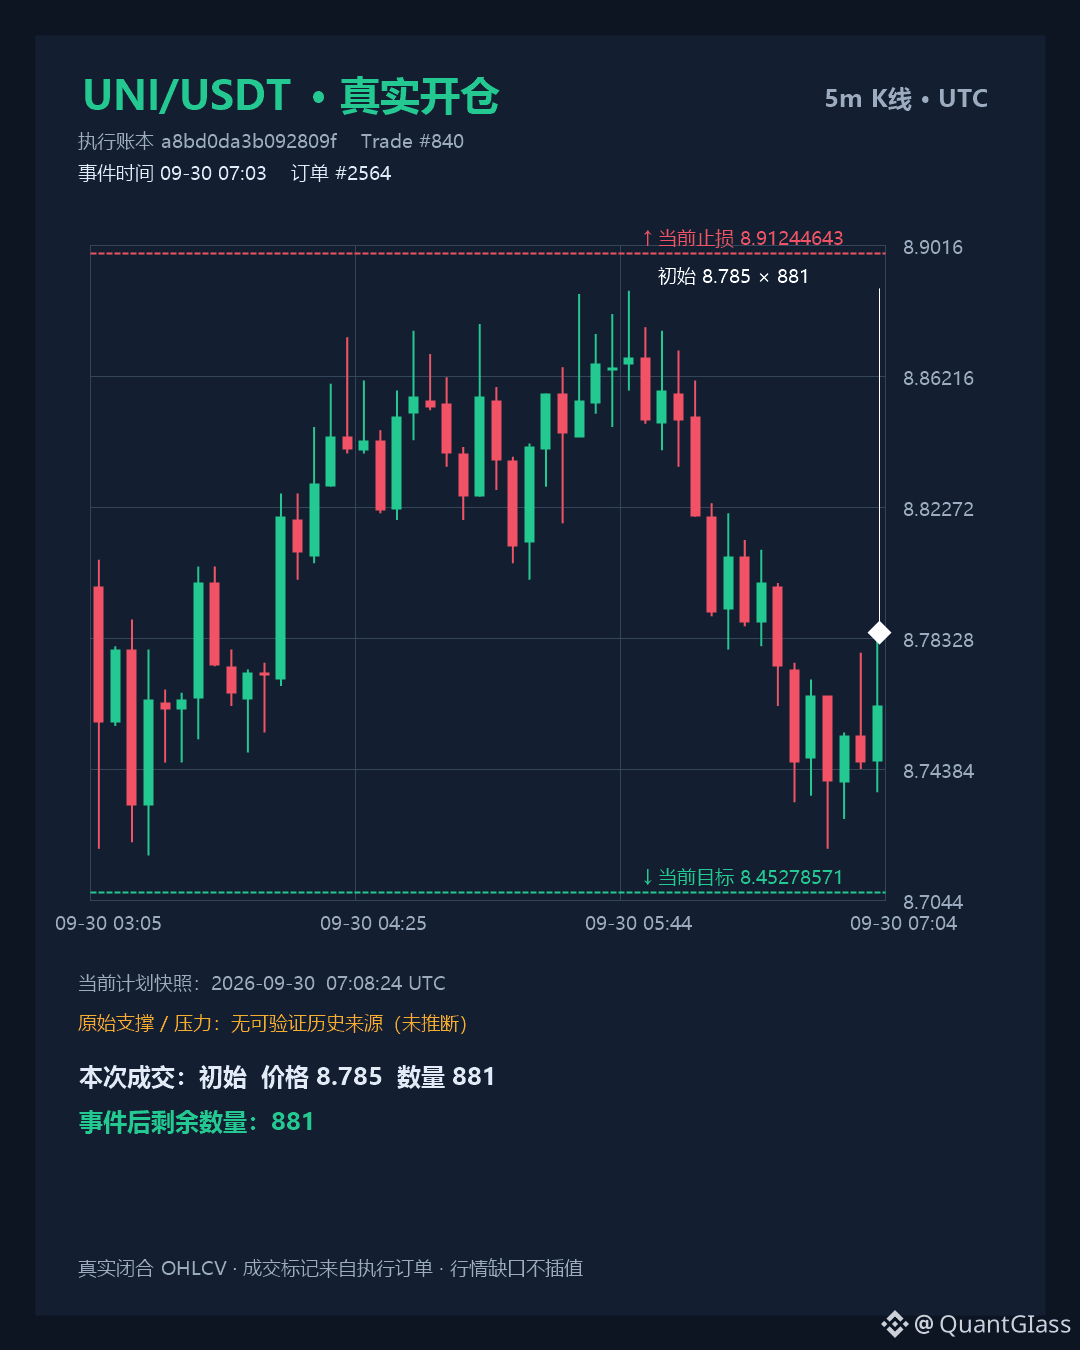
UNI 空单在 8.785 成交,落在1小时近20根K线区间(8.718–9.254)的下半部,但仍高于5分钟与15分钟的收盘价 8.763、8.746。三个周期的区间涨跌幅均为负:5分钟 -1.06%、15分钟 -1.22%、1小时 -3.27%。值得注意的是量能分布并不一致:15分钟量比 2.18 明显放大,而5分钟 0.86、1小时 0.87 都在均量之下,说明这一轮下探的成交放大集中在15分钟级别,5分钟和1小时尚未同步跟上。
接下来的验证条件在近端区间极值 8.718–8.720 一带:若价格触及该区域时再度出现量比放大并收在其下方,才说明下行动能延续;反之若缩量回到该区域上方并重新站上 8.76–8.77,则本次入场的位置优势会被削弱。计划记录的失效价在 8.9124,一旦价格未先向下验证反而向该价位靠近,这笔空单的结构就已与开仓时的量价条件不一致。以上仅为条件描述,不代表方向判断。
$UNI 实盘做空
• 实际成交价:8.785
• 本次成交数量:881 UNI
• 成交后剩余数量:881 UNI
• 计划入场区间:8.7407 - 8.7583
• 失效平仓:8.9124
• 目标止盈:8.4528
目标空间 +3.39%|风险空间 -1.86%
仅作真实交易记录,不构成投资建议。
成交时间:2026-09-30 15:03:08(UTC+8)
失效价与目标价采用当前持仓计划,非初始开仓条件。
UNI 空单在 8.785 成交,落在1小时近20根K线区间(8.718–9.254)的下半部,但仍高于5分钟与15分钟的收盘价 8.763、8.746。三个周期的区间涨跌幅均为负:5分钟 -1.06%、15分钟 -1.22%、1小时 -3.27%。值得注意的是量能分布并不一致:15分钟量比 2.18 明显放大,而5分钟 0.86、1小时 0.87 都在均量之下,说明这一轮下探的成交放大集中在15分钟级别,5分钟和1小时尚未同步跟上。
接下来的验证条件在近端区间极值 8.718–8.720 一带:若价格触及该区域时再度出现量比放大并收在其下方,才说明下行动能延续;反之若缩量回到该区域上方并重新站上 8.76–8.77,则本次入场的位置优势会被削弱。计划记录的失效价在 8.9124,一旦价格未先向下验证反而向该价位靠近,这笔空单的结构就已与开仓时的量价条件不一致。以上仅为条件描述,不代表方向判断。
$UNI 实盘做空
• 实际成交价:8.785
• 本次成交数量:881 UNI
• 成交后剩余数量:881 UNI
• 计划入场区间:8.7407 - 8.7583
• 失效平仓:8.9124
• 目标止盈:8.4528
目标空间 +3.39%|风险空间 -1.86%
仅作真实交易记录,不构成投资建议。
成交时间:2026-09-30 15:03:08(UTC+8)
失效价与目标价采用当前持仓计划,非初始开仓条件。
接下来的验证条件在近端区间极值 8.718–8.720 一带:若价格触及该区域时再度出现量比放大并收在其下方,才说明下行动能延续;反之若缩量回到该区域上方并重新站上 8.76–8.77,则本次入场的位置优势会被削弱。计划记录的失效价在 8.9124,一旦价格未先向下验证反而向该价位靠近,这笔空单的结构就已与开仓时的量价条件不一致。以上仅为条件描述,不代表方向判断。
$UNI 实盘做空
• 实际成交价:8.785
• 本次成交数量:881 UNI
• 成交后剩余数量:881 UNI
• 计划入场区间:8.7407 - 8.7583
• 失效平仓:8.9124
• 目标止盈:8.4528
目标空间 +3.39%|风险空间 -1.86%
仅作真实交易记录,不构成投资建议。
成交时间:2026-09-30 15:03:08(UTC+8)
失效价与目标价采用当前持仓计划,非初始开仓条件。
21
·
--
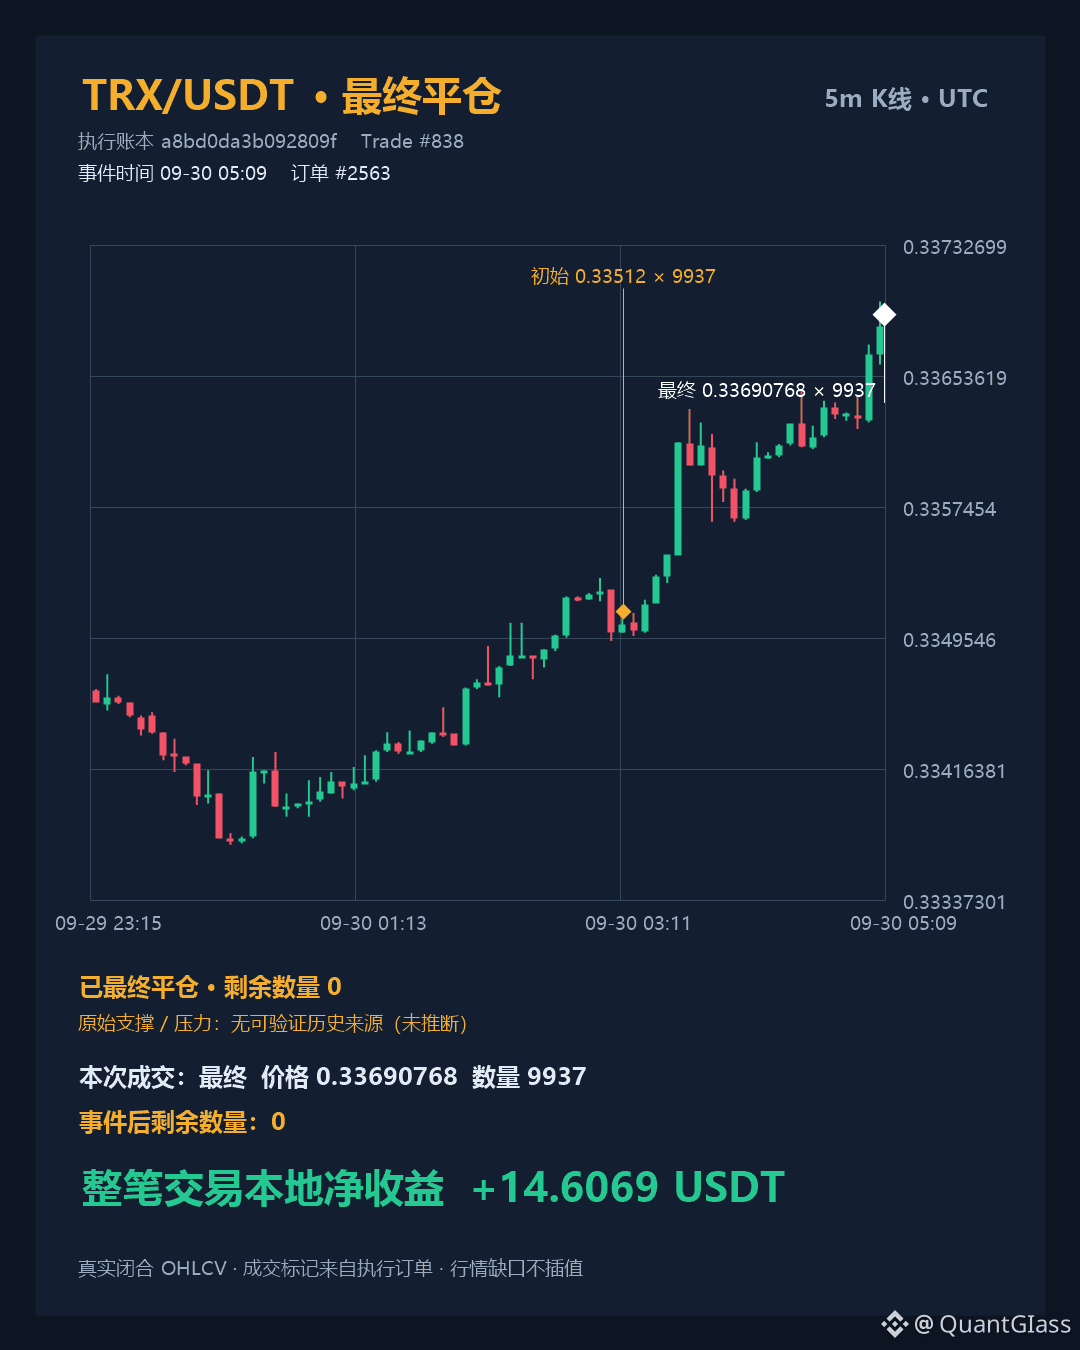
This TRX/USDT long position was fully closed at 0.33691. The entry price was 0.33512, and the net profit was 14.61. The closing price is lower than the 5m range high point (0.33699), but higher than the 15m and 1h range highs (0.33645). Meanwhile, the 5m volume ratio was 0.47 and the 15m volume ratio was 0.08; when the price was near the upper band,成交反而收缩 (trading volume/confluence contracted instead). This is the volume-price contradiction that needs the most dissection after closing: the price on the short cycle moved up, but there was not enough volume to confirm.
$TRX The live long trade has already been closed.
Initial entry 0.33512 → final close 0.336908
Final filled quantity 9937 TRX|remaining position 0
Closing time: 2026-09-30 13:09:40 (UTC+8)
Net profit/loss after fees for the whole order: +14.6069 U
Execution: added to position 0 time(s) · partially reduced 0 time(s) · finally closed 1 time
Close confirmation: the execution ledger has confirmed the final fill and ended this order.
This is a real trade replay; it does not indicate the result of the next trade.
This TRX/USDT long position was fully closed at 0.33691. The entry price was 0.33512, and the net profit was 14.61. The closing price is lower than the 5m range high point (0.33699), but higher than the 15m and 1h range highs (0.33645). Meanwhile, the 5m volume ratio was 0.47 and the 15m volume ratio was 0.08; when the price was near the upper band,成交反而收缩 (trading volume/confluence contracted instead). This is the volume-price contradiction that needs the most dissection after closing: the price on the short cycle moved up, but there was not enough volume to confirm.
$TRX The live long trade has already been closed.
Initial entry 0.33512 → final close 0.336908
Final filled quantity 9937 TRX|remaining position 0
Closing time: 2026-09-30 13:09:40 (UTC+8)
Net profit/loss after fees for the whole order: +14.6069 U
Execution: added to position 0 time(s) · partially reduced 0 time(s) · finally closed 1 time
Close confirmation: the execution ledger has confirmed the final fill and ended this order.
This is a real trade replay; it does not indicate the result of the next trade.
$TRX The live long trade has already been closed.
Initial entry 0.33512 → final close 0.336908
Final filled quantity 9937 TRX|remaining position 0
Closing time: 2026-09-30 13:09:40 (UTC+8)
Net profit/loss after fees for the whole order: +14.6069 U
Execution: added to position 0 time(s) · partially reduced 0 time(s) · finally closed 1 time
Close confirmation: the execution ledger has confirmed the final fill and ended this order.
This is a real trade replay; it does not indicate the result of the next trade.
110
·
--
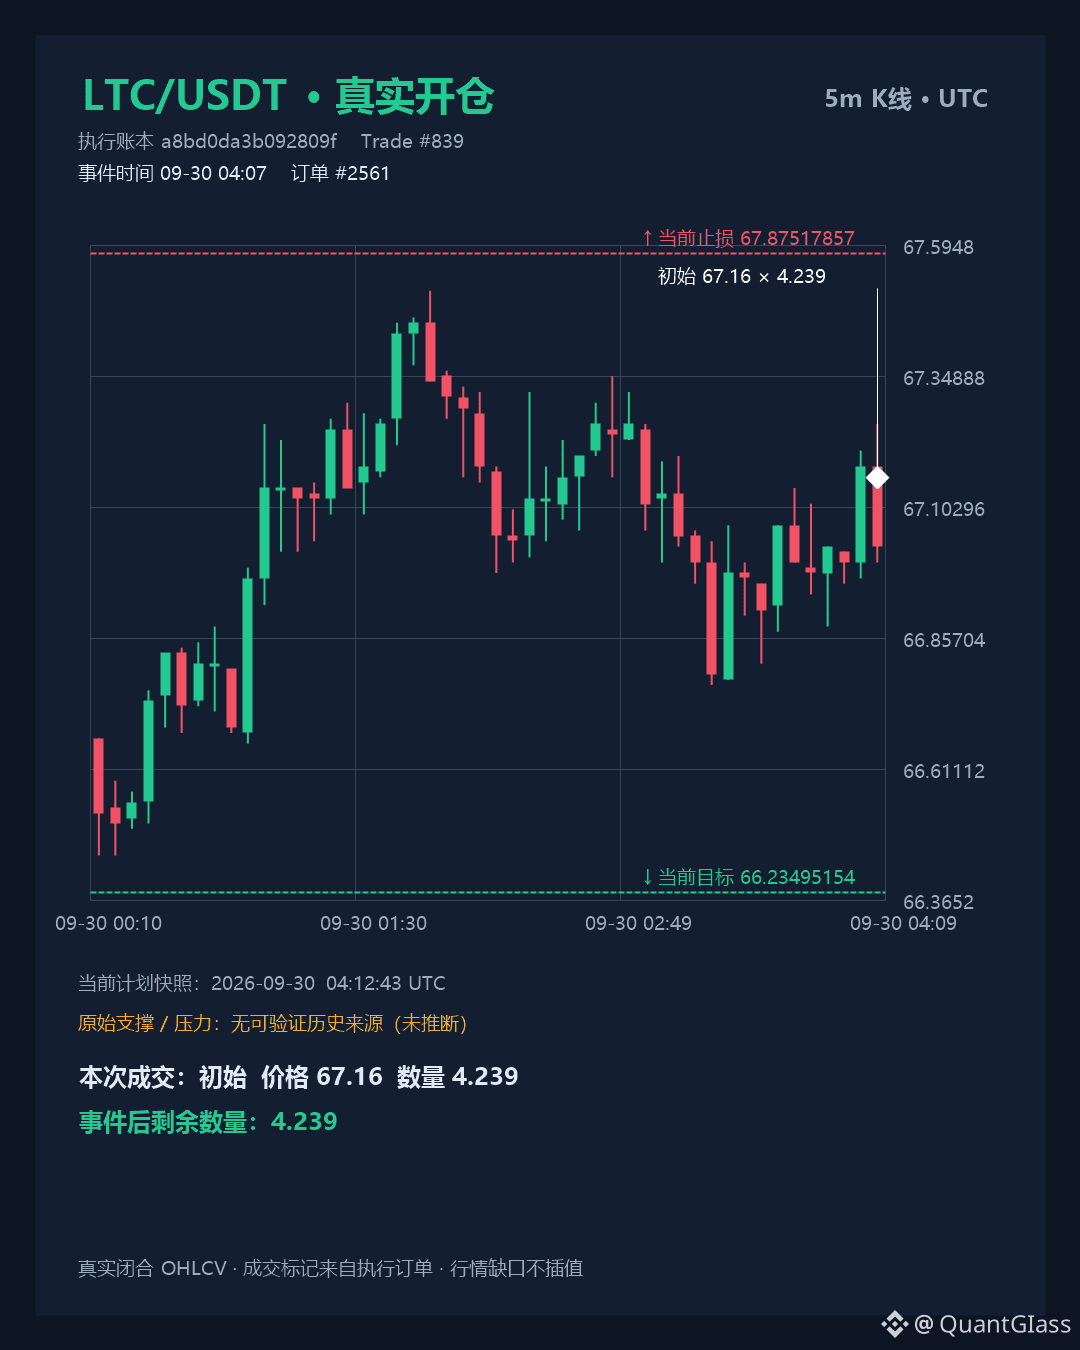
What needs to be verified next is: the 5m range high at 67.35. If it is reclaimed on a close, the issue of entry price being higher than the planned band will surface first. The planned 67.88 is the stop-loss reference, not a level of market pressure. Conversely, to confirm that the action is warranted, you need to see the 66.45 1h/15m swing low being broken down, with the volume ratio rising in sync. As long as the volume ratio remains below 1, treating the consolidation before the breakdown of 66.45 as a trend continuation lacks support.
$LTC live short trade
• Executed price: 67.16
• Quantity filled this time: 4.239 LTC
• Remaining quantity after the fill: 4.239 LTC
• Planned entry range: 66.9348 - 66.996
• Invalidation/exit stop: 67.8752
• Target take-profit: 66.235
Upside potential +1.09%|Risk potential -1.36%
For real trading record only; not investment advice.
Execution time: 2026-09-30 12:07:27 (UTC+8)
Invalidation price and target price use the current position plan, not the initial opening conditions.
What needs to be verified next is: the 5m range high at 67.35. If it is reclaimed on a close, the issue of entry price being higher than the planned band will surface first. The planned 67.88 is the stop-loss reference, not a level of market pressure. Conversely, to confirm that the action is warranted, you need to see the 66.45 1h/15m swing low being broken down, with the volume ratio rising in sync. As long as the volume ratio remains below 1, treating the consolidation before the breakdown of 66.45 as a trend continuation lacks support.
$LTC live short trade
• Executed price: 67.16
• Quantity filled this time: 4.239 LTC
• Remaining quantity after the fill: 4.239 LTC
• Planned entry range: 66.9348 - 66.996
• Invalidation/exit stop: 67.8752
• Target take-profit: 66.235
Upside potential +1.09%|Risk potential -1.36%
For real trading record only; not investment advice.
Execution time: 2026-09-30 12:07:27 (UTC+8)
Invalidation price and target price use the current position plan, not the initial opening conditions.
$LTC live short trade
• Executed price: 67.16
• Quantity filled this time: 4.239 LTC
• Remaining quantity after the fill: 4.239 LTC
• Planned entry range: 66.9348 - 66.996
• Invalidation/exit stop: 67.8752
• Target take-profit: 66.235
Upside potential +1.09%|Risk potential -1.36%
For real trading record only; not investment advice.
Execution time: 2026-09-30 12:07:27 (UTC+8)
Invalidation price and target price use the current position plan, not the initial opening conditions.
348
·
--
See translation
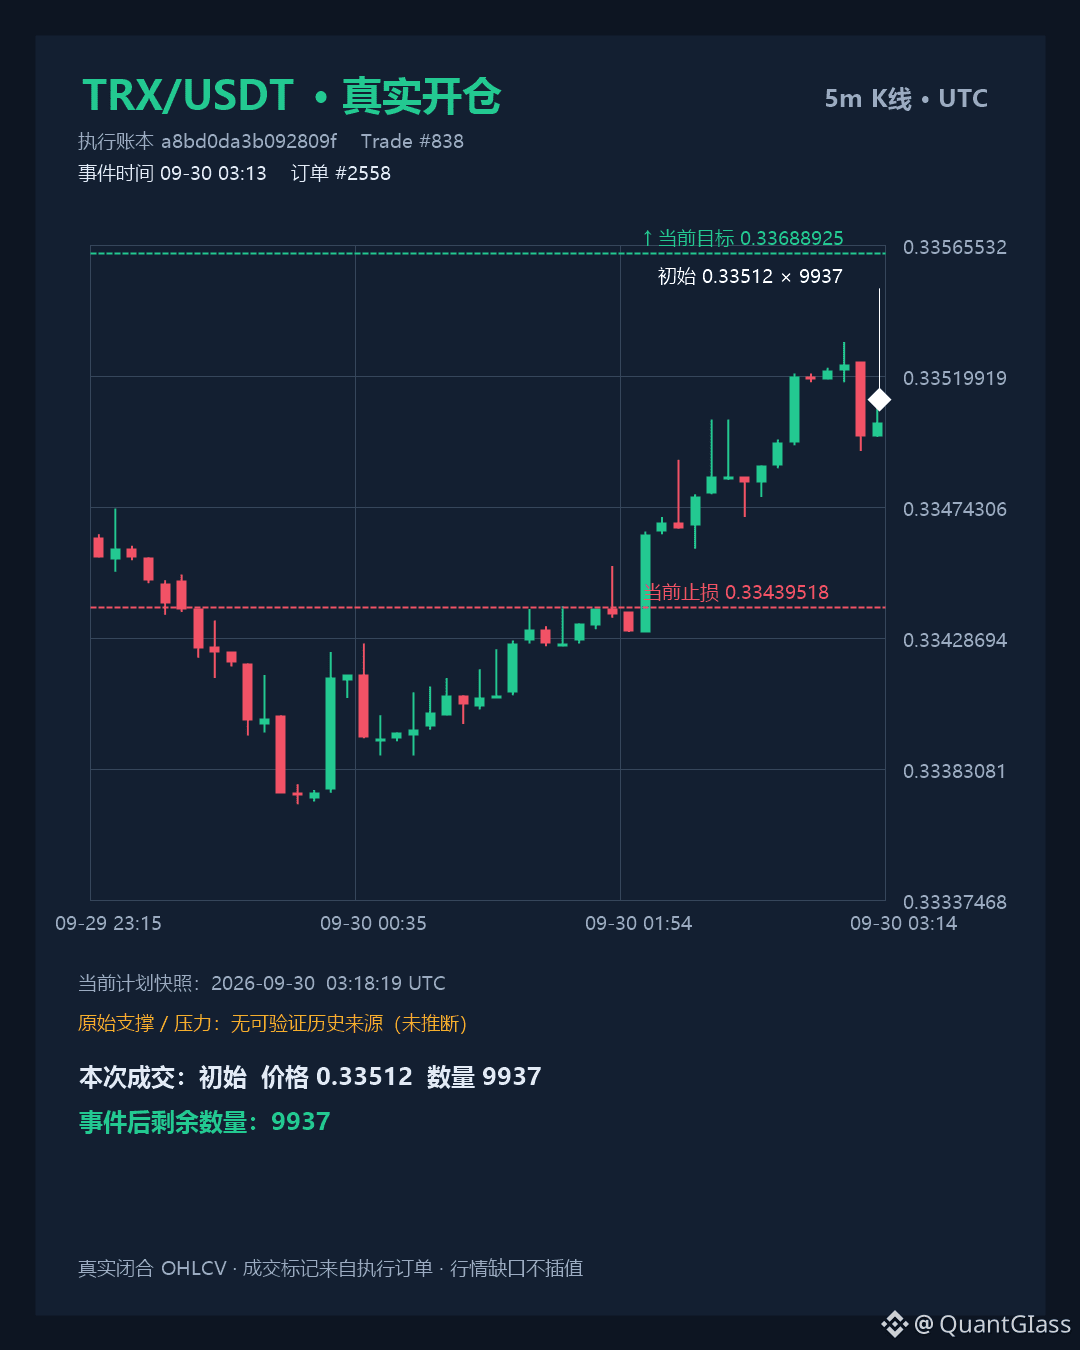
TRX开多成交0.33512,实际落在计划入场区间0.33518-0.33524下方。当前5m收0.33504,略低于开仓价;5m量比0.83,15m量比1.66但末根较前一根回落,短线出现量增价跌的分歧。1h同期收涨0.17%,20根区间高点0.33614,距离止盈0.33689仍有空间。
$TRX 实盘做多
• 实际成交价:0.33512
• 本次成交数量:9937 TRX
• 成交后剩余数量:9937 TRX
• 计划入场区间:0.335184 - 0.335245
• 失效平仓:0.334395
• 目标止盈:0.336889
目标空间 +0.50%|风险空间 -0.24%
仅作真实交易记录,不构成投资建议。
成交时间:2026-09-30 11:13:03(UTC+8)
失效价与目标价采用当前持仓计划,非初始开仓条件。
TRX开多成交0.33512,实际落在计划入场区间0.33518-0.33524下方。当前5m收0.33504,略低于开仓价;5m量比0.83,15m量比1.66但末根较前一根回落,短线出现量增价跌的分歧。1h同期收涨0.17%,20根区间高点0.33614,距离止盈0.33689仍有空间。
$TRX 实盘做多
• 实际成交价:0.33512
• 本次成交数量:9937 TRX
• 成交后剩余数量:9937 TRX
• 计划入场区间:0.335184 - 0.335245
• 失效平仓:0.334395
• 目标止盈:0.336889
目标空间 +0.50%|风险空间 -0.24%
仅作真实交易记录,不构成投资建议。
成交时间:2026-09-30 11:13:03(UTC+8)
失效价与目标价采用当前持仓计划,非初始开仓条件。
$TRX 实盘做多
• 实际成交价:0.33512
• 本次成交数量:9937 TRX
• 成交后剩余数量:9937 TRX
• 计划入场区间:0.335184 - 0.335245
• 失效平仓:0.334395
• 目标止盈:0.336889
目标空间 +0.50%|风险空间 -0.24%
仅作真实交易记录,不构成投资建议。
成交时间:2026-09-30 11:13:03(UTC+8)
失效价与目标价采用当前持仓计划,非初始开仓条件。
36
·
--
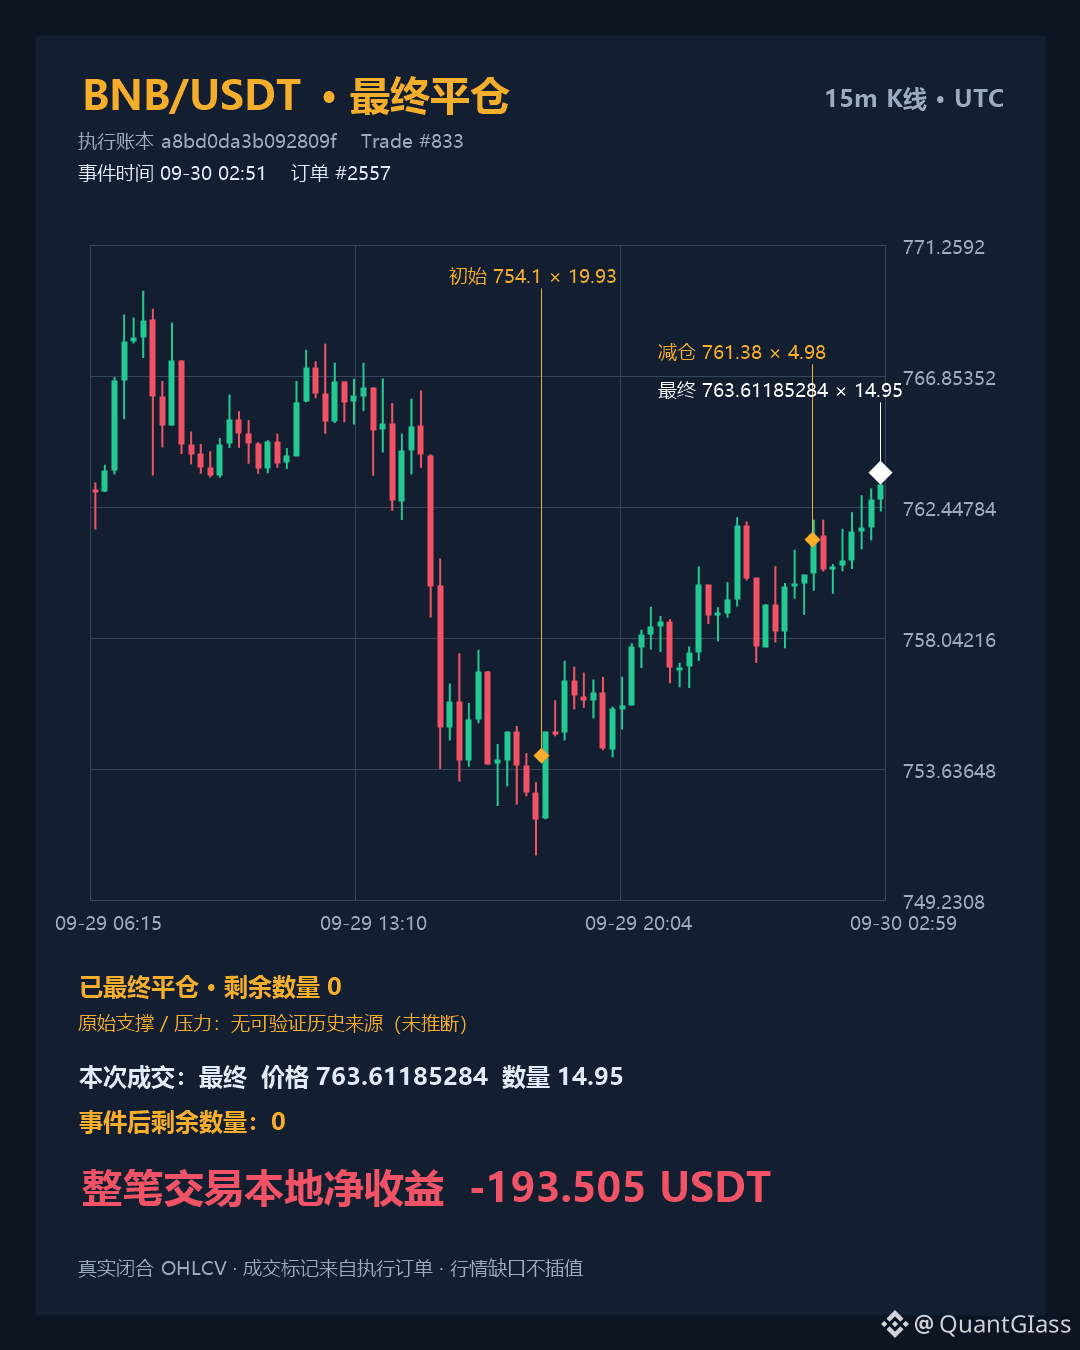
The short position was entered at 754.10 and ultimately closed at 763.61. The entire trade resulted in a net loss of 193.50, with the price moving opposite to the direction of the position. The closing price fell on the upper edge below 763.83 of the ranges defined by the last 20 candlesticks on the 5-minute and 15-minute timeframes. On the 5-minute chart, the volume ratio was 1.61; during the same period, the 1-hour volume ratio was only 0.59. Short-term volume increased and prices moved upward, but 1-hour trading activity remained relatively light.
Going forward, watch two conditions: whether the 5-minute close can hold above 763.83 with a relatively high volume ratio will determine if this upward extension receives price-volume confirmation. If price retreats back below the lower edge of the 5-minute range—below 759.55—then the upward push toward the upper edge of the range will not hold. The 20-candle 1-hour range is 750.75–769.74, with a rise/fall of -0.46%, and the direction on the higher timeframe is not clearly determined.
The short trade corresponding to $BNB has already been closed in the live market.
Initial entry 754.1 → Final close 763.6119
Final filled quantity 14.95 BNB | Remaining position 0
Close time: 2026-09-30 10:51:26 (UTC+8)
Net profit/loss after fees for the whole order: -193.5050 U
Execution process: Added to position 0 times · Reduced position 1 time · Final close 1 time
Close confirmation: The execution ledger has confirmed the final fills and ended this order.
This is a real trade recap and does not represent the outcome of the next trade.
The short position was entered at 754.10 and ultimately closed at 763.61. The entire trade resulted in a net loss of 193.50, with the price moving opposite to the direction of the position. The closing price fell on the upper edge below 763.83 of the ranges defined by the last 20 candlesticks on the 5-minute and 15-minute timeframes. On the 5-minute chart, the volume ratio was 1.61; during the same period, the 1-hour volume ratio was only 0.59. Short-term volume increased and prices moved upward, but 1-hour trading activity remained relatively light.
Going forward, watch two conditions: whether the 5-minute close can hold above 763.83 with a relatively high volume ratio will determine if this upward extension receives price-volume confirmation. If price retreats back below the lower edge of the 5-minute range—below 759.55—then the upward push toward the upper edge of the range will not hold. The 20-candle 1-hour range is 750.75–769.74, with a rise/fall of -0.46%, and the direction on the higher timeframe is not clearly determined.
The short trade corresponding to $BNB has already been closed in the live market.
Initial entry 754.1 → Final close 763.6119
Final filled quantity 14.95 BNB | Remaining position 0
Close time: 2026-09-30 10:51:26 (UTC+8)
Net profit/loss after fees for the whole order: -193.5050 U
Execution process: Added to position 0 times · Reduced position 1 time · Final close 1 time
Close confirmation: The execution ledger has confirmed the final fills and ended this order.
This is a real trade recap and does not represent the outcome of the next trade.
Going forward, watch two conditions: whether the 5-minute close can hold above 763.83 with a relatively high volume ratio will determine if this upward extension receives price-volume confirmation. If price retreats back below the lower edge of the 5-minute range—below 759.55—then the upward push toward the upper edge of the range will not hold. The 20-candle 1-hour range is 750.75–769.74, with a rise/fall of -0.46%, and the direction on the higher timeframe is not clearly determined.
The short trade corresponding to $BNB has already been closed in the live market.
Initial entry 754.1 → Final close 763.6119
Final filled quantity 14.95 BNB | Remaining position 0
Close time: 2026-09-30 10:51:26 (UTC+8)
Net profit/loss after fees for the whole order: -193.5050 U
Execution process: Added to position 0 times · Reduced position 1 time · Final close 1 time
Close confirmation: The execution ledger has confirmed the final fills and ended this order.
This is a real trade recap and does not represent the outcome of the next trade.
93
·
--
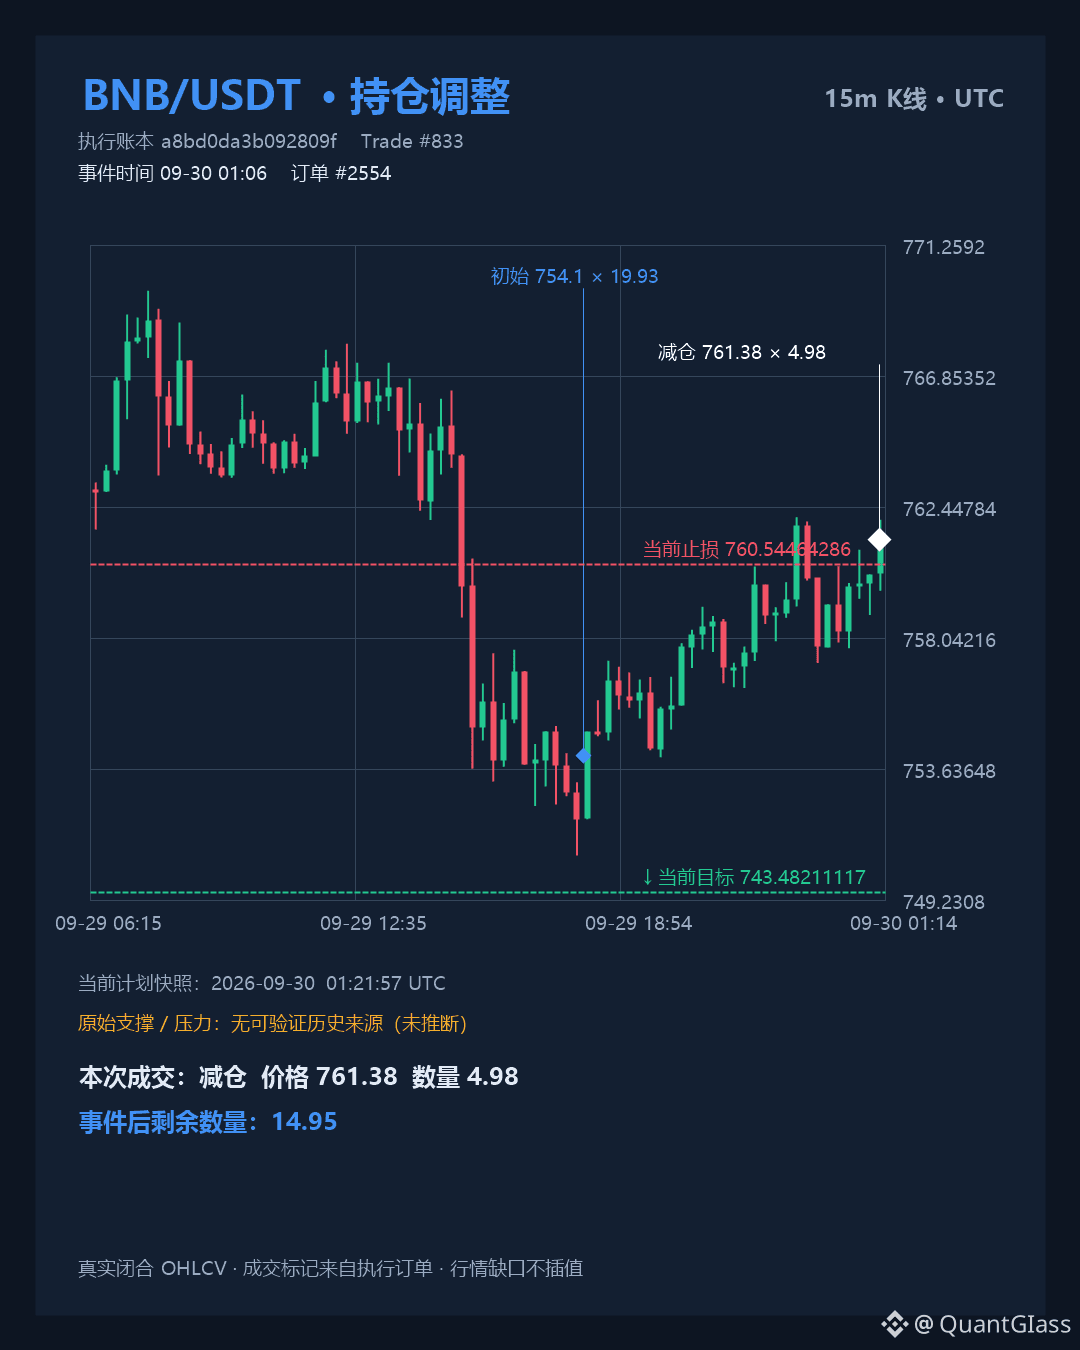
Energy is splitting: 15m volume ratio 1.45; on 5m the volume ratio is only 0.52. The short-term cycle is pushing upward, but the faster cycle is shrinking in volume. Next, we need to look at two conditions—if price closes with volume above 762.12, then this round of reducing positions looks more like exposure contraction rather than a structural reversal; if 5m volume remains persistently low and price still cannot break above 762.04, then this upward move still falls within the 757.22–762.04 range and is not enough to confirm damage to the short-side structure.
$BNB short|1st time reducing positions
• Execution price: 761.38
• Quantity executed this time: 4.98 BNB
• Remaining quantity after execution: 14.95 BNB
• Trigger reason: recorded the actual position-reducing execution; the original trigger reason was not recorded
• Invalidation price for remaining position: 760.5446
• Target price for remaining position: 743.4821
For real trading records only; not investment advice.
Execution time: 2026-09-30 09:06:26 (UTC+8)
Invalidation price and target price use the current position plan, not the initial opening conditions.
Energy is splitting: 15m volume ratio 1.45; on 5m the volume ratio is only 0.52. The short-term cycle is pushing upward, but the faster cycle is shrinking in volume. Next, we need to look at two conditions—if price closes with volume above 762.12, then this round of reducing positions looks more like exposure contraction rather than a structural reversal; if 5m volume remains persistently low and price still cannot break above 762.04, then this upward move still falls within the 757.22–762.04 range and is not enough to confirm damage to the short-side structure.
$BNB short|1st time reducing positions
• Execution price: 761.38
• Quantity executed this time: 4.98 BNB
• Remaining quantity after execution: 14.95 BNB
• Trigger reason: recorded the actual position-reducing execution; the original trigger reason was not recorded
• Invalidation price for remaining position: 760.5446
• Target price for remaining position: 743.4821
For real trading records only; not investment advice.
Execution time: 2026-09-30 09:06:26 (UTC+8)
Invalidation price and target price use the current position plan, not the initial opening conditions.
$BNB short|1st time reducing positions
• Execution price: 761.38
• Quantity executed this time: 4.98 BNB
• Remaining quantity after execution: 14.95 BNB
• Trigger reason: recorded the actual position-reducing execution; the original trigger reason was not recorded
• Invalidation price for remaining position: 760.5446
• Target price for remaining position: 743.4821
For real trading records only; not investment advice.
Execution time: 2026-09-30 09:06:26 (UTC+8)
Invalidation price and target price use the current position plan, not the initial opening conditions.
92
·
--
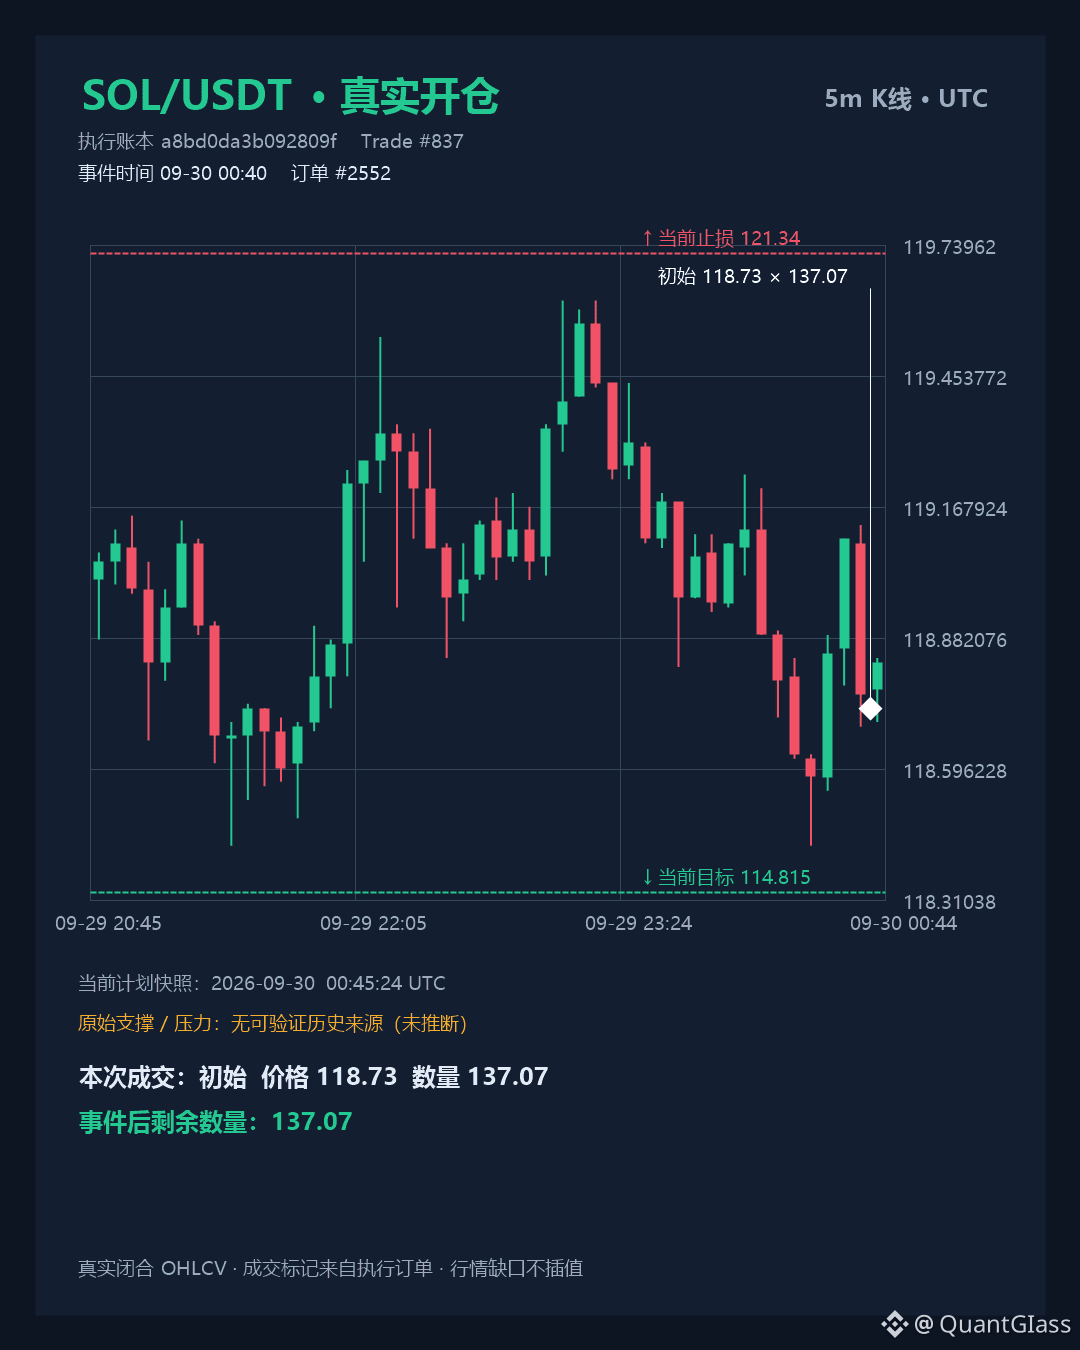
SOL 5-minute: nearly 20 candles closed at 118.83, range 118.43—119.62, 20-candle涨跌幅 -0.43%, volume ratio 0.22; 15-minute: same range closed at 118.95, 20-candle涨跌幅 0.20%, volume ratio 0.05. The opening price was 118.73, which is below these two closing prices. After opening the short position, price did not immediately break downward; in the short term it first remained in a narrow range to consolidate.
Recently, the 1-hour range is 117.02—121.62, 20-candle涨跌幅 1.09%, volume ratio 0.53. These are only the range extremes, not validated support/resistance. To confirm a downside move, we need to see the close break below the combined lows of the 5/15-minute at 118.43, along with the volume ratio recovering from 0.22 and 0.05. Conversely, if the close is above 119.62 and volume increases, then according to the plan, the stop-loss at 121.34 will serve as the invalidation price and will be re-evaluated. Take-profit at 114.815 is located below the 1-hour low at 117.02; we need to first see that low broken effectively before discussing upside room.
$SOL live short trade
• Actual execution price: 118.73
• Execution quantity this time: 137.07 SOL
• Remaining quantity after execution: 137.07 SOL
• Planned entry range: 118.7226 - 118.8019
• Invalidation exit/stop: 121.34
• Target take-profit: 114.815
Upside room +3.32%|Risk room -2.17%
For real trading records only; not investment advice.
Execution time: 2026-09-30 08:40:19 (UTC+8)
Invalidation price and target price use the current position plan; not the initial entry conditions.
SOL 5-minute: nearly 20 candles closed at 118.83, range 118.43—119.62, 20-candle涨跌幅 -0.43%, volume ratio 0.22; 15-minute: same range closed at 118.95, 20-candle涨跌幅 0.20%, volume ratio 0.05. The opening price was 118.73, which is below these two closing prices. After opening the short position, price did not immediately break downward; in the short term it first remained in a narrow range to consolidate.
Recently, the 1-hour range is 117.02—121.62, 20-candle涨跌幅 1.09%, volume ratio 0.53. These are only the range extremes, not validated support/resistance. To confirm a downside move, we need to see the close break below the combined lows of the 5/15-minute at 118.43, along with the volume ratio recovering from 0.22 and 0.05. Conversely, if the close is above 119.62 and volume increases, then according to the plan, the stop-loss at 121.34 will serve as the invalidation price and will be re-evaluated. Take-profit at 114.815 is located below the 1-hour low at 117.02; we need to first see that low broken effectively before discussing upside room.
$SOL live short trade
• Actual execution price: 118.73
• Execution quantity this time: 137.07 SOL
• Remaining quantity after execution: 137.07 SOL
• Planned entry range: 118.7226 - 118.8019
• Invalidation exit/stop: 121.34
• Target take-profit: 114.815
Upside room +3.32%|Risk room -2.17%
For real trading records only; not investment advice.
Execution time: 2026-09-30 08:40:19 (UTC+8)
Invalidation price and target price use the current position plan; not the initial entry conditions.
Recently, the 1-hour range is 117.02—121.62, 20-candle涨跌幅 1.09%, volume ratio 0.53. These are only the range extremes, not validated support/resistance. To confirm a downside move, we need to see the close break below the combined lows of the 5/15-minute at 118.43, along with the volume ratio recovering from 0.22 and 0.05. Conversely, if the close is above 119.62 and volume increases, then according to the plan, the stop-loss at 121.34 will serve as the invalidation price and will be re-evaluated. Take-profit at 114.815 is located below the 1-hour low at 117.02; we need to first see that low broken effectively before discussing upside room.
$SOL live short trade
• Actual execution price: 118.73
• Execution quantity this time: 137.07 SOL
• Remaining quantity after execution: 137.07 SOL
• Planned entry range: 118.7226 - 118.8019
• Invalidation exit/stop: 121.34
• Target take-profit: 114.815
Upside room +3.32%|Risk room -2.17%
For real trading records only; not investment advice.
Execution time: 2026-09-30 08:40:19 (UTC+8)
Invalidation price and target price use the current position plan; not the initial entry conditions.
176
·
--
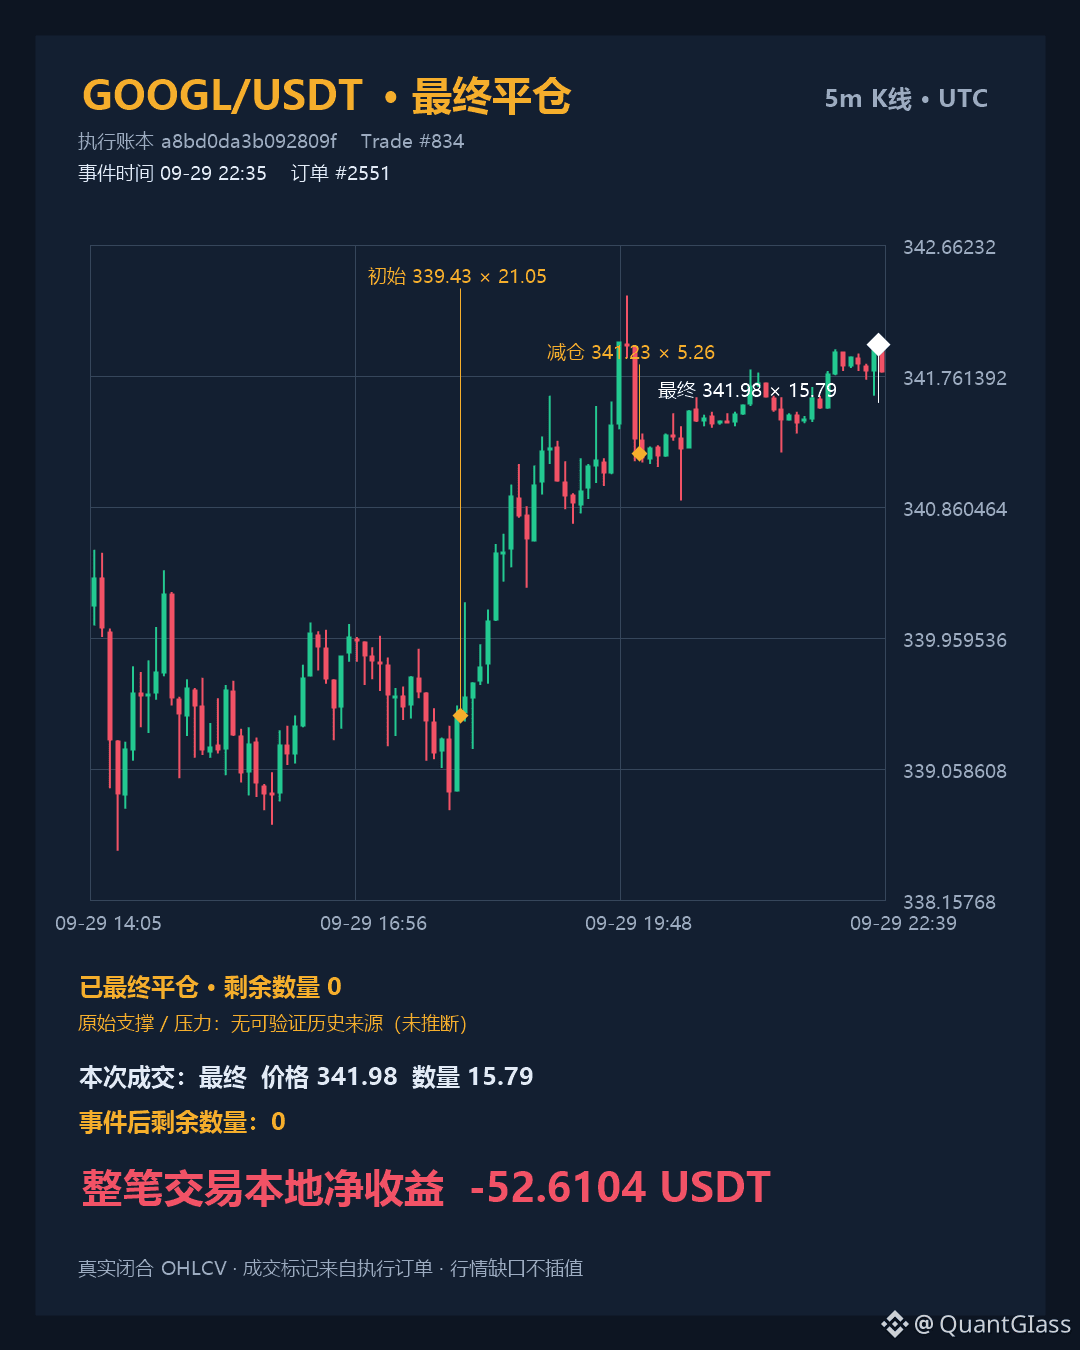
This empty order was closed at 341.98. The opening price was 339.43, with a loss of approximately 52.61 USDT. At the time of closing, the 5m candle closed at 341.79, approaching the 20 recent session highs at 342.00, with a volume ratio of 0.97. The 15m high was 342.32, with a rise of 0.68% and a volume ratio of 0.65. In the 1h timeframe, it was still down by 0.35%, with a volume ratio of 0.45. Short-term rebound and hour-level volume contraction coexist.
If the 15m close is above 342.32 and the volume ratio is higher than the current 0.65, it can be considered a validation condition for the short-term upside extension. If it pulls back and breaks below the 5m range low of 341.24, then the sustainability of this rebound under the 1h volume contraction backdrop must be re-evaluated. The 1h range high of 343.98 is the reference level above.
$GOOGL : This short position has already been closed.
First entry 339.43 → Final close 341.98
Final filled quantity 15.79 GOOGL | Remaining position 0
Closing time: 2026-09-30 06:35:27 (UTC+8)
Net profit/loss after all fees for the whole order: -52.6104 U
Execution process: Added to position 0 times · Partially reduced 1 time · Finally closed 1 time
Close confirmation: The execution blotter has confirmed the final fills and ended this order.
This is a real fill recap and does not indicate the result of the next trade.
This empty order was closed at 341.98. The opening price was 339.43, with a loss of approximately 52.61 USDT. At the time of closing, the 5m candle closed at 341.79, approaching the 20 recent session highs at 342.00, with a volume ratio of 0.97. The 15m high was 342.32, with a rise of 0.68% and a volume ratio of 0.65. In the 1h timeframe, it was still down by 0.35%, with a volume ratio of 0.45. Short-term rebound and hour-level volume contraction coexist.
If the 15m close is above 342.32 and the volume ratio is higher than the current 0.65, it can be considered a validation condition for the short-term upside extension. If it pulls back and breaks below the 5m range low of 341.24, then the sustainability of this rebound under the 1h volume contraction backdrop must be re-evaluated. The 1h range high of 343.98 is the reference level above.
$GOOGL : This short position has already been closed.
First entry 339.43 → Final close 341.98
Final filled quantity 15.79 GOOGL | Remaining position 0
Closing time: 2026-09-30 06:35:27 (UTC+8)
Net profit/loss after all fees for the whole order: -52.6104 U
Execution process: Added to position 0 times · Partially reduced 1 time · Finally closed 1 time
Close confirmation: The execution blotter has confirmed the final fills and ended this order.
This is a real fill recap and does not indicate the result of the next trade.
If the 15m close is above 342.32 and the volume ratio is higher than the current 0.65, it can be considered a validation condition for the short-term upside extension. If it pulls back and breaks below the 5m range low of 341.24, then the sustainability of this rebound under the 1h volume contraction backdrop must be re-evaluated. The 1h range high of 343.98 is the reference level above.
$GOOGL : This short position has already been closed.
First entry 339.43 → Final close 341.98
Final filled quantity 15.79 GOOGL | Remaining position 0
Closing time: 2026-09-30 06:35:27 (UTC+8)
Net profit/loss after all fees for the whole order: -52.6104 U
Execution process: Added to position 0 times · Partially reduced 1 time · Finally closed 1 time
Close confirmation: The execution blotter has confirmed the final fills and ended this order.
This is a real fill recap and does not indicate the result of the next trade.
54
·
--
Hedera upgrade completed—why is the status page still showing a yellow light?
At 17:35 UTC on September 29, the official team confirmed that the mainnet upgrade to v0.77.2 has been completed. During this check, the overall network and the mainnet mirror interfaces look normal, but one independent node is still marked as having a partial issue.
These two status descriptions are not referring to the same layer: an abnormality at a single node can’t be directly equated with a full network shutdown, and completing the upgrade doesn’t mean every component has zero problems. I will first determine whether the affected parts are the network, the node, or the query interface, then cross-check the event update time—rather than only taking the top warning on the page.
For users who关注 $HBAR, when reading the upgrade messages, look one layer deeper into the component status to tell the difference between “overall usable” and “still awaiting fixes locally.” #Hedera network status
Hedera upgrade completed—why is the status page still showing a yellow light?
At 17:35 UTC on September 29, the official team confirmed that the mainnet upgrade to v0.77.2 has been completed. During this check, the overall network and the mainnet mirror interfaces look normal, but one independent node is still marked as having a partial issue.
These two status descriptions are not referring to the same layer: an abnormality at a single node can’t be directly equated with a full network shutdown, and completing the upgrade doesn’t mean every component has zero problems. I will first determine whether the affected parts are the network, the node, or the query interface, then cross-check the event update time—rather than only taking the top warning on the page.
For users who关注 $HBAR , when reading the upgrade messages, look one layer deeper into the component status to tell the difference between “overall usable” and “still awaiting fixes locally.” #Hedera network status
At 17:35 UTC on September 29, the official team confirmed that the mainnet upgrade to v0.77.2 has been completed. During this check, the overall network and the mainnet mirror interfaces look normal, but one independent node is still marked as having a partial issue.
These two status descriptions are not referring to the same layer: an abnormality at a single node can’t be directly equated with a full network shutdown, and completing the upgrade doesn’t mean every component has zero problems. I will first determine whether the affected parts are the network, the node, or the query interface, then cross-check the event update time—rather than only taking the top warning on the page.
For users who关注 $HBAR , when reading the upgrade messages, look one layer deeper into the component status to tell the difference between “overall usable” and “still awaiting fixes locally.” #Hedera network status

290
·
--
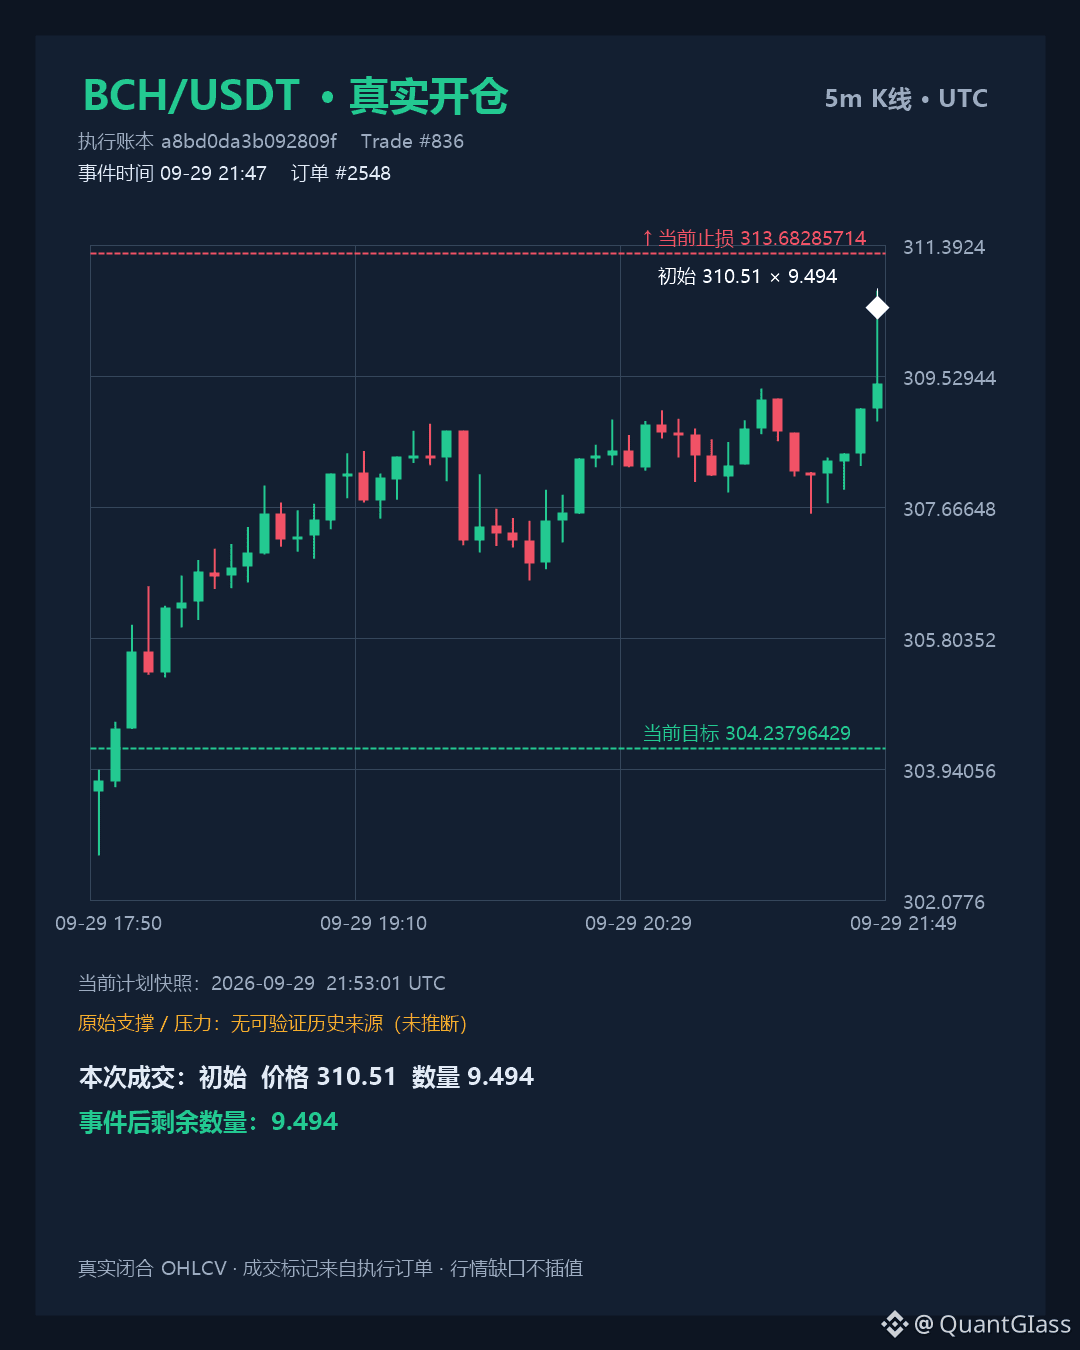
This BCH short position was filled at 310.51, exactly within the range 307.17–310.75 covered by the last 20 5-minute candles. The 5m volume ratio is 14.04, but over those 20 candles the cumulative move was only +0.63%, indicating heavy volume without a directional breakout. In the same period, the 15m volume ratio is 0.48 and the 1h volume ratio is 0.35—volume was concentrated in the fastest timeframe, while longer timeframes did not follow through.
Next, we need to see whether 5m can close with volume below 307.17. Only if the lower boundary of the range is broken to the downside can we say the market has truly shown a direction. If the price climbs back above 310.75, then the current entry rationale no longer holds. The invalidation (failed) price of 313.68 is below the 1h range high of 313.87. When price returns to that area, it means the conditions are overturned—this level is merely where the plan is invalidated, not market support.
$BCH live short
• Actual fill price: 310.51
• Fill quantity this time: 9.494 BCH
• Remaining quantity after the trade: 9.494 BCH
• Planned entry range: 308.986 - 309.2992
• Invalidation/exit price: 313.6829
• Target take-profit: 304.238
Potential upside: +1.59%|Risk downside: -1.47%
For real trading record only; not investment advice.
Fill time: 2026-09-30 05:47:38 (UTC+8)
The invalidation price and target price use the current position plan, not the initial entry conditions.
This BCH short position was filled at 310.51, exactly within the range 307.17–310.75 covered by the last 20 5-minute candles. The 5m volume ratio is 14.04, but over those 20 candles the cumulative move was only +0.63%, indicating heavy volume without a directional breakout. In the same period, the 15m volume ratio is 0.48 and the 1h volume ratio is 0.35—volume was concentrated in the fastest timeframe, while longer timeframes did not follow through.
Next, we need to see whether 5m can close with volume below 307.17. Only if the lower boundary of the range is broken to the downside can we say the market has truly shown a direction. If the price climbs back above 310.75, then the current entry rationale no longer holds. The invalidation (failed) price of 313.68 is below the 1h range high of 313.87. When price returns to that area, it means the conditions are overturned—this level is merely where the plan is invalidated, not market support.
$BCH live short
• Actual fill price: 310.51
• Fill quantity this time: 9.494 BCH
• Remaining quantity after the trade: 9.494 BCH
• Planned entry range: 308.986 - 309.2992
• Invalidation/exit price: 313.6829
• Target take-profit: 304.238
Potential upside: +1.59%|Risk downside: -1.47%
For real trading record only; not investment advice.
Fill time: 2026-09-30 05:47:38 (UTC+8)
The invalidation price and target price use the current position plan, not the initial entry conditions.
Next, we need to see whether 5m can close with volume below 307.17. Only if the lower boundary of the range is broken to the downside can we say the market has truly shown a direction. If the price climbs back above 310.75, then the current entry rationale no longer holds. The invalidation (failed) price of 313.68 is below the 1h range high of 313.87. When price returns to that area, it means the conditions are overturned—this level is merely where the plan is invalidated, not market support.
$BCH live short
• Actual fill price: 310.51
• Fill quantity this time: 9.494 BCH
• Remaining quantity after the trade: 9.494 BCH
• Planned entry range: 308.986 - 309.2992
• Invalidation/exit price: 313.6829
• Target take-profit: 304.238
Potential upside: +1.59%|Risk downside: -1.47%
For real trading record only; not investment advice.
Fill time: 2026-09-30 05:47:38 (UTC+8)
The invalidation price and target price use the current position plan, not the initial entry conditions.
244
·
--
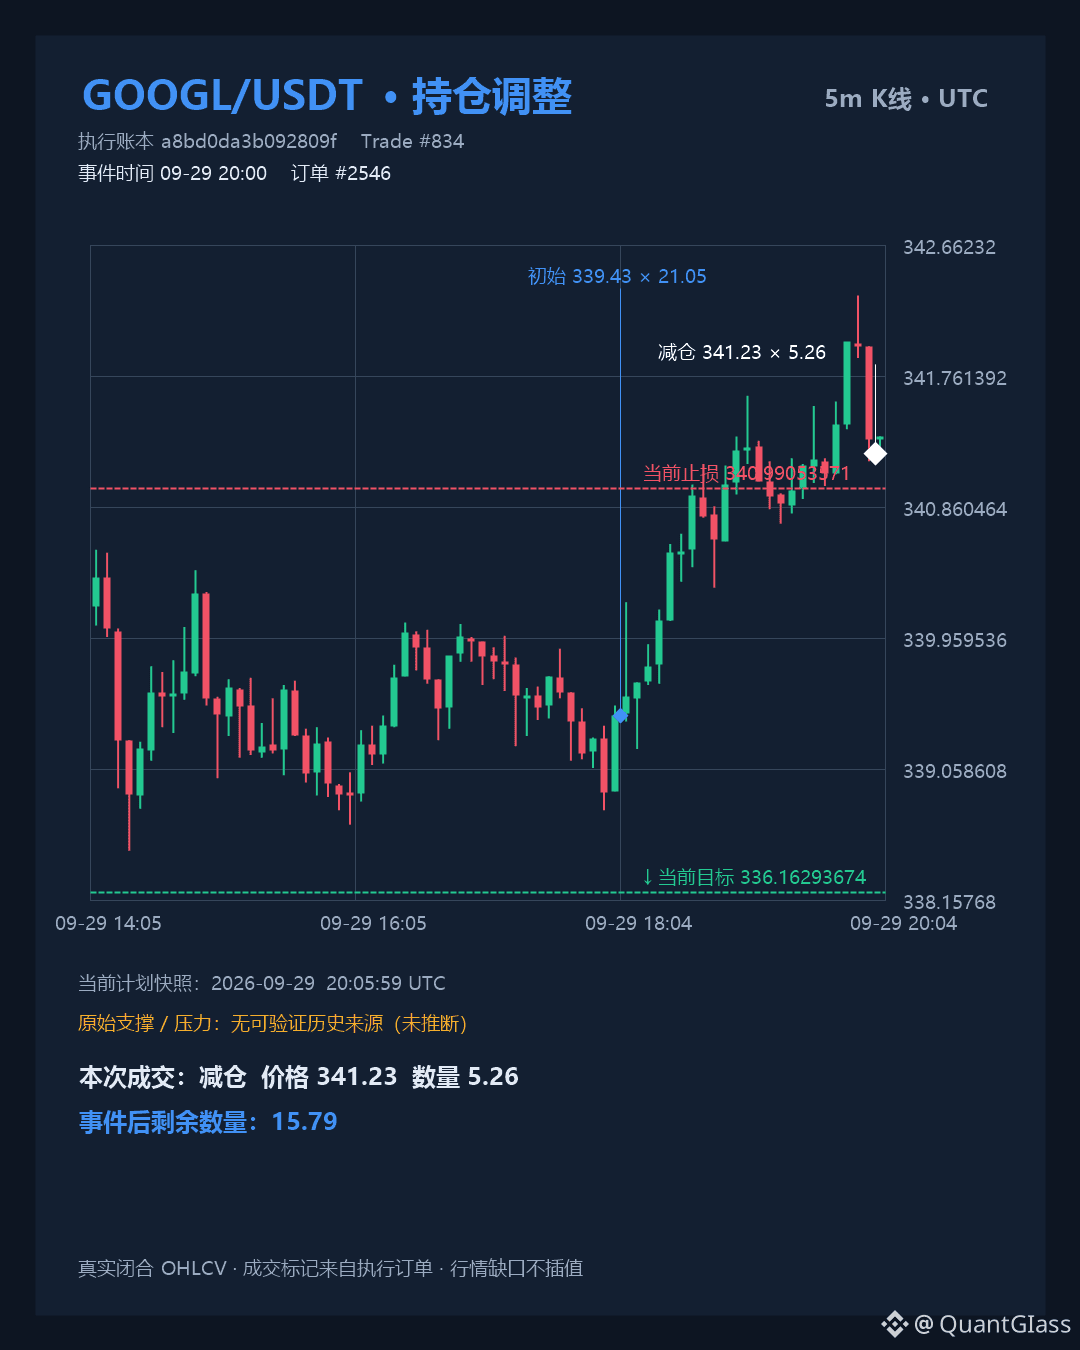
This reduced-position sell transaction was executed at 341.23, higher than the stop-loss reference of 340.99 recorded in the plan, while the short entry price was 339.43: the reduction occurred after the price had crossed the plan invalidation line, not as a planned take-profit action. The remaining 15.79 corresponds to the latest 5m close at 341.35, which is still above the entry price, so the floating loss status has not changed.
Over the last 20 5m candles, the range is 340.08–342.32 with a volume ratio of 0.26. Price is in the upper-middle area; a contraction in volume with an upward move by itself does not confirm direction. On the 15m timeframe, the volume ratio is 2.02 and the lower end of the range is 338.68, which is wider. For the short plan to be considered valid again, a close needs to return below 340.99 with volume higher than the current level. If the close is above 342.32, the remaining position will face further adverse price expansion.
$GOOGL short|1st position reduction
• Execution price: 341.23
• Quantity executed this time: 5.26 GOOGL
• Remaining quantity after this fill: 15.79 GOOGL
• Trigger reason: the actual reduced-position trade has been recorded; the original trigger reason was not recorded
• Invalidation price for remaining position: 340.9905
• Target price for remaining position: 336.1629
For real trading record only; not investment advice.
Execution time: 2026-09-30 04:00:29 (UTC+8)
The invalidation price and target price use the current position plan, not the initial entry conditions.
This reduced-position sell transaction was executed at 341.23, higher than the stop-loss reference of 340.99 recorded in the plan, while the short entry price was 339.43: the reduction occurred after the price had crossed the plan invalidation line, not as a planned take-profit action. The remaining 15.79 corresponds to the latest 5m close at 341.35, which is still above the entry price, so the floating loss status has not changed.
Over the last 20 5m candles, the range is 340.08–342.32 with a volume ratio of 0.26. Price is in the upper-middle area; a contraction in volume with an upward move by itself does not confirm direction. On the 15m timeframe, the volume ratio is 2.02 and the lower end of the range is 338.68, which is wider. For the short plan to be considered valid again, a close needs to return below 340.99 with volume higher than the current level. If the close is above 342.32, the remaining position will face further adverse price expansion.
$GOOGL short|1st position reduction
• Execution price: 341.23
• Quantity executed this time: 5.26 GOOGL
• Remaining quantity after this fill: 15.79 GOOGL
• Trigger reason: the actual reduced-position trade has been recorded; the original trigger reason was not recorded
• Invalidation price for remaining position: 340.9905
• Target price for remaining position: 336.1629
For real trading record only; not investment advice.
Execution time: 2026-09-30 04:00:29 (UTC+8)
The invalidation price and target price use the current position plan, not the initial entry conditions.
Over the last 20 5m candles, the range is 340.08–342.32 with a volume ratio of 0.26. Price is in the upper-middle area; a contraction in volume with an upward move by itself does not confirm direction. On the 15m timeframe, the volume ratio is 2.02 and the lower end of the range is 338.68, which is wider. For the short plan to be considered valid again, a close needs to return below 340.99 with volume higher than the current level. If the close is above 342.32, the remaining position will face further adverse price expansion.
$GOOGL short|1st position reduction
• Execution price: 341.23
• Quantity executed this time: 5.26 GOOGL
• Remaining quantity after this fill: 15.79 GOOGL
• Trigger reason: the actual reduced-position trade has been recorded; the original trigger reason was not recorded
• Invalidation price for remaining position: 340.9905
• Target price for remaining position: 336.1629
For real trading record only; not investment advice.
Execution time: 2026-09-30 04:00:29 (UTC+8)
The invalidation price and target price use the current position plan, not the initial entry conditions.
14
·
--
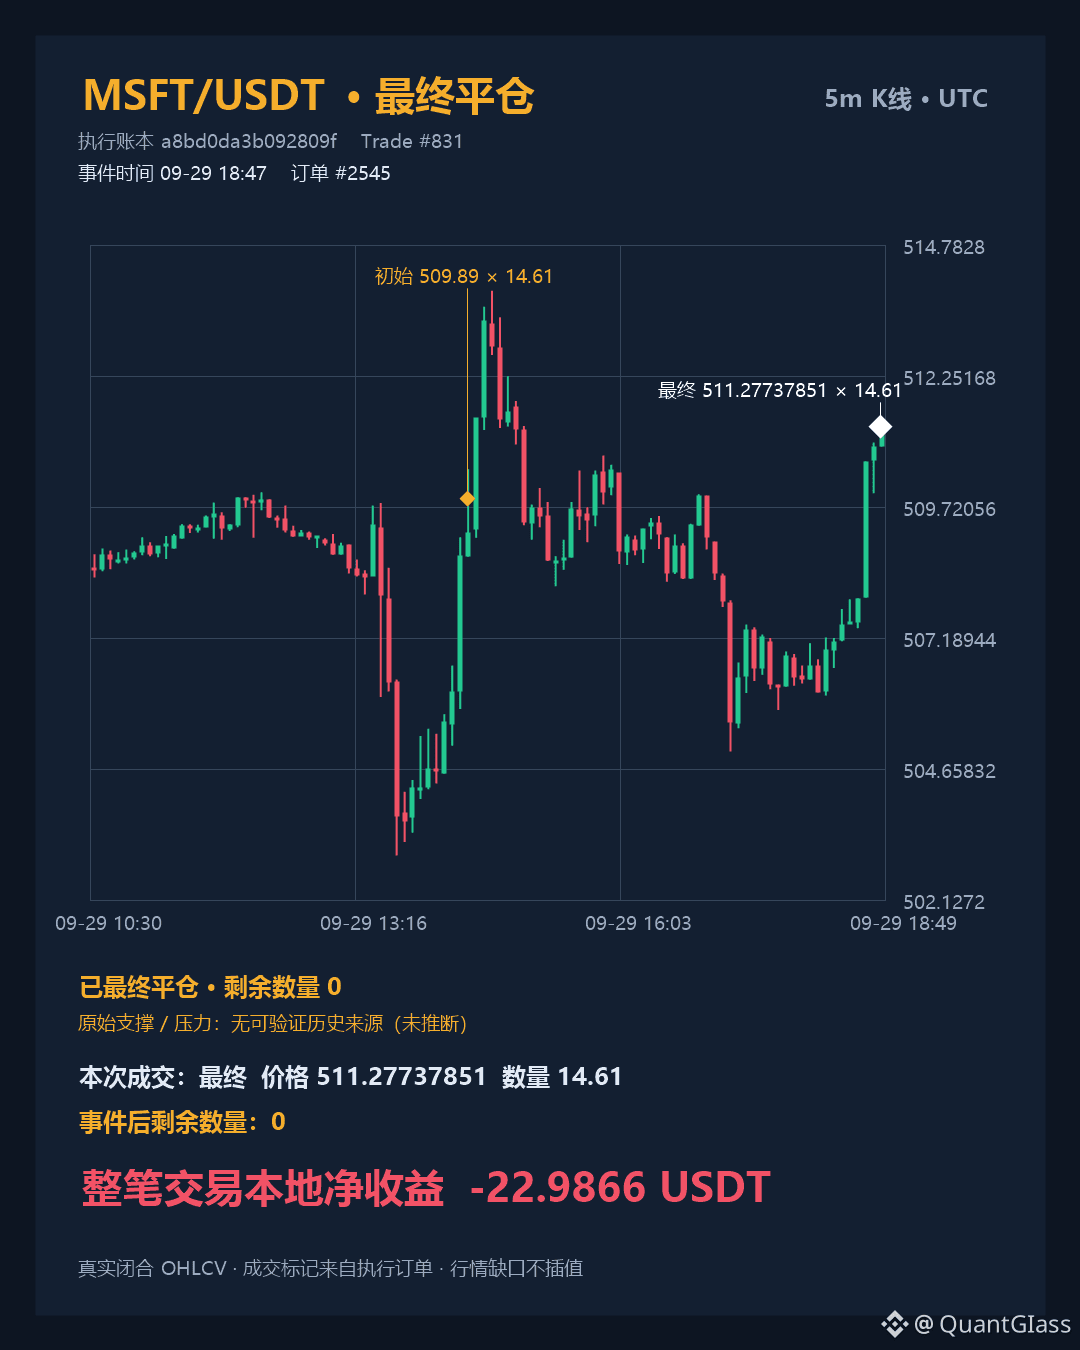
The interval high and low points are only recent extreme values; they do not equal verified support and resistance. If, afterward, the price can close with increased volume above 513.91, which is common to both the 15-minute and 1-hour charts, then an upside breakout would count as a valid volume-price alignment. If it falls back to around 505.01 and cannot be reclaimed, then the sustainability of this short-term rebound needs to be reassessed.
$MSFT This short position in the live account has already been closed.
Entry: 509.89 → Final exit: 511.2774
Final filled quantity: 14.61 MSFT|Remaining position: 0
Close time: 2026-09-30 02:47:01 (UTC+8)
Net profit/loss after all fees: -22.9866 U
Execution process: Added to the position 0 times · Partially reduced 0 times · Finally closed 1 time
Close confirmation: The execution ledger has confirmed the final fills and ended this order.
This is a real trade recap and does not indicate the result of the next trade.
The interval high and low points are only recent extreme values; they do not equal verified support and resistance. If, afterward, the price can close with increased volume above 513.91, which is common to both the 15-minute and 1-hour charts, then an upside breakout would count as a valid volume-price alignment. If it falls back to around 505.01 and cannot be reclaimed, then the sustainability of this short-term rebound needs to be reassessed.
$MSFT This short position in the live account has already been closed.
Entry: 509.89 → Final exit: 511.2774
Final filled quantity: 14.61 MSFT|Remaining position: 0
Close time: 2026-09-30 02:47:01 (UTC+8)
Net profit/loss after all fees: -22.9866 U
Execution process: Added to the position 0 times · Partially reduced 0 times · Finally closed 1 time
Close confirmation: The execution ledger has confirmed the final fills and ended this order.
This is a real trade recap and does not indicate the result of the next trade.
$MSFT This short position in the live account has already been closed.
Entry: 509.89 → Final exit: 511.2774
Final filled quantity: 14.61 MSFT|Remaining position: 0
Close time: 2026-09-30 02:47:01 (UTC+8)
Net profit/loss after all fees: -22.9866 U
Execution process: Added to the position 0 times · Partially reduced 0 times · Finally closed 1 time
Close confirmation: The execution ledger has confirmed the final fills and ended this order.
This is a real trade recap and does not indicate the result of the next trade.
14
·
--
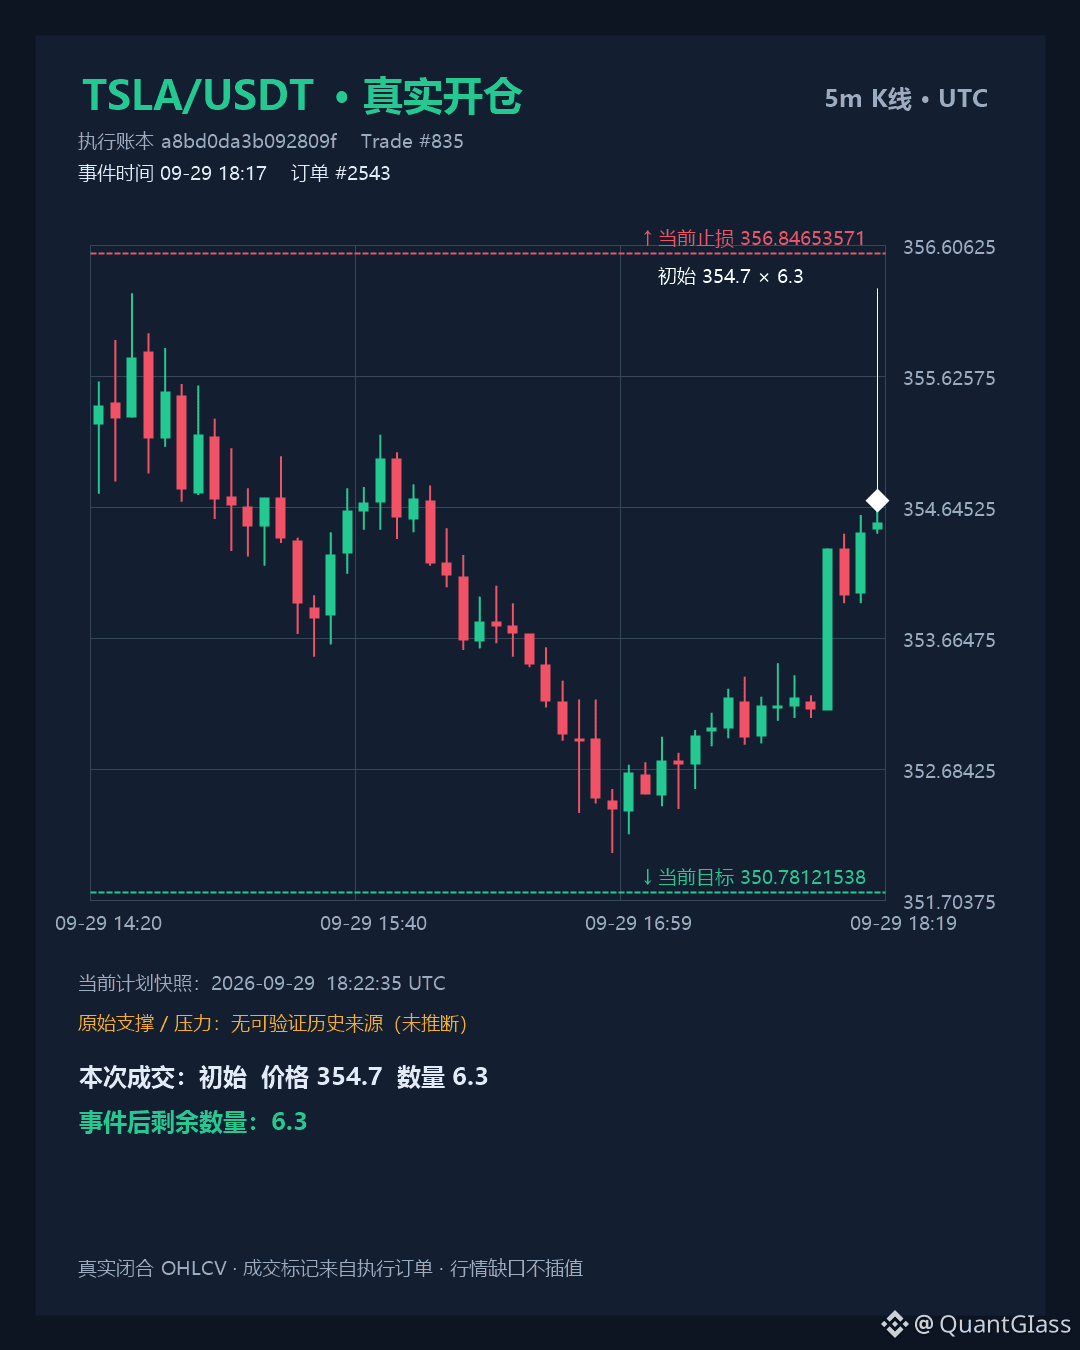
This time, opening a TSLA short mapped to 6.3 contracts at 354.7. This price is exactly the high of the last 20 five-minute candles (the 5-minute window). Over that 20-candle window, the cumulative gain was 0.38%, closing at 354.53, with a volume ratio of 0.54. Longer timeframes are not aligned in the same direction: over the last 20 15-minute candles it fell 1.26%, and over the last hour it fell 1.40%. The lowest points of the ranges for both timeframes are 352.06. The misalignment between the short-term upper boundary and the downward move of the mid-to-short timeframe is the key contradiction to observe first after opening the position.
What needs to be verified next is whether volume and price can cooperate. If, on the 5-minute chart, volume increases and price breaks down below 352.06, then the short-side plan to push toward the target 350.78 would have justification. If volume continues to contract and it closes above 354.7, the short entry location would be corrected in the opposite direction; 356.85 would be the invalidation price—if it is touched, the short-term logic must be reassessed. 352.06 is the recent range low, not a confirmed support. 354.7 only coincides with the high of the 5-minute window and the entry price; it is not confirmation of resistance.
$TSLA live short trade
• Actual executed price: 354.7
• Executed quantity this time: 6.3 TSLA
• Remaining quantity after execution: 6.3 TSLA
• Planned entry range: 353.3972 - 353.546
• Invalidation stop/close: 356.8465
• Target take-profit: 350.7812
Upside space: +0.76%|Risk space: -0.95%
For real trading record only; not investment advice.
Execution time: 2026-09-30 02:17:27 (UTC+8)
The invalidation price and target price use the current position plan, not the initial opening conditions.
This time, opening a TSLA short mapped to 6.3 contracts at 354.7. This price is exactly the high of the last 20 five-minute candles (the 5-minute window). Over that 20-candle window, the cumulative gain was 0.38%, closing at 354.53, with a volume ratio of 0.54. Longer timeframes are not aligned in the same direction: over the last 20 15-minute candles it fell 1.26%, and over the last hour it fell 1.40%. The lowest points of the ranges for both timeframes are 352.06. The misalignment between the short-term upper boundary and the downward move of the mid-to-short timeframe is the key contradiction to observe first after opening the position.
What needs to be verified next is whether volume and price can cooperate. If, on the 5-minute chart, volume increases and price breaks down below 352.06, then the short-side plan to push toward the target 350.78 would have justification. If volume continues to contract and it closes above 354.7, the short entry location would be corrected in the opposite direction; 356.85 would be the invalidation price—if it is touched, the short-term logic must be reassessed. 352.06 is the recent range low, not a confirmed support. 354.7 only coincides with the high of the 5-minute window and the entry price; it is not confirmation of resistance.
$TSLA live short trade
• Actual executed price: 354.7
• Executed quantity this time: 6.3 TSLA
• Remaining quantity after execution: 6.3 TSLA
• Planned entry range: 353.3972 - 353.546
• Invalidation stop/close: 356.8465
• Target take-profit: 350.7812
Upside space: +0.76%|Risk space: -0.95%
For real trading record only; not investment advice.
Execution time: 2026-09-30 02:17:27 (UTC+8)
The invalidation price and target price use the current position plan, not the initial opening conditions.
What needs to be verified next is whether volume and price can cooperate. If, on the 5-minute chart, volume increases and price breaks down below 352.06, then the short-side plan to push toward the target 350.78 would have justification. If volume continues to contract and it closes above 354.7, the short entry location would be corrected in the opposite direction; 356.85 would be the invalidation price—if it is touched, the short-term logic must be reassessed. 352.06 is the recent range low, not a confirmed support. 354.7 only coincides with the high of the 5-minute window and the entry price; it is not confirmation of resistance.
$TSLA live short trade
• Actual executed price: 354.7
• Executed quantity this time: 6.3 TSLA
• Remaining quantity after execution: 6.3 TSLA
• Planned entry range: 353.3972 - 353.546
• Invalidation stop/close: 356.8465
• Target take-profit: 350.7812
Upside space: +0.76%|Risk space: -0.95%
For real trading record only; not investment advice.
Execution time: 2026-09-30 02:17:27 (UTC+8)
The invalidation price and target price use the current position plan, not the initial opening conditions.
109
·
--
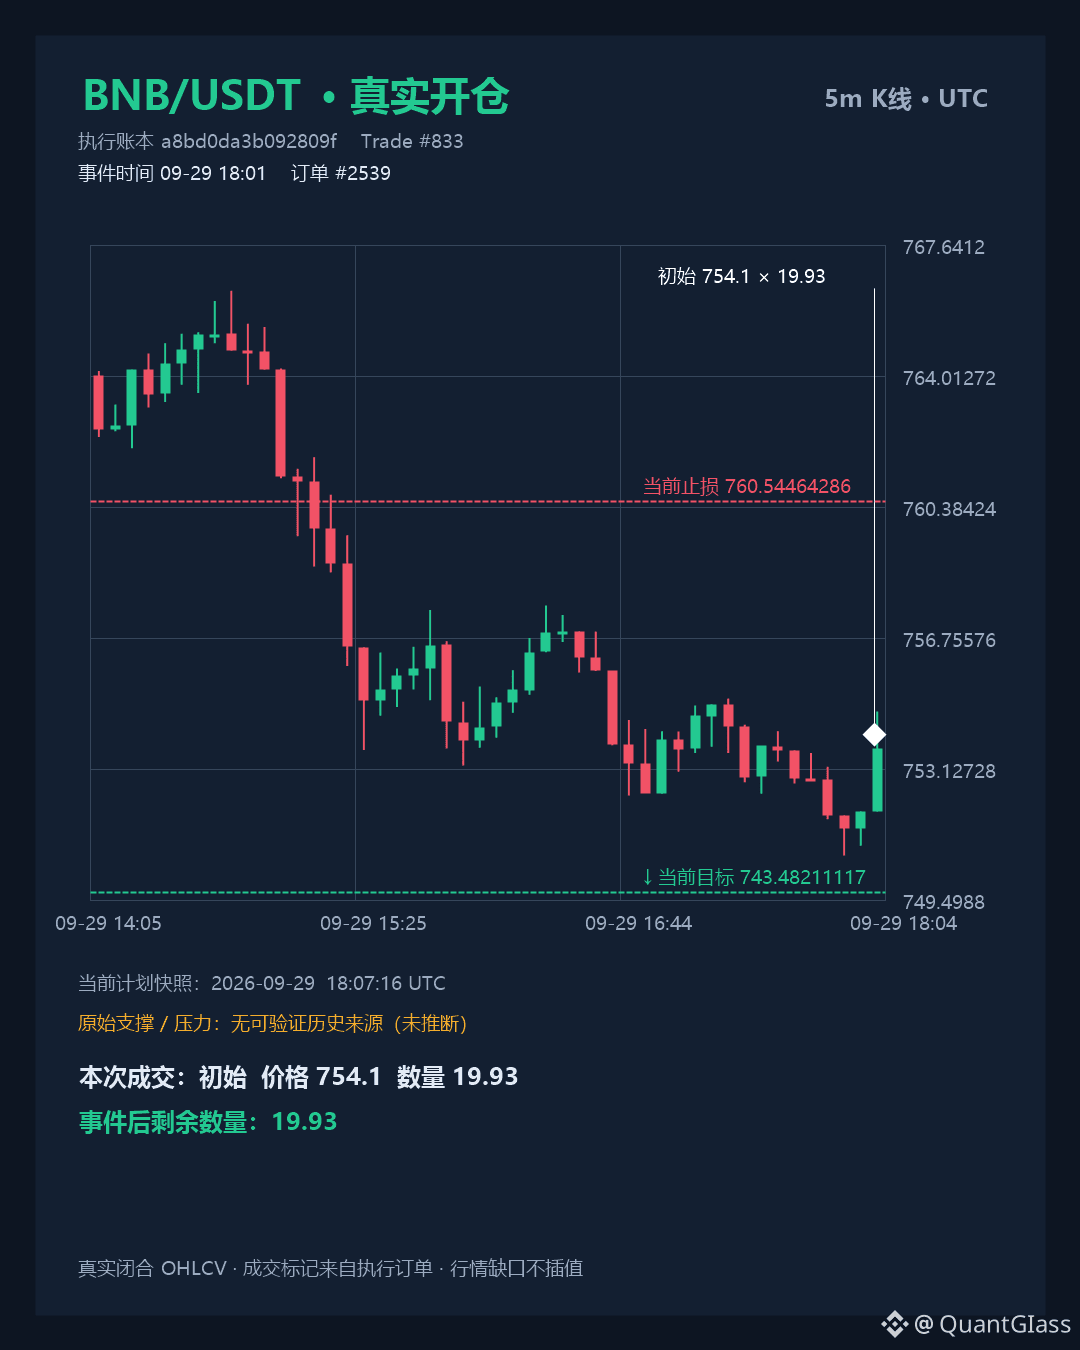
Actual fill 754.10, above the planned entry zone of 750.23–750.65. It matches the upper-middle portion of the 5m K-line range 750.75–757.41 where the price was lifted for nearly 20 candles; it is closer to the upper bound 757.41 and farther from the stop-loss 760.54. The last 5m volume is 2.42, and the 15m window has pulled back by 1.83%, indicating sell pressure on the short cycle; however, the 1h volume ratio is only 0.86, and higher-timeframe confirmation is not in the same direction.
The next validation points focus on the near boundary: if the 5m range low at 750.75 is broken down with volume, only then can the bearish case be considered to have gained price-volume confirmation. If, instead, price reverses and holds above 757.41, then the upper end of the consolidation 750.75–757.41 would be broken, directly conflicting with this trade’s entry position. The 1h range high at 769.74 is relatively far away and serves only as an overhead structural reference, not immediate pressure.
$BNB real-time live short
• Actual fill price: 754.1
• Fill quantity: 19.93 BNB
• Remaining quantity after execution: 19.93 BNB
• Planned entry range: 750.2275 - 750.6528
• Invalid (cut-off) stop/closure: 760.5446
• Take-profit target: 743.4821
Upside space +0.93%|Risk space -1.35%
For real trading records only; not investment advice.
Execution time: 2026-09-30 02:01:38 (UTC+8)
The invalidation price and target price use the current position plan, not the initial opening conditions.
Actual fill 754.10, above the planned entry zone of 750.23–750.65. It matches the upper-middle portion of the 5m K-line range 750.75–757.41 where the price was lifted for nearly 20 candles; it is closer to the upper bound 757.41 and farther from the stop-loss 760.54. The last 5m volume is 2.42, and the 15m window has pulled back by 1.83%, indicating sell pressure on the short cycle; however, the 1h volume ratio is only 0.86, and higher-timeframe confirmation is not in the same direction.
The next validation points focus on the near boundary: if the 5m range low at 750.75 is broken down with volume, only then can the bearish case be considered to have gained price-volume confirmation. If, instead, price reverses and holds above 757.41, then the upper end of the consolidation 750.75–757.41 would be broken, directly conflicting with this trade’s entry position. The 1h range high at 769.74 is relatively far away and serves only as an overhead structural reference, not immediate pressure.
$BNB real-time live short
• Actual fill price: 754.1
• Fill quantity: 19.93 BNB
• Remaining quantity after execution: 19.93 BNB
• Planned entry range: 750.2275 - 750.6528
• Invalid (cut-off) stop/closure: 760.5446
• Take-profit target: 743.4821
Upside space +0.93%|Risk space -1.35%
For real trading records only; not investment advice.
Execution time: 2026-09-30 02:01:38 (UTC+8)
The invalidation price and target price use the current position plan, not the initial opening conditions.
The next validation points focus on the near boundary: if the 5m range low at 750.75 is broken down with volume, only then can the bearish case be considered to have gained price-volume confirmation. If, instead, price reverses and holds above 757.41, then the upper end of the consolidation 750.75–757.41 would be broken, directly conflicting with this trade’s entry position. The 1h range high at 769.74 is relatively far away and serves only as an overhead structural reference, not immediate pressure.
$BNB real-time live short
• Actual fill price: 754.1
• Fill quantity: 19.93 BNB
• Remaining quantity after execution: 19.93 BNB
• Planned entry range: 750.2275 - 750.6528
• Invalid (cut-off) stop/closure: 760.5446
• Take-profit target: 743.4821
Upside space +0.93%|Risk space -1.35%
For real trading records only; not investment advice.
Execution time: 2026-09-30 02:01:38 (UTC+8)
The invalidation price and target price use the current position plan, not the initial opening conditions.
128
·
--
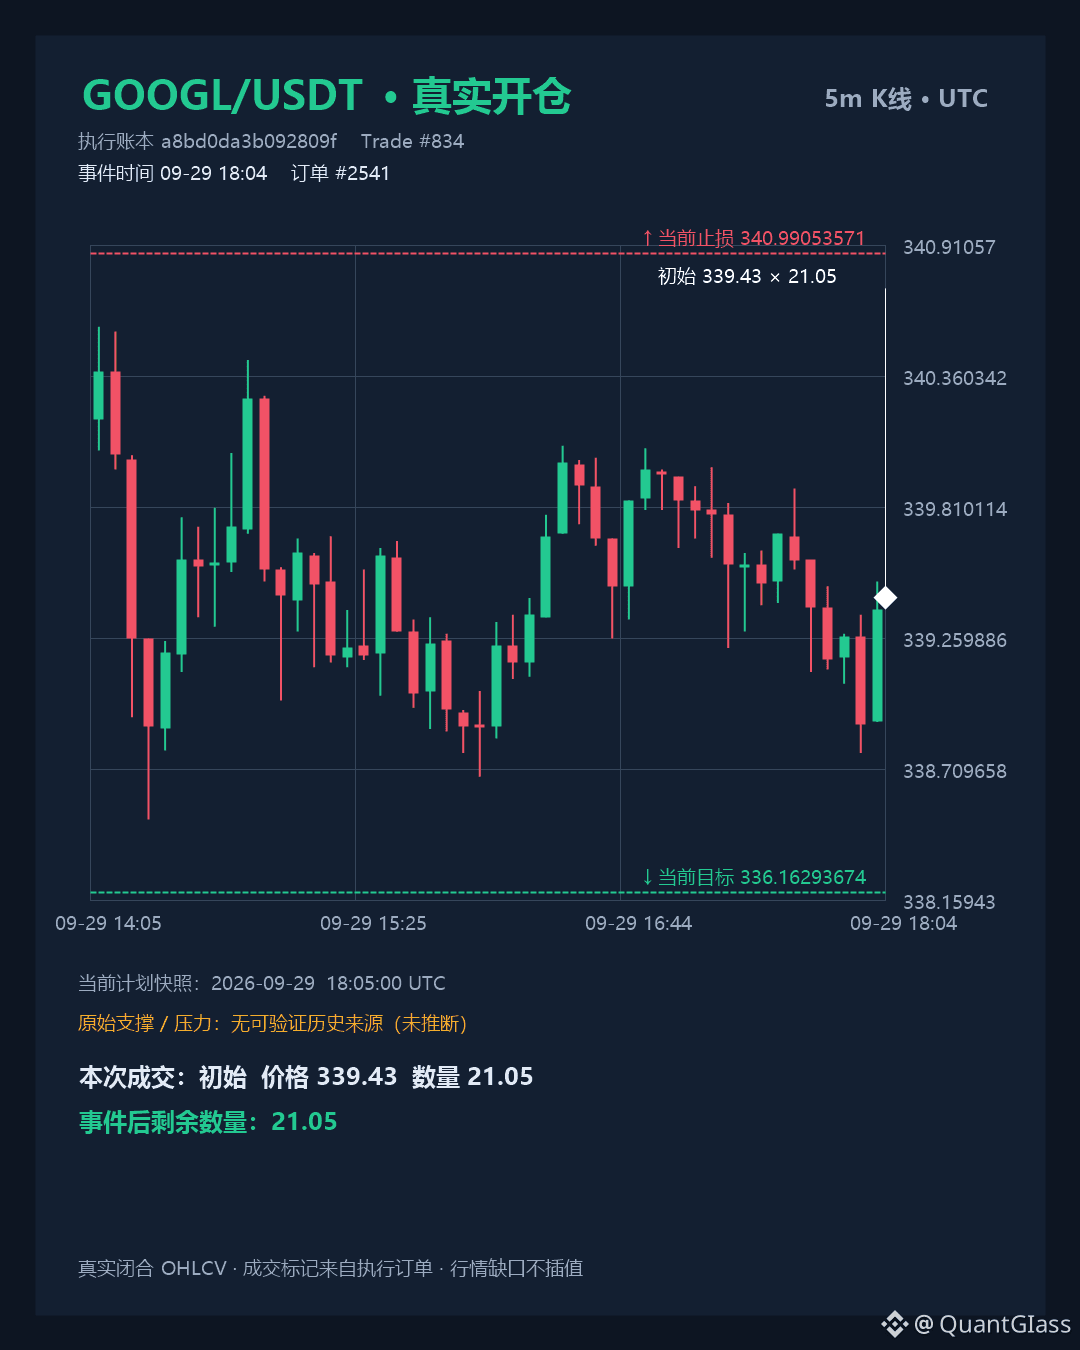
The actual execution price of this GOOGL/USDT short was 339.43, which is higher than the upper bound of the planned entry zone (338.47). The opening price was closer to the stop-loss at 340.99. The current 5m close is 339.38, which is still within the 20-candle 5m range of 338.78–340.07.
The next thing to verify is: if either the 5m or 15m closes below 338.5, and this is accompanied by an increase in volume ratio (current 15m volume ratio is 0.45, and 5m is 1.42), then it counts as a breakdown confirmed by price and volume. If the 5m closes back above 340.07 and continues to approach 340.99, then the risk of this short’s planned setup becoming invalid will rise. The take-profit at 336.16 remains the planned target; it does not mean the market has already provided support.
$GOOGL live short position
• Actual execution price: 339.43
• Execution quantity (for this fill): 21.05 GOOGL
• Remaining quantity after this fill: 21.05 GOOGL
• Planned entry zone: 338.3541 - 338.4729
• Invalidation exit: 340.9905
• Target take-profit: 336.1629
Upside to target: +0.67%|Risk to invalidation: -0.76%
Only for real trading records and does not constitute investment advice.
Execution time: 2026-09-30 02:04:54 (UTC+8)
The invalidation price and target price use the current position plan, not the initial opening conditions.
The actual execution price of this GOOGL/USDT short was 339.43, which is higher than the upper bound of the planned entry zone (338.47). The opening price was closer to the stop-loss at 340.99. The current 5m close is 339.38, which is still within the 20-candle 5m range of 338.78–340.07.
The next thing to verify is: if either the 5m or 15m closes below 338.5, and this is accompanied by an increase in volume ratio (current 15m volume ratio is 0.45, and 5m is 1.42), then it counts as a breakdown confirmed by price and volume. If the 5m closes back above 340.07 and continues to approach 340.99, then the risk of this short’s planned setup becoming invalid will rise. The take-profit at 336.16 remains the planned target; it does not mean the market has already provided support.
$GOOGL live short position
• Actual execution price: 339.43
• Execution quantity (for this fill): 21.05 GOOGL
• Remaining quantity after this fill: 21.05 GOOGL
• Planned entry zone: 338.3541 - 338.4729
• Invalidation exit: 340.9905
• Target take-profit: 336.1629
Upside to target: +0.67%|Risk to invalidation: -0.76%
Only for real trading records and does not constitute investment advice.
Execution time: 2026-09-30 02:04:54 (UTC+8)
The invalidation price and target price use the current position plan, not the initial opening conditions.
The next thing to verify is: if either the 5m or 15m closes below 338.5, and this is accompanied by an increase in volume ratio (current 15m volume ratio is 0.45, and 5m is 1.42), then it counts as a breakdown confirmed by price and volume. If the 5m closes back above 340.07 and continues to approach 340.99, then the risk of this short’s planned setup becoming invalid will rise. The take-profit at 336.16 remains the planned target; it does not mean the market has already provided support.
$GOOGL live short position
• Actual execution price: 339.43
• Execution quantity (for this fill): 21.05 GOOGL
• Remaining quantity after this fill: 21.05 GOOGL
• Planned entry zone: 338.3541 - 338.4729
• Invalidation exit: 340.9905
• Target take-profit: 336.1629
Upside to target: +0.67%|Risk to invalidation: -0.76%
Only for real trading records and does not constitute investment advice.
Execution time: 2026-09-30 02:04:54 (UTC+8)
The invalidation price and target price use the current position plan, not the initial opening conditions.
89
·
--
Things are lively with NEAR ETF trading—does that equal new money flowing into the fund?
SEC records show that the registration statement for the Bitwise NEAR ETF became effective on September 24. In the preliminary prospectus dated September 16, two things were clearly separated: ordinary shares are bought and sold in the secondary market; subscription and redemption at the fund level are handled by authorized participants using baskets.
The same share can be traded back and forth repeatedly, so trading volume accumulates—but that doesn’t necessarily mean the fund’s assets increase. My clue is: to look for incremental demand, first check net subscriptions/redemptions and changes in share count, then verify the statistical date. Registration becoming effective, the start of trading, and the appearance of net inflows each require their own corresponding evidence; you can’t use one headline to stand in for all of them.
When you see ETF news, what data do you most hope it includes?
$NEAR #NEARETF funds data 기준
Things are lively with NEAR ETF trading—does that equal new money flowing into the fund?
SEC records show that the registration statement for the Bitwise NEAR ETF became effective on September 24. In the preliminary prospectus dated September 16, two things were clearly separated: ordinary shares are bought and sold in the secondary market; subscription and redemption at the fund level are handled by authorized participants using baskets.
The same share can be traded back and forth repeatedly, so trading volume accumulates—but that doesn’t necessarily mean the fund’s assets increase. My clue is: to look for incremental demand, first check net subscriptions/redemptions and changes in share count, then verify the statistical date. Registration becoming effective, the start of trading, and the appearance of net inflows each require their own corresponding evidence; you can’t use one headline to stand in for all of them.
When you see ETF news, what data do you most hope it includes?
$NEAR #NEARETF funds data 기준
SEC records show that the registration statement for the Bitwise NEAR ETF became effective on September 24. In the preliminary prospectus dated September 16, two things were clearly separated: ordinary shares are bought and sold in the secondary market; subscription and redemption at the fund level are handled by authorized participants using baskets.
The same share can be traded back and forth repeatedly, so trading volume accumulates—but that doesn’t necessarily mean the fund’s assets increase. My clue is: to look for incremental demand, first check net subscriptions/redemptions and changes in share count, then verify the statistical date. Registration becoming effective, the start of trading, and the appearance of net inflows each require their own corresponding evidence; you can’t use one headline to stand in for all of them.
When you see ETF news, what data do you most hope it includes?
$NEAR #NEARETF funds data 기준

310
Log in to explore more content
Join global crypto users on Binance Square
⚡️ Get latest and useful information about crypto.
💬 Trusted by the world’s largest crypto exchange.
👍 Discover real insights from verified creators.
Email / Phone number
Trending Topics
QNTRises287%
9,609 views
265 Discussing
🚨 QNT JUST EXPLODED +287%! 🔥
+287% is NOT a normal move. 👀
QNT has suddenly gone parabolic, putting traders on high alert as momentum and volume surge.
⚠️ After a move this violent, FOMO can be dangerous — volatility
can go both ways.
📈 Watch: sustained volume + breakout confirmation
📉 Risk: sharp profit-taking / pullback
🔥 Is QNT just getting started… or is this move ready for a major correction?
What’s your QNT target? 👇
#qntrises287% #QNT #Quant #crypto #BinanceSquare
$QNT
ASHFAQ NAEEM
·8 Likes
·6.1k views
TrumpRejectsAIRulesForVoluntaryAudits
12,218 views
363 Discussing
BitgetHotWalletBreachTiedToThirdPartySecurityFlaw
6,010 views
256 Discussing