
币圈院士-
2.2k Posts

币圈院士-
Report
Block User
不玩虚的,只讲实战,/公众号/陈家军166
135 Following
8.7K+ Followers
10.9K+ Liked
Posts
All
Quotes
Videos
Live
PINNED
·
--
Bullish
You can message me directly as a friend on Binance✨
Enter “Chatroom” in the search bar to join the group chat
Tap the plus sign in the top right, then select Add Contacts
Search ID: 723267644
Send a friend request to add me and chat, or scan the QR code below
$BTC
{future}(BTCUSDT)
$ETH
{future}(ETHUSDT)
You can message me directly as a friend on Binance✨
Enter “Chatroom” in the search bar to join the group chat
Tap the plus sign in the top right, then select Add Contacts
Search ID: 723267644
Send a friend request to add me and chat, or scan the QR code below
$BTC
$ETH
Enter “Chatroom” in the search bar to join the group chat
Tap the plus sign in the top right, then select Add Contacts
Search ID: 723267644
Send a friend request to add me and chat, or scan the QR code below
$BTC
$ETH


1
15
1.1k
·
--
Bullish
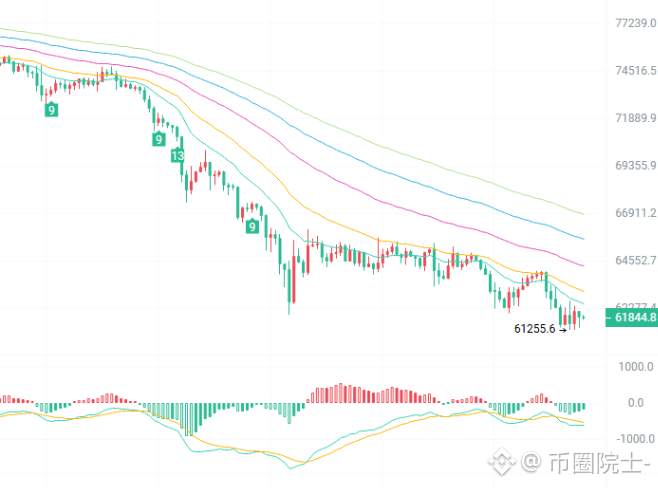
$BTC Current price: 61840. This drop has kept many people awake at night: those who bought the dip are stuck, while those chasing shorts fear a rebound. The market is in a real bind. A big drop doesn’t mean a rise is due; the market only cares where the money is flowing. Until a clear signal emerges, any talk of a bottom is wishful thinking.
The bearish trend is clear on the 2-hour chart: moving averages are stacked overhead, price is languishing below them, MACD remains below the zero line, and price is moving along the lower Bollinger Band—all classic signs of weakness. Strong resistance sits at 62400–62800. If 61250 breaks, there could be even lower levels ahead. Any rebound may just be a pause in the downtrend, not a reversal.
On the 15-minute chart, this is simply a breather after a steep drop. The bounce back to 61840 looks like a rebound, but it’s actually very weak. The low-level MACD golden cross has produced only a small red histogram, while the longer-term moving averages continue to weigh on price. Selling pressure is layered between 62200 and 62400, and each push higher gets knocked back.
Strategy:
Don’t fight the trend. If a rebound stalls at resistance, consider a small short position, with a stop-loss above 62800.
If you want to trade a rebound, watch only for signs of support holding at 61250, with a stop-loss below 61000.
If the previous low breaks, exit immediately. Don’t chase shorts at the lows or hold on stubbornly. Reduce position size; if you don’t understand the market, sit and wait.
(For technical discussion only; this does not constitute investment advice.)
{future}(BTCUSDT)
#BTC
$BTC Current price: 61840. This drop has kept many people awake at night: those who bought the dip are stuck, while those chasing shorts fear a rebound. The market is in a real bind. A big drop doesn’t mean a rise is due; the market only cares where the money is flowing. Until a clear signal emerges, any talk of a bottom is wishful thinking.
The bearish trend is clear on the 2-hour chart: moving averages are stacked overhead, price is languishing below them, MACD remains below the zero line, and price is moving along the lower Bollinger Band—all classic signs of weakness. Strong resistance sits at 62400–62800. If 61250 breaks, there could be even lower levels ahead. Any rebound may just be a pause in the downtrend, not a reversal.
On the 15-minute chart, this is simply a breather after a steep drop. The bounce back to 61840 looks like a rebound, but it’s actually very weak. The low-level MACD golden cross has produced only a small red histogram, while the longer-term moving averages continue to weigh on price. Selling pressure is layered between 62200 and 62400, and each push higher gets knocked back.
Strategy:
Don’t fight the trend. If a rebound stalls at resistance, consider a small short position, with a stop-loss above 62800.
If you want to trade a rebound, watch only for signs of support holding at 61250, with a stop-loss below 61000.
If the previous low breaks, exit immediately. Don’t chase shorts at the lows or hold on stubbornly. Reduce position size; if you don’t understand the market, sit and wait.
(For technical discussion only; this does not constitute investment advice.)
#BTC
The bearish trend is clear on the 2-hour chart: moving averages are stacked overhead, price is languishing below them, MACD remains below the zero line, and price is moving along the lower Bollinger Band—all classic signs of weakness. Strong resistance sits at 62400–62800. If 61250 breaks, there could be even lower levels ahead. Any rebound may just be a pause in the downtrend, not a reversal.
On the 15-minute chart, this is simply a breather after a steep drop. The bounce back to 61840 looks like a rebound, but it’s actually very weak. The low-level MACD golden cross has produced only a small red histogram, while the longer-term moving averages continue to weigh on price. Selling pressure is layered between 62200 and 62400, and each push higher gets knocked back.
Strategy:
Don’t fight the trend. If a rebound stalls at resistance, consider a small short position, with a stop-loss above 62800.
If you want to trade a rebound, watch only for signs of support holding at 61250, with a stop-loss below 61000.
If the previous low breaks, exit immediately. Don’t chase shorts at the lows or hold on stubbornly. Reduce position size; if you don’t understand the market, sit and wait.
(For technical discussion only; this does not constitute investment advice.)
#BTC
1
1.1k
·
--
Bullish
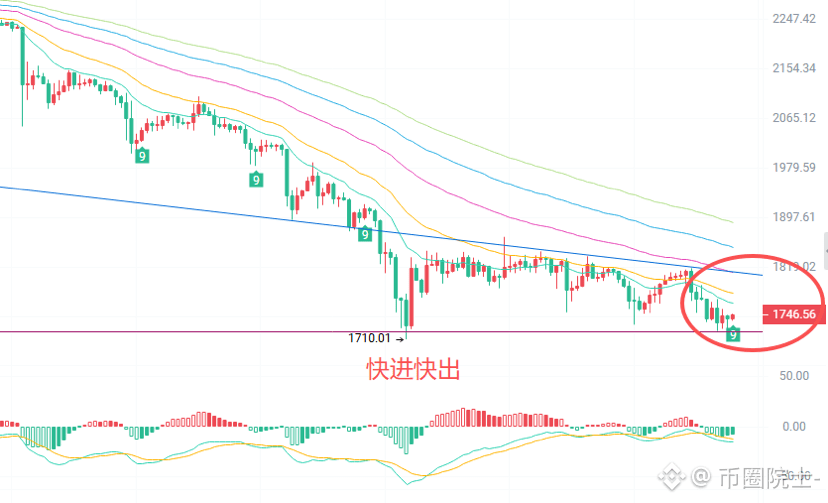
$ETH ETH outlook? Short-term breakdown: current price 1739, rebounding from the low of 1717. The sharpest wave of panic selling seems to have passed for now.
The 2-hour chart is still bearish, with moving averages exerting pressure at every level—don't rush to call a reversal. On the 15-minute chart, price has moved back above the short-term moving averages, the MACD has formed a bullish crossover, and rebound momentum is building.
Long: Try a small position in the 1740–1720 range; stop-loss below 1716, target 1742–1750.
Short: Consider entering only if price pulls back after meeting resistance at 1770–1790; stop-loss above 1800, target 1740–1720.
In short: This is only a weak rebound, with significant overhead resistance. Get in and out quickly, keep positions small, and always use a stop-loss.
{future}(ETHUSDT)
#ETH走势分析
$ETH ETH outlook? Short-term breakdown: current price 1739, rebounding from the low of 1717. The sharpest wave of panic selling seems to have passed for now.
The 2-hour chart is still bearish, with moving averages exerting pressure at every level—don't rush to call a reversal. On the 15-minute chart, price has moved back above the short-term moving averages, the MACD has formed a bullish crossover, and rebound momentum is building.
Long: Try a small position in the 1740–1720 range; stop-loss below 1716, target 1742–1750.
Short: Consider entering only if price pulls back after meeting resistance at 1770–1790; stop-loss above 1800, target 1740–1720.
In short: This is only a weak rebound, with significant overhead resistance. Get in and out quickly, keep positions small, and always use a stop-loss.
#ETH走势分析
The 2-hour chart is still bearish, with moving averages exerting pressure at every level—don't rush to call a reversal. On the 15-minute chart, price has moved back above the short-term moving averages, the MACD has formed a bullish crossover, and rebound momentum is building.
Long: Try a small position in the 1740–1720 range; stop-loss below 1716, target 1742–1750.
Short: Consider entering only if price pulls back after meeting resistance at 1770–1790; stop-loss above 1800, target 1740–1720.
In short: This is only a weak rebound, with significant overhead resistance. Get in and out quickly, keep positions small, and always use a stop-loss.
#ETH走势分析
2
1.6k
·
--
Bullish
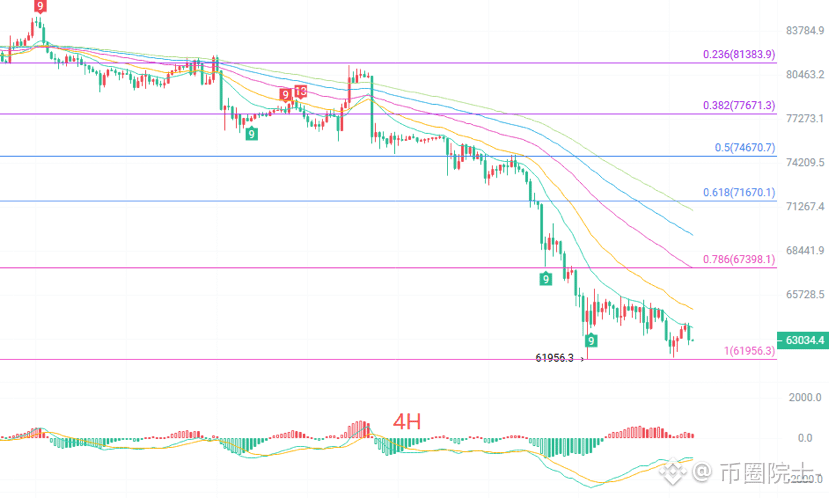
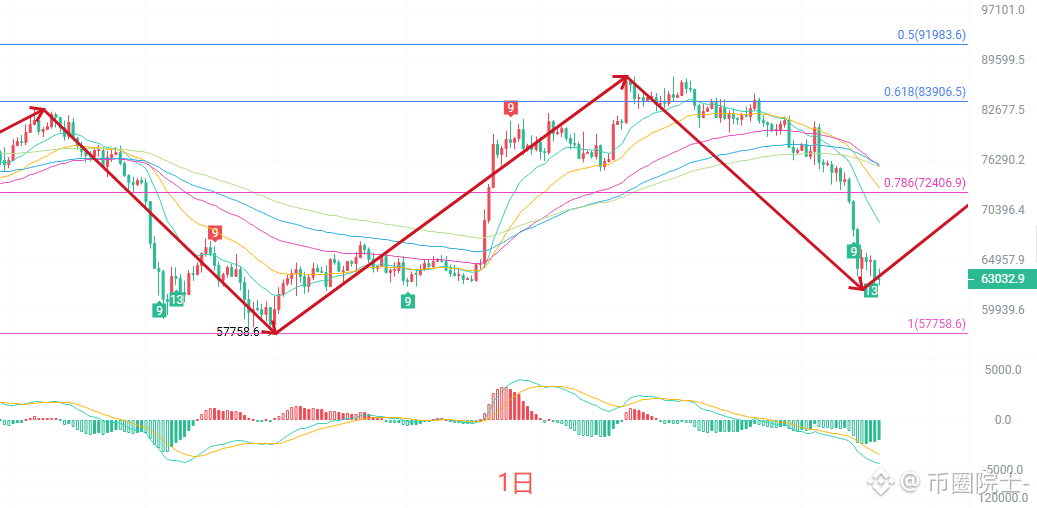
$BTC In a weak market, protecting your principal is more important than catching every move. Trading at low levels is not off-limits, but you need to spell out your trading conditions: where to enter, what signal confirms the trade, and where to exit if you’re wrong. Many losses don’t come from misjudging direction, but from entering too hastily, taking on too large a position, or setting a stop-loss too late. The current market has not yet provided a clear reversal signal, so both bulls and bears need to wait for confirmation. Keep an eye on two levels: the short-term low at 61956 below, and the four-hour moving average resistance above. If support holds and resistance breaks, the bulls will have more room to advance; if the low gives way, you’ll need to lower your position expectations further to manage risk. Take it slowly—get through the volatile period first, then think about what comes next.
The daily candlesticks have weakened consecutively in recent sessions. The current price is around 62860, after a brief recovery from a swing low in the 57758 area. The moving averages are bearishly aligned, with short-term EMAs above the price and medium- and long-term averages also trending down, indicating that the daily trend remains weak for now. The MACD is still below the zero line, and the green momentum bars are continuing to expand; the indicator has not given a clear reversal signal. The Bollinger Bands are opening downward, with the price tracking near the lower band. Although the lower band may provide support, there is not yet a clear pattern of stabilization accompanied by increased volume. Overall, the daily chart remains in a weak corrective phase. The short-term rebound is better understood as a recovery after the decline; a stronger trend would require the price to reclaim key moving averages and confirm that selling pressure is easing.
The four-hour chart shows a clear continuation of the downtrend, with the price moving steadily lower along the short-term moving averages. The area around 61956 has become the latest short-term low. The price is now making a modest bounce from the lows, but it remains capped by successive moving averages, including the EMA15 and EMA30, and the rebound has yet to break through convincingly. The MACD is trading in low territory. The red momentum bars have contracted somewhat, but the DIF and DEA lines have yet to form a bullish crossover, so the bulls have not taken the initiative. After touching the lower Bollinger Band, the price has tightened slightly, but the short-term trading range remains skewed to the downside. The market is more likely to remain in weak consolidation. Only if the price reclaims key four-hour moving averages with volume confirmation might the short-term structure shift from a decline to a consolidative recovery. Until then, don’t be overly optimistic about the rebound.
Short-term reference:
Short (sell): 64000–64500 if momentum stalls; stop-loss: 500 points; target: 63000–62300
Long (buy): 62300–61900 if the decline stalls; stop-loss: 500 points; target: 63500–84000
{future}(BTCUSDT)
#BTC #BTC走势分析
$BTC In a weak market, protecting your principal is more important than catching every move. Trading at low levels is not off-limits, but you need to spell out your trading conditions: where to enter, what signal confirms the trade, and where to exit if you’re wrong. Many losses don’t come from misjudging direction, but from entering too hastily, taking on too large a position, or setting a stop-loss too late. The current market has not yet provided a clear reversal signal, so both bulls and bears need to wait for confirmation. Keep an eye on two levels: the short-term low at 61956 below, and the four-hour moving average resistance above. If support holds and resistance breaks, the bulls will have more room to advance; if the low gives way, you’ll need to lower your position expectations further to manage risk. Take it slowly—get through the volatile period first, then think about what comes next.
The daily candlesticks have weakened consecutively in recent sessions. The current price is around 62860, after a brief recovery from a swing low in the 57758 area. The moving averages are bearishly aligned, with short-term EMAs above the price and medium- and long-term averages also trending down, indicating that the daily trend remains weak for now. The MACD is still below the zero line, and the green momentum bars are continuing to expand; the indicator has not given a clear reversal signal. The Bollinger Bands are opening downward, with the price tracking near the lower band. Although the lower band may provide support, there is not yet a clear pattern of stabilization accompanied by increased volume. Overall, the daily chart remains in a weak corrective phase. The short-term rebound is better understood as a recovery after the decline; a stronger trend would require the price to reclaim key moving averages and confirm that selling pressure is easing.
The four-hour chart shows a clear continuation of the downtrend, with the price moving steadily lower along the short-term moving averages. The area around 61956 has become the latest short-term low. The price is now making a modest bounce from the lows, but it remains capped by successive moving averages, including the EMA15 and EMA30, and the rebound has yet to break through convincingly. The MACD is trading in low territory. The red momentum bars have contracted somewhat, but the DIF and DEA lines have yet to form a bullish crossover, so the bulls have not taken the initiative. After touching the lower Bollinger Band, the price has tightened slightly, but the short-term trading range remains skewed to the downside. The market is more likely to remain in weak consolidation. Only if the price reclaims key four-hour moving averages with volume confirmation might the short-term structure shift from a decline to a consolidative recovery. Until then, don’t be overly optimistic about the rebound.
Short-term reference:
Short (sell): 64000–64500 if momentum stalls; stop-loss: 500 points; target: 63000–62300
Long (buy): 62300–61900 if the decline stalls; stop-loss: 500 points; target: 63500–84000
#BTC #BTC走势分析
The daily candlesticks have weakened consecutively in recent sessions. The current price is around 62860, after a brief recovery from a swing low in the 57758 area. The moving averages are bearishly aligned, with short-term EMAs above the price and medium- and long-term averages also trending down, indicating that the daily trend remains weak for now. The MACD is still below the zero line, and the green momentum bars are continuing to expand; the indicator has not given a clear reversal signal. The Bollinger Bands are opening downward, with the price tracking near the lower band. Although the lower band may provide support, there is not yet a clear pattern of stabilization accompanied by increased volume. Overall, the daily chart remains in a weak corrective phase. The short-term rebound is better understood as a recovery after the decline; a stronger trend would require the price to reclaim key moving averages and confirm that selling pressure is easing.
The four-hour chart shows a clear continuation of the downtrend, with the price moving steadily lower along the short-term moving averages. The area around 61956 has become the latest short-term low. The price is now making a modest bounce from the lows, but it remains capped by successive moving averages, including the EMA15 and EMA30, and the rebound has yet to break through convincingly. The MACD is trading in low territory. The red momentum bars have contracted somewhat, but the DIF and DEA lines have yet to form a bullish crossover, so the bulls have not taken the initiative. After touching the lower Bollinger Band, the price has tightened slightly, but the short-term trading range remains skewed to the downside. The market is more likely to remain in weak consolidation. Only if the price reclaims key four-hour moving averages with volume confirmation might the short-term structure shift from a decline to a consolidative recovery. Until then, don’t be overly optimistic about the rebound.
Short-term reference:
Short (sell): 64000–64500 if momentum stalls; stop-loss: 500 points; target: 63000–62300
Long (buy): 62300–61900 if the decline stalls; stop-loss: 500 points; target: 63500–84000
#BTC #BTC走势分析
6
1.7k
·
--
Bullish
$ETH Crypto Market Analyst: 11/20 Ethereum (ETH) has broken below the moving-average resistance band, and the second-largest cryptocurrency is building energy for its next directional move
Many people want to buy the dip, but few can stick to their discipline. Opportunities and risks coexist at low levels. Before the signal is confirmed, only test the waters with a small position instead of betting everything on a reversal. Trading means accepting that you can be wrong; stop-losses are there for that reason. Don’t let reluctance to take a loss turn a small loss into a big one. There are opportunities in the market every day. Protecting your capital is what gives you the chance to enter again. For example, yesterday, the northbound position bought at 1755 and sold part at 1800, then placed an order at 1730 to add to the position, with a small stop-loss. It’s fine if the trade is wrong.
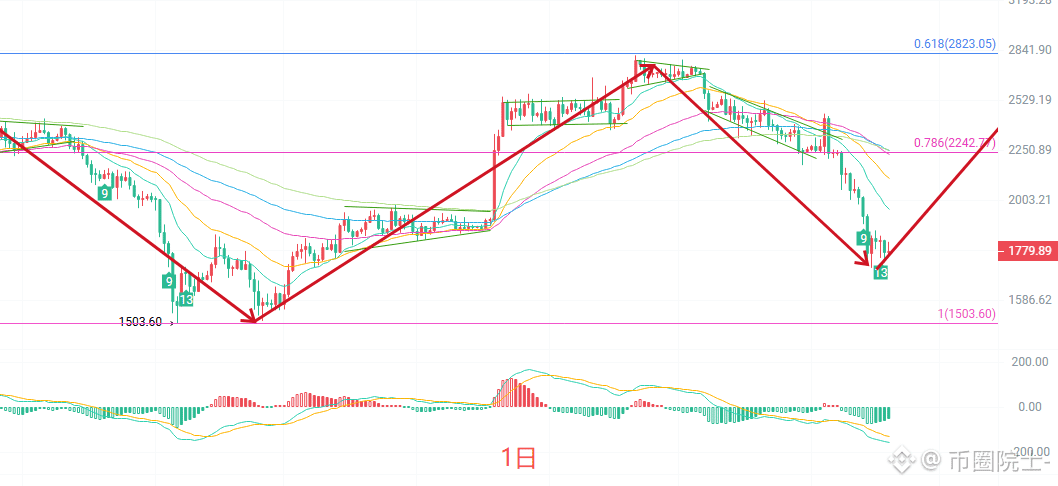
The daily candlestick closed slightly lower overall. Structurally, since retreating from the high of 2806, the moving averages have formed a bearish alignment. EMA15 is at 1959 and EMA30 at 2106, with the price clearly below all short- and medium-term moving averages, creating layers of resistance to any rebound. The Bollinger Band lower line is at 1657, and the current price is moving just above it, indicating that the daily chart remains in a weak range. On the MACD, the green bars are still expanding, so bearish momentum has not yet fully run its course. Although some consolidation at lower levels may be needed in the short term, the daily trend has not yet reversed. Any rebound should initially be viewed as a corrective move; the price must reclaim key moving averages before we can talk about stabilization.
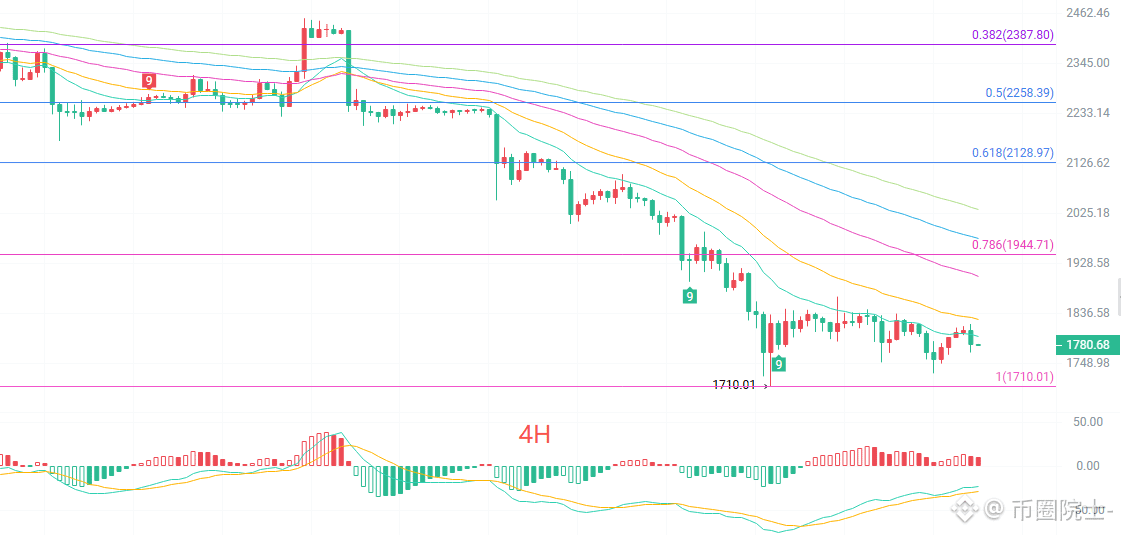
After rebounding from the four-hour chart’s low of 1710, the price has fallen back below EMA15 at 1798, while EMA30 is at 1828; the short- and medium-term moving averages are still exerting downward pressure. The Bollinger Band lower line is at 1760, the middle line at 1845, and the upper line at 1802. The current price is tracking very close to the lower line, forming a typical weak, low-level consolidation pattern. The MACD has shifted slightly from green to red, suggesting some short-term signs of stabilization and recovery, but the move is weak and has not formed a clear bullish reversal structure. The four-hour chart currently looks more like a pause and consolidation after a decline. Whether the rebound can continue depends on whether the price can reclaim the moving-average resistance zone between 1798 and 1828.
Short-term reference:
Sell southbound from 1800 to 1830 if momentum stalls; stop-loss at 30 points, target 1770 to 1750.
Buy northbound from 1760 to 1730 if the decline stabilizes; stop-loss at 30 points, target 1800 to 1830.
For specific trades, refer primarily to real-time order-book data. For more information, please contact the author. There may be a delay in publishing this article. This is for reference only; assume all risks yourself.
{future}(ETHUSDT)
#ETH
$ETH Crypto Market Analyst: 11/20 Ethereum (ETH) has broken below the moving-average resistance band, and the second-largest cryptocurrency is building energy for its next directional move
Many people want to buy the dip, but few can stick to their discipline. Opportunities and risks coexist at low levels. Before the signal is confirmed, only test the waters with a small position instead of betting everything on a reversal. Trading means accepting that you can be wrong; stop-losses are there for that reason. Don’t let reluctance to take a loss turn a small loss into a big one. There are opportunities in the market every day. Protecting your capital is what gives you the chance to enter again. For example, yesterday, the northbound position bought at 1755 and sold part at 1800, then placed an order at 1730 to add to the position, with a small stop-loss. It’s fine if the trade is wrong.
The daily candlestick closed slightly lower overall. Structurally, since retreating from the high of 2806, the moving averages have formed a bearish alignment. EMA15 is at 1959 and EMA30 at 2106, with the price clearly below all short- and medium-term moving averages, creating layers of resistance to any rebound. The Bollinger Band lower line is at 1657, and the current price is moving just above it, indicating that the daily chart remains in a weak range. On the MACD, the green bars are still expanding, so bearish momentum has not yet fully run its course. Although some consolidation at lower levels may be needed in the short term, the daily trend has not yet reversed. Any rebound should initially be viewed as a corrective move; the price must reclaim key moving averages before we can talk about stabilization.
After rebounding from the four-hour chart’s low of 1710, the price has fallen back below EMA15 at 1798, while EMA30 is at 1828; the short- and medium-term moving averages are still exerting downward pressure. The Bollinger Band lower line is at 1760, the middle line at 1845, and the upper line at 1802. The current price is tracking very close to the lower line, forming a typical weak, low-level consolidation pattern. The MACD has shifted slightly from green to red, suggesting some short-term signs of stabilization and recovery, but the move is weak and has not formed a clear bullish reversal structure. The four-hour chart currently looks more like a pause and consolidation after a decline. Whether the rebound can continue depends on whether the price can reclaim the moving-average resistance zone between 1798 and 1828.
Short-term reference:
Sell southbound from 1800 to 1830 if momentum stalls; stop-loss at 30 points, target 1770 to 1750.
Buy northbound from 1760 to 1730 if the decline stabilizes; stop-loss at 30 points, target 1800 to 1830.
For specific trades, refer primarily to real-time order-book data. For more information, please contact the author. There may be a delay in publishing this article. This is for reference only; assume all risks yourself.
#ETH
Many people want to buy the dip, but few can stick to their discipline. Opportunities and risks coexist at low levels. Before the signal is confirmed, only test the waters with a small position instead of betting everything on a reversal. Trading means accepting that you can be wrong; stop-losses are there for that reason. Don’t let reluctance to take a loss turn a small loss into a big one. There are opportunities in the market every day. Protecting your capital is what gives you the chance to enter again. For example, yesterday, the northbound position bought at 1755 and sold part at 1800, then placed an order at 1730 to add to the position, with a small stop-loss. It’s fine if the trade is wrong.
The daily candlestick closed slightly lower overall. Structurally, since retreating from the high of 2806, the moving averages have formed a bearish alignment. EMA15 is at 1959 and EMA30 at 2106, with the price clearly below all short- and medium-term moving averages, creating layers of resistance to any rebound. The Bollinger Band lower line is at 1657, and the current price is moving just above it, indicating that the daily chart remains in a weak range. On the MACD, the green bars are still expanding, so bearish momentum has not yet fully run its course. Although some consolidation at lower levels may be needed in the short term, the daily trend has not yet reversed. Any rebound should initially be viewed as a corrective move; the price must reclaim key moving averages before we can talk about stabilization.
After rebounding from the four-hour chart’s low of 1710, the price has fallen back below EMA15 at 1798, while EMA30 is at 1828; the short- and medium-term moving averages are still exerting downward pressure. The Bollinger Band lower line is at 1760, the middle line at 1845, and the upper line at 1802. The current price is tracking very close to the lower line, forming a typical weak, low-level consolidation pattern. The MACD has shifted slightly from green to red, suggesting some short-term signs of stabilization and recovery, but the move is weak and has not formed a clear bullish reversal structure. The four-hour chart currently looks more like a pause and consolidation after a decline. Whether the rebound can continue depends on whether the price can reclaim the moving-average resistance zone between 1798 and 1828.
Short-term reference:
Sell southbound from 1800 to 1830 if momentum stalls; stop-loss at 30 points, target 1770 to 1750.
Buy northbound from 1760 to 1730 if the decline stabilizes; stop-loss at 30 points, target 1800 to 1830.
For specific trades, refer primarily to real-time order-book data. For more information, please contact the author. There may be a delay in publishing this article. This is for reference only; assume all risks yourself.
#ETH
8
4.2k
·
--
Bullish
$LTC Litecoin (LTC) Cycle Outlook
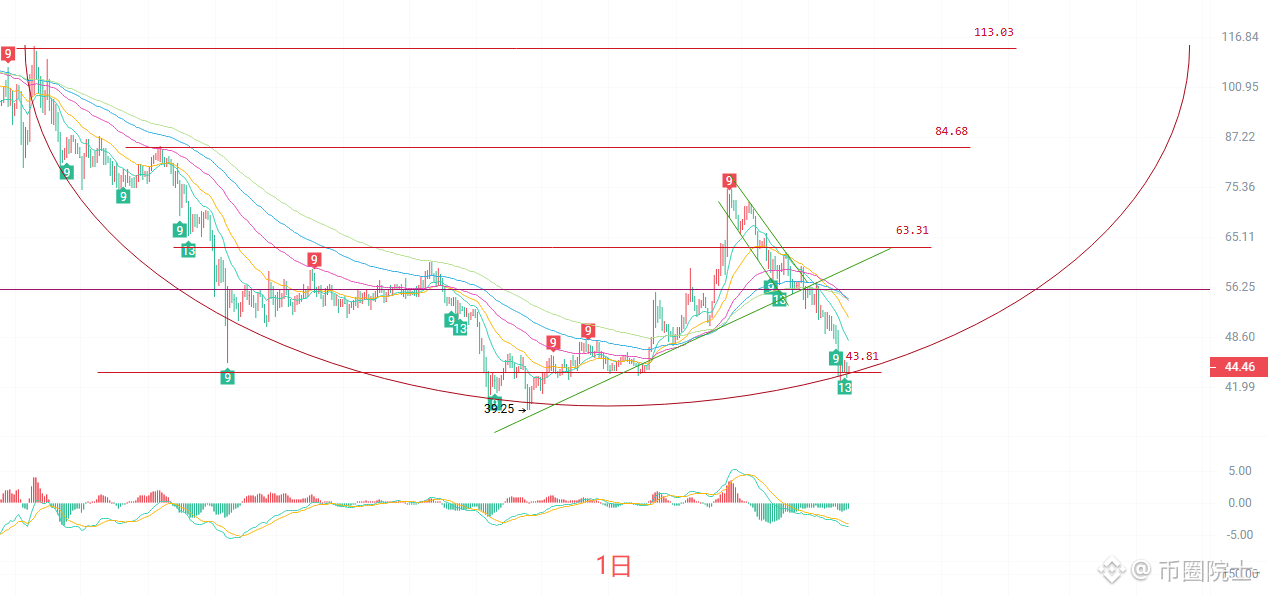
LTC is currently around 44.50, with a previous high of 74.99 and a previous low of 39.25. It is currently in the lower range following a pullback.
On the weekly chart, the price is below all EMA lines, and MACD is below the zero line, so the medium-term trend has yet to recover. The Bollinger middle band at 52.93 is the first confirmation level for a strengthening trend.
Daily chart: The price is near the lower Bollinger Band at 42.08, and the MACD histogram bars are contracting, showing signs of short-term stabilization. However, the structure is hard to call improved until the price rises above both resistance levels at 48.17 and 50.10.
Long-term approach: Consider monitoring the 42.08–43.07 range in stages; pause adding to positions if the price falls below 39.25. Avoid taking heavy positions against the trend before it has recovered. For short-term trades, stick to the range and prioritize stop-losses.
Use the cycle outlook for spot trading and risk management for futures. Don’t let a short-term trade turn into a long-term hold.
{future}(LTCUSDT)
#LTC
$LTC Litecoin (LTC) Cycle Outlook
LTC is currently around 44.50, with a previous high of 74.99 and a previous low of 39.25. It is currently in the lower range following a pullback.
On the weekly chart, the price is below all EMA lines, and MACD is below the zero line, so the medium-term trend has yet to recover. The Bollinger middle band at 52.93 is the first confirmation level for a strengthening trend.
Daily chart: The price is near the lower Bollinger Band at 42.08, and the MACD histogram bars are contracting, showing signs of short-term stabilization. However, the structure is hard to call improved until the price rises above both resistance levels at 48.17 and 50.10.
Long-term approach: Consider monitoring the 42.08–43.07 range in stages; pause adding to positions if the price falls below 39.25. Avoid taking heavy positions against the trend before it has recovered. For short-term trades, stick to the range and prioritize stop-losses.
Use the cycle outlook for spot trading and risk management for futures. Don’t let a short-term trade turn into a long-term hold.
#LTC
LTC is currently around 44.50, with a previous high of 74.99 and a previous low of 39.25. It is currently in the lower range following a pullback.
On the weekly chart, the price is below all EMA lines, and MACD is below the zero line, so the medium-term trend has yet to recover. The Bollinger middle band at 52.93 is the first confirmation level for a strengthening trend.
Daily chart: The price is near the lower Bollinger Band at 42.08, and the MACD histogram bars are contracting, showing signs of short-term stabilization. However, the structure is hard to call improved until the price rises above both resistance levels at 48.17 and 50.10.
Long-term approach: Consider monitoring the 42.08–43.07 range in stages; pause adding to positions if the price falls below 39.25. Avoid taking heavy positions against the trend before it has recovered. For short-term trades, stick to the range and prioritize stop-losses.
Use the cycle outlook for spot trading and risk management for futures. Don’t let a short-term trade turn into a long-term hold.
#LTC
7
2k
·
--
Bullish
$ZEC Zcash (ZEC) Long and Short Position Overview
The weekly chart remains intact, while the daily chart has yet to turn bullish. For now, price is ranging in a narrow band. Watch key levels first, then consider direction.
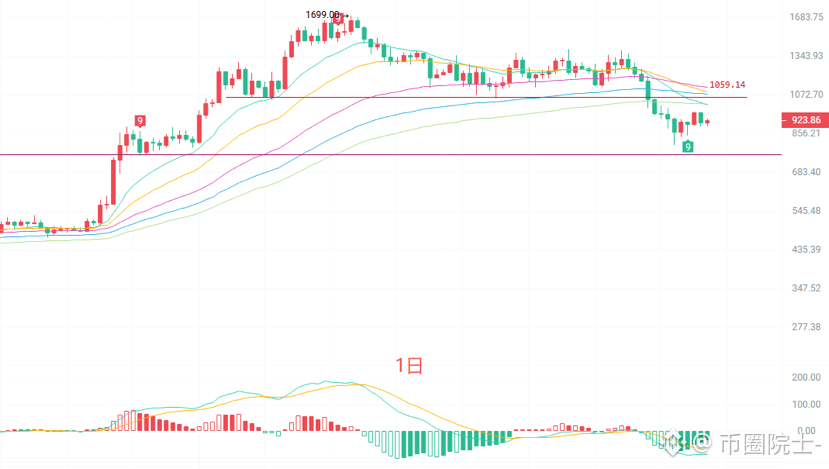
Weekly: Open 915, high 973, low 846, close 927, up 1.29% for the week, with a 13.86% range. Price is between EMA15 at 1042 and EMA30 at 871. The bullish MACD histogram is contracting but has not fully turned bearish. A sustained move above the Bollinger middle band at 970 would signal the pullback is over.
Daily: Open 913, high 931, low 893, close 926, up 1.46%. The 1012–1120 area is an overhead moving-average resistance band. The MACD histogram remains green, but momentum has eased somewhat. Whether price can recover 1012 is the key short-term point to watch.
Bullish: Scale in with small positions across the 893–846 support zone; place a stop below 835.
Bullish: Enter after price breaks above 1012–1018 and holds on a retest; targets: 1088 and 1120.
Bearish: Build a small position if momentum stalls in the 1018–1091 range; place a stop above 1125. Downside targets: 893, 846, and 772.
Trade less during consolidation and wait for the right levels. Set your stop before placing an order. For chart discussion only; this is not investment advice. Trade at your own risk.
{future}(ZECUSDT)
#ZEC/USDT
$ZEC Zcash (ZEC) Long and Short Position Overview
The weekly chart remains intact, while the daily chart has yet to turn bullish. For now, price is ranging in a narrow band. Watch key levels first, then consider direction.
Weekly: Open 915, high 973, low 846, close 927, up 1.29% for the week, with a 13.86% range. Price is between EMA15 at 1042 and EMA30 at 871. The bullish MACD histogram is contracting but has not fully turned bearish. A sustained move above the Bollinger middle band at 970 would signal the pullback is over.
Daily: Open 913, high 931, low 893, close 926, up 1.46%. The 1012–1120 area is an overhead moving-average resistance band. The MACD histogram remains green, but momentum has eased somewhat. Whether price can recover 1012 is the key short-term point to watch.
Bullish: Scale in with small positions across the 893–846 support zone; place a stop below 835.
Bullish: Enter after price breaks above 1012–1018 and holds on a retest; targets: 1088 and 1120.
Bearish: Build a small position if momentum stalls in the 1018–1091 range; place a stop above 1125. Downside targets: 893, 846, and 772.
Trade less during consolidation and wait for the right levels. Set your stop before placing an order. For chart discussion only; this is not investment advice. Trade at your own risk.
#ZEC/USDT
The weekly chart remains intact, while the daily chart has yet to turn bullish. For now, price is ranging in a narrow band. Watch key levels first, then consider direction.
Weekly: Open 915, high 973, low 846, close 927, up 1.29% for the week, with a 13.86% range. Price is between EMA15 at 1042 and EMA30 at 871. The bullish MACD histogram is contracting but has not fully turned bearish. A sustained move above the Bollinger middle band at 970 would signal the pullback is over.
Daily: Open 913, high 931, low 893, close 926, up 1.46%. The 1012–1120 area is an overhead moving-average resistance band. The MACD histogram remains green, but momentum has eased somewhat. Whether price can recover 1012 is the key short-term point to watch.
Bullish: Scale in with small positions across the 893–846 support zone; place a stop below 835.
Bullish: Enter after price breaks above 1012–1018 and holds on a retest; targets: 1088 and 1120.
Bearish: Build a small position if momentum stalls in the 1018–1091 range; place a stop above 1125. Downside targets: 893, 846, and 772.
Trade less during consolidation and wait for the right levels. Set your stop before placing an order. For chart discussion only; this is not investment advice. Trade at your own risk.
#ZEC/USDT
4
6
4.1k
·
--
Bullish
$DOGE After a sustained correction, DOGE has returned to the previous low-price range. Following short-term oversold conditions, a technical recovery could occur at any time. But it’s important to distinguish an oversold bounce from a trend reversal: whether the market can turn bullish depends on reclaiming key moving averages and whether volume picks up. Don’t panic-sell at the lows, but don’t blindly go all in trying to catch the bottom either. Enter in batches and set stop-losses.
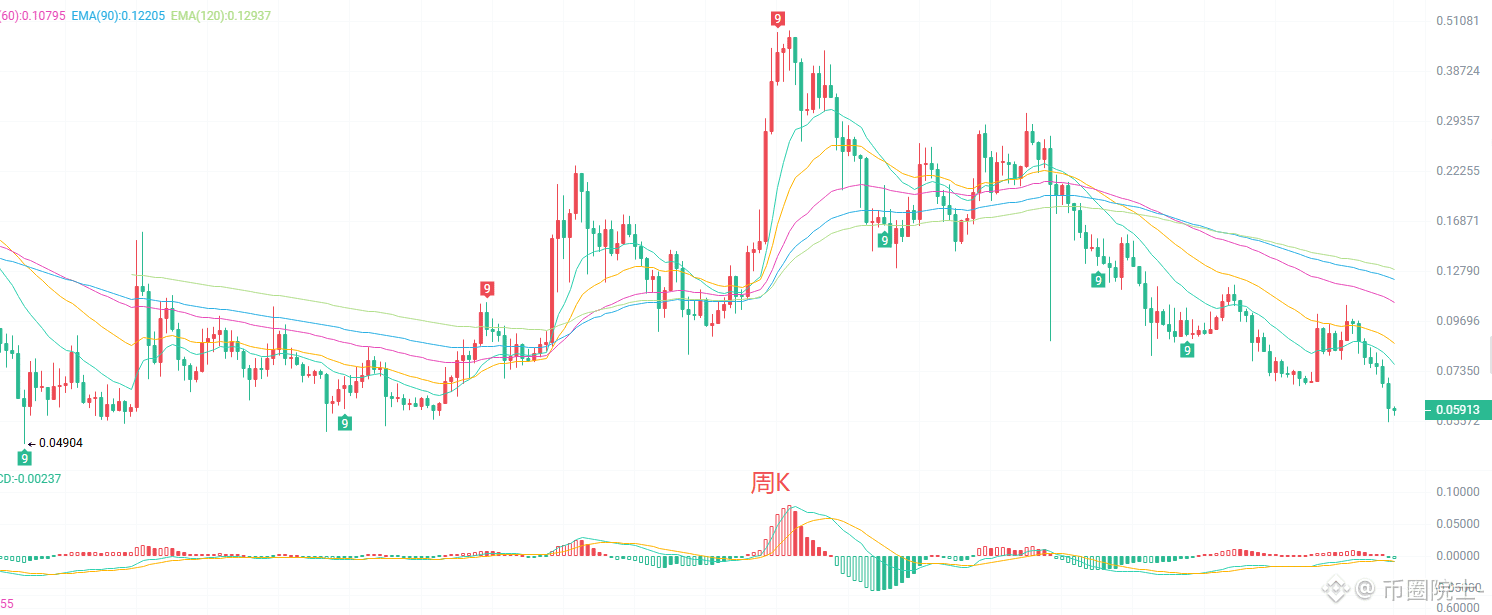
Weekly chart: closed at 0.05897, with a range of 0.05738—0.06042 this week and an amplitude of 5.08%. After retreating from its all-time high of 0.48468, the price remains in a major correction and is currently near the lower Bollinger Band at 0.05651. EMA15 at 0.07651, EMA30 at 0.08588, and EMA60 at 0.10794 remain overhead resistance, so the medium-term weekly trend has not yet turned stronger. The MACD lines are below the zero line, with the histogram at -0.00239, indicating continued low-level pressure. If the price stabilizes at these lows and volume increases, the weekly chart could recover; the first upside level to watch is 0.0765.
Daily chart: closed at 0.05893, ranging from 0.05812 to 0.05906 intraday, up 0.32%. After dipping to 0.05534, the price has consolidated in a narrow range at low levels, showing signs of short-term stabilization. However, EMA15 at 0.06437, EMA30 at 0.06966, and EMA60 at 0.07517 remain overhead. The MACD histogram is narrowing, with a possible low-level turn and recovery. The lower Bollinger Band is at 0.05465 and the middle band at 0.06759. For a rebound, first watch whether the price can hold above 0.0644, then challenge 0.0676.
Key levels to watch:
If the bulls hold the 0.0553—0.0565 support zone on a retest and a strong bullish candle appears with rising volume, consider a small long position, targeting 0.0644 and 0.0676, with a stop-loss below 0.0540.
Reassess adding to the position after price breaks above 0.0676. Before a rebound breaks through the middle band, the 0.0644—0.0676 resistance zone may offer a short-term short entry with a small position; set a stop-loss above 0.0700.
When looking for a rebound in a weak market, stay calm: a retest doesn’t mean the decline is over, and a bullish candle doesn’t mean the bull market is back. Think through the worst-case scenario first and set your stop-loss; let the market confirm the rest. Oversold conditions leave little room for error, and position size matters more than direction. Take it slowly—don’t get carried away.
{future}(DOGEUSDT)
#doge⚡
$DOGE After a sustained correction, DOGE has returned to the previous low-price range. Following short-term oversold conditions, a technical recovery could occur at any time. But it’s important to distinguish an oversold bounce from a trend reversal: whether the market can turn bullish depends on reclaiming key moving averages and whether volume picks up. Don’t panic-sell at the lows, but don’t blindly go all in trying to catch the bottom either. Enter in batches and set stop-losses.
Weekly chart: closed at 0.05897, with a range of 0.05738—0.06042 this week and an amplitude of 5.08%. After retreating from its all-time high of 0.48468, the price remains in a major correction and is currently near the lower Bollinger Band at 0.05651. EMA15 at 0.07651, EMA30 at 0.08588, and EMA60 at 0.10794 remain overhead resistance, so the medium-term weekly trend has not yet turned stronger. The MACD lines are below the zero line, with the histogram at -0.00239, indicating continued low-level pressure. If the price stabilizes at these lows and volume increases, the weekly chart could recover; the first upside level to watch is 0.0765.
Daily chart: closed at 0.05893, ranging from 0.05812 to 0.05906 intraday, up 0.32%. After dipping to 0.05534, the price has consolidated in a narrow range at low levels, showing signs of short-term stabilization. However, EMA15 at 0.06437, EMA30 at 0.06966, and EMA60 at 0.07517 remain overhead. The MACD histogram is narrowing, with a possible low-level turn and recovery. The lower Bollinger Band is at 0.05465 and the middle band at 0.06759. For a rebound, first watch whether the price can hold above 0.0644, then challenge 0.0676.
Key levels to watch:
If the bulls hold the 0.0553—0.0565 support zone on a retest and a strong bullish candle appears with rising volume, consider a small long position, targeting 0.0644 and 0.0676, with a stop-loss below 0.0540.
Reassess adding to the position after price breaks above 0.0676. Before a rebound breaks through the middle band, the 0.0644—0.0676 resistance zone may offer a short-term short entry with a small position; set a stop-loss above 0.0700.
When looking for a rebound in a weak market, stay calm: a retest doesn’t mean the decline is over, and a bullish candle doesn’t mean the bull market is back. Think through the worst-case scenario first and set your stop-loss; let the market confirm the rest. Oversold conditions leave little room for error, and position size matters more than direction. Take it slowly—don’t get carried away.
#doge⚡
Weekly chart: closed at 0.05897, with a range of 0.05738—0.06042 this week and an amplitude of 5.08%. After retreating from its all-time high of 0.48468, the price remains in a major correction and is currently near the lower Bollinger Band at 0.05651. EMA15 at 0.07651, EMA30 at 0.08588, and EMA60 at 0.10794 remain overhead resistance, so the medium-term weekly trend has not yet turned stronger. The MACD lines are below the zero line, with the histogram at -0.00239, indicating continued low-level pressure. If the price stabilizes at these lows and volume increases, the weekly chart could recover; the first upside level to watch is 0.0765.
Daily chart: closed at 0.05893, ranging from 0.05812 to 0.05906 intraday, up 0.32%. After dipping to 0.05534, the price has consolidated in a narrow range at low levels, showing signs of short-term stabilization. However, EMA15 at 0.06437, EMA30 at 0.06966, and EMA60 at 0.07517 remain overhead. The MACD histogram is narrowing, with a possible low-level turn and recovery. The lower Bollinger Band is at 0.05465 and the middle band at 0.06759. For a rebound, first watch whether the price can hold above 0.0644, then challenge 0.0676.
Key levels to watch:
If the bulls hold the 0.0553—0.0565 support zone on a retest and a strong bullish candle appears with rising volume, consider a small long position, targeting 0.0644 and 0.0676, with a stop-loss below 0.0540.
Reassess adding to the position after price breaks above 0.0676. Before a rebound breaks through the middle band, the 0.0644—0.0676 resistance zone may offer a short-term short entry with a small position; set a stop-loss above 0.0700.
When looking for a rebound in a weak market, stay calm: a retest doesn’t mean the decline is over, and a bullish candle doesn’t mean the bull market is back. Think through the worst-case scenario first and set your stop-loss; let the market confirm the rest. Oversold conditions leave little room for error, and position size matters more than direction. Take it slowly—don’t get carried away.
#doge⚡
6
2.2k
·
--
Bullish
$ETH Crypto Analyst: 11.19 Ethereum (ETH) Trend Has Not Strengthened, Momentum Has Not Run Its Course: The Safest Framework for Navigating Ethereum’s Current Market
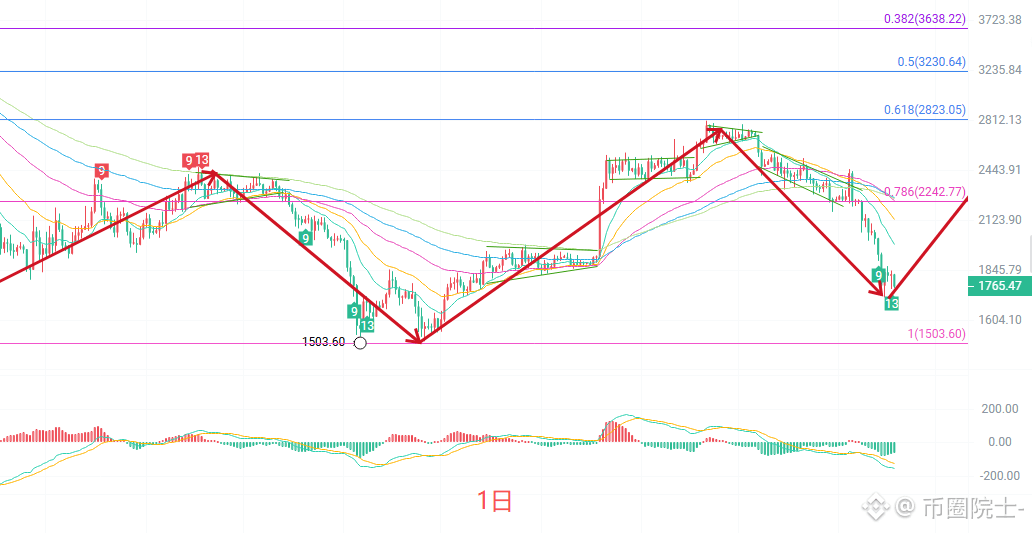
This pullback has been a long one for many people. The bulls keep hoping for a rebound, only to get trapped one after another; the bears have had it easier, but the further prices fall, the less willing they are to chase, afraid of stepping into an oversold-bounce trap. The price is now hovering around 1770, neither up nor down—the kind of situation that most easily provokes impulsive decisions. No pep talk here: let’s lay out the daily and four-hour charts, including where the moving averages are pressing, what stage the indicators are at, the support and resistance levels, how to choose between long and short positions, and where to place your stop-loss. Treat this as a pre-market checklist: assess the terrain before deciding whether to enter. I entered long at 1760 myself, and I’ve now set a stop-loss, so even if I’m wrong, that’s fine.
The daily candle is a solid bearish candle that cuts through the recent narrow consolidation range. As for the moving averages, the price is below all the five-day EMA levels, with the moving averages across time periods stacked overhead, a typical mid-term bearish alignment. The MACD histogram is still printing green bars, indicating bearish momentum. The Bollinger Bands are at 2088 for the middle band, 2481 for the upper band, and 1695 for the lower band; the price is now trading close to the lower band. Overall, the daily trend remains weak, but with the price near the lower band and a previous congestion zone, be alert for a technical rebound after a continued steep decline. Avoid blindly chasing shorts at low levels.
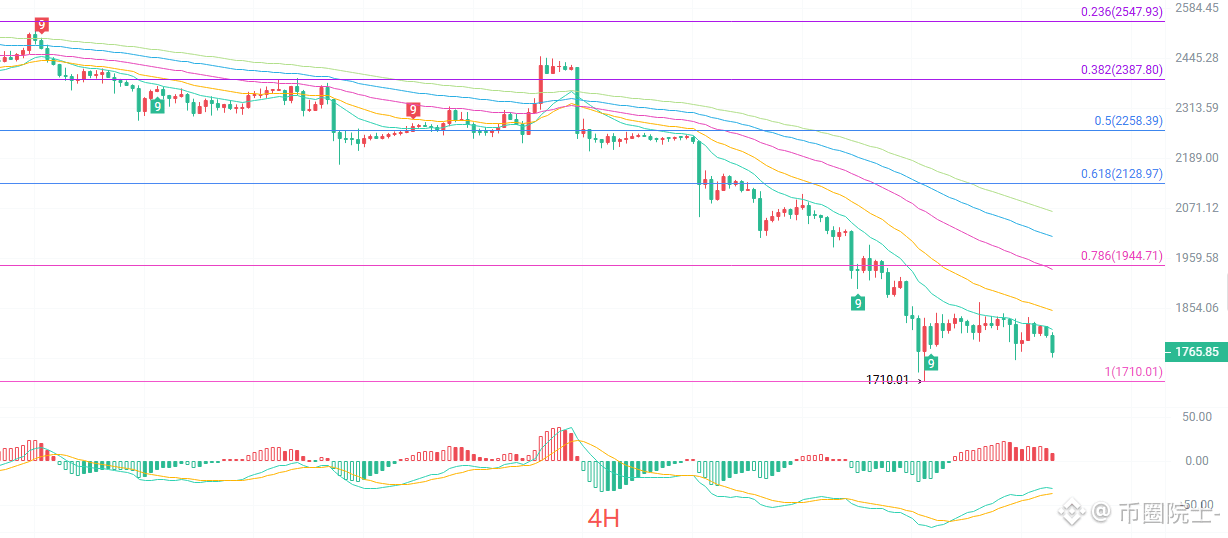
On the four-hour chart, the lower wick touched 1755 before the price recovered slightly. In terms of moving averages, the EMA15 at 1811 and EMA30 at 1799 are just above the current price, while the EMA60 at 1936, EMA90 at 2007, and EMA120 at 2064 are much higher, capping short-term rebound potential at successive levels. The MACD histogram’s green bars have contracted noticeably, and a bullish crossover is beginning to take shape at the lows, suggesting short-term selling pressure is easing. The Bollinger Bands are at 1814 for the middle band, 1846 for the upper band, and 1781 for the lower band; the current price has slipped slightly below the lower band. The previous low of 1710 is the bulls’ last line of short-term defense. Overall, this is a weak recovery within a downtrend: the decline is slowing, but the structure has not yet reversed.
Short-term reference:
Short / sell: 1800 to 1830 if momentum stalls; stop-loss 30 points; target 1770 to 1750.
Long / buy: 1760 to 1740 if the decline stalls; stop-loss 30 points; target 1800 to 1830.
Base specific trades on real-time order book data. For more information, contact the author. Articles are published with a delay and are for reference only; trade at your own risk.
{future}(ETHUSDT)
#ETH走势分析
$ETH Crypto Analyst: 11.19 Ethereum (ETH) Trend Has Not Strengthened, Momentum Has Not Run Its Course: The Safest Framework for Navigating Ethereum’s Current Market
This pullback has been a long one for many people. The bulls keep hoping for a rebound, only to get trapped one after another; the bears have had it easier, but the further prices fall, the less willing they are to chase, afraid of stepping into an oversold-bounce trap. The price is now hovering around 1770, neither up nor down—the kind of situation that most easily provokes impulsive decisions. No pep talk here: let’s lay out the daily and four-hour charts, including where the moving averages are pressing, what stage the indicators are at, the support and resistance levels, how to choose between long and short positions, and where to place your stop-loss. Treat this as a pre-market checklist: assess the terrain before deciding whether to enter. I entered long at 1760 myself, and I’ve now set a stop-loss, so even if I’m wrong, that’s fine.
The daily candle is a solid bearish candle that cuts through the recent narrow consolidation range. As for the moving averages, the price is below all the five-day EMA levels, with the moving averages across time periods stacked overhead, a typical mid-term bearish alignment. The MACD histogram is still printing green bars, indicating bearish momentum. The Bollinger Bands are at 2088 for the middle band, 2481 for the upper band, and 1695 for the lower band; the price is now trading close to the lower band. Overall, the daily trend remains weak, but with the price near the lower band and a previous congestion zone, be alert for a technical rebound after a continued steep decline. Avoid blindly chasing shorts at low levels.
On the four-hour chart, the lower wick touched 1755 before the price recovered slightly. In terms of moving averages, the EMA15 at 1811 and EMA30 at 1799 are just above the current price, while the EMA60 at 1936, EMA90 at 2007, and EMA120 at 2064 are much higher, capping short-term rebound potential at successive levels. The MACD histogram’s green bars have contracted noticeably, and a bullish crossover is beginning to take shape at the lows, suggesting short-term selling pressure is easing. The Bollinger Bands are at 1814 for the middle band, 1846 for the upper band, and 1781 for the lower band; the current price has slipped slightly below the lower band. The previous low of 1710 is the bulls’ last line of short-term defense. Overall, this is a weak recovery within a downtrend: the decline is slowing, but the structure has not yet reversed.
Short-term reference:
Short / sell: 1800 to 1830 if momentum stalls; stop-loss 30 points; target 1770 to 1750.
Long / buy: 1760 to 1740 if the decline stalls; stop-loss 30 points; target 1800 to 1830.
Base specific trades on real-time order book data. For more information, contact the author. Articles are published with a delay and are for reference only; trade at your own risk.
#ETH走势分析
This pullback has been a long one for many people. The bulls keep hoping for a rebound, only to get trapped one after another; the bears have had it easier, but the further prices fall, the less willing they are to chase, afraid of stepping into an oversold-bounce trap. The price is now hovering around 1770, neither up nor down—the kind of situation that most easily provokes impulsive decisions. No pep talk here: let’s lay out the daily and four-hour charts, including where the moving averages are pressing, what stage the indicators are at, the support and resistance levels, how to choose between long and short positions, and where to place your stop-loss. Treat this as a pre-market checklist: assess the terrain before deciding whether to enter. I entered long at 1760 myself, and I’ve now set a stop-loss, so even if I’m wrong, that’s fine.
The daily candle is a solid bearish candle that cuts through the recent narrow consolidation range. As for the moving averages, the price is below all the five-day EMA levels, with the moving averages across time periods stacked overhead, a typical mid-term bearish alignment. The MACD histogram is still printing green bars, indicating bearish momentum. The Bollinger Bands are at 2088 for the middle band, 2481 for the upper band, and 1695 for the lower band; the price is now trading close to the lower band. Overall, the daily trend remains weak, but with the price near the lower band and a previous congestion zone, be alert for a technical rebound after a continued steep decline. Avoid blindly chasing shorts at low levels.
On the four-hour chart, the lower wick touched 1755 before the price recovered slightly. In terms of moving averages, the EMA15 at 1811 and EMA30 at 1799 are just above the current price, while the EMA60 at 1936, EMA90 at 2007, and EMA120 at 2064 are much higher, capping short-term rebound potential at successive levels. The MACD histogram’s green bars have contracted noticeably, and a bullish crossover is beginning to take shape at the lows, suggesting short-term selling pressure is easing. The Bollinger Bands are at 1814 for the middle band, 1846 for the upper band, and 1781 for the lower band; the current price has slipped slightly below the lower band. The previous low of 1710 is the bulls’ last line of short-term defense. Overall, this is a weak recovery within a downtrend: the decline is slowing, but the structure has not yet reversed.
Short-term reference:
Short / sell: 1800 to 1830 if momentum stalls; stop-loss 30 points; target 1770 to 1750.
Long / buy: 1760 to 1740 if the decline stalls; stop-loss 30 points; target 1800 to 1830.
Base specific trades on real-time order book data. For more information, contact the author. Articles are published with a delay and are for reference only; trade at your own risk.
#ETH走势分析
1
7
8.3k
·
--
Bullish
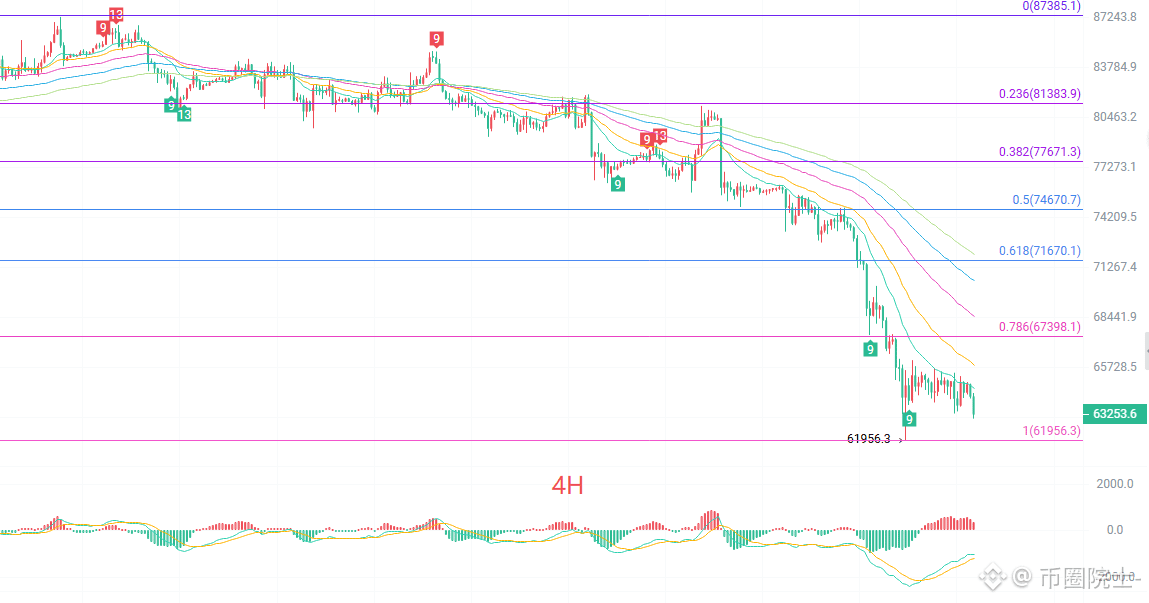
$BTC Crypto Market Academician: 11.19 Bitcoin (BTC)—the daily chart’s bearish moving-average alignment remains unchanged. Can a low-level four-hour golden cross end this decline?
After an oversold drop, it’s only natural to want to buy the dip. But a steep decline is never, by itself, a reason to buy; the structure needs to stabilize first. Right now, the four-hour green bars are narrowing, while the daily chart is still held down below the moving averages. This is a phase where both bulls and bears can trade, but neither has an easy time—and it’s especially easy to get caught on both sides. In this kind of market, I recommend reducing your trading frequency. It’s better to miss part of a rebound than to take a heavy directional position when signals are unclear. If you can’t stick to your stop-loss or get anxious as soon as you look at the chart, the best move is to wait on the sidelines for now. I’m doing the same
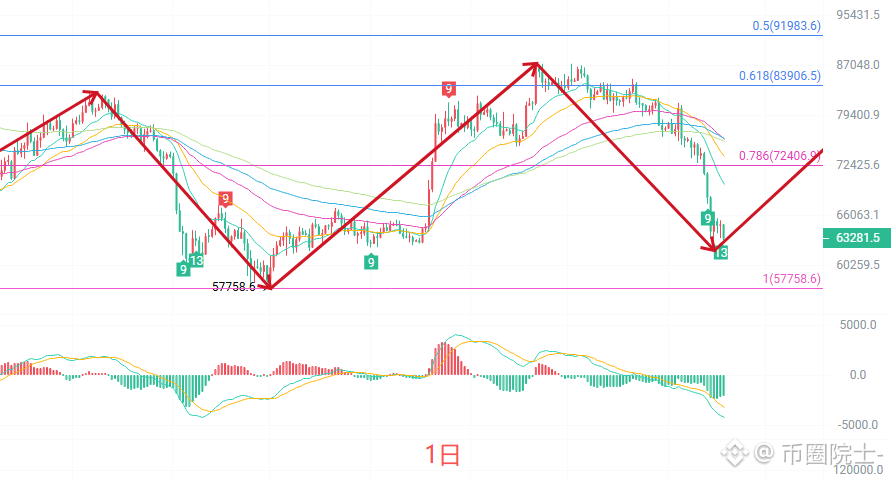
The daily K-line has pulled back from a rebound high around 81000, closing lower for several consecutive sessions. The latest daily candle has fallen below all short- and medium-term EMA lines, which are clearly aligned bearishly, with the price trading below them all. The MACD green bars continue to expand, so momentum remains bearish. After breaking below the Bollinger lower band at 62058, the price rebounded, but the bands as a whole are opening downward. The daily chart remains in a weak downtrend, with no clear signs yet that the rebound has stabilized.
The four-hour K-line made a small rebound after reaching a previous low of 61950, but the rebound has been limited. The price is still being pressed down by the five-period EMA, while the short-term moving averages are clustered overhead and pointing down—a typical weak consolidation after a decline. The MACD green bars show signs of narrowing, but no golden cross has formed yet. The Bollinger lower band is at 63694, with the price tracking along it; the middle band at 65547 is the first resistance above. The four-hour chart is still in a bottoming-out observation phase. Until a reversal structure emerges, treat any rebound as a weak bounce.
Short-term reference:
Short: 64500 to 65000 if momentum stalls; stop-loss 500 points; target 64000 to 63000.
Long: 62500 to 62000 if the decline finds support; stop-loss 500 points; target 63500 to 84500.
For specific trades, rely on real-time order-book data. For more information, you can contact the author. Articles are published with a delay and are for reference only; assume all risks yourself.
{future}(BTCUSDT)
#BTC走势分析
$BTC Crypto Market Academician: 11.19 Bitcoin (BTC)—the daily chart’s bearish moving-average alignment remains unchanged. Can a low-level four-hour golden cross end this decline?
After an oversold drop, it’s only natural to want to buy the dip. But a steep decline is never, by itself, a reason to buy; the structure needs to stabilize first. Right now, the four-hour green bars are narrowing, while the daily chart is still held down below the moving averages. This is a phase where both bulls and bears can trade, but neither has an easy time—and it’s especially easy to get caught on both sides. In this kind of market, I recommend reducing your trading frequency. It’s better to miss part of a rebound than to take a heavy directional position when signals are unclear. If you can’t stick to your stop-loss or get anxious as soon as you look at the chart, the best move is to wait on the sidelines for now. I’m doing the same
The daily K-line has pulled back from a rebound high around 81000, closing lower for several consecutive sessions. The latest daily candle has fallen below all short- and medium-term EMA lines, which are clearly aligned bearishly, with the price trading below them all. The MACD green bars continue to expand, so momentum remains bearish. After breaking below the Bollinger lower band at 62058, the price rebounded, but the bands as a whole are opening downward. The daily chart remains in a weak downtrend, with no clear signs yet that the rebound has stabilized.
The four-hour K-line made a small rebound after reaching a previous low of 61950, but the rebound has been limited. The price is still being pressed down by the five-period EMA, while the short-term moving averages are clustered overhead and pointing down—a typical weak consolidation after a decline. The MACD green bars show signs of narrowing, but no golden cross has formed yet. The Bollinger lower band is at 63694, with the price tracking along it; the middle band at 65547 is the first resistance above. The four-hour chart is still in a bottoming-out observation phase. Until a reversal structure emerges, treat any rebound as a weak bounce.
Short-term reference:
Short: 64500 to 65000 if momentum stalls; stop-loss 500 points; target 64000 to 63000.
Long: 62500 to 62000 if the decline finds support; stop-loss 500 points; target 63500 to 84500.
For specific trades, rely on real-time order-book data. For more information, you can contact the author. Articles are published with a delay and are for reference only; assume all risks yourself.
#BTC走势分析
After an oversold drop, it’s only natural to want to buy the dip. But a steep decline is never, by itself, a reason to buy; the structure needs to stabilize first. Right now, the four-hour green bars are narrowing, while the daily chart is still held down below the moving averages. This is a phase where both bulls and bears can trade, but neither has an easy time—and it’s especially easy to get caught on both sides. In this kind of market, I recommend reducing your trading frequency. It’s better to miss part of a rebound than to take a heavy directional position when signals are unclear. If you can’t stick to your stop-loss or get anxious as soon as you look at the chart, the best move is to wait on the sidelines for now. I’m doing the same
The daily K-line has pulled back from a rebound high around 81000, closing lower for several consecutive sessions. The latest daily candle has fallen below all short- and medium-term EMA lines, which are clearly aligned bearishly, with the price trading below them all. The MACD green bars continue to expand, so momentum remains bearish. After breaking below the Bollinger lower band at 62058, the price rebounded, but the bands as a whole are opening downward. The daily chart remains in a weak downtrend, with no clear signs yet that the rebound has stabilized.
The four-hour K-line made a small rebound after reaching a previous low of 61950, but the rebound has been limited. The price is still being pressed down by the five-period EMA, while the short-term moving averages are clustered overhead and pointing down—a typical weak consolidation after a decline. The MACD green bars show signs of narrowing, but no golden cross has formed yet. The Bollinger lower band is at 63694, with the price tracking along it; the middle band at 65547 is the first resistance above. The four-hour chart is still in a bottoming-out observation phase. Until a reversal structure emerges, treat any rebound as a weak bounce.
Short-term reference:
Short: 64500 to 65000 if momentum stalls; stop-loss 500 points; target 64000 to 63000.
Long: 62500 to 62000 if the decline finds support; stop-loss 500 points; target 63500 to 84500.
For specific trades, rely on real-time order-book data. For more information, you can contact the author. Articles are published with a delay and are for reference only; assume all risks yourself.
#BTC走势分析
6
4k
·
--
Bullish
$BTC BTC Market Notes: Current price 64,600. After reaching 63,500 overnight, price moved up to 65,000 before pulling back. How to trade this afternoon?
2-hour chart: After bottoming at 61,956, price staged a corrective rebound and briefly moved above EMA15, now at 64,195. However, EMA30 at 64,825 is acting as resistance overhead, while the medium- and long-term moving averages remain above price at 66,170–68,872. The medium-term downtrend is still intact. MACD has formed a bullish crossover below the zero line, suggesting there is room for the rebound to continue, but its strength is limited. The Bollinger Band range is 63,760–65,445, with the current price stuck below the middle band.
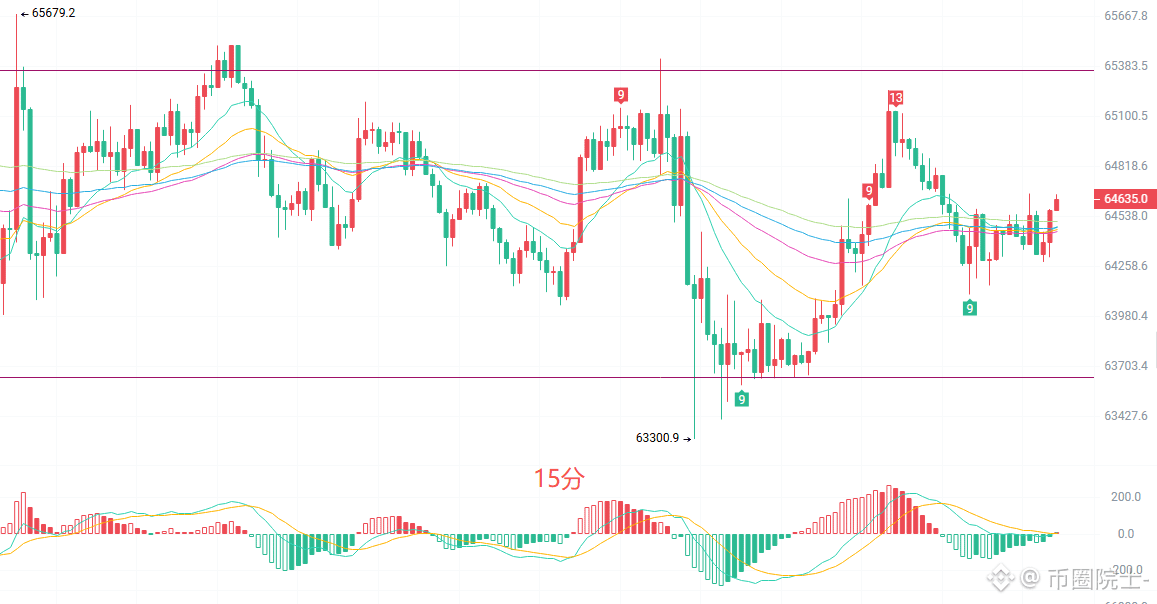
15-minute chart: Price is moving sideways within a 63,300–65,680 range. It has fallen back below the moving-average cluster at 64,439–64,507. MACD has turned negative, and the rebound is losing steam, suggesting weak consolidation in the short term.
Key levels to watch: Afternoon setup
Bullish: If price stabilizes at 64,150–64,200, look for a move higher. Stop-loss below 63,750; targets 64,750–65,100.
Bearish: If price is rejected at 64,750–64,830, look for a move lower. Stop-loss above 65,150; targets 64,200–63,760.
In a ranging market, key levels matter more than direction. This is for technical analysis purposes only and does not constitute investment advice. Trade at your own risk.
{future}(BTCUSDT)
#BTC走势分析
$BTC BTC Market Notes: Current price 64,600. After reaching 63,500 overnight, price moved up to 65,000 before pulling back. How to trade this afternoon?
2-hour chart: After bottoming at 61,956, price staged a corrective rebound and briefly moved above EMA15, now at 64,195. However, EMA30 at 64,825 is acting as resistance overhead, while the medium- and long-term moving averages remain above price at 66,170–68,872. The medium-term downtrend is still intact. MACD has formed a bullish crossover below the zero line, suggesting there is room for the rebound to continue, but its strength is limited. The Bollinger Band range is 63,760–65,445, with the current price stuck below the middle band.
15-minute chart: Price is moving sideways within a 63,300–65,680 range. It has fallen back below the moving-average cluster at 64,439–64,507. MACD has turned negative, and the rebound is losing steam, suggesting weak consolidation in the short term.
Key levels to watch: Afternoon setup
Bullish: If price stabilizes at 64,150–64,200, look for a move higher. Stop-loss below 63,750; targets 64,750–65,100.
Bearish: If price is rejected at 64,750–64,830, look for a move lower. Stop-loss above 65,150; targets 64,200–63,760.
In a ranging market, key levels matter more than direction. This is for technical analysis purposes only and does not constitute investment advice. Trade at your own risk.
#BTC走势分析
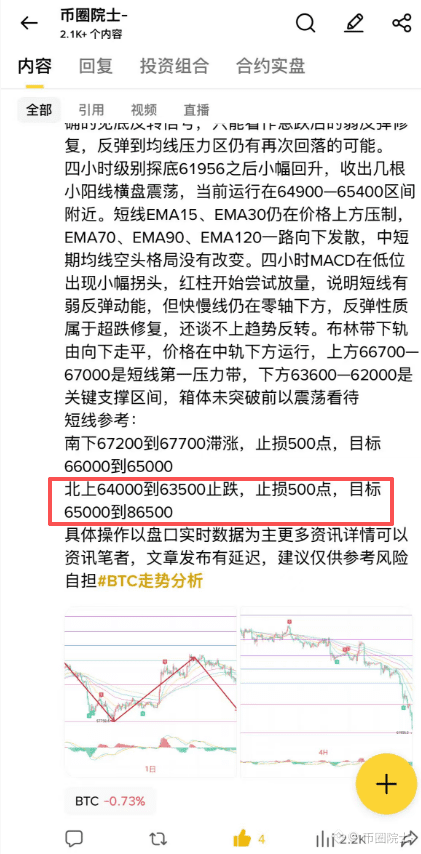
2-hour chart: After bottoming at 61,956, price staged a corrective rebound and briefly moved above EMA15, now at 64,195. However, EMA30 at 64,825 is acting as resistance overhead, while the medium- and long-term moving averages remain above price at 66,170–68,872. The medium-term downtrend is still intact. MACD has formed a bullish crossover below the zero line, suggesting there is room for the rebound to continue, but its strength is limited. The Bollinger Band range is 63,760–65,445, with the current price stuck below the middle band.
15-minute chart: Price is moving sideways within a 63,300–65,680 range. It has fallen back below the moving-average cluster at 64,439–64,507. MACD has turned negative, and the rebound is losing steam, suggesting weak consolidation in the short term.
Key levels to watch: Afternoon setup
Bullish: If price stabilizes at 64,150–64,200, look for a move higher. Stop-loss below 63,750; targets 64,750–65,100.
Bearish: If price is rejected at 64,750–64,830, look for a move lower. Stop-loss above 65,150; targets 64,200–63,760.
In a ranging market, key levels matter more than direction. This is for technical analysis purposes only and does not constitute investment advice. Trade at your own risk.
#BTC走势分析
1
2
9
3.3k
·
--
Bullish
$ETH At dawn, ETH surged north at 1770 and exited at 1820. Trade review
The point of a review isn’t to predict whether prices will rise or fall tomorrow, but to think clearly about what to do if they rise, what to do if they fall, and how much you could lose in the worst case. Plan first, execute second—that matters far more than coming up with excuses on the fly. I finished writing this review at dawn and was just about to post it when ETH dropped straight to 1750. My order to go long at 1770 was filled immediately. Some followers then said, “It’s over—the market’s crashing.”
I said: plan your trades before the market opens, and trade your plan while it’s open. In this range, execution is what matters most—follow through completely when the price reaches your level. Set a stop-loss, then leave the rest to time.
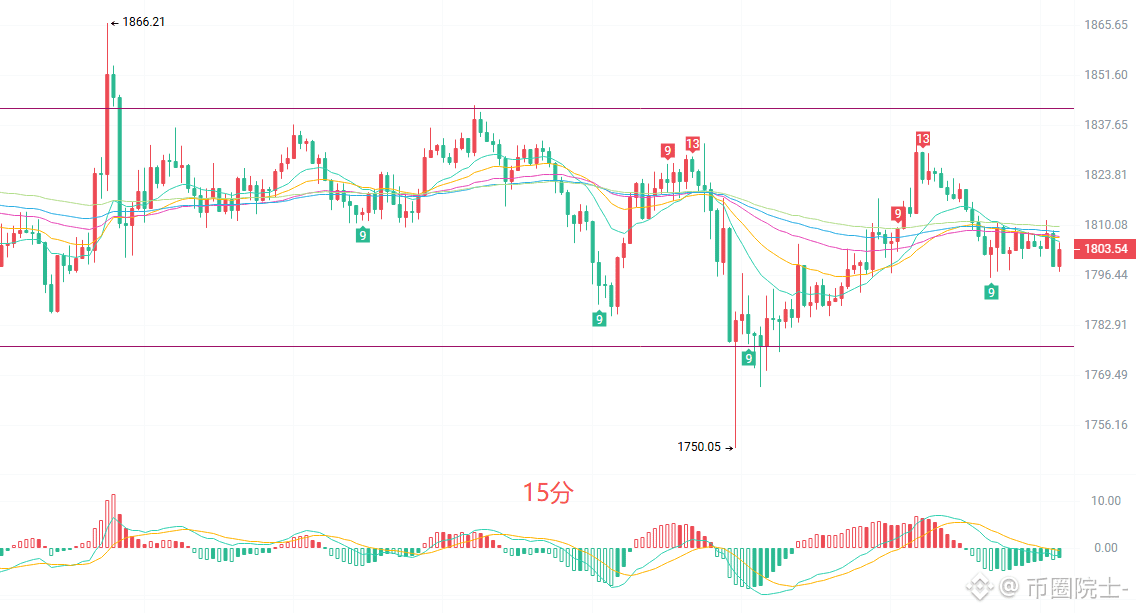
On the current chart, the short-, medium-, and long-term moving averages on the 2-hour timeframe are still overhead. MACD is flattening below the zero line. Bearish momentum has eased somewhat, but there’s no confirmed sign of a bullish rebound yet, so the overall picture is a weak recovery. Resistance is around 1814–1819, with support near 1785.
On the 15-minute chart, the moving averages across timeframes are tightly converged, and bullish and bearish costs are close. The market is building momentum ahead of a directional move. The MACD histogram’s green bars are growing again, suggesting short-term weakness. The Bollinger Bands are narrowing, so for now the range is 1795–1823.
Plan: pick up a little profit this afternoon.
Short near 1820–1830 on a rebound, with a stop-loss at 1840.
Go long near 1780–1770 on a pullback, with a stop-loss at 1760.
The larger timeframe is weak, while the smaller timeframe is range-bound, and direction remains unclear. Don’t bet heavily on a one-way move; set your stop-loss first. If you can’t make sense of the market, watch more and trade less. Staying out is also a trading decision.
{future}(ETHUSDT)
#ETH走势分析
$ETH At dawn, ETH surged north at 1770 and exited at 1820. Trade review
The point of a review isn’t to predict whether prices will rise or fall tomorrow, but to think clearly about what to do if they rise, what to do if they fall, and how much you could lose in the worst case. Plan first, execute second—that matters far more than coming up with excuses on the fly. I finished writing this review at dawn and was just about to post it when ETH dropped straight to 1750. My order to go long at 1770 was filled immediately. Some followers then said, “It’s over—the market’s crashing.”
I said: plan your trades before the market opens, and trade your plan while it’s open. In this range, execution is what matters most—follow through completely when the price reaches your level. Set a stop-loss, then leave the rest to time.
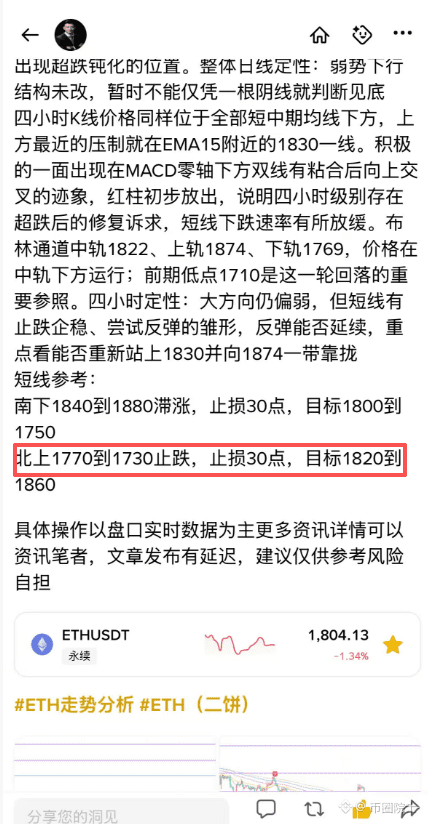
On the current chart, the short-, medium-, and long-term moving averages on the 2-hour timeframe are still overhead. MACD is flattening below the zero line. Bearish momentum has eased somewhat, but there’s no confirmed sign of a bullish rebound yet, so the overall picture is a weak recovery. Resistance is around 1814–1819, with support near 1785.
On the 15-minute chart, the moving averages across timeframes are tightly converged, and bullish and bearish costs are close. The market is building momentum ahead of a directional move. The MACD histogram’s green bars are growing again, suggesting short-term weakness. The Bollinger Bands are narrowing, so for now the range is 1795–1823.
Plan: pick up a little profit this afternoon.
Short near 1820–1830 on a rebound, with a stop-loss at 1840.
Go long near 1780–1770 on a pullback, with a stop-loss at 1760.
The larger timeframe is weak, while the smaller timeframe is range-bound, and direction remains unclear. Don’t bet heavily on a one-way move; set your stop-loss first. If you can’t make sense of the market, watch more and trade less. Staying out is also a trading decision.
#ETH走势分析
The point of a review isn’t to predict whether prices will rise or fall tomorrow, but to think clearly about what to do if they rise, what to do if they fall, and how much you could lose in the worst case. Plan first, execute second—that matters far more than coming up with excuses on the fly. I finished writing this review at dawn and was just about to post it when ETH dropped straight to 1750. My order to go long at 1770 was filled immediately. Some followers then said, “It’s over—the market’s crashing.”
I said: plan your trades before the market opens, and trade your plan while it’s open. In this range, execution is what matters most—follow through completely when the price reaches your level. Set a stop-loss, then leave the rest to time.
On the current chart, the short-, medium-, and long-term moving averages on the 2-hour timeframe are still overhead. MACD is flattening below the zero line. Bearish momentum has eased somewhat, but there’s no confirmed sign of a bullish rebound yet, so the overall picture is a weak recovery. Resistance is around 1814–1819, with support near 1785.
On the 15-minute chart, the moving averages across timeframes are tightly converged, and bullish and bearish costs are close. The market is building momentum ahead of a directional move. The MACD histogram’s green bars are growing again, suggesting short-term weakness. The Bollinger Bands are narrowing, so for now the range is 1795–1823.
Plan: pick up a little profit this afternoon.
Short near 1820–1830 on a rebound, with a stop-loss at 1840.
Go long near 1780–1770 on a pullback, with a stop-loss at 1760.
The larger timeframe is weak, while the smaller timeframe is range-bound, and direction remains unclear. Don’t bet heavily on a one-way move; set your stop-loss first. If you can’t make sense of the market, watch more and trade less. Staying out is also a trading decision.
#ETH走势分析
1
7
1.9k
·
--
Bullish
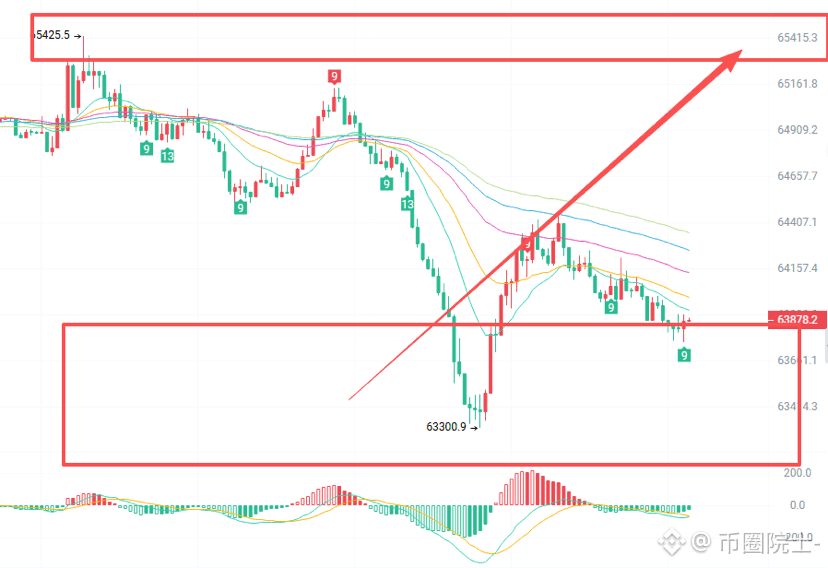
$BTC Ride the northbound short-term trend
{future}(BTCUSDT)
$BTC Ride the northbound short-term trend
7
1.4k
·
--
Bullish
$BTC Crypto Academician: 11.18 Bitcoin (BTC) Daily Chart Bearish, Four-Hour Weak Rebound: Behind the Divergence Between Longer and Shorter Timeframes, How Is Capital Positioning Itself?
Market volatility is normal; rises and falls never last forever. The most common mistake beginners make is trading based on their emotions: panicking when prices drop and getting excited when they rise. First, work out how much you can afford to lose, keep your position size small, and leave yourself some room to maneuver. It is safer to stay out of a market you don’t understand than to force yourself into a trade. When reviewing your trades, focus on price levels and rules, not stories of overnight riches from other people. Take it slowly: first learn how to avoid major losses, then think about how to make money.
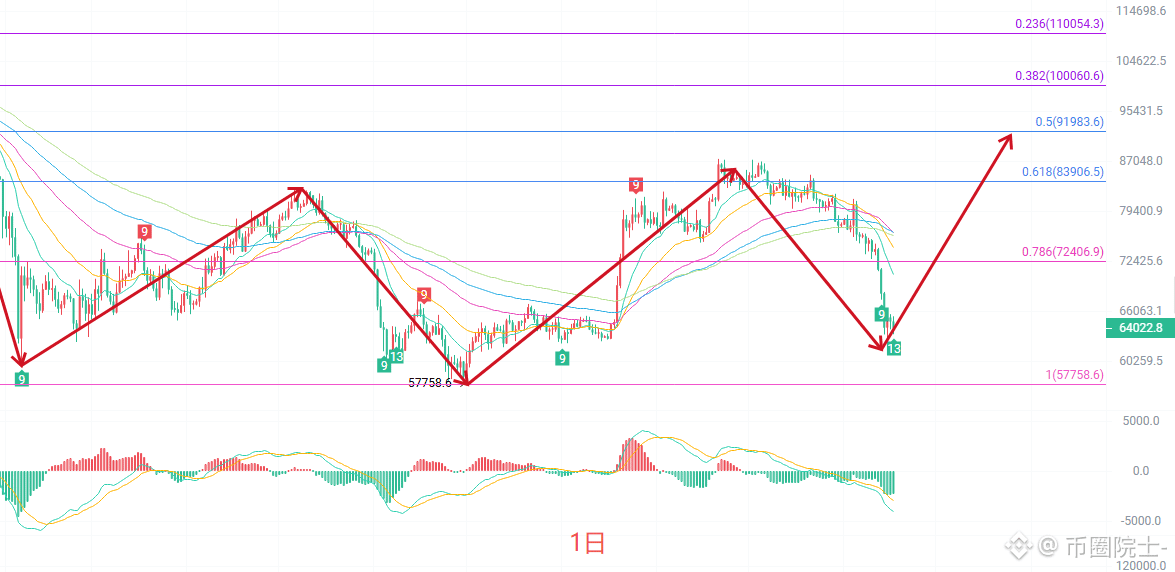
On the daily chart, consecutive bearish candles have formed. The price dipped to around 61956 before recovering slightly and is now consolidating near 65000. It has fallen below the short- and medium-term EMA cluster, with the 15-day, 30-day, and 60-day moving averages all aligned bearishly and pointing down. Overall, the daily chart remains in a downtrend. The MACD lines are below the zero line and opening downward, while the green histogram bars continue to grow, indicating that medium-term selling pressure has not yet fully eased. The price has touched the lower Bollinger Band, and the bands are expanding downward, so the short-term bearish trend remains dominant. There is currently no clear bottoming or reversal signal on the daily timeframe. This can only be viewed as a weak rebound following a sharp drop, and the price could fall again after rebounding into the moving-average resistance zone.
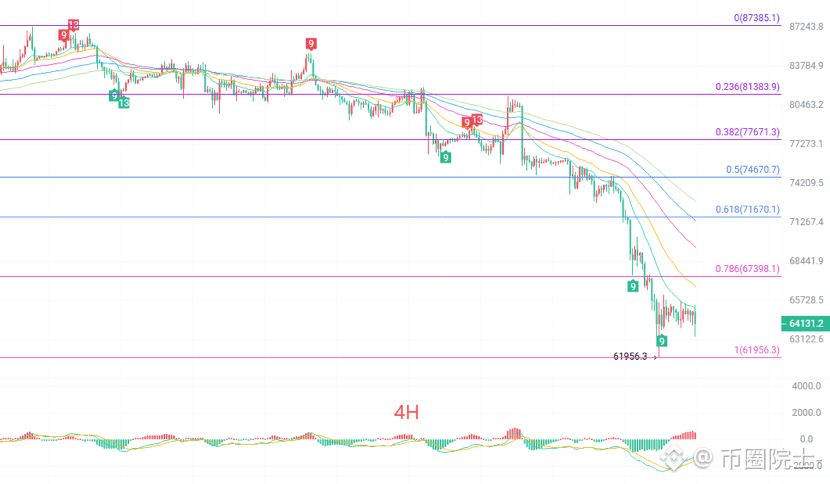
On the four-hour chart, the price recovered slightly after bottoming at 61956, forming several small bullish candles and moving sideways. It is currently trading around the 64900–65400 range. The short-term EMA15 and EMA30 are still acting as resistance above the price, while EMA70, EMA90, and EMA120 are all diverging downward. The bearish structure of the short- and medium-term moving averages remains unchanged. The four-hour MACD has turned up slightly from a low level, and the red histogram bars are starting to expand, indicating some potential for a weak short-term rebound. However, the MACD lines remain below the zero line, so this rebound is an oversold correction rather than a trend reversal. The lower Bollinger Band has flattened after moving down, and the price is trading below the middle band. The first short-term resistance zone is 66700–67000, while 63600–62000 is a key support range. Treat the market as range-bound until the price breaks out of this box.
Short-term reference:
Short (sell): if the price rises to 67200–67700 and stalls, stop loss at 500 points, targets 66000–65000.
Long (buy): if the price falls to 64000–63500 and finds support, stop loss at 500 points, targets 65000–86500.
Actual trading decisions should be based on real-time order book data. For more information, contact the author. Articles may be published with a delay. This is for reference only; trade at your own risk.
{future}(BTCUSDT)
#BTC走势分析
$BTC Crypto Academician: 11.18 Bitcoin (BTC) Daily Chart Bearish, Four-Hour Weak Rebound: Behind the Divergence Between Longer and Shorter Timeframes, How Is Capital Positioning Itself?
Market volatility is normal; rises and falls never last forever. The most common mistake beginners make is trading based on their emotions: panicking when prices drop and getting excited when they rise. First, work out how much you can afford to lose, keep your position size small, and leave yourself some room to maneuver. It is safer to stay out of a market you don’t understand than to force yourself into a trade. When reviewing your trades, focus on price levels and rules, not stories of overnight riches from other people. Take it slowly: first learn how to avoid major losses, then think about how to make money.
On the daily chart, consecutive bearish candles have formed. The price dipped to around 61956 before recovering slightly and is now consolidating near 65000. It has fallen below the short- and medium-term EMA cluster, with the 15-day, 30-day, and 60-day moving averages all aligned bearishly and pointing down. Overall, the daily chart remains in a downtrend. The MACD lines are below the zero line and opening downward, while the green histogram bars continue to grow, indicating that medium-term selling pressure has not yet fully eased. The price has touched the lower Bollinger Band, and the bands are expanding downward, so the short-term bearish trend remains dominant. There is currently no clear bottoming or reversal signal on the daily timeframe. This can only be viewed as a weak rebound following a sharp drop, and the price could fall again after rebounding into the moving-average resistance zone.
On the four-hour chart, the price recovered slightly after bottoming at 61956, forming several small bullish candles and moving sideways. It is currently trading around the 64900–65400 range. The short-term EMA15 and EMA30 are still acting as resistance above the price, while EMA70, EMA90, and EMA120 are all diverging downward. The bearish structure of the short- and medium-term moving averages remains unchanged. The four-hour MACD has turned up slightly from a low level, and the red histogram bars are starting to expand, indicating some potential for a weak short-term rebound. However, the MACD lines remain below the zero line, so this rebound is an oversold correction rather than a trend reversal. The lower Bollinger Band has flattened after moving down, and the price is trading below the middle band. The first short-term resistance zone is 66700–67000, while 63600–62000 is a key support range. Treat the market as range-bound until the price breaks out of this box.
Short-term reference:
Short (sell): if the price rises to 67200–67700 and stalls, stop loss at 500 points, targets 66000–65000.
Long (buy): if the price falls to 64000–63500 and finds support, stop loss at 500 points, targets 65000–86500.
Actual trading decisions should be based on real-time order book data. For more information, contact the author. Articles may be published with a delay. This is for reference only; trade at your own risk.
#BTC走势分析
Market volatility is normal; rises and falls never last forever. The most common mistake beginners make is trading based on their emotions: panicking when prices drop and getting excited when they rise. First, work out how much you can afford to lose, keep your position size small, and leave yourself some room to maneuver. It is safer to stay out of a market you don’t understand than to force yourself into a trade. When reviewing your trades, focus on price levels and rules, not stories of overnight riches from other people. Take it slowly: first learn how to avoid major losses, then think about how to make money.
On the daily chart, consecutive bearish candles have formed. The price dipped to around 61956 before recovering slightly and is now consolidating near 65000. It has fallen below the short- and medium-term EMA cluster, with the 15-day, 30-day, and 60-day moving averages all aligned bearishly and pointing down. Overall, the daily chart remains in a downtrend. The MACD lines are below the zero line and opening downward, while the green histogram bars continue to grow, indicating that medium-term selling pressure has not yet fully eased. The price has touched the lower Bollinger Band, and the bands are expanding downward, so the short-term bearish trend remains dominant. There is currently no clear bottoming or reversal signal on the daily timeframe. This can only be viewed as a weak rebound following a sharp drop, and the price could fall again after rebounding into the moving-average resistance zone.
On the four-hour chart, the price recovered slightly after bottoming at 61956, forming several small bullish candles and moving sideways. It is currently trading around the 64900–65400 range. The short-term EMA15 and EMA30 are still acting as resistance above the price, while EMA70, EMA90, and EMA120 are all diverging downward. The bearish structure of the short- and medium-term moving averages remains unchanged. The four-hour MACD has turned up slightly from a low level, and the red histogram bars are starting to expand, indicating some potential for a weak short-term rebound. However, the MACD lines remain below the zero line, so this rebound is an oversold correction rather than a trend reversal. The lower Bollinger Band has flattened after moving down, and the price is trading below the middle band. The first short-term resistance zone is 66700–67000, while 63600–62000 is a key support range. Treat the market as range-bound until the price breaks out of this box.
Short-term reference:
Short (sell): if the price rises to 67200–67700 and stalls, stop loss at 500 points, targets 66000–65000.
Long (buy): if the price falls to 64000–63500 and finds support, stop loss at 500 points, targets 65000–86500.
Actual trading decisions should be based on real-time order book data. For more information, contact the author. Articles may be published with a delay. This is for reference only; trade at your own risk.
#BTC走势分析
6
2.3k
·
--
Bullish
$ETH Crypto Academician: Nov. 18 Ethereum (ETH)—Is a rebound imminent, or is this a dead-cat bounce trap? Is the golden cross below the zero line worth trusting?
A few notes from the review: First, with the daily chart in a bearish trend, golden crosses and rebounds on the four-hour chart should be viewed with caution; a rebound does not mean a reversal. Second, prices near the lower Bollinger Band may see a technical bounce, or they may continue moving down along the lower band; the channel position alone does not indicate direction. Third, a high TD count is a reminder to watch for momentum exhaustion, not a guarantee that a bottom is in. A trading plan should first lay out both bullish and bearish scenarios with their corresponding stop-losses, then wait for price to reach confirmation levels.
On the daily candlestick chart, the price is below all five moving averages, and the medium- and long-term averages are clearly bearishly aligned. Any rebound will encounter resistance from these averages in succession. The MACD lines are below the zero line, and the histogram is still printing green bars, indicating that bearish momentum on the daily chart has not fully run its course. The Bollinger Bands are at 2111 (middle), 2485 (upper), and 1737 (lower), with the price now near the lower band. The TD count has reached 13. The short-term decline has continued, but this is also a level where we should watch for signs of oversold momentum exhaustion. Overall daily assessment: the weak downtrend remains intact; a single bearish candle is not enough to conclude that a bottom is in.
On the four-hour chart, the price is also below all short- and medium-term moving averages. The nearest resistance overhead is around 1830, near the EMA15. One positive sign is that the MACD lines below the zero line appear to be converging and turning upward, with the first red bars emerging. This suggests the four-hour chart may be attempting a corrective rebound after becoming oversold, and the short-term rate of decline has slowed. The Bollinger Bands are at 1822 (middle), 1874 (upper), and 1769 (lower), with the price below the middle band. The previous low of 1710 is an important reference point for this pullback. Four-hour assessment: the broader direction remains weak, but there are early signs of the decline stabilizing and a rebound attempt taking shape. Whether the rebound can continue will depend largely on whether the price can reclaim 1830 and move toward 1874.
Short-term reference:
Short: if the price stalls between 1840 and 1880, stop-loss at 30 points; target 1800 to 1750.
Long: if the price finds support between 1770 and 1730, stop-loss at 30 points; target 1820 to 1860.
For specific trades, rely primarily on real-time order book data. For more information, feel free to contact the author. There may be a delay in publication; this is for reference only, and you assume all risk.
{future}(ETHUSDT)
#ETH走势分析 #ETH(二饼)
$ETH Crypto Academician: Nov. 18 Ethereum (ETH)—Is a rebound imminent, or is this a dead-cat bounce trap? Is the golden cross below the zero line worth trusting?
A few notes from the review: First, with the daily chart in a bearish trend, golden crosses and rebounds on the four-hour chart should be viewed with caution; a rebound does not mean a reversal. Second, prices near the lower Bollinger Band may see a technical bounce, or they may continue moving down along the lower band; the channel position alone does not indicate direction. Third, a high TD count is a reminder to watch for momentum exhaustion, not a guarantee that a bottom is in. A trading plan should first lay out both bullish and bearish scenarios with their corresponding stop-losses, then wait for price to reach confirmation levels.
On the daily candlestick chart, the price is below all five moving averages, and the medium- and long-term averages are clearly bearishly aligned. Any rebound will encounter resistance from these averages in succession. The MACD lines are below the zero line, and the histogram is still printing green bars, indicating that bearish momentum on the daily chart has not fully run its course. The Bollinger Bands are at 2111 (middle), 2485 (upper), and 1737 (lower), with the price now near the lower band. The TD count has reached 13. The short-term decline has continued, but this is also a level where we should watch for signs of oversold momentum exhaustion. Overall daily assessment: the weak downtrend remains intact; a single bearish candle is not enough to conclude that a bottom is in.
On the four-hour chart, the price is also below all short- and medium-term moving averages. The nearest resistance overhead is around 1830, near the EMA15. One positive sign is that the MACD lines below the zero line appear to be converging and turning upward, with the first red bars emerging. This suggests the four-hour chart may be attempting a corrective rebound after becoming oversold, and the short-term rate of decline has slowed. The Bollinger Bands are at 1822 (middle), 1874 (upper), and 1769 (lower), with the price below the middle band. The previous low of 1710 is an important reference point for this pullback. Four-hour assessment: the broader direction remains weak, but there are early signs of the decline stabilizing and a rebound attempt taking shape. Whether the rebound can continue will depend largely on whether the price can reclaim 1830 and move toward 1874.
Short-term reference:
Short: if the price stalls between 1840 and 1880, stop-loss at 30 points; target 1800 to 1750.
Long: if the price finds support between 1770 and 1730, stop-loss at 30 points; target 1820 to 1860.
For specific trades, rely primarily on real-time order book data. For more information, feel free to contact the author. There may be a delay in publication; this is for reference only, and you assume all risk.
#ETH走势分析 #ETH(二饼)
A few notes from the review: First, with the daily chart in a bearish trend, golden crosses and rebounds on the four-hour chart should be viewed with caution; a rebound does not mean a reversal. Second, prices near the lower Bollinger Band may see a technical bounce, or they may continue moving down along the lower band; the channel position alone does not indicate direction. Third, a high TD count is a reminder to watch for momentum exhaustion, not a guarantee that a bottom is in. A trading plan should first lay out both bullish and bearish scenarios with their corresponding stop-losses, then wait for price to reach confirmation levels.
On the daily candlestick chart, the price is below all five moving averages, and the medium- and long-term averages are clearly bearishly aligned. Any rebound will encounter resistance from these averages in succession. The MACD lines are below the zero line, and the histogram is still printing green bars, indicating that bearish momentum on the daily chart has not fully run its course. The Bollinger Bands are at 2111 (middle), 2485 (upper), and 1737 (lower), with the price now near the lower band. The TD count has reached 13. The short-term decline has continued, but this is also a level where we should watch for signs of oversold momentum exhaustion. Overall daily assessment: the weak downtrend remains intact; a single bearish candle is not enough to conclude that a bottom is in.
On the four-hour chart, the price is also below all short- and medium-term moving averages. The nearest resistance overhead is around 1830, near the EMA15. One positive sign is that the MACD lines below the zero line appear to be converging and turning upward, with the first red bars emerging. This suggests the four-hour chart may be attempting a corrective rebound after becoming oversold, and the short-term rate of decline has slowed. The Bollinger Bands are at 1822 (middle), 1874 (upper), and 1769 (lower), with the price below the middle band. The previous low of 1710 is an important reference point for this pullback. Four-hour assessment: the broader direction remains weak, but there are early signs of the decline stabilizing and a rebound attempt taking shape. Whether the rebound can continue will depend largely on whether the price can reclaim 1830 and move toward 1874.
Short-term reference:
Short: if the price stalls between 1840 and 1880, stop-loss at 30 points; target 1800 to 1750.
Long: if the price finds support between 1770 and 1730, stop-loss at 30 points; target 1820 to 1860.
For specific trades, rely primarily on real-time order book data. For more information, feel free to contact the author. There may be a delay in publication; this is for reference only, and you assume all risk.
#ETH走势分析 #ETH(二饼)
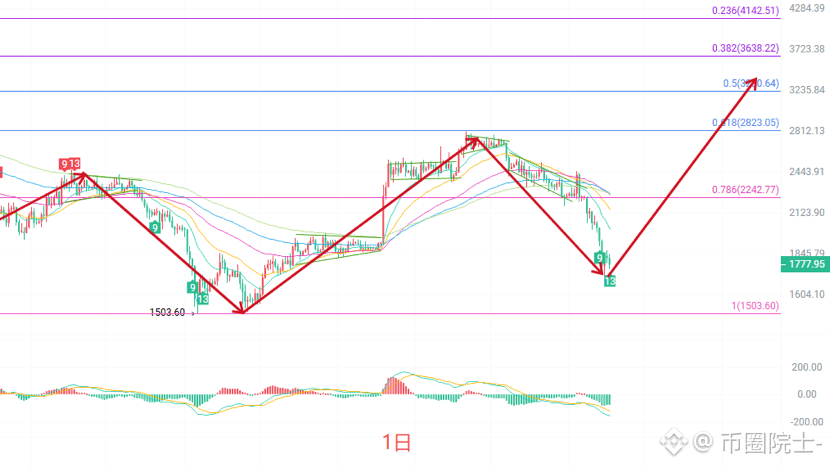
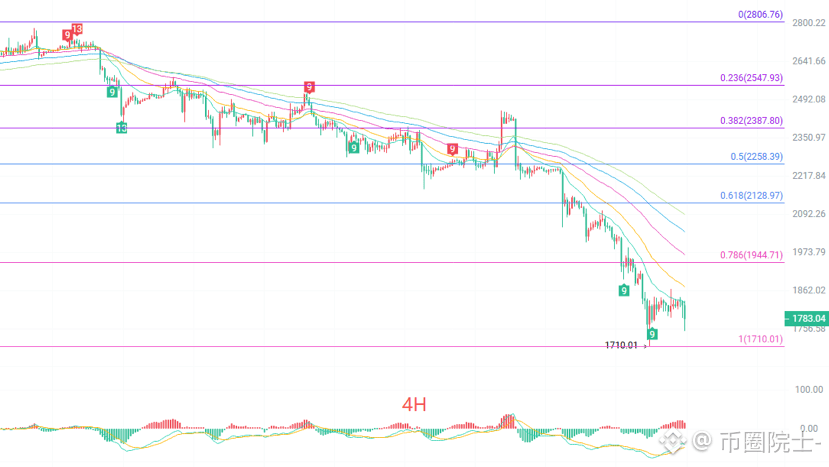
7
3.4k
·
--
Bullish
$ETH Crypto Academician: 11.17 Ethereum (ETH) Rebound Is a Window to Reduce Losses, Not a Reason to Chase the Price: The Trading Principle Most Easily Overlooked in a Weak, Choppy Market
The first step of the spot-market plan remains unchanged; the second step is at 1500. Short-term contract traders have only two questions: can the rebound be chased, and can the pullback be bought? Those trapped at higher levels are waiting to break even, while those on the sidelines are waiting for an entry. Bulls and bears keep pulling prices back and forth at this level. In a choppy market, the biggest mistake is trading on instinct: call it a reversal after a small rise, call it a collapse after a small drop, and end up getting burned both ways. Let’s get straight to the essentials: first read the daily chart to determine the overall direction, then switch to the four-hour chart to find the rhythm, and finally lay out the trigger zones, stop-loss levels, and targets for both long and short positions.
On the daily chart, price is below the EMAs for all periods, including EMA15 at 2049, EMA30 at 2176, and EMA60 at 2276. The short- and medium-term moving averages are bearishly aligned, and the daily trend remains weak. On the MACD, both lines are below the zero axis, with no clear reversal in momentum yet. The Bollinger Bands have a middle band at 2139, an upper band at 2499, and a lower band at 1779. Price is moving near the lower band, indicating a range-bound market in a weak zone. The previous low of 1503 remains a long-term reference below; in the short term, watch whether the 1779 level holds. No reversal pattern is visible on the daily chart for now, so the rebound is better characterized as a weak recovery.
On the four-hour chart, the EMAs are at 1842 for EMA15, 1901 for EMA30, and 1999 for EMA60. Price is below the short-term moving averages, while the medium-term averages continue to exert downward pressure; the rebound has not yet reversed their alignment. The MACD is in a low zone, with the two lines showing signs of converging and attempting to turn upward. This is an initial recovery signal after oversold conditions, but a bullish crossover has not yet been confirmed. The Bollinger Bands have a middle band at 1853, an upper band at 1965, and a lower band at 1741. Price is fluctuating between the middle and lower bands, and the range has yet to break. A TD Sequential 9 count has appeared in the lower zone, so repeated bottom-building is possible in the short term. First watch whether price can reclaim 1842–1854; below, monitor the two support levels at 1786 and 1741.
Short-term reference:
If price rises into 1840–1880 and stalls, set a 30-point stop loss; target 1850–1800, with 1750 in view if support breaks.
If price falls into 1780–1740 and holds, set a 30-point stop loss; target 1820–1860, with 1930 in view if resistance breaks.
For specific trades, prioritize real-time order-book data. For more information, you can contact the author. This article was published with a delay and is for reference only; trade at your own risk.
{future}(ETHUSDT)
#ETH走势分析
$ETH Crypto Academician: 11.17 Ethereum (ETH) Rebound Is a Window to Reduce Losses, Not a Reason to Chase the Price: The Trading Principle Most Easily Overlooked in a Weak, Choppy Market
The first step of the spot-market plan remains unchanged; the second step is at 1500. Short-term contract traders have only two questions: can the rebound be chased, and can the pullback be bought? Those trapped at higher levels are waiting to break even, while those on the sidelines are waiting for an entry. Bulls and bears keep pulling prices back and forth at this level. In a choppy market, the biggest mistake is trading on instinct: call it a reversal after a small rise, call it a collapse after a small drop, and end up getting burned both ways. Let’s get straight to the essentials: first read the daily chart to determine the overall direction, then switch to the four-hour chart to find the rhythm, and finally lay out the trigger zones, stop-loss levels, and targets for both long and short positions.
On the daily chart, price is below the EMAs for all periods, including EMA15 at 2049, EMA30 at 2176, and EMA60 at 2276. The short- and medium-term moving averages are bearishly aligned, and the daily trend remains weak. On the MACD, both lines are below the zero axis, with no clear reversal in momentum yet. The Bollinger Bands have a middle band at 2139, an upper band at 2499, and a lower band at 1779. Price is moving near the lower band, indicating a range-bound market in a weak zone. The previous low of 1503 remains a long-term reference below; in the short term, watch whether the 1779 level holds. No reversal pattern is visible on the daily chart for now, so the rebound is better characterized as a weak recovery.
On the four-hour chart, the EMAs are at 1842 for EMA15, 1901 for EMA30, and 1999 for EMA60. Price is below the short-term moving averages, while the medium-term averages continue to exert downward pressure; the rebound has not yet reversed their alignment. The MACD is in a low zone, with the two lines showing signs of converging and attempting to turn upward. This is an initial recovery signal after oversold conditions, but a bullish crossover has not yet been confirmed. The Bollinger Bands have a middle band at 1853, an upper band at 1965, and a lower band at 1741. Price is fluctuating between the middle and lower bands, and the range has yet to break. A TD Sequential 9 count has appeared in the lower zone, so repeated bottom-building is possible in the short term. First watch whether price can reclaim 1842–1854; below, monitor the two support levels at 1786 and 1741.
Short-term reference:
If price rises into 1840–1880 and stalls, set a 30-point stop loss; target 1850–1800, with 1750 in view if support breaks.
If price falls into 1780–1740 and holds, set a 30-point stop loss; target 1820–1860, with 1930 in view if resistance breaks.
For specific trades, prioritize real-time order-book data. For more information, you can contact the author. This article was published with a delay and is for reference only; trade at your own risk.
#ETH走势分析
The first step of the spot-market plan remains unchanged; the second step is at 1500. Short-term contract traders have only two questions: can the rebound be chased, and can the pullback be bought? Those trapped at higher levels are waiting to break even, while those on the sidelines are waiting for an entry. Bulls and bears keep pulling prices back and forth at this level. In a choppy market, the biggest mistake is trading on instinct: call it a reversal after a small rise, call it a collapse after a small drop, and end up getting burned both ways. Let’s get straight to the essentials: first read the daily chart to determine the overall direction, then switch to the four-hour chart to find the rhythm, and finally lay out the trigger zones, stop-loss levels, and targets for both long and short positions.
On the daily chart, price is below the EMAs for all periods, including EMA15 at 2049, EMA30 at 2176, and EMA60 at 2276. The short- and medium-term moving averages are bearishly aligned, and the daily trend remains weak. On the MACD, both lines are below the zero axis, with no clear reversal in momentum yet. The Bollinger Bands have a middle band at 2139, an upper band at 2499, and a lower band at 1779. Price is moving near the lower band, indicating a range-bound market in a weak zone. The previous low of 1503 remains a long-term reference below; in the short term, watch whether the 1779 level holds. No reversal pattern is visible on the daily chart for now, so the rebound is better characterized as a weak recovery.
On the four-hour chart, the EMAs are at 1842 for EMA15, 1901 for EMA30, and 1999 for EMA60. Price is below the short-term moving averages, while the medium-term averages continue to exert downward pressure; the rebound has not yet reversed their alignment. The MACD is in a low zone, with the two lines showing signs of converging and attempting to turn upward. This is an initial recovery signal after oversold conditions, but a bullish crossover has not yet been confirmed. The Bollinger Bands have a middle band at 1853, an upper band at 1965, and a lower band at 1741. Price is fluctuating between the middle and lower bands, and the range has yet to break. A TD Sequential 9 count has appeared in the lower zone, so repeated bottom-building is possible in the short term. First watch whether price can reclaim 1842–1854; below, monitor the two support levels at 1786 and 1741.
Short-term reference:
If price rises into 1840–1880 and stalls, set a 30-point stop loss; target 1850–1800, with 1750 in view if support breaks.
If price falls into 1780–1740 and holds, set a 30-point stop loss; target 1820–1860, with 1930 in view if resistance breaks.
For specific trades, prioritize real-time order-book data. For more information, you can contact the author. This article was published with a delay and is for reference only; trade at your own risk.
#ETH走势分析
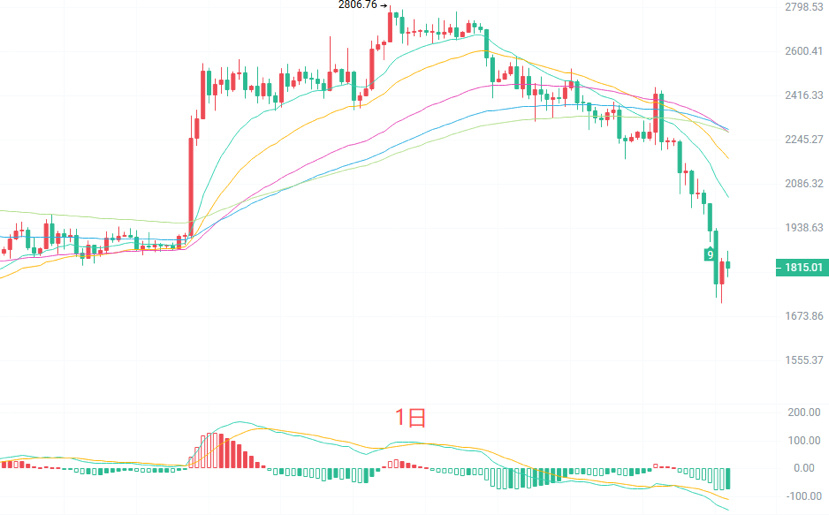
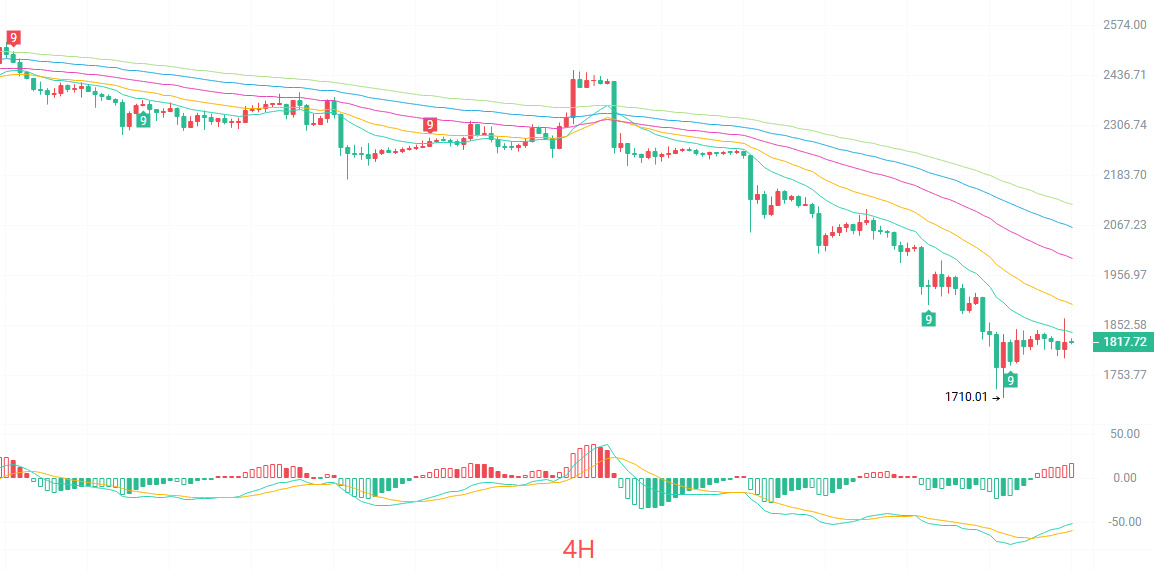
8
4.1k
·
--
Bullish
$BTC Crypto Academician: 11.17 Bitcoin (BTC) Bounce Trap in a Downtrend: Why It Cannot Reclaim the Moving Averages and Why the Rebound Should Be Treated Only as a Correction
To begin, spot positions can still be built in the first step; the second step is the 55,000 level. When the trend is downward, it is easiest to make two mistakes: first, thinking “it’s hit bottom” after a small drop and repeatedly getting caught while trying to buy the dip; second, thinking “the trend has reversed” after a small rebound and chasing price into resistance. The daily chart is bearish, while the four-hour chart is deeply oversold. Essentially, this is a corrective window within a weak market, not confirmation of a trend reversal. Risk management must always come before directional calls. A stop-loss is not a nuisance; it preserves your chance to enter again. The market never lacks opportunities—the challenge is keeping your capital intact long enough to seize them.
The daily candlestick chart has broken below all the short-, medium-, and long-term moving averages, which are now all above the price—a typical bearish alignment. The MACD lines are running below the zero line, and the green histogram bars are still expanding, so bearish momentum on the daily chart has not fully exhausted itself. The Bollinger Bands are opening downward, with price hugging the lower band at 64470 and the middle band at 74320 acting as distant resistance. Overall, the daily chart remains in a downtrend. Although the price is oversold near the lower band, until it climbs back above the moving averages and the middle band, any rebound should mainly be treated as a correction; avoid blindly buying the dip.
The four-hour candlestick chart is below all short- and medium-term moving averages. Any short-term rebound will first face the combined resistance of the EMA15 and the Bollinger middle band at 66008. Below the MACD zero line, the green histogram bars have contracted noticeably and are even showing slight signs of turning red. This indicates that selling momentum has weakened after the sustained decline, and that a short-term oversold correction may be due. The Bollinger lower band at 62652 and this round’s low at 61956 provide reference support below. Structurally, the four-hour chart remains in weak consolidation after the decline. The strength of the rebound will determine whether price forms a continuation base or stages a more substantial retracement. Watch whether the 65658–66008 resistance zone can be broken with increased volume.
Short-term reference:
Short: 66000–66500 if momentum stalls; stop-loss 500 points; targets 65000–64300, then 63000 if support breaks.
Long: 62500–62000 if the decline stalls; stop-loss 500 points; target 63500–84500.
For specific trades, prioritize real-time order-book data. For more information, please contact the author. This article may be published with a delay and is for reference only; assume all risks yourself.
{future}(BTCUSDT)
#BTC走势分析 #BTC Futures
$BTC Crypto Academician: 11.17 Bitcoin (BTC) Bounce Trap in a Downtrend: Why It Cannot Reclaim the Moving Averages and Why the Rebound Should Be Treated Only as a Correction
To begin, spot positions can still be built in the first step; the second step is the 55,000 level. When the trend is downward, it is easiest to make two mistakes: first, thinking “it’s hit bottom” after a small drop and repeatedly getting caught while trying to buy the dip; second, thinking “the trend has reversed” after a small rebound and chasing price into resistance. The daily chart is bearish, while the four-hour chart is deeply oversold. Essentially, this is a corrective window within a weak market, not confirmation of a trend reversal. Risk management must always come before directional calls. A stop-loss is not a nuisance; it preserves your chance to enter again. The market never lacks opportunities—the challenge is keeping your capital intact long enough to seize them.
The daily candlestick chart has broken below all the short-, medium-, and long-term moving averages, which are now all above the price—a typical bearish alignment. The MACD lines are running below the zero line, and the green histogram bars are still expanding, so bearish momentum on the daily chart has not fully exhausted itself. The Bollinger Bands are opening downward, with price hugging the lower band at 64470 and the middle band at 74320 acting as distant resistance. Overall, the daily chart remains in a downtrend. Although the price is oversold near the lower band, until it climbs back above the moving averages and the middle band, any rebound should mainly be treated as a correction; avoid blindly buying the dip.
The four-hour candlestick chart is below all short- and medium-term moving averages. Any short-term rebound will first face the combined resistance of the EMA15 and the Bollinger middle band at 66008. Below the MACD zero line, the green histogram bars have contracted noticeably and are even showing slight signs of turning red. This indicates that selling momentum has weakened after the sustained decline, and that a short-term oversold correction may be due. The Bollinger lower band at 62652 and this round’s low at 61956 provide reference support below. Structurally, the four-hour chart remains in weak consolidation after the decline. The strength of the rebound will determine whether price forms a continuation base or stages a more substantial retracement. Watch whether the 65658–66008 resistance zone can be broken with increased volume.
Short-term reference:
Short: 66000–66500 if momentum stalls; stop-loss 500 points; targets 65000–64300, then 63000 if support breaks.
Long: 62500–62000 if the decline stalls; stop-loss 500 points; target 63500–84500.
For specific trades, prioritize real-time order-book data. For more information, please contact the author. This article may be published with a delay and is for reference only; assume all risks yourself.
#BTC走势分析 #BTC Futures
To begin, spot positions can still be built in the first step; the second step is the 55,000 level. When the trend is downward, it is easiest to make two mistakes: first, thinking “it’s hit bottom” after a small drop and repeatedly getting caught while trying to buy the dip; second, thinking “the trend has reversed” after a small rebound and chasing price into resistance. The daily chart is bearish, while the four-hour chart is deeply oversold. Essentially, this is a corrective window within a weak market, not confirmation of a trend reversal. Risk management must always come before directional calls. A stop-loss is not a nuisance; it preserves your chance to enter again. The market never lacks opportunities—the challenge is keeping your capital intact long enough to seize them.
The daily candlestick chart has broken below all the short-, medium-, and long-term moving averages, which are now all above the price—a typical bearish alignment. The MACD lines are running below the zero line, and the green histogram bars are still expanding, so bearish momentum on the daily chart has not fully exhausted itself. The Bollinger Bands are opening downward, with price hugging the lower band at 64470 and the middle band at 74320 acting as distant resistance. Overall, the daily chart remains in a downtrend. Although the price is oversold near the lower band, until it climbs back above the moving averages and the middle band, any rebound should mainly be treated as a correction; avoid blindly buying the dip.
The four-hour candlestick chart is below all short- and medium-term moving averages. Any short-term rebound will first face the combined resistance of the EMA15 and the Bollinger middle band at 66008. Below the MACD zero line, the green histogram bars have contracted noticeably and are even showing slight signs of turning red. This indicates that selling momentum has weakened after the sustained decline, and that a short-term oversold correction may be due. The Bollinger lower band at 62652 and this round’s low at 61956 provide reference support below. Structurally, the four-hour chart remains in weak consolidation after the decline. The strength of the rebound will determine whether price forms a continuation base or stages a more substantial retracement. Watch whether the 65658–66008 resistance zone can be broken with increased volume.
Short-term reference:
Short: 66000–66500 if momentum stalls; stop-loss 500 points; targets 65000–64300, then 63000 if support breaks.
Long: 62500–62000 if the decline stalls; stop-loss 500 points; target 63500–84500.
For specific trades, prioritize real-time order-book data. For more information, please contact the author. This article may be published with a delay and is for reference only; assume all risks yourself.
#BTC走势分析 #BTC Futures
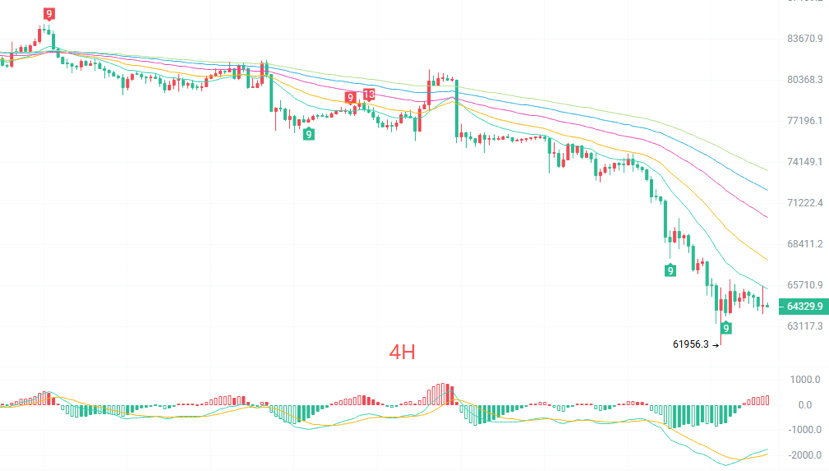
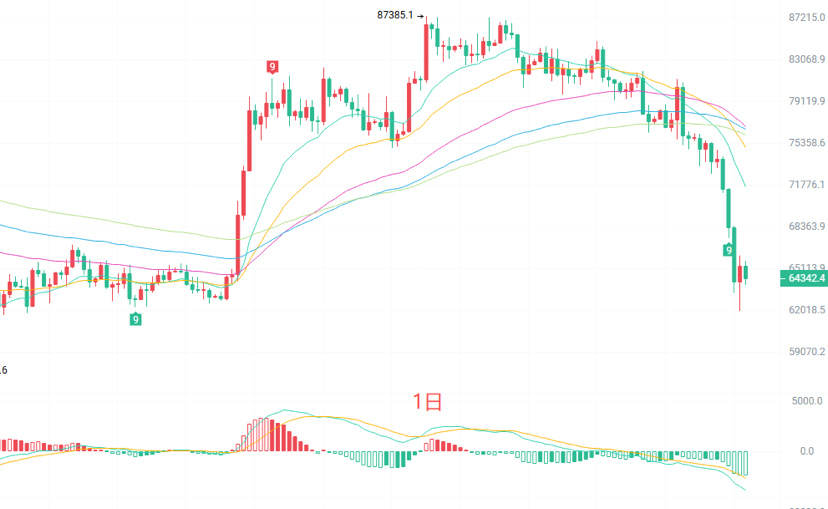
7
1.6k
·
--
Bullish
Get into spot $BTC $ETH $LTC
Get into spot $BTC $ETH $LTC


Yi He
·
--
The pullback is temporary; spot holders have nothing to fear.🫥
6
251
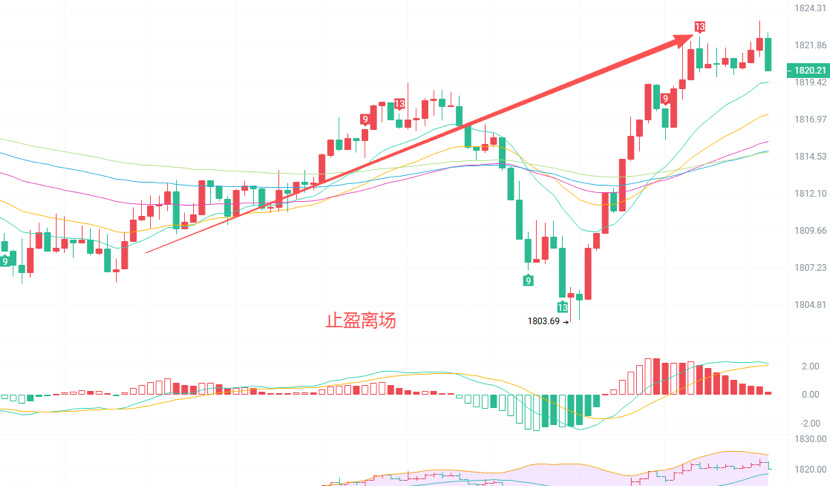
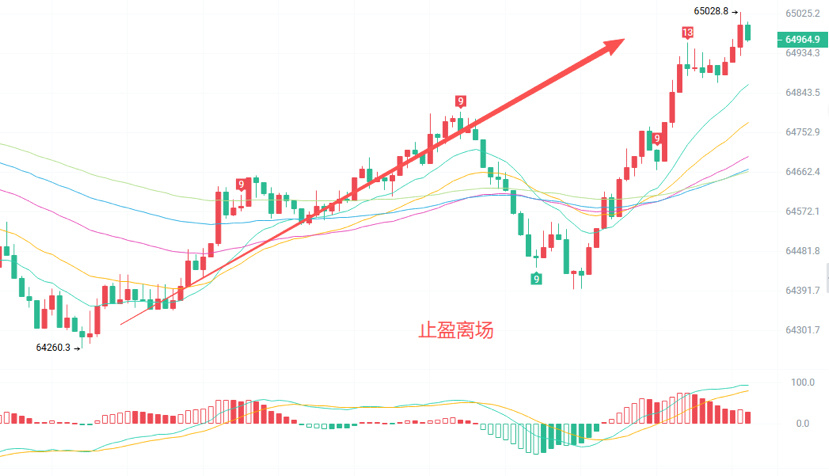
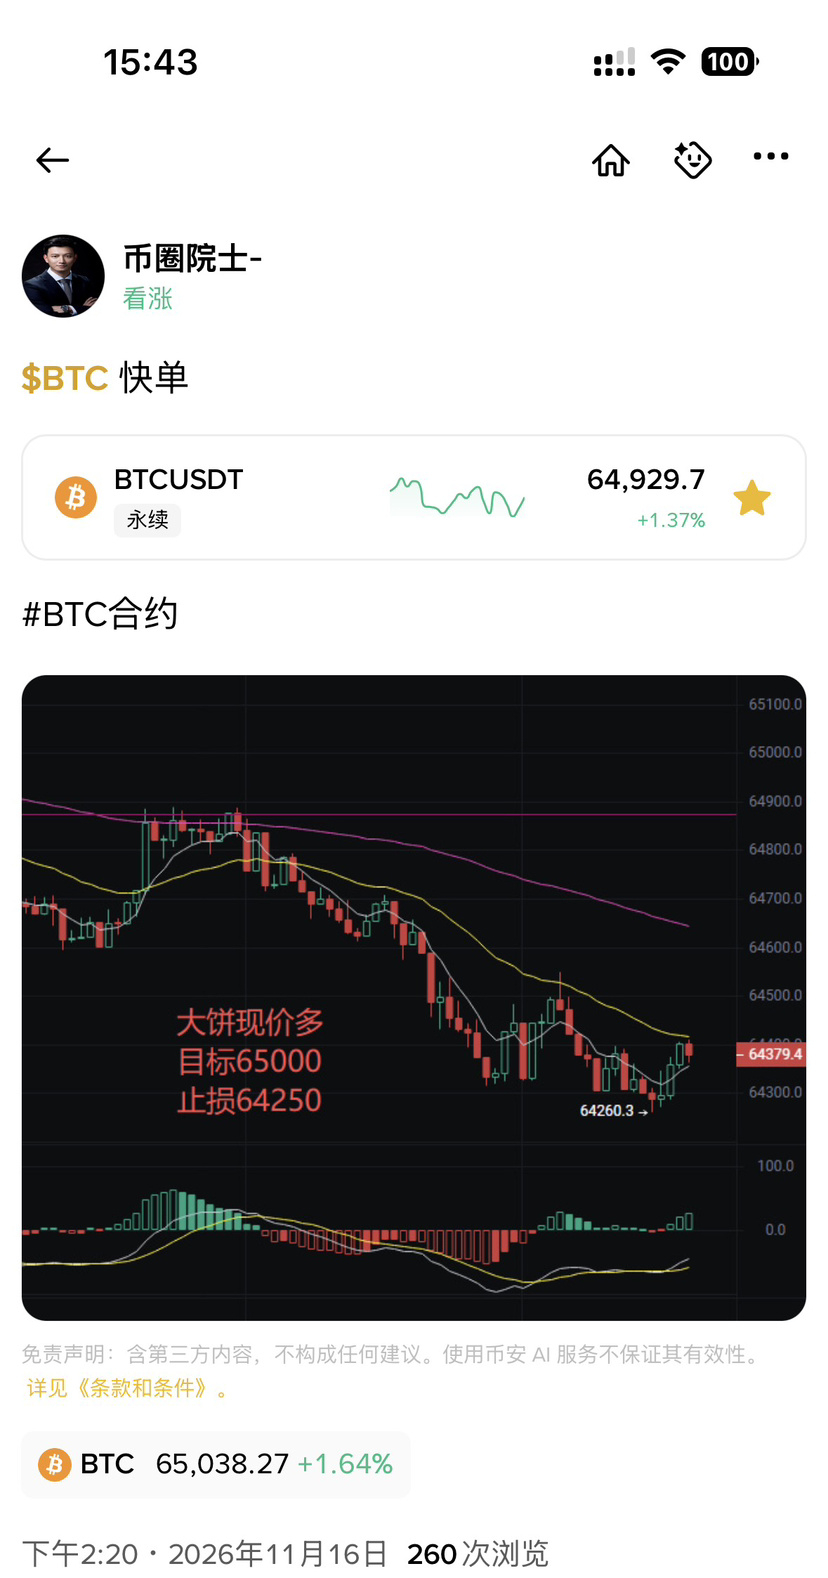
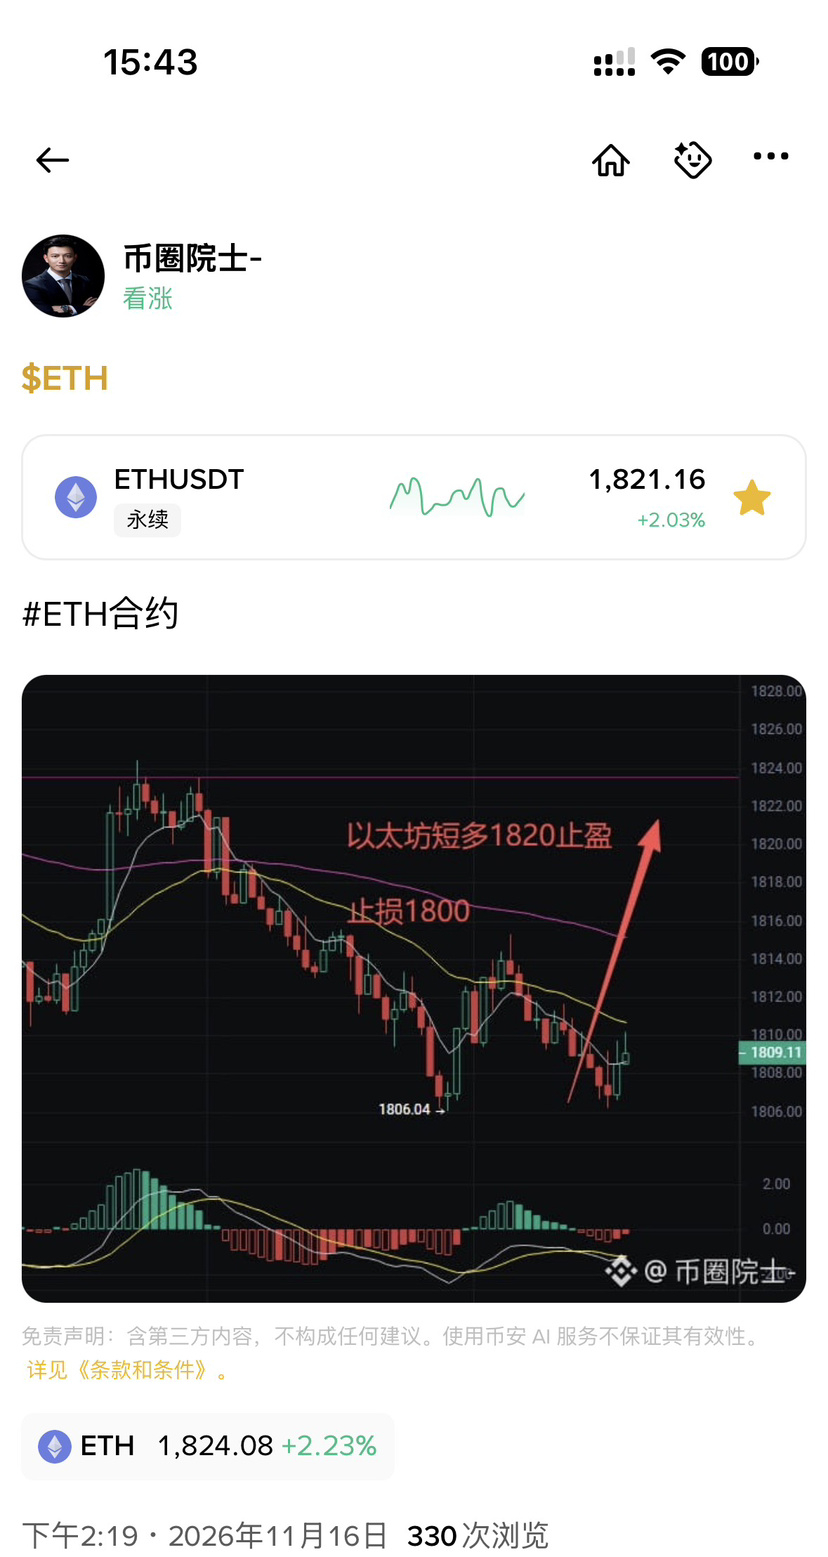
·
--
Bullish
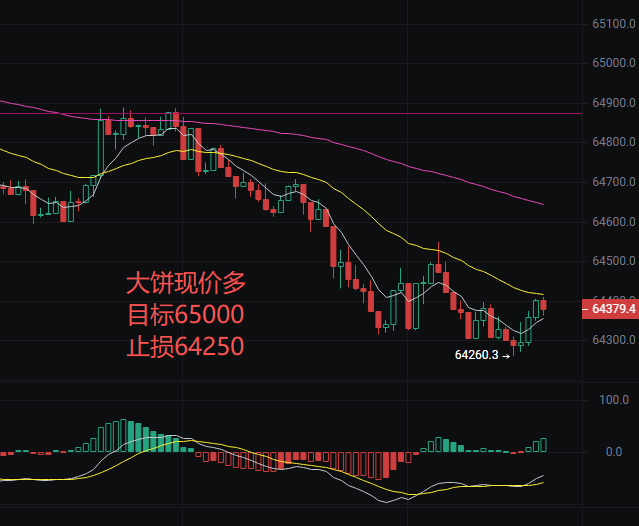
7
454
Log in to explore more content
Join global crypto users on Binance Square
⚡️ Get latest and useful information about crypto.
💬 Trusted by the world’s largest crypto exchange.
👍 Discover real insights from verified creators.
Email / Phone number
Trending Topics
IsAnthropic’s$1.5TMarketCapJustified?
45,734 views
224 Discussing
Anthropic Set to Open at $105 in Record Nasdaq Debut
Binance News
·15 Likes
·18.4k views
BTCBelow$62KAmidHikeFearsAndShiftToAnthropic
6,874 views
60 Discussing
NvidiaBoardReportedlySplitOverHuang’sReturn
199,909 views
1,650 Discussing