
eko 13
634 Posts

eko 13
Report
Block User
Open Trade
Occasional Trader
1.8 Years
928 Following
141 Followers
640 Liked
Posts
Portfolio
All
Quotes
Videos
·
--
$SHIB
Key Metrics for Analyzing a Memecoin on Binance
24h Trading Volume vs. Market Cap:
If 24-hour trading volume represents a very high percentage of the market cap (e.g., >30%), it indicates active speculation or a potential rally.
.
Open Interest (OI) in Binance Futures:
A sudden increase in open interest alongside high funding rates often signals a massive opening of leveraged positions, increasing the risk of cascading liquidations.
Order Book Liquidity (Depth):
Assess spot liquidity to avoid slippage when entering or exiting positions with significant amounts.
.
Sentiment on Binance Square and Social Media:
Social attention is the primary driver of memecoin prices. Declines in social mentions often foreshadow downtrends in price.
Risk Management Strategies
Avoid Excessive Leverage: Memecoins experience volatility wicks that can liquidate futures positions in a matter of minutes.
Gradual Profit-Taking (DCA out): Set predefined profit targets and don’t wait for the “absolute peak.”
Portfolio Diversification: If you invest in the sector, limit your exposure to a small percentage of your total portfolio (e.g., 2%–5%).
$SHIB
Key Metrics for Analyzing a Memecoin on Binance
24h Trading Volume vs. Market Cap:
If 24-hour trading volume represents a very high percentage of the market cap (e.g., >30%), it indicates active speculation or a potential rally.
.
Open Interest (OI) in Binance Futures:
A sudden increase in open interest alongside high funding rates often signals a massive opening of leveraged positions, increasing the risk of cascading liquidations.
Order Book Liquidity (Depth):
Assess spot liquidity to avoid slippage when entering or exiting positions with significant amounts.
.
Sentiment on Binance Square and Social Media:
Social attention is the primary driver of memecoin prices. Declines in social mentions often foreshadow downtrends in price.
Risk Management Strategies
Avoid Excessive Leverage: Memecoins experience volatility wicks that can liquidate futures positions in a matter of minutes.
Gradual Profit-Taking (DCA out): Set predefined profit targets and don’t wait for the “absolute peak.”
Portfolio Diversification: If you invest in the sector, limit your exposure to a small percentage of your total portfolio (e.g., 2%–5%).
Key Metrics for Analyzing a Memecoin on Binance
24h Trading Volume vs. Market Cap:
If 24-hour trading volume represents a very high percentage of the market cap (e.g., >30%), it indicates active speculation or a potential rally.
.
Open Interest (OI) in Binance Futures:
A sudden increase in open interest alongside high funding rates often signals a massive opening of leveraged positions, increasing the risk of cascading liquidations.
Order Book Liquidity (Depth):
Assess spot liquidity to avoid slippage when entering or exiting positions with significant amounts.
.
Sentiment on Binance Square and Social Media:
Social attention is the primary driver of memecoin prices. Declines in social mentions often foreshadow downtrends in price.
Risk Management Strategies
Avoid Excessive Leverage: Memecoins experience volatility wicks that can liquidate futures positions in a matter of minutes.
Gradual Profit-Taking (DCA out): Set predefined profit targets and don’t wait for the “absolute peak.”
Portfolio Diversification: If you invest in the sector, limit your exposure to a small percentage of your total portfolio (e.g., 2%–5%).

1
115
·
--
$PEPE
PEPE (Pepe Coin) analysis on Binance highlights the following key points about its market behavior, price, and technical outlook:
1. Current Price and Volume
Trading price: PEPE is hovering around $0.0000050–$0.0000051 USD (with slight fluctuations over the past 24 hours, showing a modest rebound of between 1% and 8%, depending on current volatility).
Trading volume: It maintains strong liquidity and robust daily trading volume on Binance, exceeding $490 million, confirming that it remains one of the memecoins attracting the most interest and traction among traders.
2. Technical and Market Outlook
Trading range: The token has been fluctuating within a defined accumulation range. Technical analysts are closely watching the lower support levels (near the $0.0000046 area) and immediate resistance around $0.0000053. These are key turning points that will determine whether it breaks into a short-term uptrend or continues moving sideways.
Neutral indicators: Momentum indicators such as the RSI (Relative Strength Index) are in intermediate (neutral) territory, reflecting a market on pause as it awaits a broader catalyst in the crypto market (such as Bitcoin's movements) to determine its next significant direction
$PEPE
PEPE (Pepe Coin) analysis on Binance highlights the following key points about its market behavior, price, and technical outlook:
1. Current Price and Volume
Trading price: PEPE is hovering around $0.0000050–$0.0000051 USD (with slight fluctuations over the past 24 hours, showing a modest rebound of between 1% and 8%, depending on current volatility).
Trading volume: It maintains strong liquidity and robust daily trading volume on Binance, exceeding $490 million, confirming that it remains one of the memecoins attracting the most interest and traction among traders.
2. Technical and Market Outlook
Trading range: The token has been fluctuating within a defined accumulation range. Technical analysts are closely watching the lower support levels (near the $0.0000046 area) and immediate resistance around $0.0000053. These are key turning points that will determine whether it breaks into a short-term uptrend or continues moving sideways.
Neutral indicators: Momentum indicators such as the RSI (Relative Strength Index) are in intermediate (neutral) territory, reflecting a market on pause as it awaits a broader catalyst in the crypto market (such as Bitcoin's movements) to determine its next significant direction
PEPE (Pepe Coin) analysis on Binance highlights the following key points about its market behavior, price, and technical outlook:
1. Current Price and Volume
Trading price: PEPE is hovering around $0.0000050–$0.0000051 USD (with slight fluctuations over the past 24 hours, showing a modest rebound of between 1% and 8%, depending on current volatility).
Trading volume: It maintains strong liquidity and robust daily trading volume on Binance, exceeding $490 million, confirming that it remains one of the memecoins attracting the most interest and traction among traders.
2. Technical and Market Outlook
Trading range: The token has been fluctuating within a defined accumulation range. Technical analysts are closely watching the lower support levels (near the $0.0000046 area) and immediate resistance around $0.0000053. These are key turning points that will determine whether it breaks into a short-term uptrend or continues moving sideways.
Neutral indicators: Momentum indicators such as the RSI (Relative Strength Index) are in intermediate (neutral) territory, reflecting a market on pause as it awaits a broader catalyst in the crypto market (such as Bitcoin's movements) to determine its next significant direction

1
2
617
·
--
$BTC
Following the massive hack of Binance’s hot wallets, involving an amount close to $6.3 billion, both the company’s founder and largest shareholder, Changpeng Zhao ("CZ"), and its current Co-CEO, Richard Teng, issued several official statements about the platform’s status, service stability, and security:
1. Status of user funds
Full protection: CZ and Binance’s management assured users from the outset that "user funds are safe" ("User funds are safe").
100% loss coverage: Binance confirmed that no user would incur direct losses. The losses caused by the attack were fully covered using the company’s own reserves, its emergency insurance fund (SAFU), and corporate liquidity.
2. Stability and service updates
Withdrawal pause and resumption: As an immediate contingency measure in response to the hack, Binance temporarily paused withdrawals. After auditing its infrastructure and stress-testing the compromised containers, withdrawal services were reopened and restored to normal.
Freezing stolen assets: Binance worked closely with stablecoin issuers (such as Tether and Circle) and blockchain ecosystem partners, managing to freeze more than $2.5–$3.0 billion of the stolen assets in the hours following the incident.
3. CZ’s statements on security
"There is no such thing as 100% security": CZ candidly acknowledged that no crypto platform or financial system is impenetrable, and that the scale of the attack exceeded the industry’s initial risk estimates.
Integrity of private keys: Binance and preliminary investigations (along with blockchain intelligence firms) confirmed that the main private keys for cold storage wallets were not leaked; instead, the exploit affected specific service containers and liquidity wallets (hot wallets).
$BTC
Following the massive hack of Binance’s hot wallets, involving an amount close to $6.3 billion, both the company’s founder and largest shareholder, Changpeng Zhao ("CZ"), and its current Co-CEO, Richard Teng, issued several official statements about the platform’s status, service stability, and security:
1. Status of user funds
Full protection: CZ and Binance’s management assured users from the outset that "user funds are safe" ("User funds are safe").
100% loss coverage: Binance confirmed that no user would incur direct losses. The losses caused by the attack were fully covered using the company’s own reserves, its emergency insurance fund (SAFU), and corporate liquidity.
2. Stability and service updates
Withdrawal pause and resumption: As an immediate contingency measure in response to the hack, Binance temporarily paused withdrawals. After auditing its infrastructure and stress-testing the compromised containers, withdrawal services were reopened and restored to normal.
Freezing stolen assets: Binance worked closely with stablecoin issuers (such as Tether and Circle) and blockchain ecosystem partners, managing to freeze more than $2.5–$3.0 billion of the stolen assets in the hours following the incident.
3. CZ’s statements on security
"There is no such thing as 100% security": CZ candidly acknowledged that no crypto platform or financial system is impenetrable, and that the scale of the attack exceeded the industry’s initial risk estimates.
Integrity of private keys: Binance and preliminary investigations (along with blockchain intelligence firms) confirmed that the main private keys for cold storage wallets were not leaked; instead, the exploit affected specific service containers and liquidity wallets (hot wallets).
Following the massive hack of Binance’s hot wallets, involving an amount close to $6.3 billion, both the company’s founder and largest shareholder, Changpeng Zhao ("CZ"), and its current Co-CEO, Richard Teng, issued several official statements about the platform’s status, service stability, and security:
1. Status of user funds
Full protection: CZ and Binance’s management assured users from the outset that "user funds are safe" ("User funds are safe").
100% loss coverage: Binance confirmed that no user would incur direct losses. The losses caused by the attack were fully covered using the company’s own reserves, its emergency insurance fund (SAFU), and corporate liquidity.
2. Stability and service updates
Withdrawal pause and resumption: As an immediate contingency measure in response to the hack, Binance temporarily paused withdrawals. After auditing its infrastructure and stress-testing the compromised containers, withdrawal services were reopened and restored to normal.
Freezing stolen assets: Binance worked closely with stablecoin issuers (such as Tether and Circle) and blockchain ecosystem partners, managing to freeze more than $2.5–$3.0 billion of the stolen assets in the hours following the incident.
3. CZ’s statements on security
"There is no such thing as 100% security": CZ candidly acknowledged that no crypto platform or financial system is impenetrable, and that the scale of the attack exceeded the industry’s initial risk estimates.
Integrity of private keys: Binance and preliminary investigations (along with blockchain intelligence firms) confirmed that the main private keys for cold storage wallets were not leaked; instead, the exploit affected specific service containers and liquidity wallets (hot wallets).

2
739
·
--
$BTC
The price of Bitcoin (BTC) in the BTC/USDT pair on Binance is trading around $78,000 to $78,350 USD, showing slight stability after recent market fluctuations.
Key points from the current analysis:
Key Zones (Support and Resistance):
Immediate support: The $76,500–$77,000 USD zone is acting as a temporary floor for buyers. In the event of a deeper correction, attention turns to the $75,000 USD range.
Immediate resistance: To regain solid bullish momentum and target the $80,000+ USD zone again, Bitcoin needs to break through the $79,500–$80,000 USD barrier with strong volume.
Market Context: The crypto market remains cautious, with moderate volatility. Traders on Binance are closely monitoring global macroeconomic indicators (such as interest rate decisions and liquidity in traditional markets) and the market's overall response following recent security events at global exchange platforms in late October, which have kept investors focused on risk management and asset custody.
Volume and Dominance: Bitcoin's market dominance remains strong, reflecting that capital prefers to stay in the leading asset amid uncertainty surrounding altcoins
$BTC
The price of Bitcoin (BTC) in the BTC/USDT pair on Binance is trading around $78,000 to $78,350 USD, showing slight stability after recent market fluctuations.
Key points from the current analysis:
Key Zones (Support and Resistance):
Immediate support: The $76,500–$77,000 USD zone is acting as a temporary floor for buyers. In the event of a deeper correction, attention turns to the $75,000 USD range.
Immediate resistance: To regain solid bullish momentum and target the $80,000+ USD zone again, Bitcoin needs to break through the $79,500–$80,000 USD barrier with strong volume.
Market Context: The crypto market remains cautious, with moderate volatility. Traders on Binance are closely monitoring global macroeconomic indicators (such as interest rate decisions and liquidity in traditional markets) and the market's overall response following recent security events at global exchange platforms in late October, which have kept investors focused on risk management and asset custody.
Volume and Dominance: Bitcoin's market dominance remains strong, reflecting that capital prefers to stay in the leading asset amid uncertainty surrounding altcoins
The price of Bitcoin (BTC) in the BTC/USDT pair on Binance is trading around $78,000 to $78,350 USD, showing slight stability after recent market fluctuations.
Key points from the current analysis:
Key Zones (Support and Resistance):
Immediate support: The $76,500–$77,000 USD zone is acting as a temporary floor for buyers. In the event of a deeper correction, attention turns to the $75,000 USD range.
Immediate resistance: To regain solid bullish momentum and target the $80,000+ USD zone again, Bitcoin needs to break through the $79,500–$80,000 USD barrier with strong volume.
Market Context: The crypto market remains cautious, with moderate volatility. Traders on Binance are closely monitoring global macroeconomic indicators (such as interest rate decisions and liquidity in traditional markets) and the market's overall response following recent security events at global exchange platforms in late October, which have kept investors focused on risk management and asset custody.
Volume and Dominance: Bitcoin's market dominance remains strong, reflecting that capital prefers to stay in the leading asset amid uncertainty surrounding altcoins

3
454
·
--
$SPCXB
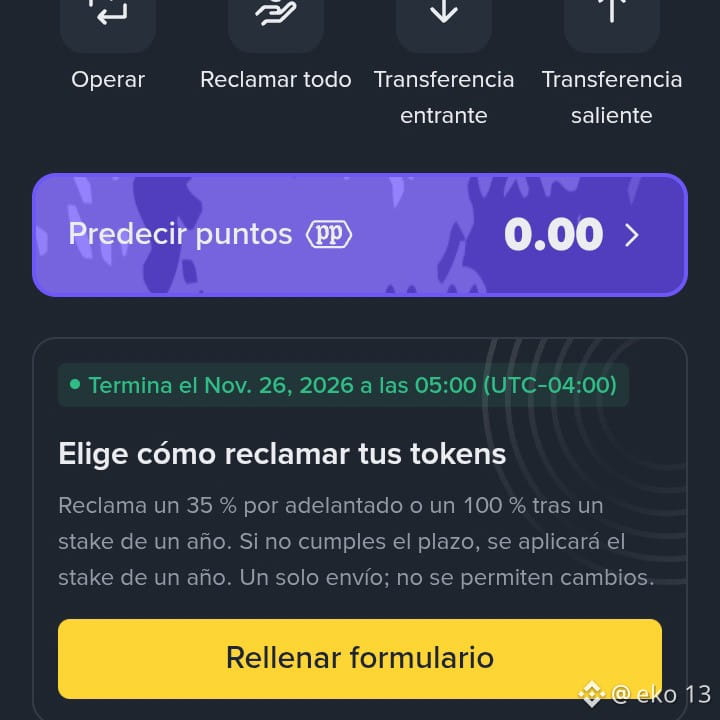
greetings...🤔 can anyone tell me when withdrawals for prediction funds will be enabled?
and that announcement—I have no idea what it’s about.
$SPCXB
greetings...🤔 can anyone tell me when withdrawals for prediction funds will be enabled?
and that announcement—I have no idea what it’s about.
greetings...🤔 can anyone tell me when withdrawals for prediction funds will be enabled?
and that announcement—I have no idea what it’s about.
1
218
·
--
$PEPE
Pepe Coin ($PEPE) is trading around $0.0000048–$0.0000049 USD, with a market capitalization of approximately $2.01 billion. The token is showing a strong short-term recovery, advancing approximately 12% to 15% over the last 30 days and more than 60% over the 90-day period. However, it remains 82.5% below its all-time high ($0.0000281 USD, reached in December 2024).
Key Technical Levels
Immediate resistance ($0.0000050–$0.0000051 USD): This is the psychological and technical barrier to overcome. A sustained break above $0.0000051 on strong volume would confirm the continuation of bullish momentum.
Technical momentum (RSI ~60.8): The relative strength index indicates healthy buying activity without yet entering overbought territory. The price is holding above key short- and medium-term moving averages (SMA 7, 30, and 200).
Primary support ($0.0000047–$0.0000048 USD): This coincides with the 7-day SMA and the 23.6% Fibonacci retracement. If it falls below $0.0000047, the current momentum would be invalidated.
Secondary support ($0.0000043–$0.0000045 USD): A zone defended by the 15- and 30-day moving averages.
Fundamental Factors and Ecosystem
Tokenomics and clean liquidity: There is no transaction tax, the token contract has been irrevocably renounced, and the initial liquidity tokens were burned. With no presale rounds or venture capital investors, there is no risk of selling pressure from massive token unlocks (vesting).
Speculation-driven volume: Daily trading volume is more than 15% above its 30-day average. Much of this volume comes from the derivatives market and leveraged futures, increasing susceptibility to liquidity sweeps or sharp short/long squeezes.
Lack of a utility catalyst: As a pure memecoin, PEPE has no cash flow model or intrinsic network utility.
$PEPE
Pepe Coin ($PEPE ) is trading around $0.0000048–$0.0000049 USD, with a market capitalization of approximately $2.01 billion. The token is showing a strong short-term recovery, advancing approximately 12% to 15% over the last 30 days and more than 60% over the 90-day period. However, it remains 82.5% below its all-time high ($0.0000281 USD, reached in December 2024).
Key Technical Levels
Immediate resistance ($0.0000050–$0.0000051 USD): This is the psychological and technical barrier to overcome. A sustained break above $0.0000051 on strong volume would confirm the continuation of bullish momentum.
Technical momentum (RSI ~60.8): The relative strength index indicates healthy buying activity without yet entering overbought territory. The price is holding above key short- and medium-term moving averages (SMA 7, 30, and 200).
Primary support ($0.0000047–$0.0000048 USD): This coincides with the 7-day SMA and the 23.6% Fibonacci retracement. If it falls below $0.0000047, the current momentum would be invalidated.
Secondary support ($0.0000043–$0.0000045 USD): A zone defended by the 15- and 30-day moving averages.
Fundamental Factors and Ecosystem
Tokenomics and clean liquidity: There is no transaction tax, the token contract has been irrevocably renounced, and the initial liquidity tokens were burned. With no presale rounds or venture capital investors, there is no risk of selling pressure from massive token unlocks (vesting).
Speculation-driven volume: Daily trading volume is more than 15% above its 30-day average. Much of this volume comes from the derivatives market and leveraged futures, increasing susceptibility to liquidity sweeps or sharp short/long squeezes.
Lack of a utility catalyst: As a pure memecoin, PEPE has no cash flow model or intrinsic network utility.
Pepe Coin ($PEPE ) is trading around $0.0000048–$0.0000049 USD, with a market capitalization of approximately $2.01 billion. The token is showing a strong short-term recovery, advancing approximately 12% to 15% over the last 30 days and more than 60% over the 90-day period. However, it remains 82.5% below its all-time high ($0.0000281 USD, reached in December 2024).
Key Technical Levels
Immediate resistance ($0.0000050–$0.0000051 USD): This is the psychological and technical barrier to overcome. A sustained break above $0.0000051 on strong volume would confirm the continuation of bullish momentum.
Technical momentum (RSI ~60.8): The relative strength index indicates healthy buying activity without yet entering overbought territory. The price is holding above key short- and medium-term moving averages (SMA 7, 30, and 200).
Primary support ($0.0000047–$0.0000048 USD): This coincides with the 7-day SMA and the 23.6% Fibonacci retracement. If it falls below $0.0000047, the current momentum would be invalidated.
Secondary support ($0.0000043–$0.0000045 USD): A zone defended by the 15- and 30-day moving averages.
Fundamental Factors and Ecosystem
Tokenomics and clean liquidity: There is no transaction tax, the token contract has been irrevocably renounced, and the initial liquidity tokens were burned. With no presale rounds or venture capital investors, there is no risk of selling pressure from massive token unlocks (vesting).
Speculation-driven volume: Daily trading volume is more than 15% above its 30-day average. Much of this volume comes from the derivatives market and leveraged futures, increasing susceptibility to liquidity sweeps or sharp short/long squeezes.
Lack of a utility catalyst: As a pure memecoin, PEPE has no cash flow model or intrinsic network utility.
5
1k
·
--
$BTC
Binance operations and withdrawals were temporarily and gradually suspended following the cyberattack and security incident reported on October 29, 2026. The platform began gradually reactivating its main services (such as phased fund withdrawals) starting November 1, 2026, after implementing security audits and covering the affected assets.
To check the exact status of prediction markets or other specific services within your account or region, you can follow these steps:
Check the official announcements section: Open the Binance app or website and go to the Announcements Center (under Support) to view the latest updates on the resumption of specific products.
Check access through the platform: Try going directly to the prediction markets section in the trading or derivatives interface to see if the trading buttons are enabled
$BTC
Binance operations and withdrawals were temporarily and gradually suspended following the cyberattack and security incident reported on October 29, 2026. The platform began gradually reactivating its main services (such as phased fund withdrawals) starting November 1, 2026, after implementing security audits and covering the affected assets.
To check the exact status of prediction markets or other specific services within your account or region, you can follow these steps:
Check the official announcements section: Open the Binance app or website and go to the Announcements Center (under Support) to view the latest updates on the resumption of specific products.
Check access through the platform: Try going directly to the prediction markets section in the trading or derivatives interface to see if the trading buttons are enabled
Binance operations and withdrawals were temporarily and gradually suspended following the cyberattack and security incident reported on October 29, 2026. The platform began gradually reactivating its main services (such as phased fund withdrawals) starting November 1, 2026, after implementing security audits and covering the affected assets.
To check the exact status of prediction markets or other specific services within your account or region, you can follow these steps:
Check the official announcements section: Open the Binance app or website and go to the Announcements Center (under Support) to view the latest updates on the resumption of specific products.
Check access through the platform: Try going directly to the prediction markets section in the trading or derivatives interface to see if the trading buttons are enabled

1
175
·
--
$BTC
. Technical Analysis on Binance
Bitcoin (BTC/USDT)
Market Structure: It is trading near the $82,500 USD range. Following the recent accumulation cycle, it is showing short-term consolidation with declining Spot volume.
Key support levels:
$80,000 USD: Psychological zone and immediate support level.
$76,500 - $78,000 USD: Buyer demand zone and previous order block.
Key resistance levels:
$85,000 USD: Upper liquidity level that must be broken to continue the broader bullish trend.
Derivatives analysis (Binance Futures): Funding rates show a neutral-to-moderate position, indicating that the market is not saturated with leveraged long positions (longs).
Gold (XAUUSDT)
Market Structure: In the Binance futures pair (XAUUSDT), gold is trading around $4,018 - $4,100 USD, maintaining a broader bullish trend driven by institutional and central bank demand.
Key support levels:
$3,980 - $4,000 USD: Fundamental psychological support on the 4-hour chart.
Key resistance levels:
$4,120 - $4,150 USD: Short-term resistance before attempting new highs.
3. Correlation and Market Strategy
Safe-Haven Divergence: During periods of geopolitical uncertainty or monetary adjustments, gold reacts immediately as a safe haven for capital. Bitcoin, although it shares the "digital gold" narrative over the long term, tends to behave like a higher-risk leveraged asset in the short term.
Arbitrage and Hedging on Binance: Many traders on the platform use the XAUUSDT pair on Binance Futures to mitigate the volatility of their crypto portfolios during correction phases in the altcoin and Bitcoin markets
$BTC
. Technical Analysis on Binance
Bitcoin (BTC/USDT)
Market Structure: It is trading near the $82,500 USD range. Following the recent accumulation cycle, it is showing short-term consolidation with declining Spot volume.
Key support levels:
$80,000 USD: Psychological zone and immediate support level.
$76,500 - $78,000 USD: Buyer demand zone and previous order block.
Key resistance levels:
$85,000 USD: Upper liquidity level that must be broken to continue the broader bullish trend.
Derivatives analysis (Binance Futures): Funding rates show a neutral-to-moderate position, indicating that the market is not saturated with leveraged long positions (longs).
Gold (XAUUSDT)
Market Structure: In the Binance futures pair (XAUUSDT), gold is trading around $4,018 - $4,100 USD, maintaining a broader bullish trend driven by institutional and central bank demand.
Key support levels:
$3,980 - $4,000 USD: Fundamental psychological support on the 4-hour chart.
Key resistance levels:
$4,120 - $4,150 USD: Short-term resistance before attempting new highs.
3. Correlation and Market Strategy
Safe-Haven Divergence: During periods of geopolitical uncertainty or monetary adjustments, gold reacts immediately as a safe haven for capital. Bitcoin, although it shares the "digital gold" narrative over the long term, tends to behave like a higher-risk leveraged asset in the short term.
Arbitrage and Hedging on Binance: Many traders on the platform use the XAUUSDT pair on Binance Futures to mitigate the volatility of their crypto portfolios during correction phases in the altcoin and Bitcoin markets
. Technical Analysis on Binance
Bitcoin (BTC/USDT)
Market Structure: It is trading near the $82,500 USD range. Following the recent accumulation cycle, it is showing short-term consolidation with declining Spot volume.
Key support levels:
$80,000 USD: Psychological zone and immediate support level.
$76,500 - $78,000 USD: Buyer demand zone and previous order block.
Key resistance levels:
$85,000 USD: Upper liquidity level that must be broken to continue the broader bullish trend.
Derivatives analysis (Binance Futures): Funding rates show a neutral-to-moderate position, indicating that the market is not saturated with leveraged long positions (longs).
Gold (XAUUSDT)
Market Structure: In the Binance futures pair (XAUUSDT), gold is trading around $4,018 - $4,100 USD, maintaining a broader bullish trend driven by institutional and central bank demand.
Key support levels:
$3,980 - $4,000 USD: Fundamental psychological support on the 4-hour chart.
Key resistance levels:
$4,120 - $4,150 USD: Short-term resistance before attempting new highs.
3. Correlation and Market Strategy
Safe-Haven Divergence: During periods of geopolitical uncertainty or monetary adjustments, gold reacts immediately as a safe haven for capital. Bitcoin, although it shares the "digital gold" narrative over the long term, tends to behave like a higher-risk leveraged asset in the short term.
Arbitrage and Hedging on Binance: Many traders on the platform use the XAUUSDT pair on Binance Futures to mitigate the volatility of their crypto portfolios during correction phases in the altcoin and Bitcoin markets

1
480
·
--
$SHIB
{spot}(SHIBUSDT)
Technical and Market Analysis: Shiba Inu (SHIB/USDT) on Binance
Shiba Inu ($SHIB) is trading on Binance around $0.0000049–$0.0000050 USD. The pair is showing short-term sideways consolidation following a predominantly bearish trend over the previous weeks.
📊 Key Technical Indicators (Daily Chart)
Price Structure: The asset is finding a key support level at $0.00000485–$0.00000490. The $0.0000050 zone is acting as immediate short-term psychological resistance.
Relative Strength Index (RSI 14): It is near 44–45 points. It remains in the lower-neutral zone below the 50 midpoint, signaling weak buying momentum without reaching extreme oversold levels.
Moving Averages (SMA 30 / SMA 50): The medium-term averages are above the current price (around $0.0000053–$0.0000054). While the price trades below these averages, the prevailing technical structure remains corrective or range-bound.
Trading Volume: Daily volume for the SHIB/USDT pair remains moderate compared with its monthly averages, reflecting caution in the spot and futures markets
$SHIB
Technical and Market Analysis: Shiba Inu (SHIB/USDT) on Binance
Shiba Inu ($SHIB ) is trading on Binance around $0.0000049–$0.0000050 USD. The pair is showing short-term sideways consolidation following a predominantly bearish trend over the previous weeks.
📊 Key Technical Indicators (Daily Chart)
Price Structure: The asset is finding a key support level at $0.00000485–$0.00000490. The $0.0000050 zone is acting as immediate short-term psychological resistance.
Relative Strength Index (RSI 14): It is near 44–45 points. It remains in the lower-neutral zone below the 50 midpoint, signaling weak buying momentum without reaching extreme oversold levels.
Moving Averages (SMA 30 / SMA 50): The medium-term averages are above the current price (around $0.0000053–$0.0000054). While the price trades below these averages, the prevailing technical structure remains corrective or range-bound.
Trading Volume: Daily volume for the SHIB/USDT pair remains moderate compared with its monthly averages, reflecting caution in the spot and futures markets
Technical and Market Analysis: Shiba Inu (SHIB/USDT) on Binance
Shiba Inu ($SHIB ) is trading on Binance around $0.0000049–$0.0000050 USD. The pair is showing short-term sideways consolidation following a predominantly bearish trend over the previous weeks.
📊 Key Technical Indicators (Daily Chart)
Price Structure: The asset is finding a key support level at $0.00000485–$0.00000490. The $0.0000050 zone is acting as immediate short-term psychological resistance.
Relative Strength Index (RSI 14): It is near 44–45 points. It remains in the lower-neutral zone below the 50 midpoint, signaling weak buying momentum without reaching extreme oversold levels.
Moving Averages (SMA 30 / SMA 50): The medium-term averages are above the current price (around $0.0000053–$0.0000054). While the price trades below these averages, the prevailing technical structure remains corrective or range-bound.
Trading Volume: Daily volume for the SHIB/USDT pair remains moderate compared with its monthly averages, reflecting caution in the spot and futures markets

1
356
·
--
$SPCXB
The Binance ecosystem offers exposure to SpaceX (SPCX) through stock derivatives (Binance Stocks / TradFi Perpetual Contracts) and synthetic/pre-IPO tokens.
Below is a breakdown of the fundamental and operational analysis of SpaceX within the platform.
1. SpaceX Instruments on Binance
TradFi Perpetual Contracts (SPCXUSDT): Binance Futures allows trading leveraged perpetual contracts tied to the stock price of SpaceX (SPCX).
Binance Stocks (Tokenized Shares): Allows placing limit orders for whole/fractional shares tied to the real value of the stock.
Pre-IPO / Synthetic Tokens (e.g., SPCXx): Issued in Binance Web3 Wallet / integrated dApps to provide indirect exposure to the company’s performance.
2. Fundamental Analysis of SpaceX (SPCX)
Positive Catalysts (Bullish Factors)
Starlink Dominance: Its low-Earth-orbit (LEO) satellite internet network is establishing itself as the most profitable division with steady cash flow.
Space Infrastructure Monopoly: SpaceX maintains a virtual commercial monopoly in space launches, government contracts with NASA/the U.S. Department of Defense, and crewed missions.
Starship Potential: The development of reusable heavy-lift vehicles drastically reduces the cost per kilogram launched into orbit.
Technological Synergy (xAI / Grok): The integration of computing and artificial intelligence capabilities strengthens the valuation of the group of companies in its ecosystem
$SPCXB
The Binance ecosystem offers exposure to SpaceX (SPCX) through stock derivatives (Binance Stocks / TradFi Perpetual Contracts) and synthetic/pre-IPO tokens.
Below is a breakdown of the fundamental and operational analysis of SpaceX within the platform.
1. SpaceX Instruments on Binance
TradFi Perpetual Contracts (SPCXUSDT): Binance Futures allows trading leveraged perpetual contracts tied to the stock price of SpaceX (SPCX).
Binance Stocks (Tokenized Shares): Allows placing limit orders for whole/fractional shares tied to the real value of the stock.
Pre-IPO / Synthetic Tokens (e.g., SPCXx): Issued in Binance Web3 Wallet / integrated dApps to provide indirect exposure to the company’s performance.
2. Fundamental Analysis of SpaceX (SPCX)
Positive Catalysts (Bullish Factors)
Starlink Dominance: Its low-Earth-orbit (LEO) satellite internet network is establishing itself as the most profitable division with steady cash flow.
Space Infrastructure Monopoly: SpaceX maintains a virtual commercial monopoly in space launches, government contracts with NASA/the U.S. Department of Defense, and crewed missions.
Starship Potential: The development of reusable heavy-lift vehicles drastically reduces the cost per kilogram launched into orbit.
Technological Synergy (xAI / Grok): The integration of computing and artificial intelligence capabilities strengthens the valuation of the group of companies in its ecosystem
The Binance ecosystem offers exposure to SpaceX (SPCX) through stock derivatives (Binance Stocks / TradFi Perpetual Contracts) and synthetic/pre-IPO tokens.
Below is a breakdown of the fundamental and operational analysis of SpaceX within the platform.
1. SpaceX Instruments on Binance
TradFi Perpetual Contracts (SPCXUSDT): Binance Futures allows trading leveraged perpetual contracts tied to the stock price of SpaceX (SPCX).
Binance Stocks (Tokenized Shares): Allows placing limit orders for whole/fractional shares tied to the real value of the stock.
Pre-IPO / Synthetic Tokens (e.g., SPCXx): Issued in Binance Web3 Wallet / integrated dApps to provide indirect exposure to the company’s performance.
2. Fundamental Analysis of SpaceX (SPCX)
Positive Catalysts (Bullish Factors)
Starlink Dominance: Its low-Earth-orbit (LEO) satellite internet network is establishing itself as the most profitable division with steady cash flow.
Space Infrastructure Monopoly: SpaceX maintains a virtual commercial monopoly in space launches, government contracts with NASA/the U.S. Department of Defense, and crewed missions.
Starship Potential: The development of reusable heavy-lift vehicles drastically reduces the cost per kilogram launched into orbit.
Technological Synergy (xAI / Grok): The integration of computing and artificial intelligence capabilities strengthens the valuation of the group of companies in its ecosystem

1
175
·
--
$PEPE
Key Price Levels
Immediate Resistance: $0,0000048 – $0,0000050 USD. A sustained breakout above this level with high volume opens the path toward secondary resistance near $0,0000055 – $0,0000060 USD.
Key Support: $0,0000035 – $0,0000040 USD. Holding this level prevents invalidation of the short-term bullish structure.
Critical Support: $0,0000020 – $0,0000025 USD (relative historical low of the intermediate trend).
Fundamental Factors and Catalysts
Lack of Native Utility vs. Meme Narrative Dominance: PEPE lacks cash flow, network revenue, or decentralized finance (DeFi) use cases integrated at the protocol level. Its market valuation (around $1.800 – $1.900 million USD) depends entirely on social sentiment, global memecoin liquidity, and derivatives trading volume.
Institutional Interest and ETF Rumors: The filing of registrations (such as Canary Capital's amended S-1 form for a spot PEPE ETF) generates occasional speculative spikes. However, the ETF has not yet received regulatory approval, so it should be classified as an uncertain catalyst and not as a guaranteed fact.
High Leverage in Futures: A significant portion of daily volume comes from positions in the derivatives market. This increases the risk of liquidity sweeps (mass liquidations) during sudden market moves.
$PEPE
Key Price Levels
Immediate Resistance: $0,0000048 – $0,0000050 USD. A sustained breakout above this level with high volume opens the path toward secondary resistance near $0,0000055 – $0,0000060 USD.
Key Support: $0,0000035 – $0,0000040 USD. Holding this level prevents invalidation of the short-term bullish structure.
Critical Support: $0,0000020 – $0,0000025 USD (relative historical low of the intermediate trend).
Fundamental Factors and Catalysts
Lack of Native Utility vs. Meme Narrative Dominance: PEPE lacks cash flow, network revenue, or decentralized finance (DeFi) use cases integrated at the protocol level. Its market valuation (around $1.800 – $1.900 million USD) depends entirely on social sentiment, global memecoin liquidity, and derivatives trading volume.
Institutional Interest and ETF Rumors: The filing of registrations (such as Canary Capital's amended S-1 form for a spot PEPE ETF) generates occasional speculative spikes. However, the ETF has not yet received regulatory approval, so it should be classified as an uncertain catalyst and not as a guaranteed fact.
High Leverage in Futures: A significant portion of daily volume comes from positions in the derivatives market. This increases the risk of liquidity sweeps (mass liquidations) during sudden market moves.
Key Price Levels
Immediate Resistance: $0,0000048 – $0,0000050 USD. A sustained breakout above this level with high volume opens the path toward secondary resistance near $0,0000055 – $0,0000060 USD.
Key Support: $0,0000035 – $0,0000040 USD. Holding this level prevents invalidation of the short-term bullish structure.
Critical Support: $0,0000020 – $0,0000025 USD (relative historical low of the intermediate trend).
Fundamental Factors and Catalysts
Lack of Native Utility vs. Meme Narrative Dominance: PEPE lacks cash flow, network revenue, or decentralized finance (DeFi) use cases integrated at the protocol level. Its market valuation (around $1.800 – $1.900 million USD) depends entirely on social sentiment, global memecoin liquidity, and derivatives trading volume.
Institutional Interest and ETF Rumors: The filing of registrations (such as Canary Capital's amended S-1 form for a spot PEPE ETF) generates occasional speculative spikes. However, the ETF has not yet received regulatory approval, so it should be classified as an uncertain catalyst and not as a guaranteed fact.
High Leverage in Futures: A significant portion of daily volume comes from positions in the derivatives market. This increases the risk of liquidity sweeps (mass liquidations) during sudden market moves.

1
669
·
--
$XRP
Technical Indicators
Daily Chart Structure: Bearish moving average crossovers (Death Cross) are forming in the short term, with the price continuing to trade below the 200-day moving average.
RSI (Relative Strength Index): Near the 40-point level; this reflects weak buying momentum, but the asset has not yet entered deeply oversold territory.
Key Levels to Monitor
Defensive Support ($1.25–$1.27): The most important floor to defend. If the price breaks below this level decisively on volume, the risk of an accelerated decline toward the $1.11–$1.15 zone increases.
Immediate Resistance ($1.36–$1.40): Reclaiming this level would invalidate the immediate bearish pressure and allow a consolidation base to form.
Major Resistance ($1.55–$1.70): A break above this range would confirm a macro structural shift (Bullish Reversal), opening the technical path toward targets of $2.00 USD
$XRP
Technical Indicators
Daily Chart Structure: Bearish moving average crossovers (Death Cross) are forming in the short term, with the price continuing to trade below the 200-day moving average.
RSI (Relative Strength Index): Near the 40-point level; this reflects weak buying momentum, but the asset has not yet entered deeply oversold territory.
Key Levels to Monitor
Defensive Support ($1.25–$1.27): The most important floor to defend. If the price breaks below this level decisively on volume, the risk of an accelerated decline toward the $1.11–$1.15 zone increases.
Immediate Resistance ($1.36–$1.40): Reclaiming this level would invalidate the immediate bearish pressure and allow a consolidation base to form.
Major Resistance ($1.55–$1.70): A break above this range would confirm a macro structural shift (Bullish Reversal), opening the technical path toward targets of $2.00 USD
Technical Indicators
Daily Chart Structure: Bearish moving average crossovers (Death Cross) are forming in the short term, with the price continuing to trade below the 200-day moving average.
RSI (Relative Strength Index): Near the 40-point level; this reflects weak buying momentum, but the asset has not yet entered deeply oversold territory.
Key Levels to Monitor
Defensive Support ($1.25–$1.27): The most important floor to defend. If the price breaks below this level decisively on volume, the risk of an accelerated decline toward the $1.11–$1.15 zone increases.
Immediate Resistance ($1.36–$1.40): Reclaiming this level would invalidate the immediate bearish pressure and allow a consolidation base to form.
Major Resistance ($1.55–$1.70): A break above this range would confirm a macro structural shift (Bullish Reversal), opening the technical path toward targets of $2.00 USD

2
236
·
--
$BTC
{future}(BTCUSDT)
Overall Market Overview (October 21, 2026)
Bitcoin (BTC) is trading around $83,300 USD, showing a slight intraday rebound of +1.5% to +2.3% after successfully defending the key support zone at $80,000–$81,000 USD over the past week.
The price is trapped within a consolidation range between $79,800 and $87,300 USD.
Technical Analysis & Key Levels
1. Support and Resistance
Immediate Resistance: $84,000–$84,500 USD. This is the short-term rejection zone, where sell orders on lower timeframes (1H / 4H) are concentrated.
Major Resistance: $87,000–$87,360 USD. The ceiling of the current sideways range. A sustained breakout above this level would reopen the path toward the broader bullish structure.
Immediate Support: $81,200–$82,000 USD (recently defended by the daily Moving Average / EMA).
Critical Support: $79,800–$80,500 USD. Losing this zone would trigger a deeper correction scenario toward the $75,000–$78,000 USD zone.
2. Technical Indicators
RSI (4H / Daily): In neutral/moderate territory near 50–55 points, suggesting a temporary balance between buying and selling pressure.
Daily Chart Structure: Continuation of the consolidation phase within a broad channel. As long as BTC does not fall below $80,000 USD, the broader structure retains a bullish or recovery bias
$BTC
Overall Market Overview (October 21, 2026)
Bitcoin (BTC) is trading around $83,300 USD, showing a slight intraday rebound of +1.5% to +2.3% after successfully defending the key support zone at $80,000–$81,000 USD over the past week.
The price is trapped within a consolidation range between $79,800 and $87,300 USD.
Technical Analysis & Key Levels
1. Support and Resistance
Immediate Resistance: $84,000–$84,500 USD. This is the short-term rejection zone, where sell orders on lower timeframes (1H / 4H) are concentrated.
Major Resistance: $87,000–$87,360 USD. The ceiling of the current sideways range. A sustained breakout above this level would reopen the path toward the broader bullish structure.
Immediate Support: $81,200–$82,000 USD (recently defended by the daily Moving Average / EMA).
Critical Support: $79,800–$80,500 USD. Losing this zone would trigger a deeper correction scenario toward the $75,000–$78,000 USD zone.
2. Technical Indicators
RSI (4H / Daily): In neutral/moderate territory near 50–55 points, suggesting a temporary balance between buying and selling pressure.
Daily Chart Structure: Continuation of the consolidation phase within a broad channel. As long as BTC does not fall below $80,000 USD, the broader structure retains a bullish or recovery bias
Overall Market Overview (October 21, 2026)
Bitcoin (BTC) is trading around $83,300 USD, showing a slight intraday rebound of +1.5% to +2.3% after successfully defending the key support zone at $80,000–$81,000 USD over the past week.
The price is trapped within a consolidation range between $79,800 and $87,300 USD.
Technical Analysis & Key Levels
1. Support and Resistance
Immediate Resistance: $84,000–$84,500 USD. This is the short-term rejection zone, where sell orders on lower timeframes (1H / 4H) are concentrated.
Major Resistance: $87,000–$87,360 USD. The ceiling of the current sideways range. A sustained breakout above this level would reopen the path toward the broader bullish structure.
Immediate Support: $81,200–$82,000 USD (recently defended by the daily Moving Average / EMA).
Critical Support: $79,800–$80,500 USD. Losing this zone would trigger a deeper correction scenario toward the $75,000–$78,000 USD zone.
2. Technical Indicators
RSI (4H / Daily): In neutral/moderate territory near 50–55 points, suggesting a temporary balance between buying and selling pressure.
Daily Chart Structure: Continuation of the consolidation phase within a broad channel. As long as BTC does not fall below $80,000 USD, the broader structure retains a bullish or recovery bias

1
598
·
--
$XRP
The XRP/USDT pair on Binance is showing critical technical consolidation after retreating from its local highs of $1.50. The market reflects indecision, trading within a narrow range while absorbing selling pressure.
📊 1. Market Overview (Binance USDT)
Current Price: ~$1.30–$1.34 USD
Key Support: $1.28–$1.29 (A zone defended by the 200-day EMA and institutional buying).
Main Resistance: $1.37–$1.40 (Immediate ceiling and reversal neckline).
Overall Sentiment: Neutral / Cautious.
📈 2. Technical Analysis (Key Levels)
Technical Indicators
Moving Averages (EMA): The price is trading below the 20- and 50-period EMAs (short-term bearish pressure), but remains above the 200-day EMA ($1.28), keeping the long-term bullish structure intact.
RSI (14) & MACD: The RSI remains weak, below 50. The MACD remains in negative territory, confirming that buying momentum has not yet taken definitive control.
Reversal Pattern (Double Bottom): There are signs of a double-bottom formation between $1.28 and $1.30, but confirmation requires a daily close above $1.40 on high volume.
$XRP
The XRP/USDT pair on Binance is showing critical technical consolidation after retreating from its local highs of $1.50. The market reflects indecision, trading within a narrow range while absorbing selling pressure.
📊 1. Market Overview (Binance USDT)
Current Price: ~$1.30–$1.34 USD
Key Support: $1.28–$1.29 (A zone defended by the 200-day EMA and institutional buying).
Main Resistance: $1.37–$1.40 (Immediate ceiling and reversal neckline).
Overall Sentiment: Neutral / Cautious.
📈 2. Technical Analysis (Key Levels)
Technical Indicators
Moving Averages (EMA): The price is trading below the 20- and 50-period EMAs (short-term bearish pressure), but remains above the 200-day EMA ($1.28), keeping the long-term bullish structure intact.
RSI (14) & MACD: The RSI remains weak, below 50. The MACD remains in negative territory, confirming that buying momentum has not yet taken definitive control.
Reversal Pattern (Double Bottom): There are signs of a double-bottom formation between $1.28 and $1.30, but confirmation requires a daily close above $1.40 on high volume.
The XRP/USDT pair on Binance is showing critical technical consolidation after retreating from its local highs of $1.50. The market reflects indecision, trading within a narrow range while absorbing selling pressure.
📊 1. Market Overview (Binance USDT)
Current Price: ~$1.30–$1.34 USD
Key Support: $1.28–$1.29 (A zone defended by the 200-day EMA and institutional buying).
Main Resistance: $1.37–$1.40 (Immediate ceiling and reversal neckline).
Overall Sentiment: Neutral / Cautious.
📈 2. Technical Analysis (Key Levels)
Technical Indicators
Moving Averages (EMA): The price is trading below the 20- and 50-period EMAs (short-term bearish pressure), but remains above the 200-day EMA ($1.28), keeping the long-term bullish structure intact.
RSI (14) & MACD: The RSI remains weak, below 50. The MACD remains in negative territory, confirming that buying momentum has not yet taken definitive control.
Reversal Pattern (Double Bottom): There are signs of a double-bottom formation between $1.28 and $1.30, but confirmation requires a daily close above $1.40 on high volume.

1
162
·
--
$PEPE
. Sentiment and Volume Diagnosis
Volume of Trading: Although PEPE has recorded occasional intraday bounces of up to 4.5%, trading volume remains approximately 30% below its monthly average. Without a significant increase in liquidity, the strength of the rallies remains unconfirmed.
Crypto Independence vs. Correlation: PEPE continues to be highly sensitive to the movements of Bitcoin ($BTC) and Ethereum ($ETH), functioning with a high beta (it moves with greater magnitude than major assets both to the upside and downside).
Lack of Pure Fundamentals: As a meme coin with no inherent DeFi utility or staking use case, the price responds almost exclusively to social media sentiment, speculative liquidity, and capital rotation within the meme ecosystem.
4. Projection Scenarios
Bullish Scenario: Confirmation of a close above $0.0000042 USD accompanied by increasing volume. This would open the door to targeting higher objectives near $0.0000049–$0.0000057 USD.
Consolidation Scenario (Current Consensus): Trading within the $0.0000037 – $0.0000041 USD range while overall market volume remains subdued.
Bearish Scenario: Losing the $0.0000037 USD support level would invalidate the technical recovery attempt, driving corrections toward the area of
$PEPE
. Sentiment and Volume Diagnosis
Volume of Trading: Although PEPE has recorded occasional intraday bounces of up to 4.5%, trading volume remains approximately 30% below its monthly average. Without a significant increase in liquidity, the strength of the rallies remains unconfirmed.
Crypto Independence vs. Correlation: PEPE continues to be highly sensitive to the movements of Bitcoin ($BTC) and Ethereum ($ETH), functioning with a high beta (it moves with greater magnitude than major assets both to the upside and downside).
Lack of Pure Fundamentals: As a meme coin with no inherent DeFi utility or staking use case, the price responds almost exclusively to social media sentiment, speculative liquidity, and capital rotation within the meme ecosystem.
4. Projection Scenarios
Bullish Scenario: Confirmation of a close above $0.0000042 USD accompanied by increasing volume. This would open the door to targeting higher objectives near $0.0000049–$0.0000057 USD.
Consolidation Scenario (Current Consensus): Trading within the $0.0000037 – $0.0000041 USD range while overall market volume remains subdued.
Bearish Scenario: Losing the $0.0000037 USD support level would invalidate the technical recovery attempt, driving corrections toward the area of
. Sentiment and Volume Diagnosis
Volume of Trading: Although PEPE has recorded occasional intraday bounces of up to 4.5%, trading volume remains approximately 30% below its monthly average. Without a significant increase in liquidity, the strength of the rallies remains unconfirmed.
Crypto Independence vs. Correlation: PEPE continues to be highly sensitive to the movements of Bitcoin ($BTC) and Ethereum ($ETH), functioning with a high beta (it moves with greater magnitude than major assets both to the upside and downside).
Lack of Pure Fundamentals: As a meme coin with no inherent DeFi utility or staking use case, the price responds almost exclusively to social media sentiment, speculative liquidity, and capital rotation within the meme ecosystem.
4. Projection Scenarios
Bullish Scenario: Confirmation of a close above $0.0000042 USD accompanied by increasing volume. This would open the door to targeting higher objectives near $0.0000049–$0.0000057 USD.
Consolidation Scenario (Current Consensus): Trading within the $0.0000037 – $0.0000041 USD range while overall market volume remains subdued.
Bearish Scenario: Losing the $0.0000037 USD support level would invalidate the technical recovery attempt, driving corrections toward the area of

2
111
·
--
$PEPE
{spot}(PEPEUSDT)
General Analysis of Pepe Coin ($PEPE)
1. Market Situation and Key Metrics
Current Price: Trading in the range of $0.0000041–$0.0000042 USD.
Market Capitalization: Approximately $1.71 billion USD, placing it among the top 60 cryptocurrencies.
Daily Volume: Around $320 million USD, maintaining stable liquidity within the 30-day average range (+0.38%).
Distance from All-Time High (ATH): Approximately 85% below its all-time high of $0.0000281 USD (reached in late 2024).
2. Technical Analysis
Price Structure and Range: The token is moving in a sideways/consolidation channel between $0.0000038 and $0.0000042 USD.
Technical Indicators:
RSI (Relative Strength Index): Around 51–55 (neutral territory), with no clear signs of overbought or oversold conditions.
Moving Averages (SMA 7, 20, 30): Clustered around the current price ($0.0000040–$0.0000041 USD), confirming an accumulation/waiting phase before an impulsive move.
Key Technical Levels:
Main Resistance: $0.0000042–$0.0000049 USD. A break above this level with confirmed volume would open the way toward the $0.00000535–$0.00000595 USD zone.
Primary Support: $0.0000038–$0.0000039 USD.
Critical Support: $0.0000034 USD. A break below this level invalidates the short-term bullish scenario.
zo.
3. Fundamental Analysis and Network Structure
Holder Concentration (Whale Effect): The distribution is highly concentrated; the top 100 wallets hold around 76% of the supply. This means large whale movements or exchange liquidations can cause significant volatility unpredictably.
Utility and Performance: PEPE does not have its own smart contract ecosystem (unlike projects such as Shiba Inu with Shibarium), nor does it generate fee revenue. Its performance depends on pure liquidity, social media sentiment, and “risk-on” phases
$PEPE
General Analysis of Pepe Coin ($PEPE )
1. Market Situation and Key Metrics
Current Price: Trading in the range of $0.0000041–$0.0000042 USD.
Market Capitalization: Approximately $1.71 billion USD, placing it among the top 60 cryptocurrencies.
Daily Volume: Around $320 million USD, maintaining stable liquidity within the 30-day average range (+0.38%).
Distance from All-Time High (ATH): Approximately 85% below its all-time high of $0.0000281 USD (reached in late 2024).
2. Technical Analysis
Price Structure and Range: The token is moving in a sideways/consolidation channel between $0.0000038 and $0.0000042 USD.
Technical Indicators:
RSI (Relative Strength Index): Around 51–55 (neutral territory), with no clear signs of overbought or oversold conditions.
Moving Averages (SMA 7, 20, 30): Clustered around the current price ($0.0000040–$0.0000041 USD), confirming an accumulation/waiting phase before an impulsive move.
Key Technical Levels:
Main Resistance: $0.0000042–$0.0000049 USD. A break above this level with confirmed volume would open the way toward the $0.00000535–$0.00000595 USD zone.
Primary Support: $0.0000038–$0.0000039 USD.
Critical Support: $0.0000034 USD. A break below this level invalidates the short-term bullish scenario.
zo.
3. Fundamental Analysis and Network Structure
Holder Concentration (Whale Effect): The distribution is highly concentrated; the top 100 wallets hold around 76% of the supply. This means large whale movements or exchange liquidations can cause significant volatility unpredictably.
Utility and Performance: PEPE does not have its own smart contract ecosystem (unlike projects such as Shiba Inu with Shibarium), nor does it generate fee revenue. Its performance depends on pure liquidity, social media sentiment, and “risk-on” phases
General Analysis of Pepe Coin ($PEPE )
1. Market Situation and Key Metrics
Current Price: Trading in the range of $0.0000041–$0.0000042 USD.
Market Capitalization: Approximately $1.71 billion USD, placing it among the top 60 cryptocurrencies.
Daily Volume: Around $320 million USD, maintaining stable liquidity within the 30-day average range (+0.38%).
Distance from All-Time High (ATH): Approximately 85% below its all-time high of $0.0000281 USD (reached in late 2024).
2. Technical Analysis
Price Structure and Range: The token is moving in a sideways/consolidation channel between $0.0000038 and $0.0000042 USD.
Technical Indicators:
RSI (Relative Strength Index): Around 51–55 (neutral territory), with no clear signs of overbought or oversold conditions.
Moving Averages (SMA 7, 20, 30): Clustered around the current price ($0.0000040–$0.0000041 USD), confirming an accumulation/waiting phase before an impulsive move.
Key Technical Levels:
Main Resistance: $0.0000042–$0.0000049 USD. A break above this level with confirmed volume would open the way toward the $0.00000535–$0.00000595 USD zone.
Primary Support: $0.0000038–$0.0000039 USD.
Critical Support: $0.0000034 USD. A break below this level invalidates the short-term bullish scenario.
zo.
3. Fundamental Analysis and Network Structure
Holder Concentration (Whale Effect): The distribution is highly concentrated; the top 100 wallets hold around 76% of the supply. This means large whale movements or exchange liquidations can cause significant volatility unpredictably.
Utility and Performance: PEPE does not have its own smart contract ecosystem (unlike projects such as Shiba Inu with Shibarium), nor does it generate fee revenue. Its performance depends on pure liquidity, social media sentiment, and “risk-on” phases

2
3
1.2k
·
--
$KMNO
The cryptocurrency market is going through a period of strategic consolidation and profit-taking, after recording significant price peaks for its major assets.
1. Current Market Context (Overview)
Global Market Capitalization: The total market is around $2.8 to $2.88 trillion, maintaining a solid structure despite occasional corrections.
Bitcoin Dominance (BTC): It accounts for approximately 58%–59% of global market capitalization, acting as the main driver and barometer of confidence.
Market Sentiment: The Fear & Greed Index is in the Fear/Neutral range (~41), which often occurs during phases when large institutional investors and long-term investors secure liquidity after an upward move.
2. Analysis of “Profit-Taking”
Profit-taking occurs when investors sell assets that have increased in value to realize their returns in fiat currency (USD/EUR) or stablecoins (USDT, USDC).
Recent Bitcoin Movements:
Events involving massive profit realization were recorded, with realized gains exceeding $1 billion per day, marking one of the highest profit-taking peaks of the year.
Despite this, price corrections (with BTC trading and consolidating in the $81,000–$86,000 USD range) are in line with the normal pullback metrics of a historical bull cycle (pullbacks of between 7% and 15%).
Impact on Altcoins:
While Bitcoin consolidates, some capital has rotated into selected altcoins or higher-risk assets (such as memecoins, layer-1 tokens, and infrastructure tokens).
However, when liquidity flowing into Bitcoin contracts due to profit-taking, altcoins experience increased volatility
$KMNO
The cryptocurrency market is going through a period of strategic consolidation and profit-taking, after recording significant price peaks for its major assets.
1. Current Market Context (Overview)
Global Market Capitalization: The total market is around $2.8 to $2.88 trillion, maintaining a solid structure despite occasional corrections.
Bitcoin Dominance (BTC): It accounts for approximately 58%–59% of global market capitalization, acting as the main driver and barometer of confidence.
Market Sentiment: The Fear & Greed Index is in the Fear/Neutral range (~41), which often occurs during phases when large institutional investors and long-term investors secure liquidity after an upward move.
2. Analysis of “Profit-Taking”
Profit-taking occurs when investors sell assets that have increased in value to realize their returns in fiat currency (USD/EUR) or stablecoins (USDT, USDC).
Recent Bitcoin Movements:
Events involving massive profit realization were recorded, with realized gains exceeding $1 billion per day, marking one of the highest profit-taking peaks of the year.
Despite this, price corrections (with BTC trading and consolidating in the $81,000–$86,000 USD range) are in line with the normal pullback metrics of a historical bull cycle (pullbacks of between 7% and 15%).
Impact on Altcoins:
While Bitcoin consolidates, some capital has rotated into selected altcoins or higher-risk assets (such as memecoins, layer-1 tokens, and infrastructure tokens).
However, when liquidity flowing into Bitcoin contracts due to profit-taking, altcoins experience increased volatility
The cryptocurrency market is going through a period of strategic consolidation and profit-taking, after recording significant price peaks for its major assets.
1. Current Market Context (Overview)
Global Market Capitalization: The total market is around $2.8 to $2.88 trillion, maintaining a solid structure despite occasional corrections.
Bitcoin Dominance (BTC): It accounts for approximately 58%–59% of global market capitalization, acting as the main driver and barometer of confidence.
Market Sentiment: The Fear & Greed Index is in the Fear/Neutral range (~41), which often occurs during phases when large institutional investors and long-term investors secure liquidity after an upward move.
2. Analysis of “Profit-Taking”
Profit-taking occurs when investors sell assets that have increased in value to realize their returns in fiat currency (USD/EUR) or stablecoins (USDT, USDC).
Recent Bitcoin Movements:
Events involving massive profit realization were recorded, with realized gains exceeding $1 billion per day, marking one of the highest profit-taking peaks of the year.
Despite this, price corrections (with BTC trading and consolidating in the $81,000–$86,000 USD range) are in line with the normal pullback metrics of a historical bull cycle (pullbacks of between 7% and 15%).
Impact on Altcoins:
While Bitcoin consolidates, some capital has rotated into selected altcoins or higher-risk assets (such as memecoins, layer-1 tokens, and infrastructure tokens).
However, when liquidity flowing into Bitcoin contracts due to profit-taking, altcoins experience increased volatility

1
122
·
--
$PEPE
Executive Summary
As of October 12, 2026, Pepe Coin ($PEPE) is trading at around USD $0.00000412–$0.00000420. After a slight intraday rebound of ~5.4%, the token is trying to hold short-term support, although it is trading on below-average monthly volume, with mixed signals from its main technical indicators.
1. Current Technical Overview
Current price: ~USD $0.00000412–$0.00000420.
Market capitalization: ~$1.73–$1.75 billion USD.
24-hour volume: ~$200–$240 million USD (around 34% below its 30-day average).
RSI (14-day): 53.1 — A neutral level reflecting indecision, without entering overbought territory.
MACD: Maintains a slightly bearish reading, warning that the current rebound still lacks strong buying momentum.
$PEPE
Executive Summary
As of October 12, 2026, Pepe Coin ($PEPE ) is trading at around USD $0.00000412–$0.00000420. After a slight intraday rebound of ~5.4%, the token is trying to hold short-term support, although it is trading on below-average monthly volume, with mixed signals from its main technical indicators.
1. Current Technical Overview
Current price: ~USD $0.00000412–$0.00000420.
Market capitalization: ~$1.73–$1.75 billion USD.
24-hour volume: ~$200–$240 million USD (around 34% below its 30-day average).
RSI (14-day): 53.1 — A neutral level reflecting indecision, without entering overbought territory.
MACD: Maintains a slightly bearish reading, warning that the current rebound still lacks strong buying momentum.
Executive Summary
As of October 12, 2026, Pepe Coin ($PEPE ) is trading at around USD $0.00000412–$0.00000420. After a slight intraday rebound of ~5.4%, the token is trying to hold short-term support, although it is trading on below-average monthly volume, with mixed signals from its main technical indicators.
1. Current Technical Overview
Current price: ~USD $0.00000412–$0.00000420.
Market capitalization: ~$1.73–$1.75 billion USD.
24-hour volume: ~$200–$240 million USD (around 34% below its 30-day average).
RSI (14-day): 53.1 — A neutral level reflecting indecision, without entering overbought territory.
MACD: Maintains a slightly bearish reading, warning that the current rebound still lacks strong buying momentum.

2
888
·
--
$XRP
XRP is trading around $1.40–$1.41 USD, showing short-term bearish pressure and testing key support levels, with trading volume below its monthly average.
Technical Context
Current price: ~$1.40–$1.41 USD.
Critical support: $1.39–$1.40 USD (recent and intraday lows). If this level breaks on volume, the price could move toward the $1.26–$1.30 USD zone.
Immediate resistance: $1.42–$1.44 USD (VWAP zone). A break above it would open the way toward $1.49–$1.52 USD.
Indicators: The relatively weak RSI (between 32 and 46, depending on the time frame) and a MACD in bearish territory reflect temporary seller control, limiting buying momentum.
Market Forces
Institutional & Network: Despite technical weakness, Ripple's institutional progress (such as the adoption of its stablecoin) provides a supportive medium-term narrative, although it has yet to translate into sufficient direct spot demand.
Weak Volume: The lack of strong buying liquidity suggests caution among traders, with price remaining in a range-bound consolidation as the market awaits a clear macroeconomic or regulatory catalyst.
Trading Scenarios
Bullish: Confirmation with a sustained close above $1.44–$1.50 USD, accompanied by a clear increase in volume.
Bearish / Caution: A decisive break below $1.39 USD, projecting further downside toward $1.26 USD
$XRP
XRP is trading around $1.40–$1.41 USD, showing short-term bearish pressure and testing key support levels, with trading volume below its monthly average.
Technical Context
Current price: ~$1.40–$1.41 USD.
Critical support: $1.39–$1.40 USD (recent and intraday lows). If this level breaks on volume, the price could move toward the $1.26–$1.30 USD zone.
Immediate resistance: $1.42–$1.44 USD (VWAP zone). A break above it would open the way toward $1.49–$1.52 USD.
Indicators: The relatively weak RSI (between 32 and 46, depending on the time frame) and a MACD in bearish territory reflect temporary seller control, limiting buying momentum.
Market Forces
Institutional & Network: Despite technical weakness, Ripple's institutional progress (such as the adoption of its stablecoin) provides a supportive medium-term narrative, although it has yet to translate into sufficient direct spot demand.
Weak Volume: The lack of strong buying liquidity suggests caution among traders, with price remaining in a range-bound consolidation as the market awaits a clear macroeconomic or regulatory catalyst.
Trading Scenarios
Bullish: Confirmation with a sustained close above $1.44–$1.50 USD, accompanied by a clear increase in volume.
Bearish / Caution: A decisive break below $1.39 USD, projecting further downside toward $1.26 USD
XRP is trading around $1.40–$1.41 USD, showing short-term bearish pressure and testing key support levels, with trading volume below its monthly average.
Technical Context
Current price: ~$1.40–$1.41 USD.
Critical support: $1.39–$1.40 USD (recent and intraday lows). If this level breaks on volume, the price could move toward the $1.26–$1.30 USD zone.
Immediate resistance: $1.42–$1.44 USD (VWAP zone). A break above it would open the way toward $1.49–$1.52 USD.
Indicators: The relatively weak RSI (between 32 and 46, depending on the time frame) and a MACD in bearish territory reflect temporary seller control, limiting buying momentum.
Market Forces
Institutional & Network: Despite technical weakness, Ripple's institutional progress (such as the adoption of its stablecoin) provides a supportive medium-term narrative, although it has yet to translate into sufficient direct spot demand.
Weak Volume: The lack of strong buying liquidity suggests caution among traders, with price remaining in a range-bound consolidation as the market awaits a clear macroeconomic or regulatory catalyst.
Trading Scenarios
Bullish: Confirmation with a sustained close above $1.44–$1.50 USD, accompanied by a clear increase in volume.
Bearish / Caution: A decisive break below $1.39 USD, projecting further downside toward $1.26 USD

4
838
Log in to explore more content
Join global crypto users on Binance Square
⚡️ Get latest and useful information about crypto.
💬 Trusted by the world’s largest crypto exchange.
👍 Discover real insights from verified creators.
Email / Phone number
Trending Topics
HotCPIDecemberHikePriced
137,571 views
1,563 Discussing
CPI Market Watch | US CPI Rises 0.4% in October, Hotter Than 0.3% Forecast
Binance News
·28 Likes
·42k views
AnthropicRejectsIPODelayValuationinQuestion
253,181 views
2,153 Discussing
CanNvidiaEarningsEaseMarketConcerns?
49,983 views
721 Discussing