

森林策略每日免费分享
3.1k Posts

森林策略每日免费分享
Report
Block User
每日免费分享合约策略,采用实时数据。

XDP Holder
High-Frequency Trader
5.4 Years
69 Following
247 Followers
592 Liked
Posts
All
Quotes
·
--
Bullish
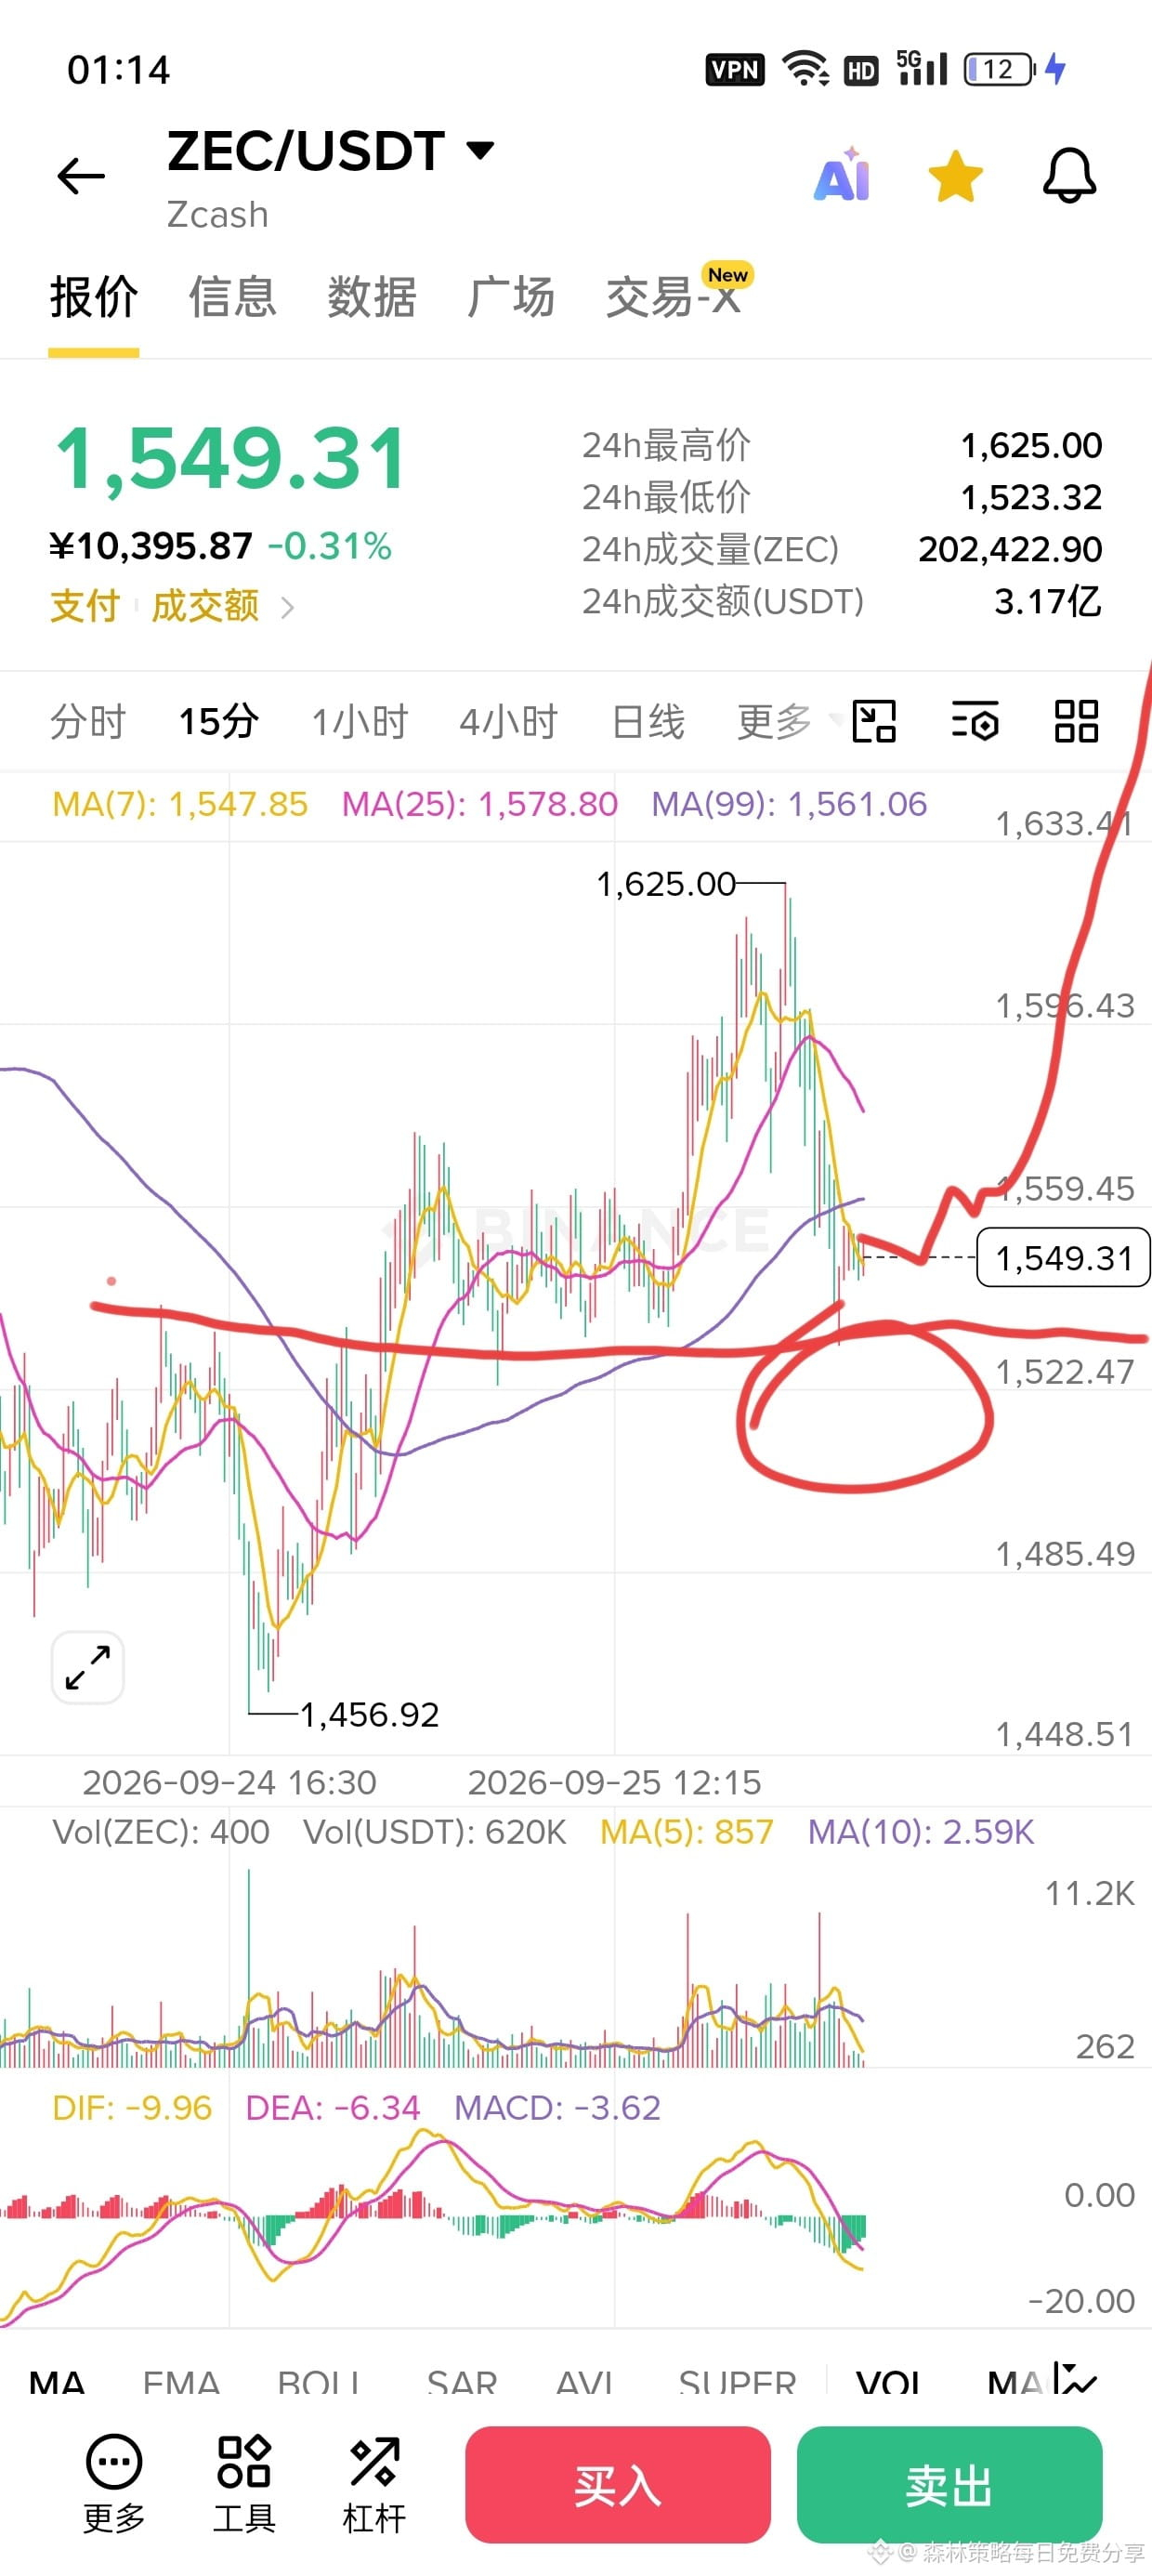
$ZEC scanned liquidity below, and then it will rise to break above the previous high. So it's bullish: enter at the current price, stop loss at 1525, take profit at 1610-1650. This is a strategy with a very high risk-reward ratio to avoid getting wicked out
{future}(ZECUSDT)
$ZEC scanned liquidity below, and then it will rise to break above the previous high. So it's bullish: enter at the current price, stop loss at 1525, take profit at 1610-1650. This is a strategy with a very high risk-reward ratio to avoid getting wicked out
329
·
--
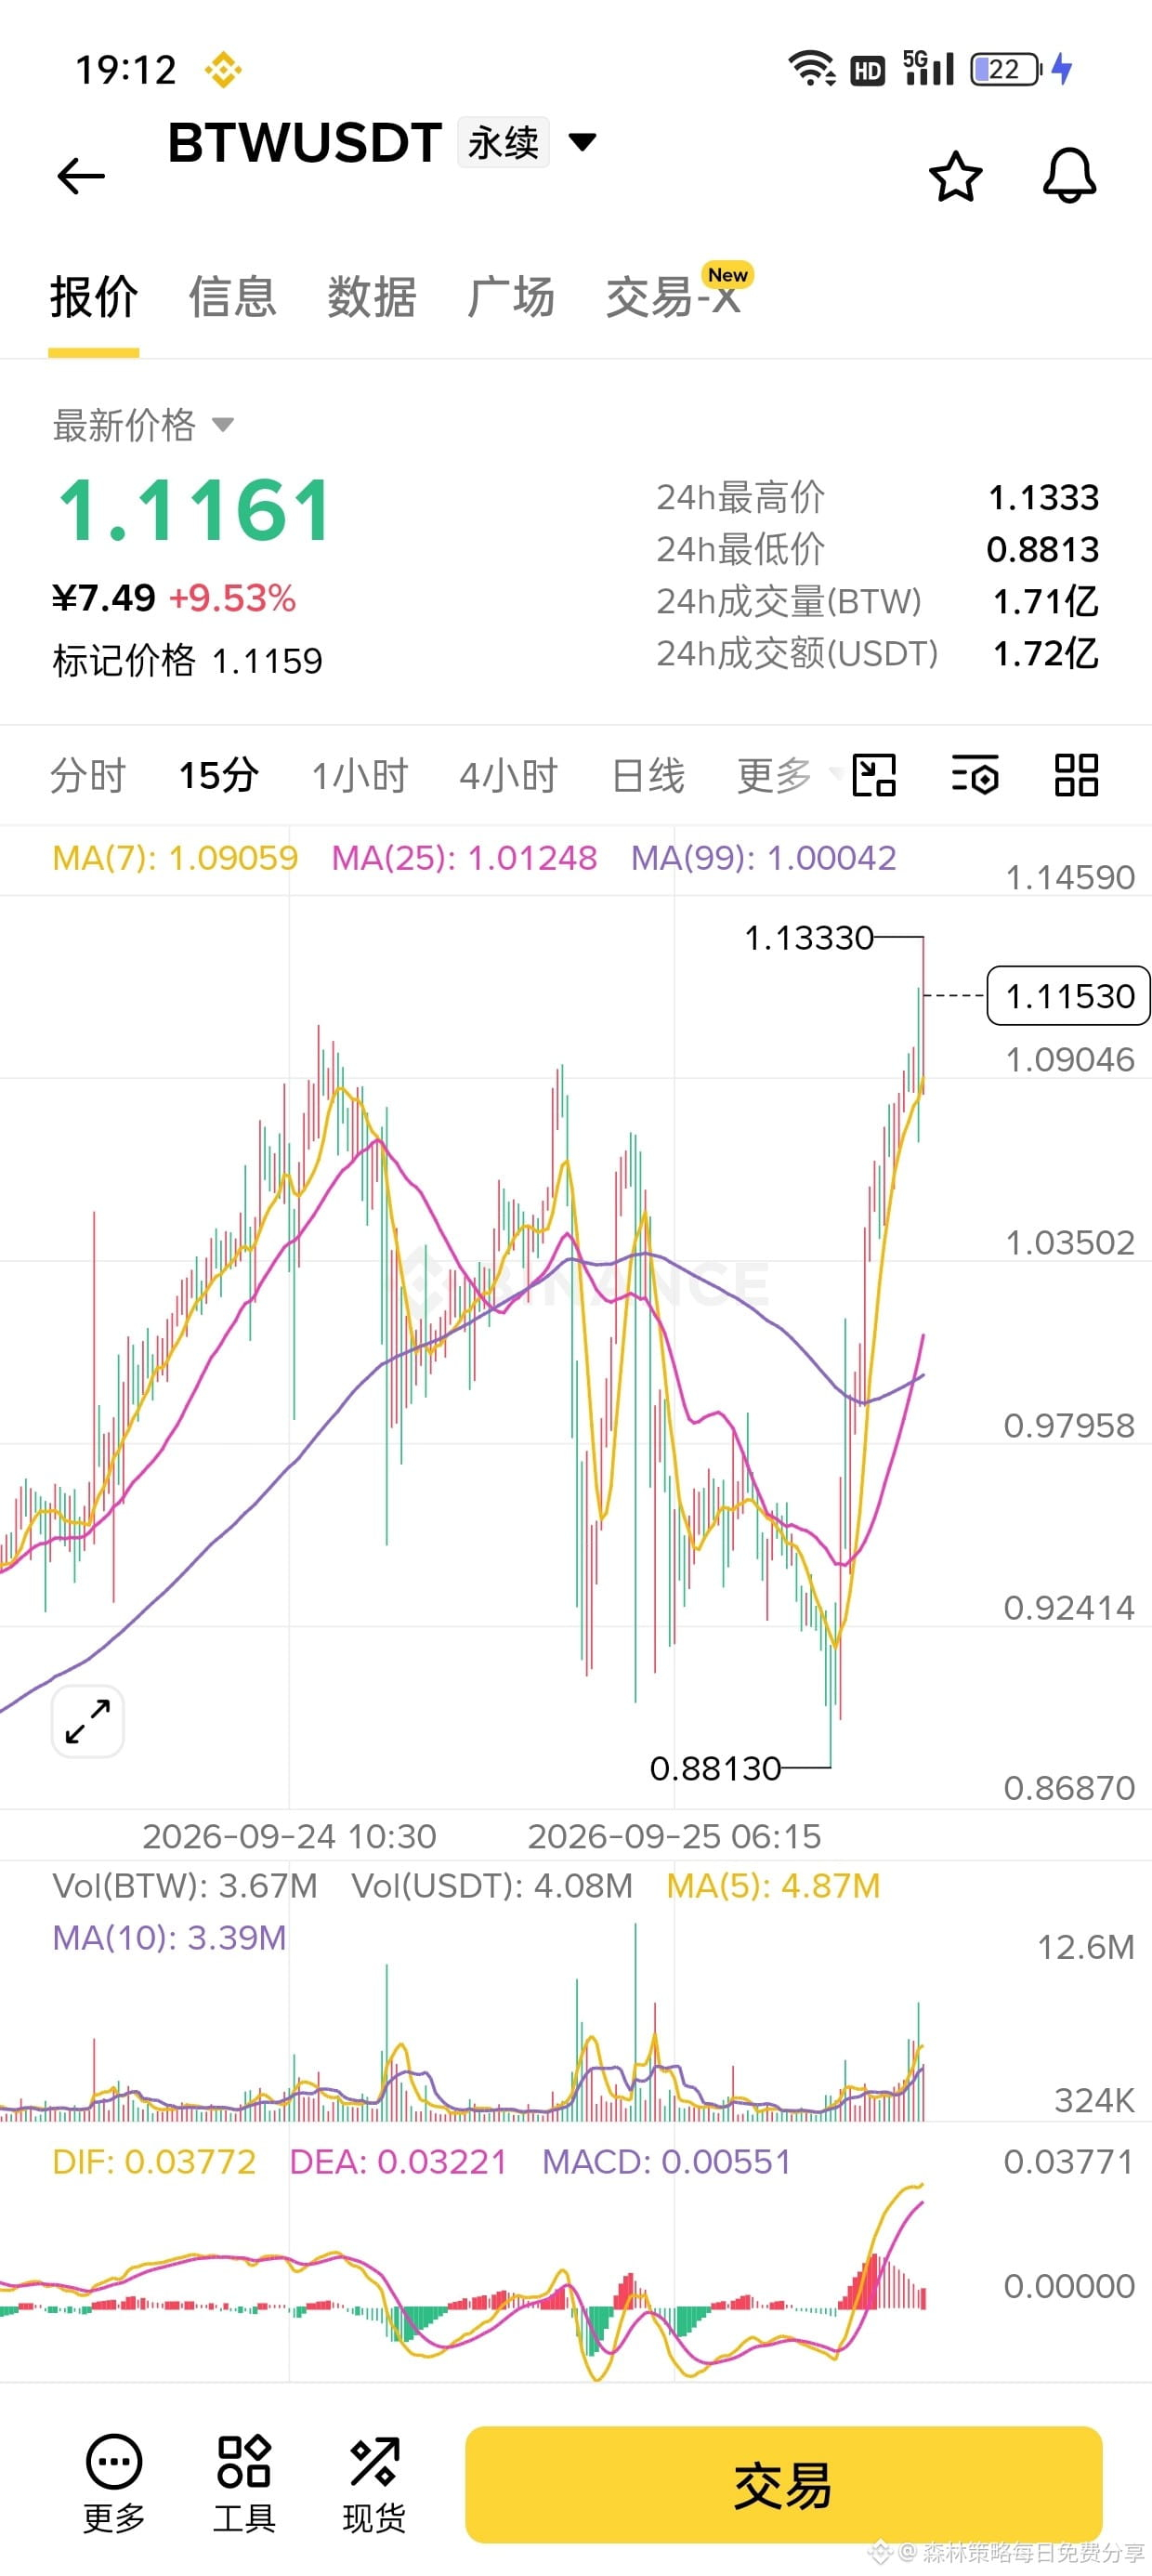
$BTW 10月2日 unlock about 100 million coins, but the details are that it isn’t unlocked for retail investors. Don’t see the unlocking of 100 million coins and think it’s time to dump the market. Don’t short this coin casually. Up to now, the circulating supply is 2.8 billion, with a total supply of 10 billion. The remaining 7.2 billion has not been unlocked yet. The real time when it will be unlocked for retail investors is in 2027, in March. So it’s not recommended to short it. Of course, in the long run you can short it, but you must be able to withstand it through the process, and this is a very long one~
{future}(BTWUSDT)
$BTW 10月2日 unlock about 100 million coins, but the details are that it isn’t unlocked for retail investors. Don’t see the unlocking of 100 million coins and think it’s time to dump the market. Don’t short this coin casually. Up to now, the circulating supply is 2.8 billion, with a total supply of 10 billion. The remaining 7.2 billion has not been unlocked yet. The real time when it will be unlocked for retail investors is in 2027, in March. So it’s not recommended to short it. Of course, in the long run you can short it, but you must be able to withstand it through the process, and this is a very long one~
1
1.1k
·
--
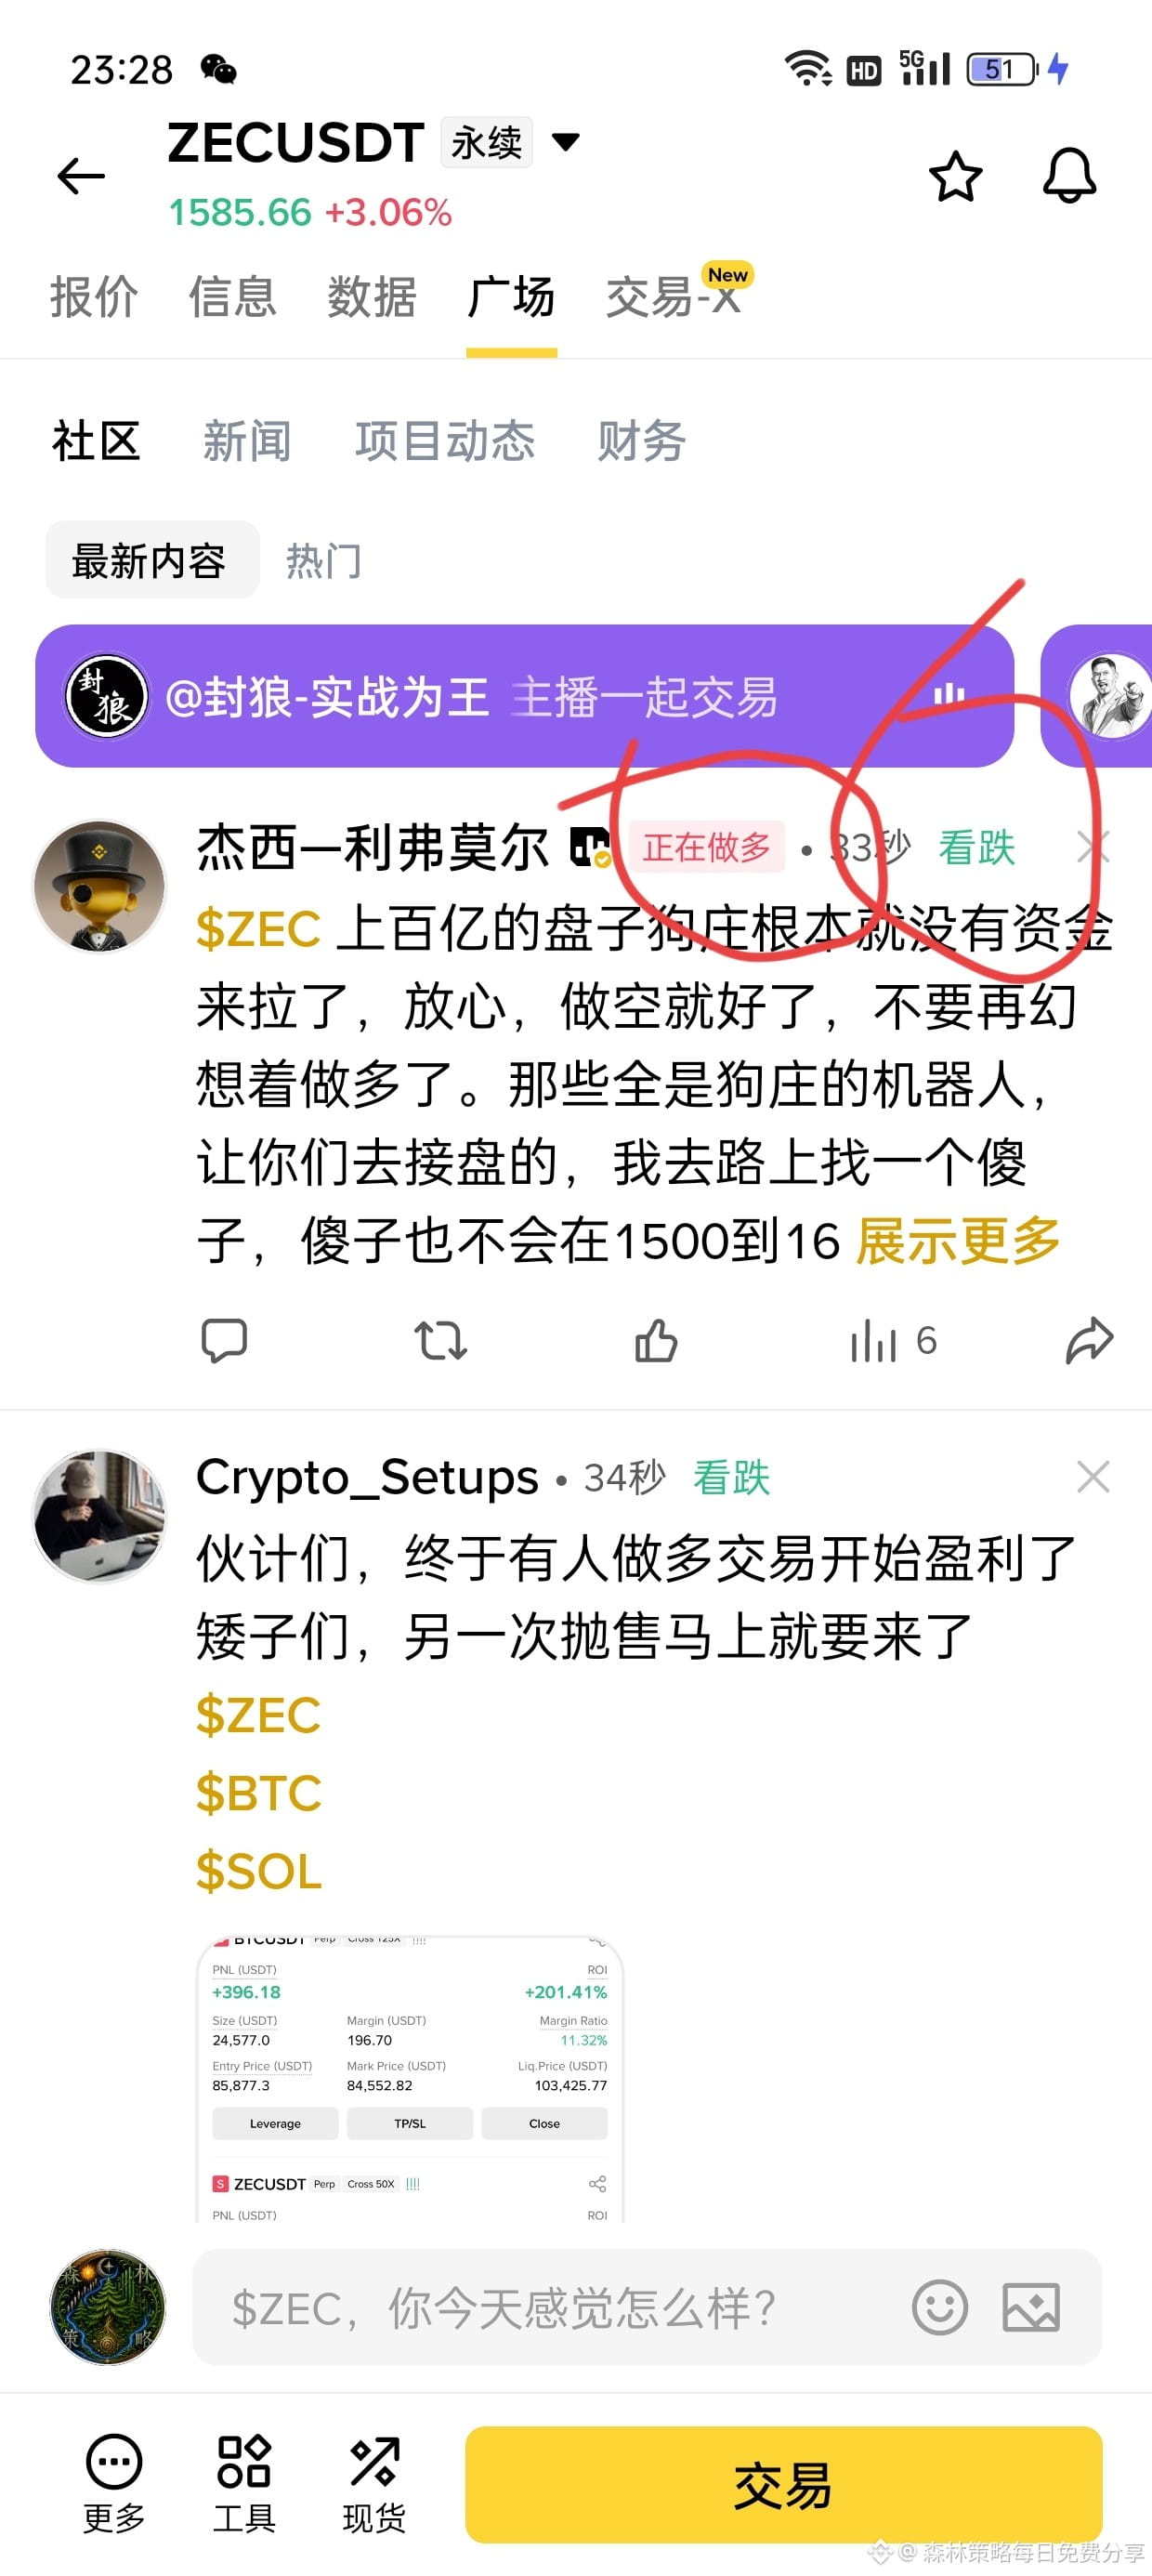
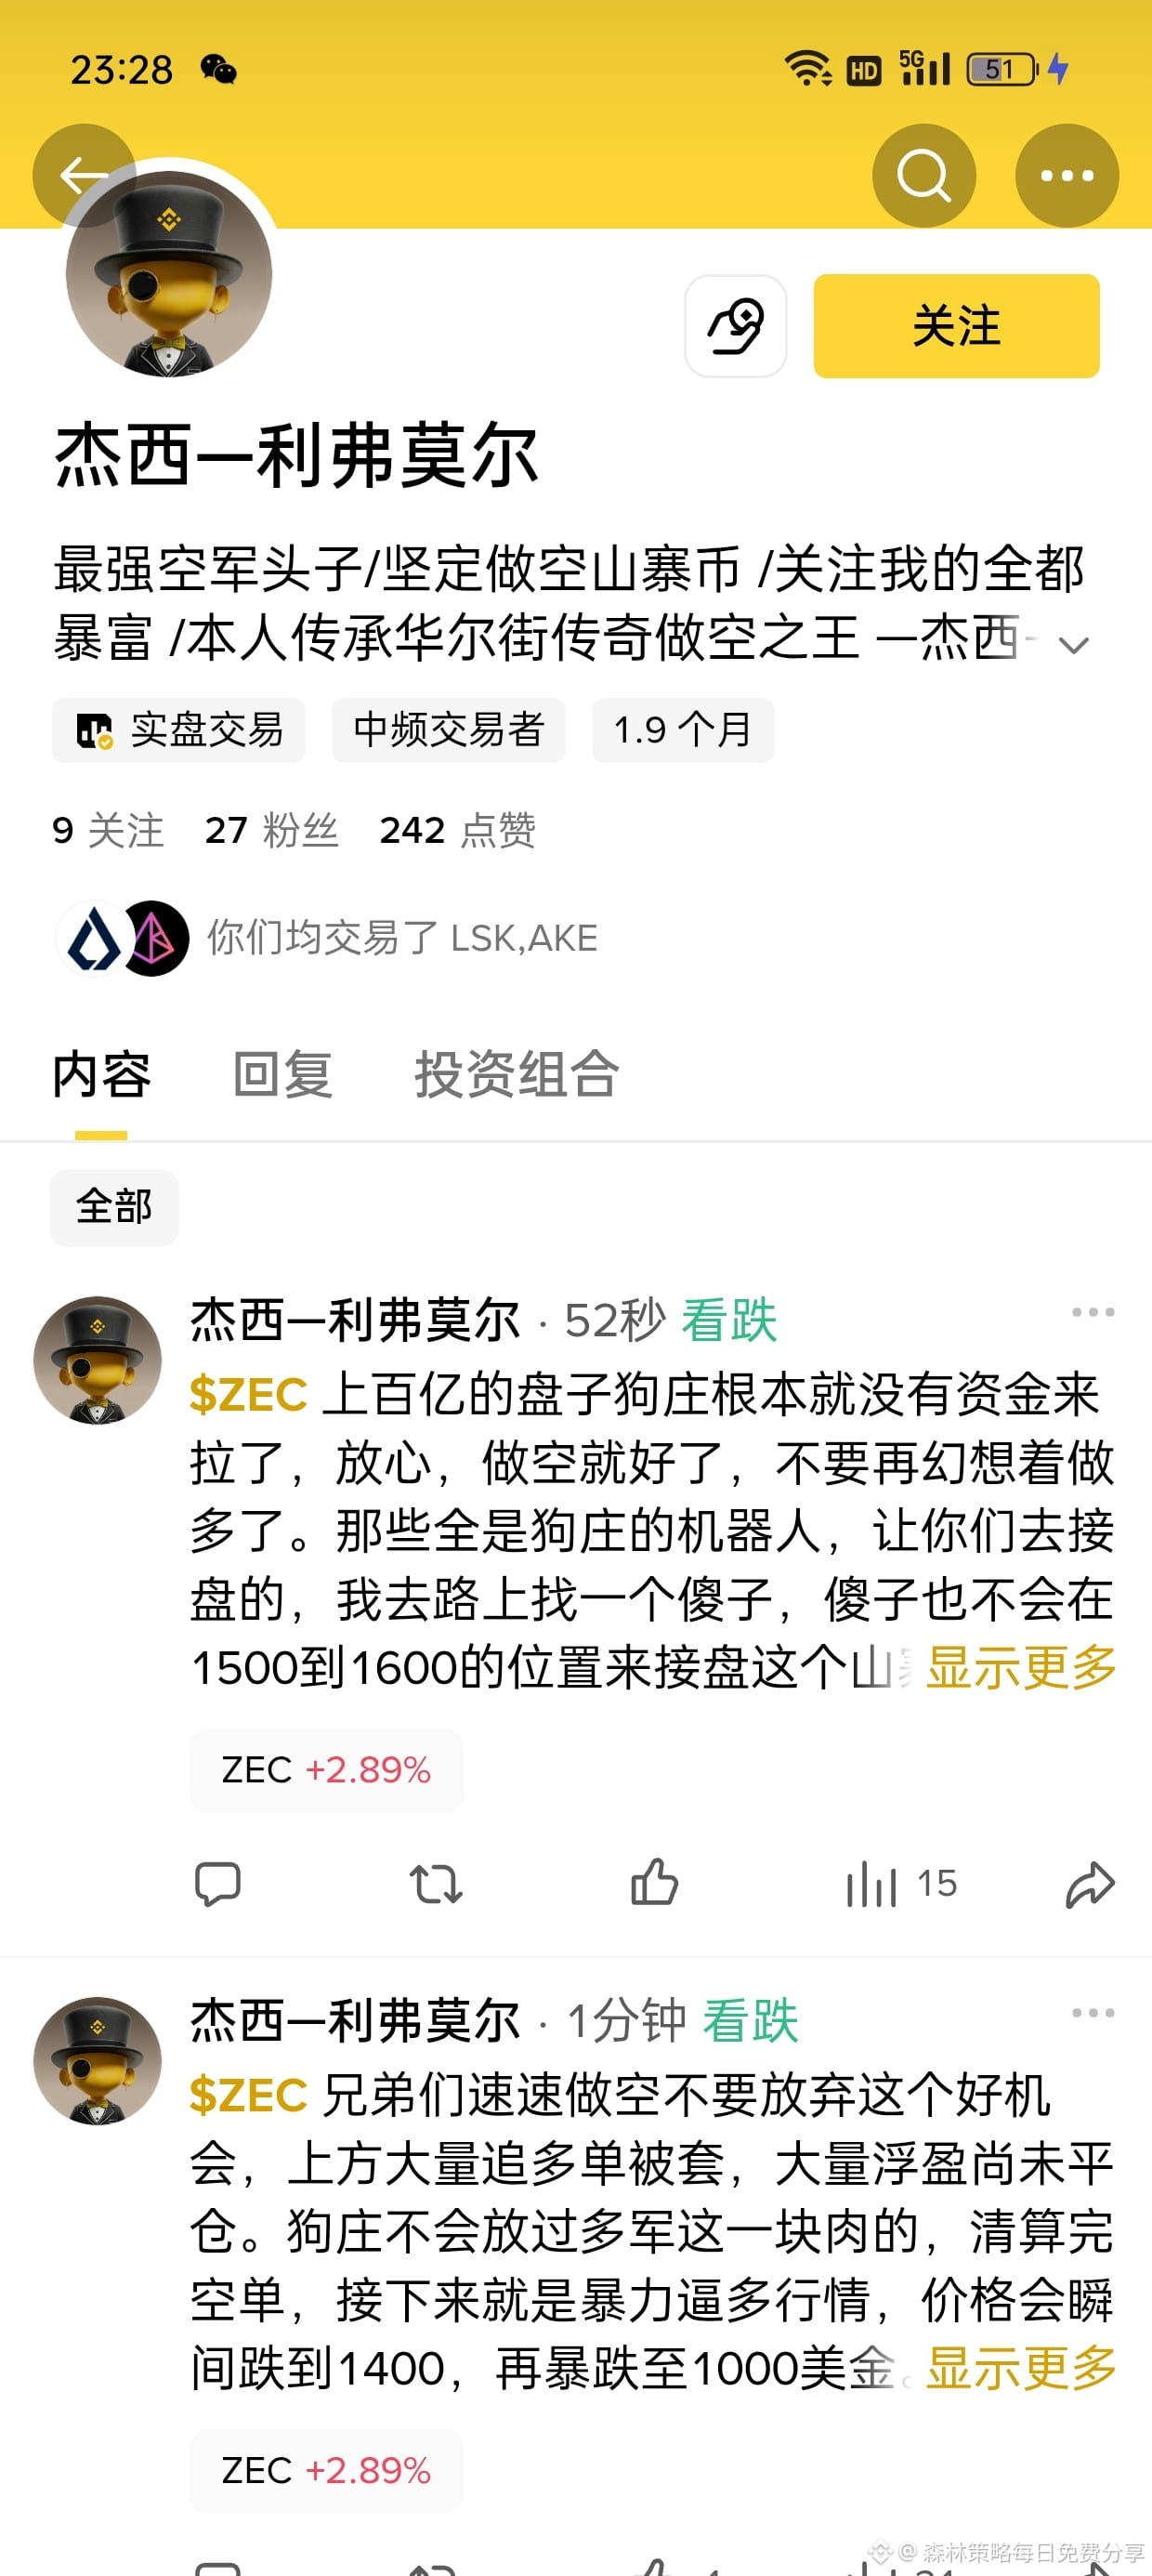
$ZEC this is really stupid, it goes long while shouting short at the same time; if anyone who it follows is paying attention, tag them and expose this scumbag
{future}(ZECUSDT)
$ZEC this is really stupid, it goes long while shouting short at the same time; if anyone who it follows is paying attention, tag them and expose this scumbag
2
1
735
·
--
Bullish
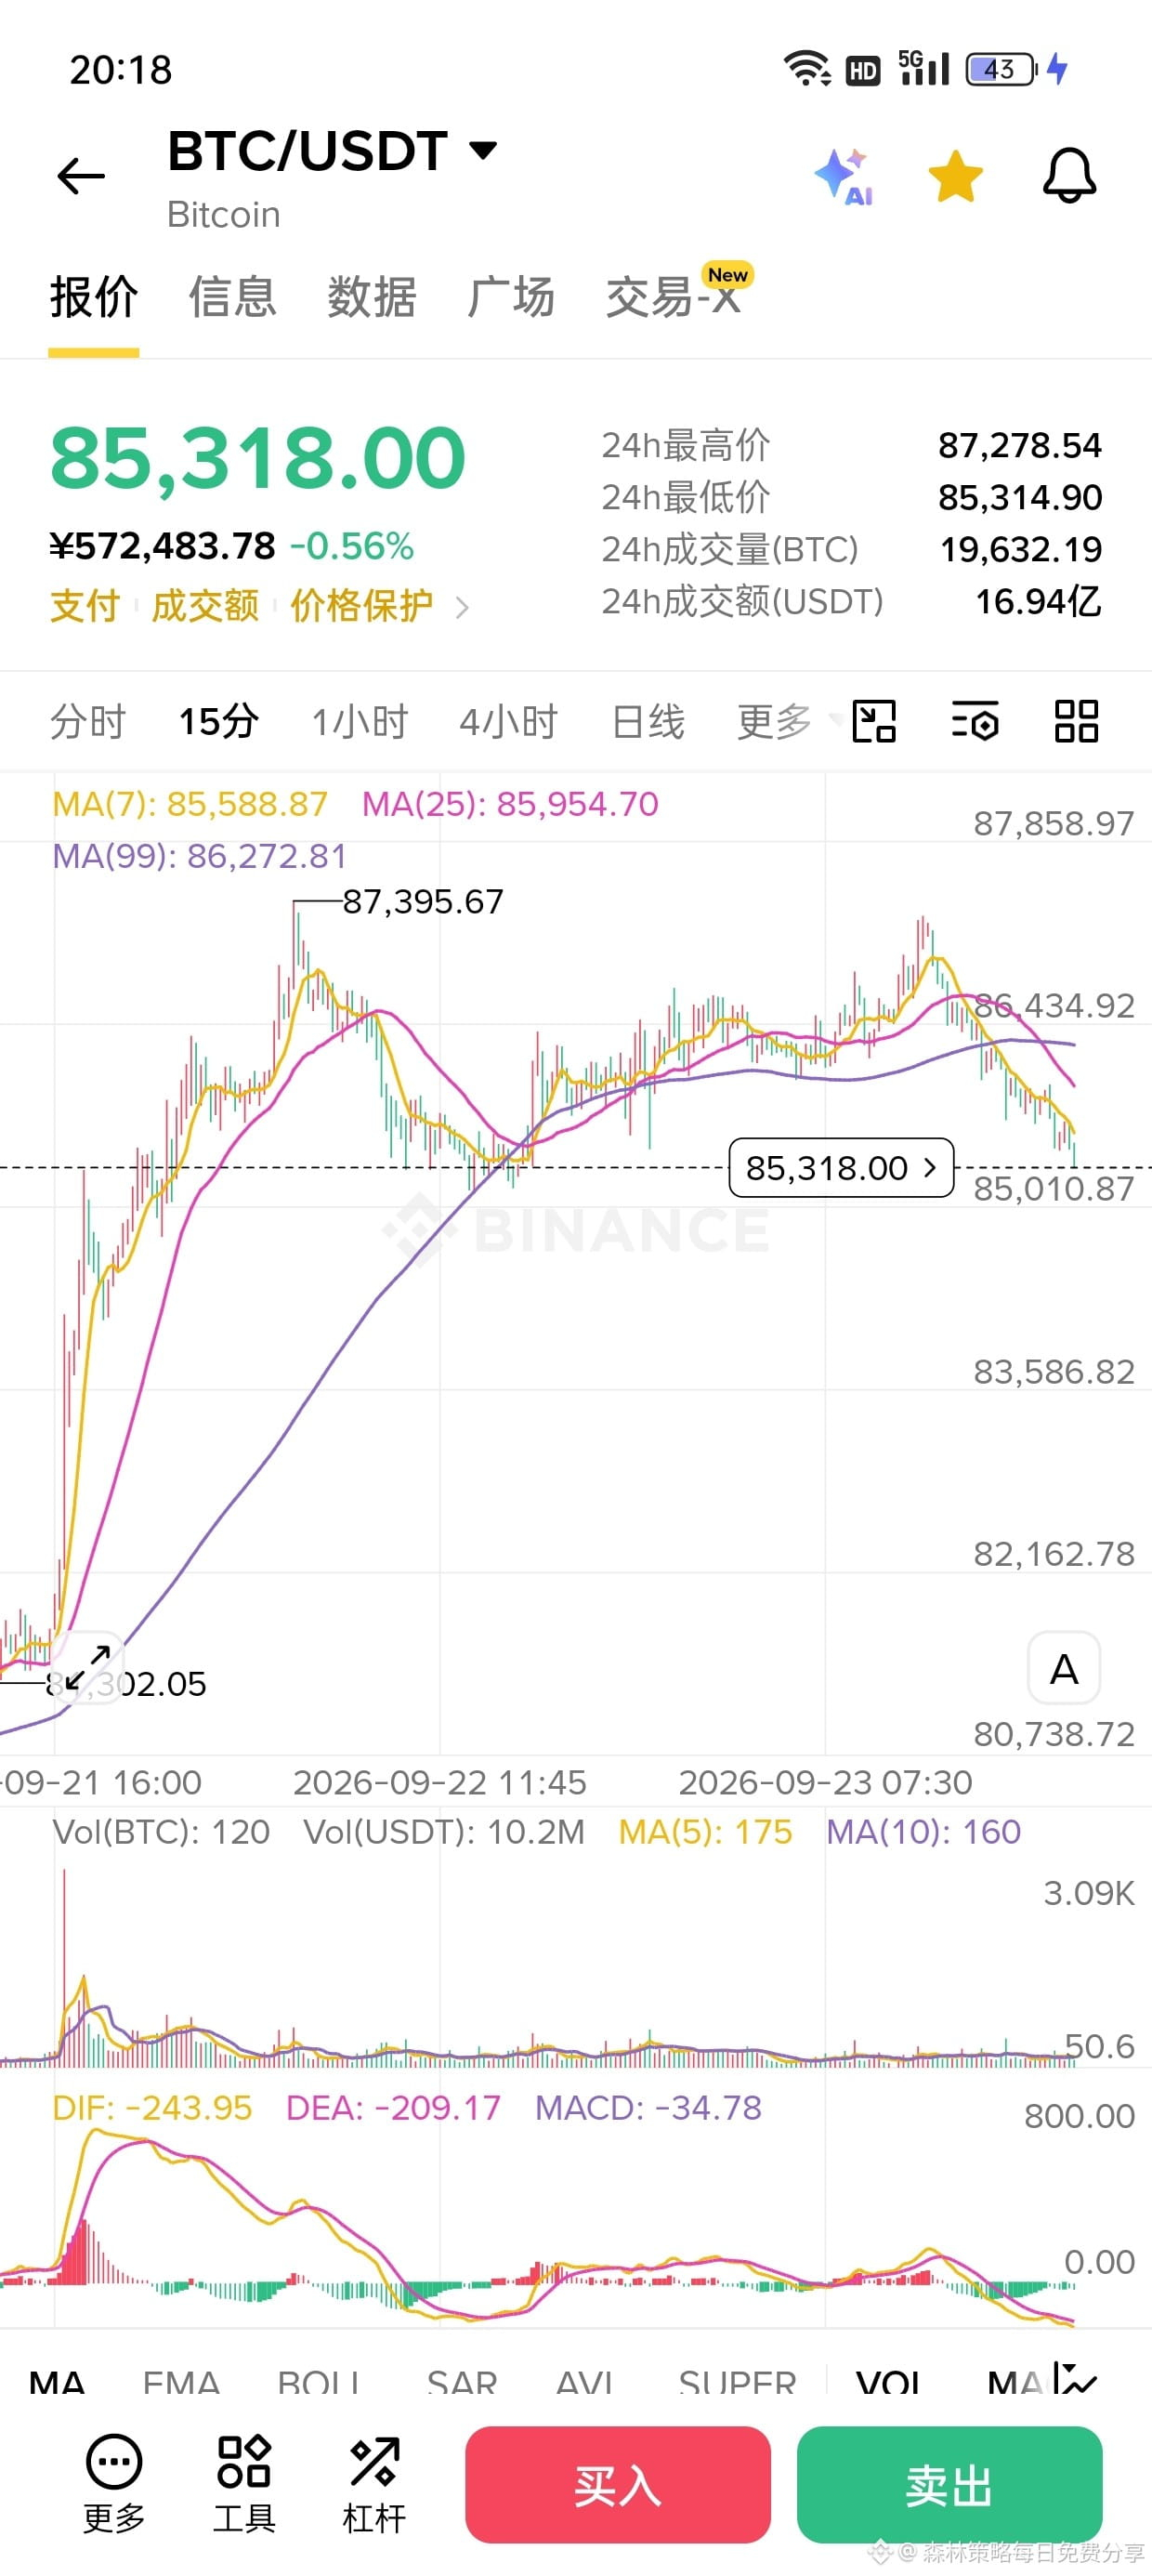
$BTC Stop loss 85,000, target 87,000. If it doesn’t break, it’s very easy to receive
{future}(BTCUSDT)
$BTC Stop loss 85,000, target 87,000. If it doesn’t break, it’s very easy to receive
223
·
--
Bullish
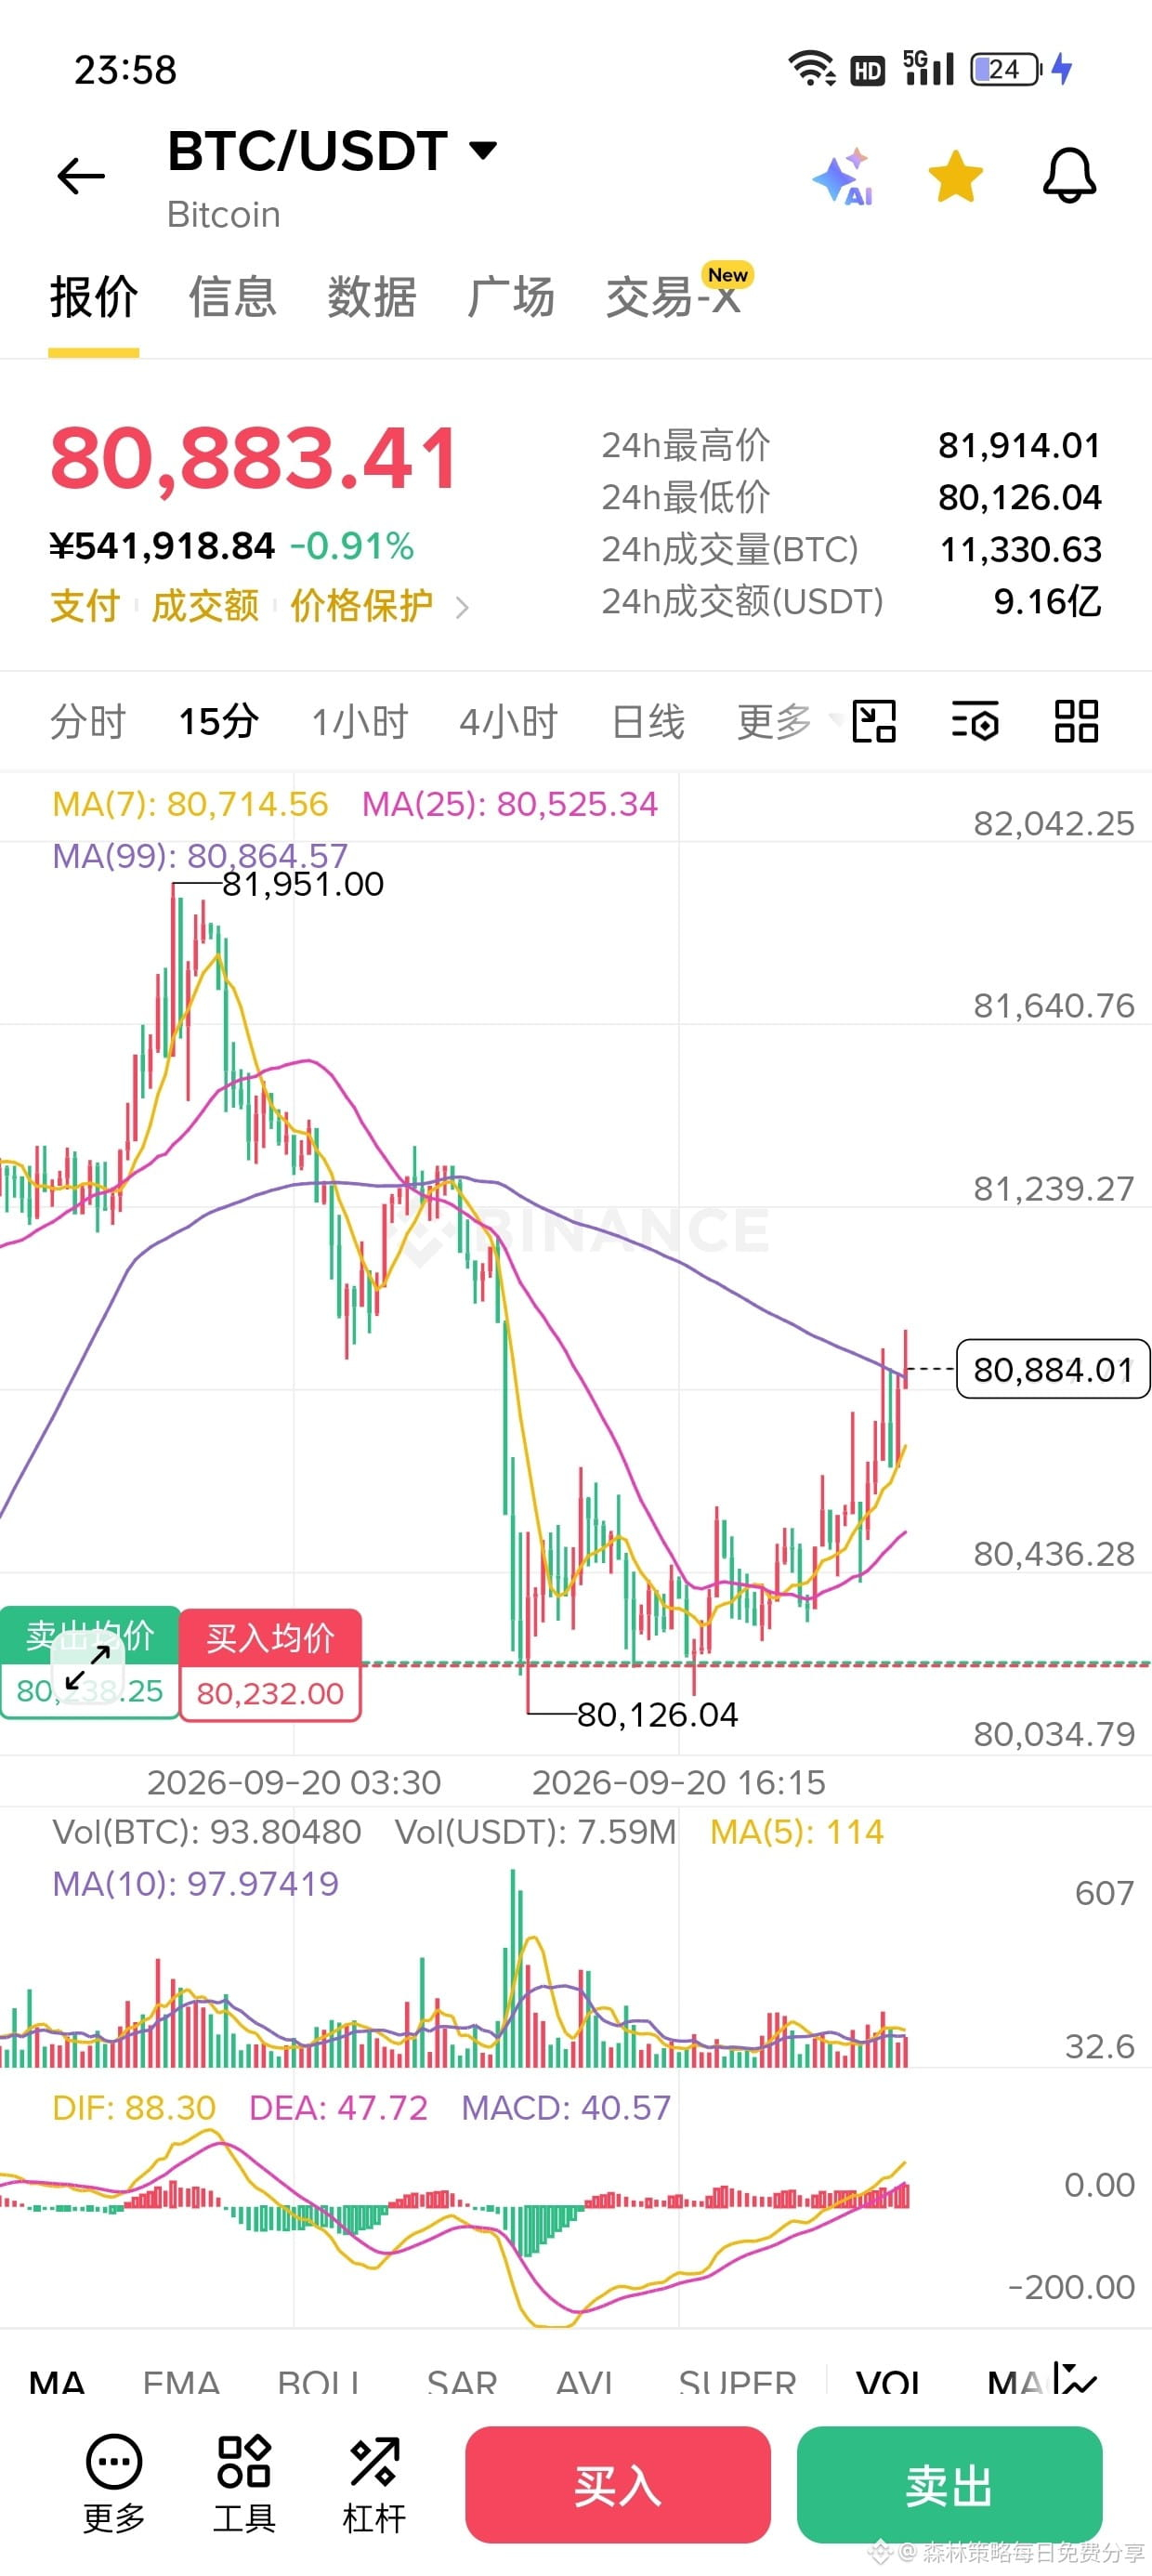
$BTC Take profit points all in place. Currently, I keep 15% of the position to take a chance on a breakout above the previous high on increased volume. The stop loss is still 80050
{future}(BTCUSDT)
$BTC Take profit points all in place. Currently, I keep 15% of the position to take a chance on a breakout above the previous high on increased volume. The stop loss is still 80050
森林策略每日免费分享
·
--
Bullish$BTC come up with a short-term trading plan
Buy at current price 80350, stop loss at 80050, take profit at 80800-81000.
Buy at current price 80350, stop loss at 80050, take profit at 80800-81000.
99
·
--
Bullish
Taking profit is the first step. The second step—taking profit—should currently still allow you to capture the move. After that, you can keep about 15% of your position to break through the previous high around 82,000. $BTC
Taking profit is the first step. The second step—taking profit—should currently still allow you to capture the move. After that, you can keep about 15% of your position to break through the previous high around 82,000. $BTC
森林策略每日免费分享
·
--
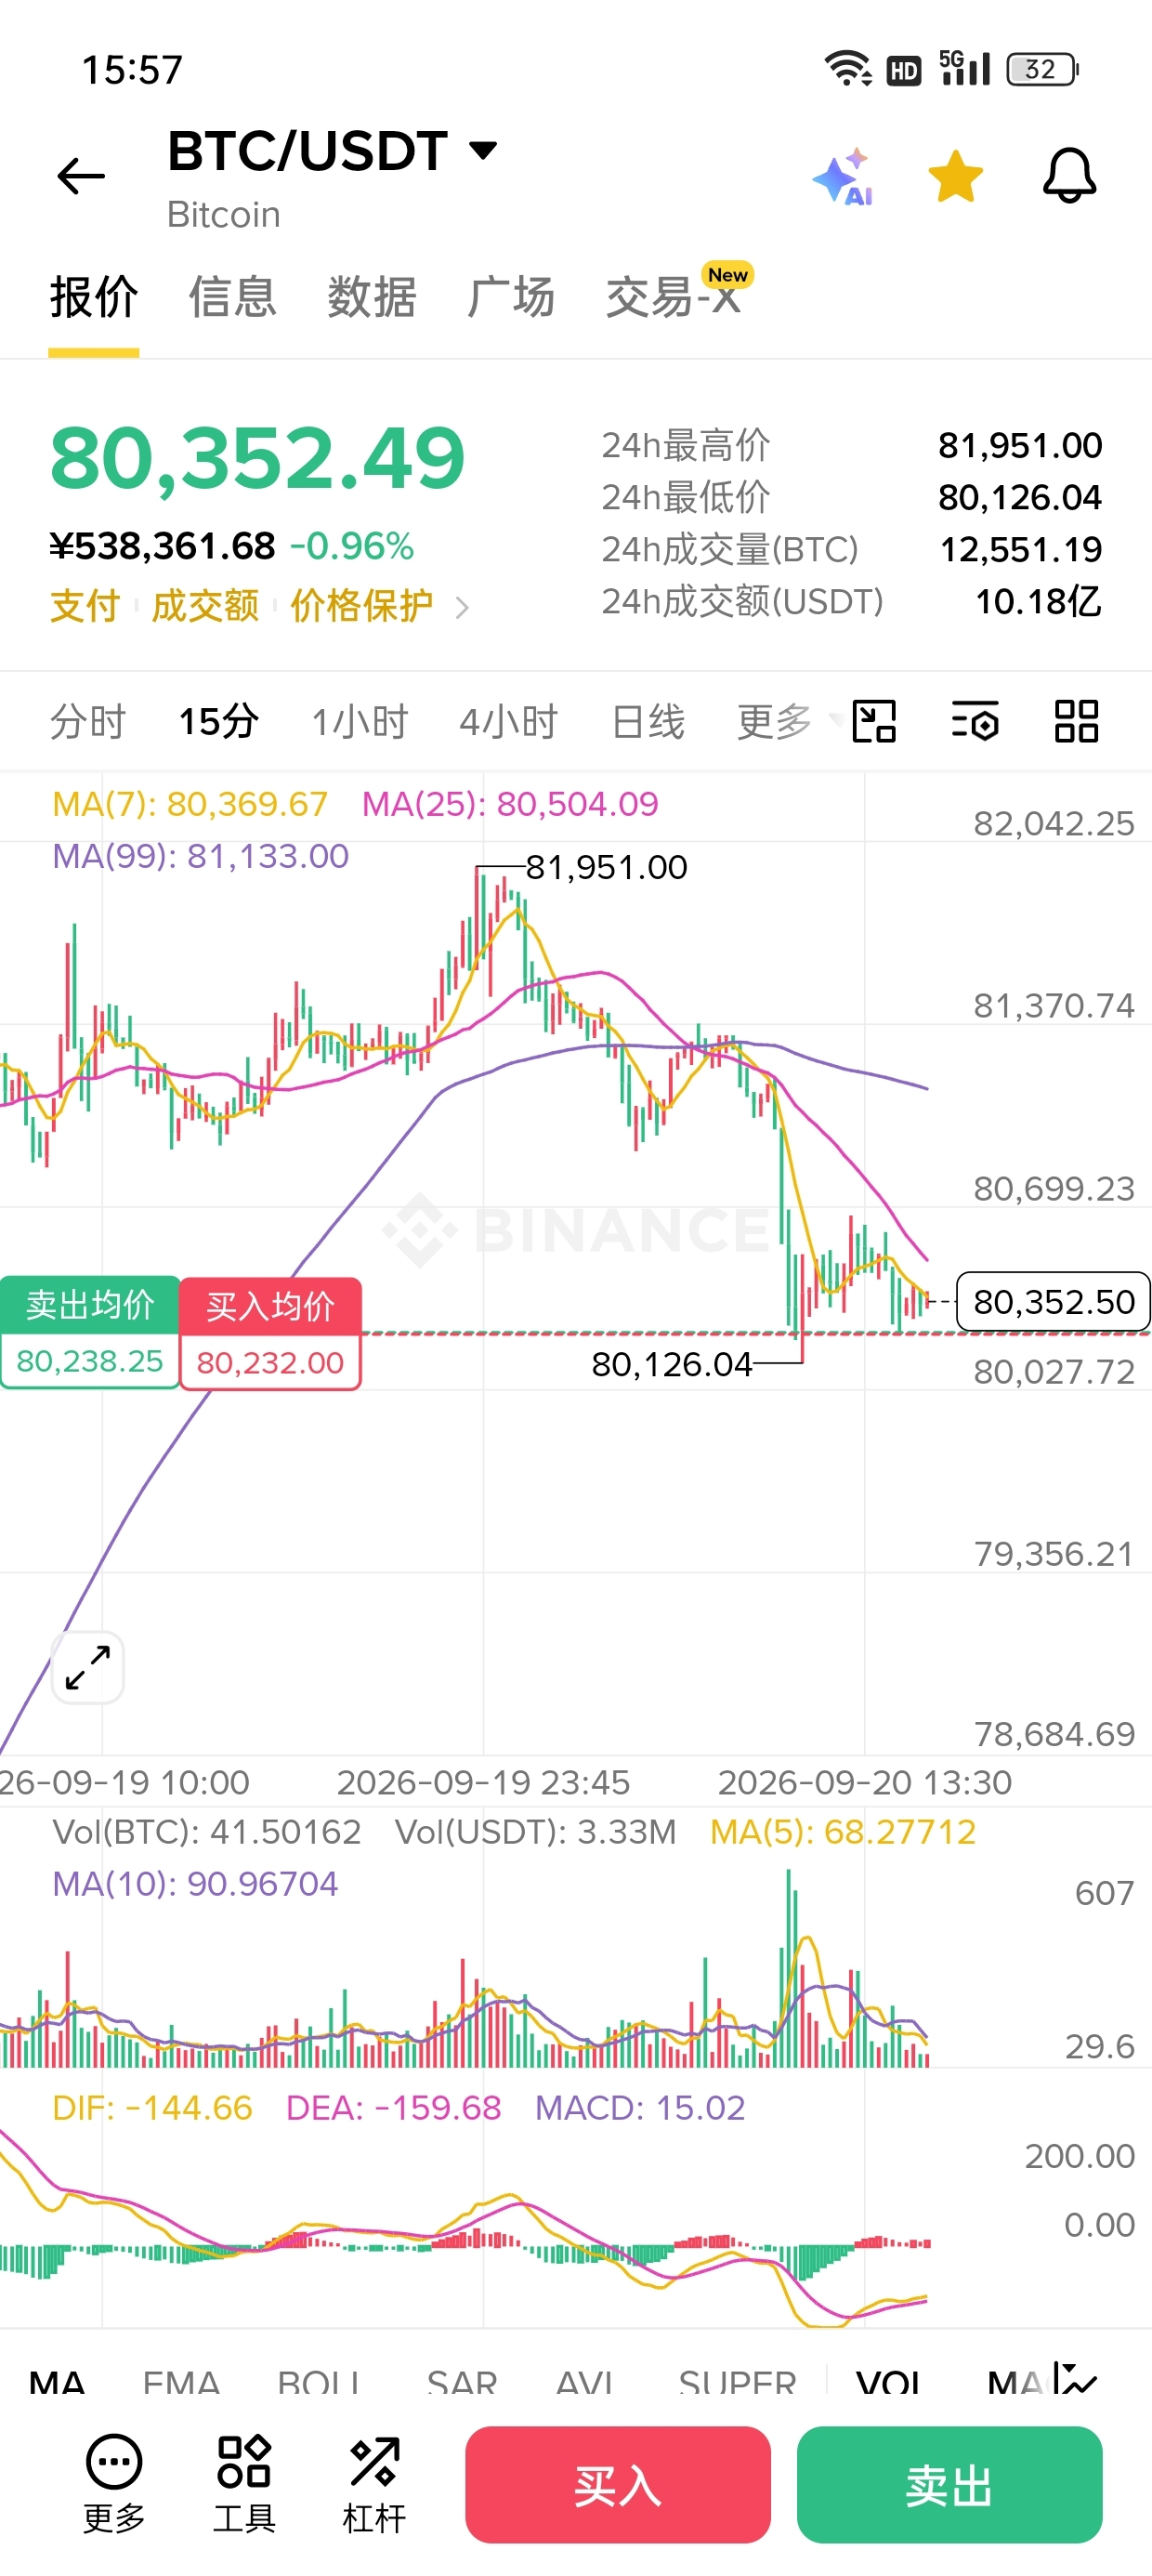
Bullish$BTC come up with a short-term trading plan
Buy at current price 80350, stop loss at 80050, take profit at 80800-81000.
Buy at current price 80350, stop loss at 80050, take profit at 80800-81000.
288
·
--
Bullish
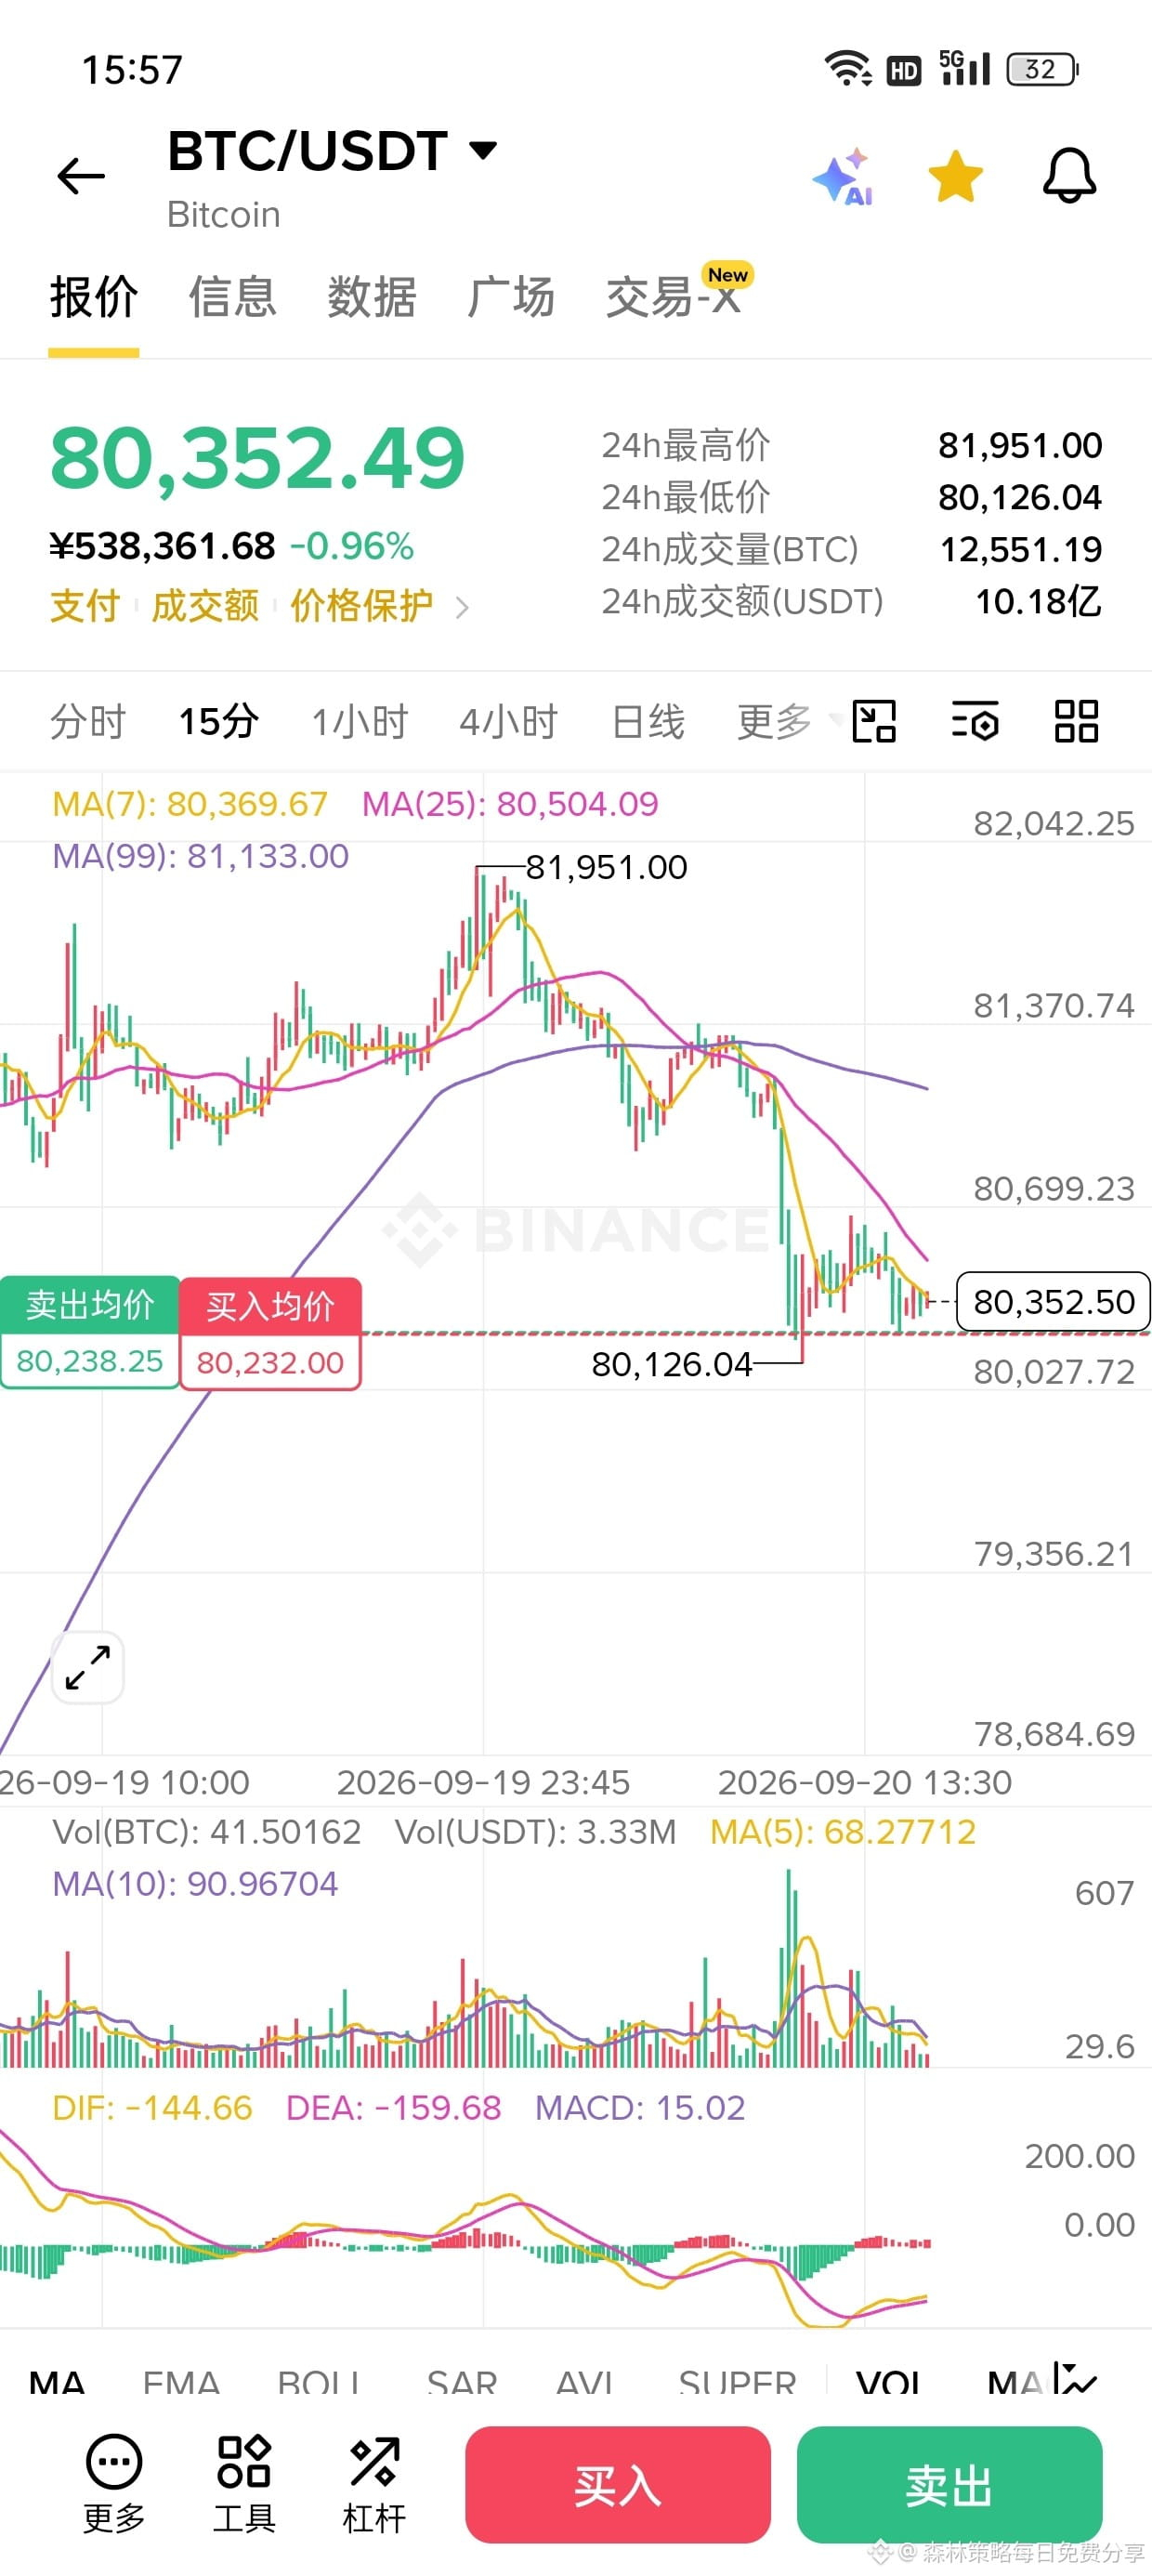
$BTC come up with a short-term trading plan
Buy at current price 80350, stop loss at 80050, take profit at 80800-81000.
{future}(BTCUSDT)
$BTC come up with a short-term trading plan
Buy at current price 80350, stop loss at 80050, take profit at 80800-81000.
Buy at current price 80350, stop loss at 80050, take profit at 80800-81000.
2
1
159
·
--
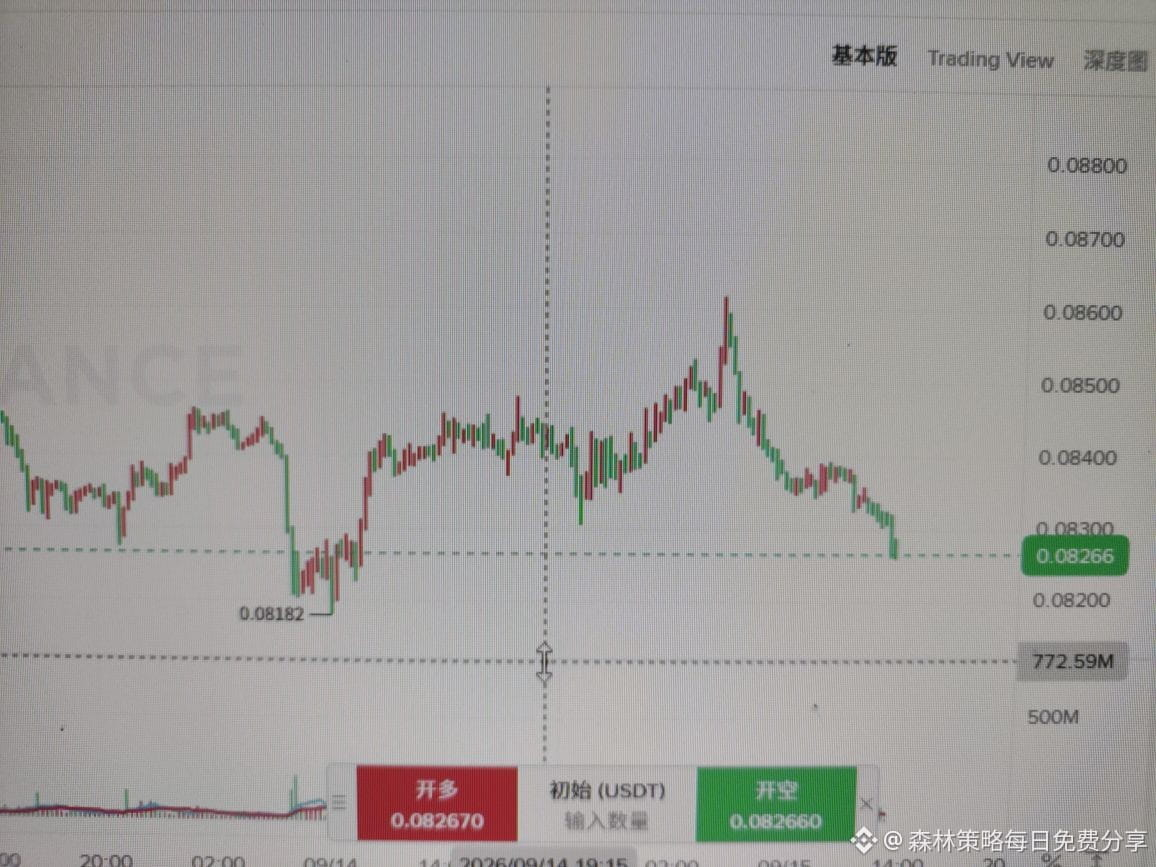
$DOGE current price entry, stop loss 0.8, take profit 0.87-0.89-0.92
{future}(DOGEUSDT)
$DOGE current price entry, stop loss 0.8, take profit 0.87-0.89-0.92
270
·
--
Bullish
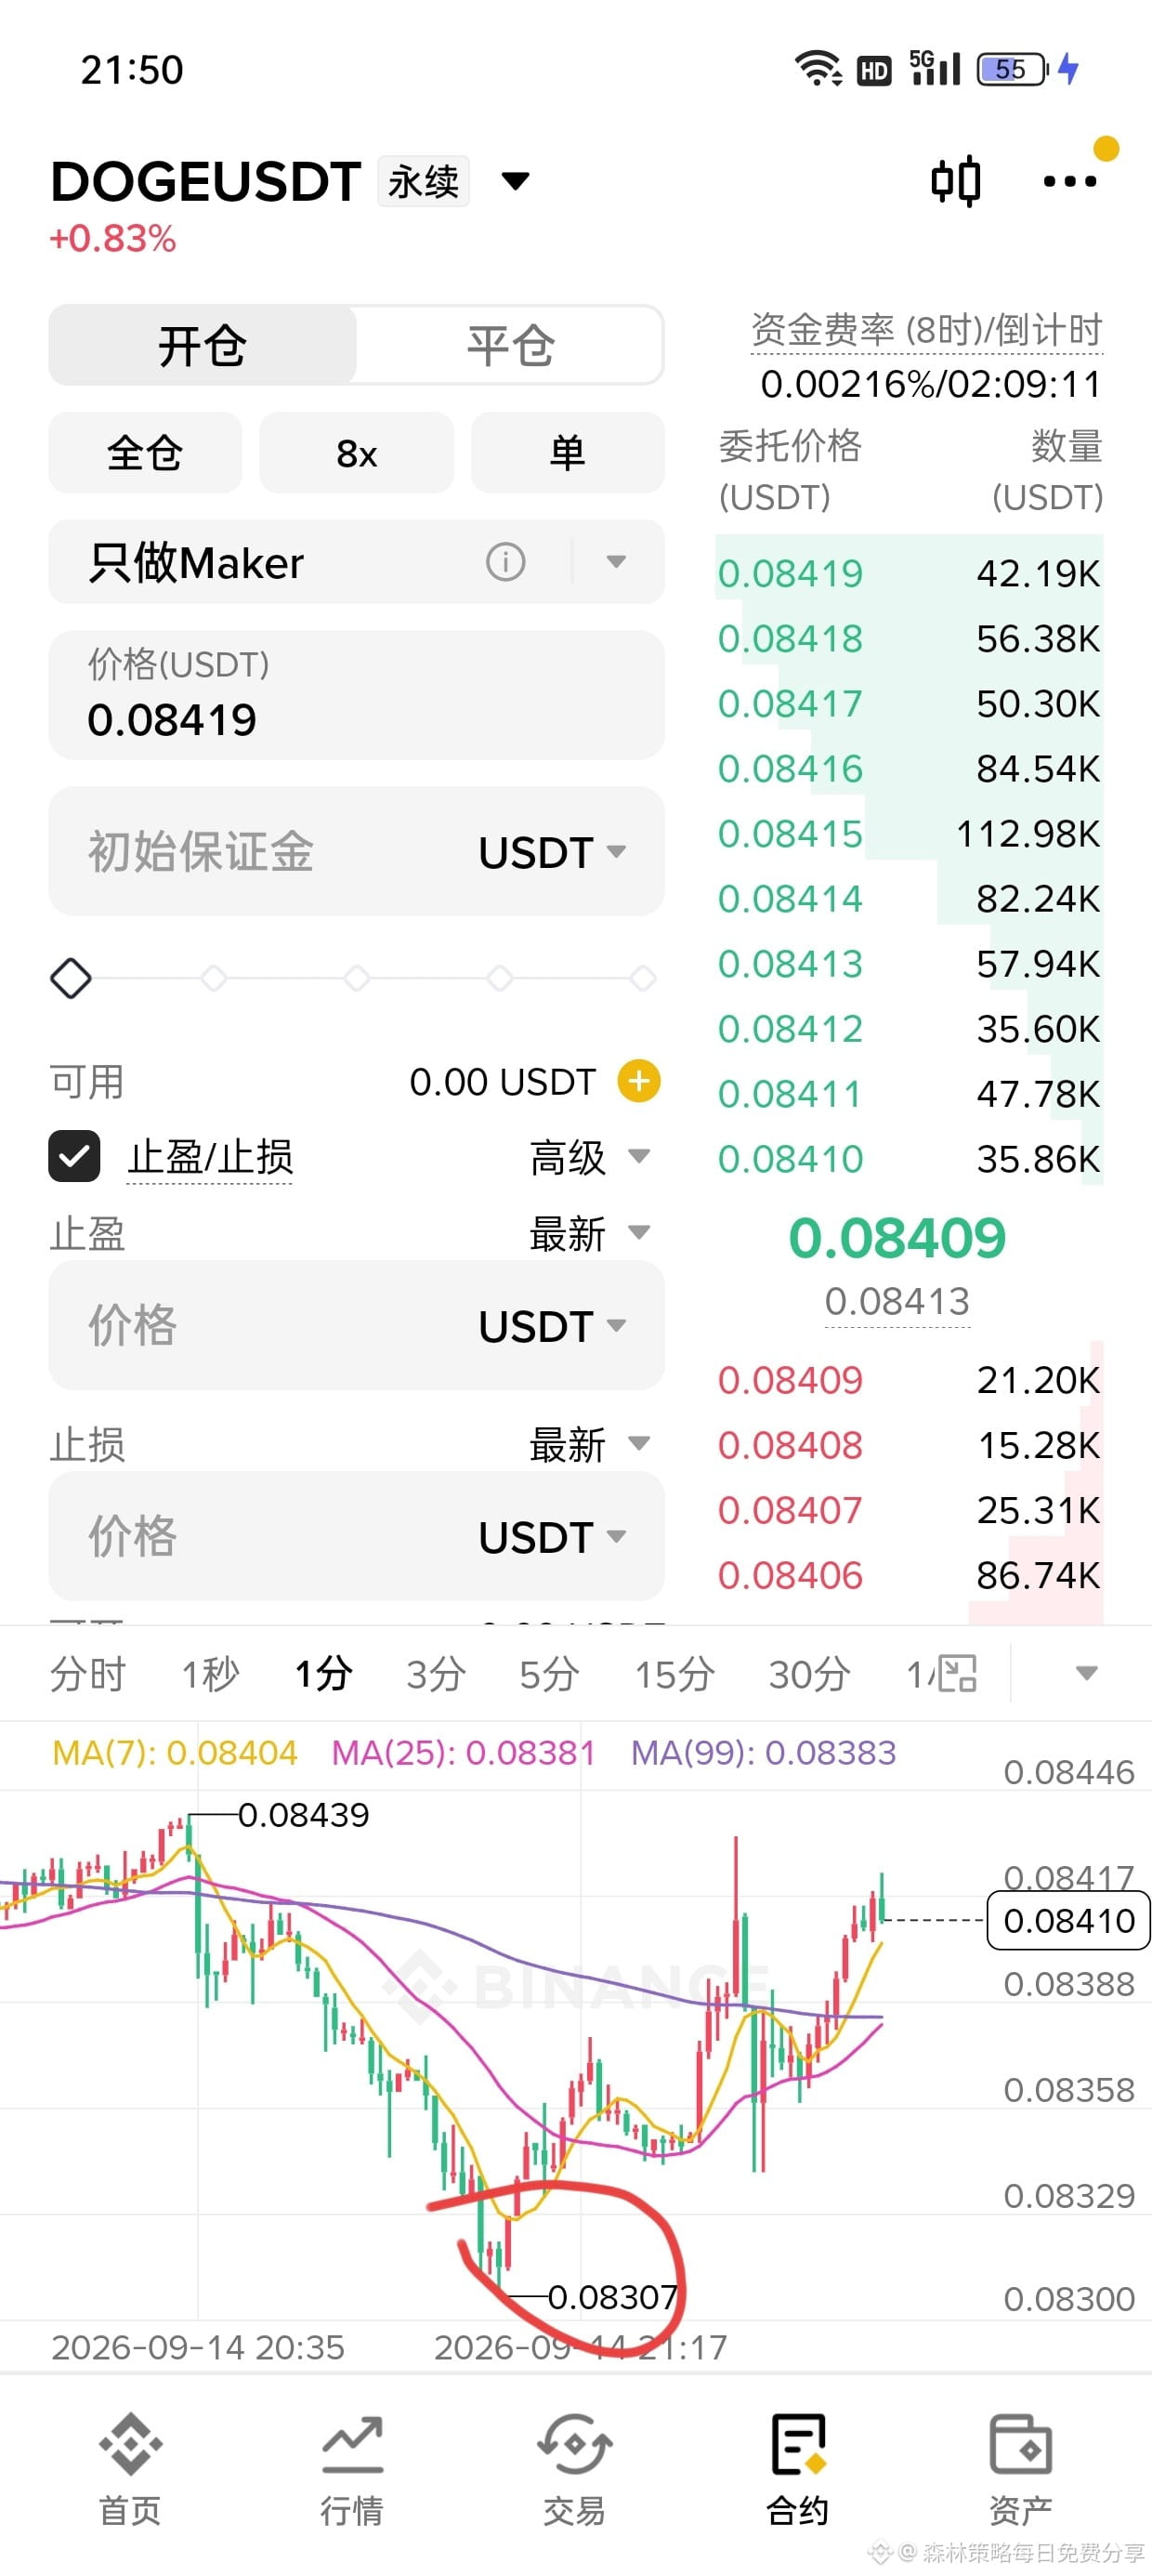
$DOGE just misses by 0.00007, but not getting through to you guys is the same, right? I’m at my wit’s end
{future}(DOGEUSDT)
$DOGE just misses by 0.00007, but not getting through to you guys is the same, right? I’m at my wit’s end
森林策略每日免费分享
·
--
Bullish$DOGE This position structure is prone to a huge surge, with an unbeatable risk-reward ratio.
Place a limit order at 0.083 to go long. Stop loss at 0.08100
Target take-profit levels: 0.089—0.094—0.1
Take profit in three batches: first place limit orders and see if it can be filled. I estimate there will be a shakeout during the daytime today, and a big breakout will start when the US session opens tonight
Place a limit order at 0.083 to go long. Stop loss at 0.08100
Target take-profit levels: 0.089—0.094—0.1
Take profit in three batches: first place limit orders and see if it can be filled. I estimate there will be a shakeout during the daytime today, and a big breakout will start when the US session opens tonight
77
·
--
Bullish
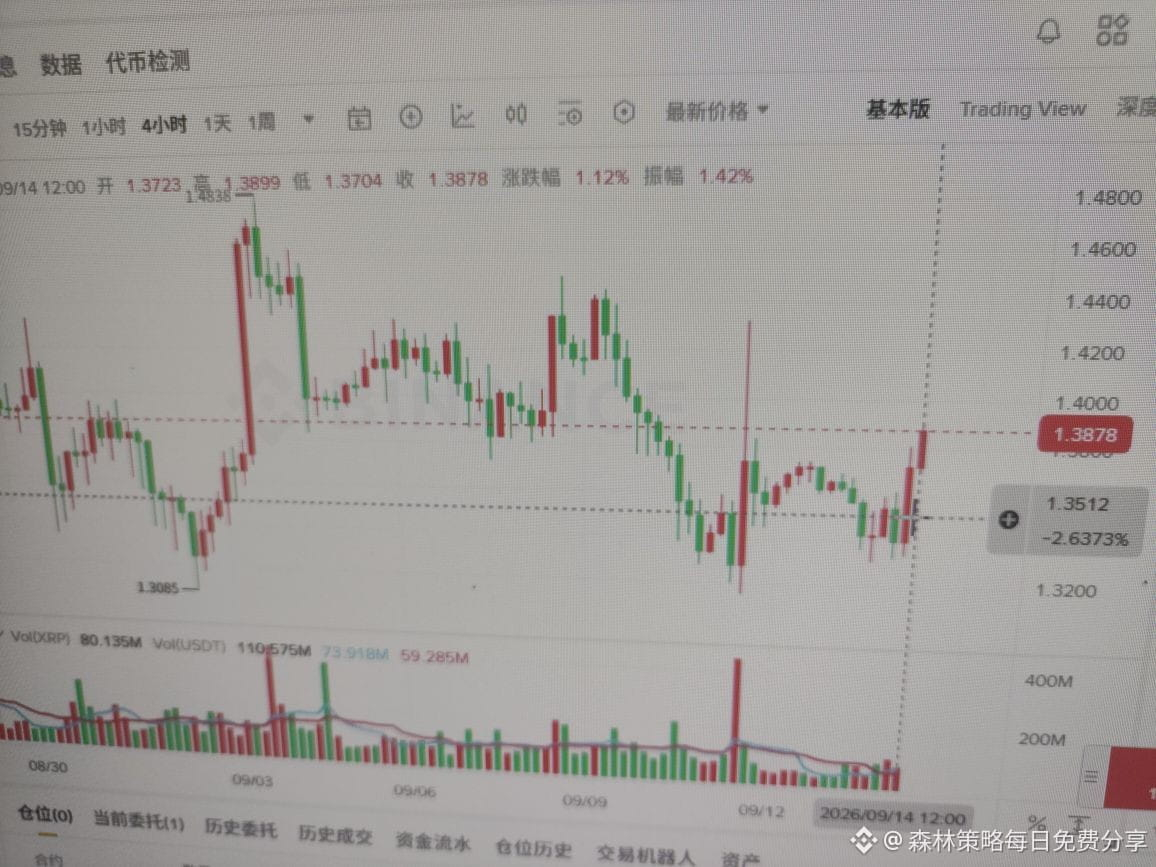
$XRP #xrp It’s really stiff, looks like it’ll start pushing once the evening session opens
{future}(XRPUSDT)
$XRP #xrp It’s really stiff, looks like it’ll start pushing once the evening session opens
森林策略每日免费分享
·
--
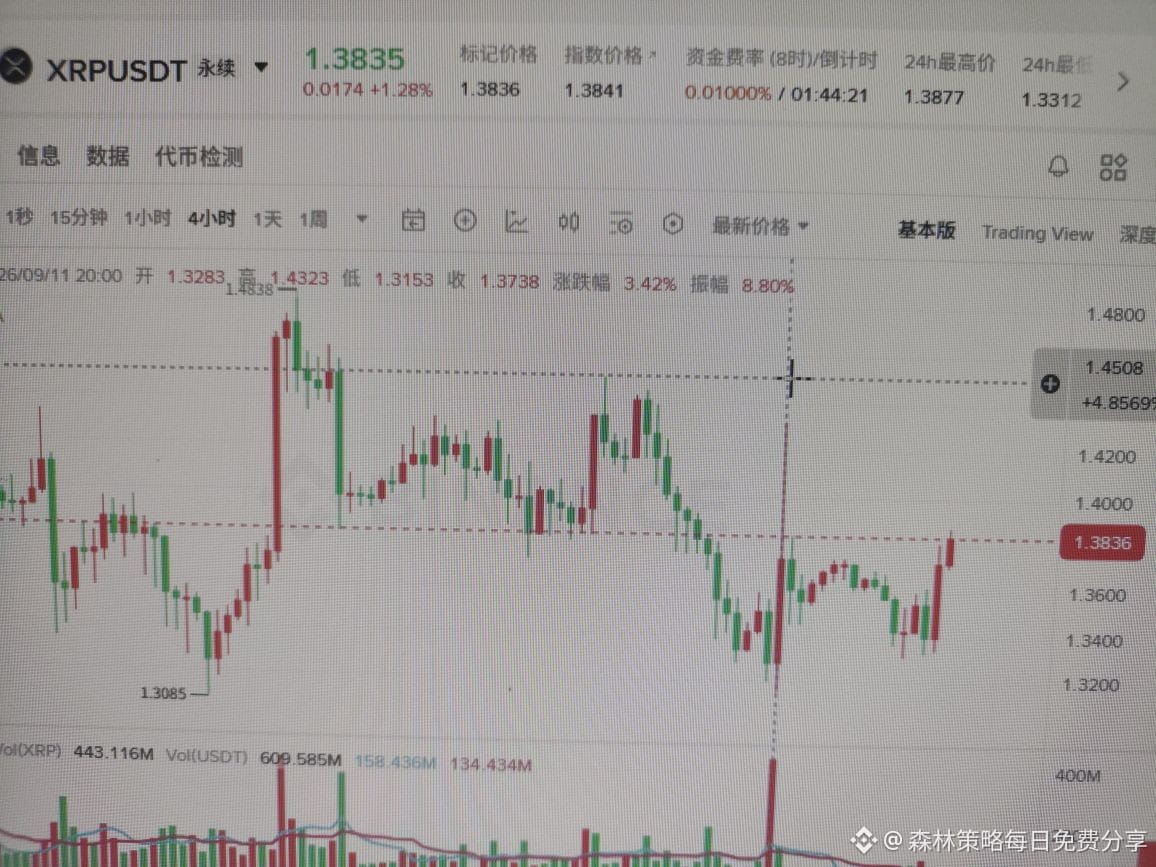
$XRP #xrp Those who understand volume breakout data can wait for it to break out with volume above 1.4; if it doesn’t pull back, then you can go long up to 1.45–1.47.
If you don’t understand, you can enter at the current price and set the stop-loss at 1.363. Take profit at the same two target levels as above.
If you don’t understand, you can enter at the current price and set the stop-loss at 1.363. Take profit at the same two target levels as above.
142
·
--
$XRP #xrp Those who understand volume breakout data can wait for it to break out with volume above 1.4; if it doesn’t pull back, then you can go long up to 1.45–1.47.
If you don’t understand, you can enter at the current price and set the stop-loss at 1.363. Take profit at the same two target levels as above.
{future}(XRPUSDT)
$XRP #xrp Those who understand volume breakout data can wait for it to break out with volume above 1.4; if it doesn’t pull back, then you can go long up to 1.45–1.47.
If you don’t understand, you can enter at the current price and set the stop-loss at 1.363. Take profit at the same two target levels as above.
If you don’t understand, you can enter at the current price and set the stop-loss at 1.363. Take profit at the same two target levels as above.
1
1
1
191
·
--
Bullish
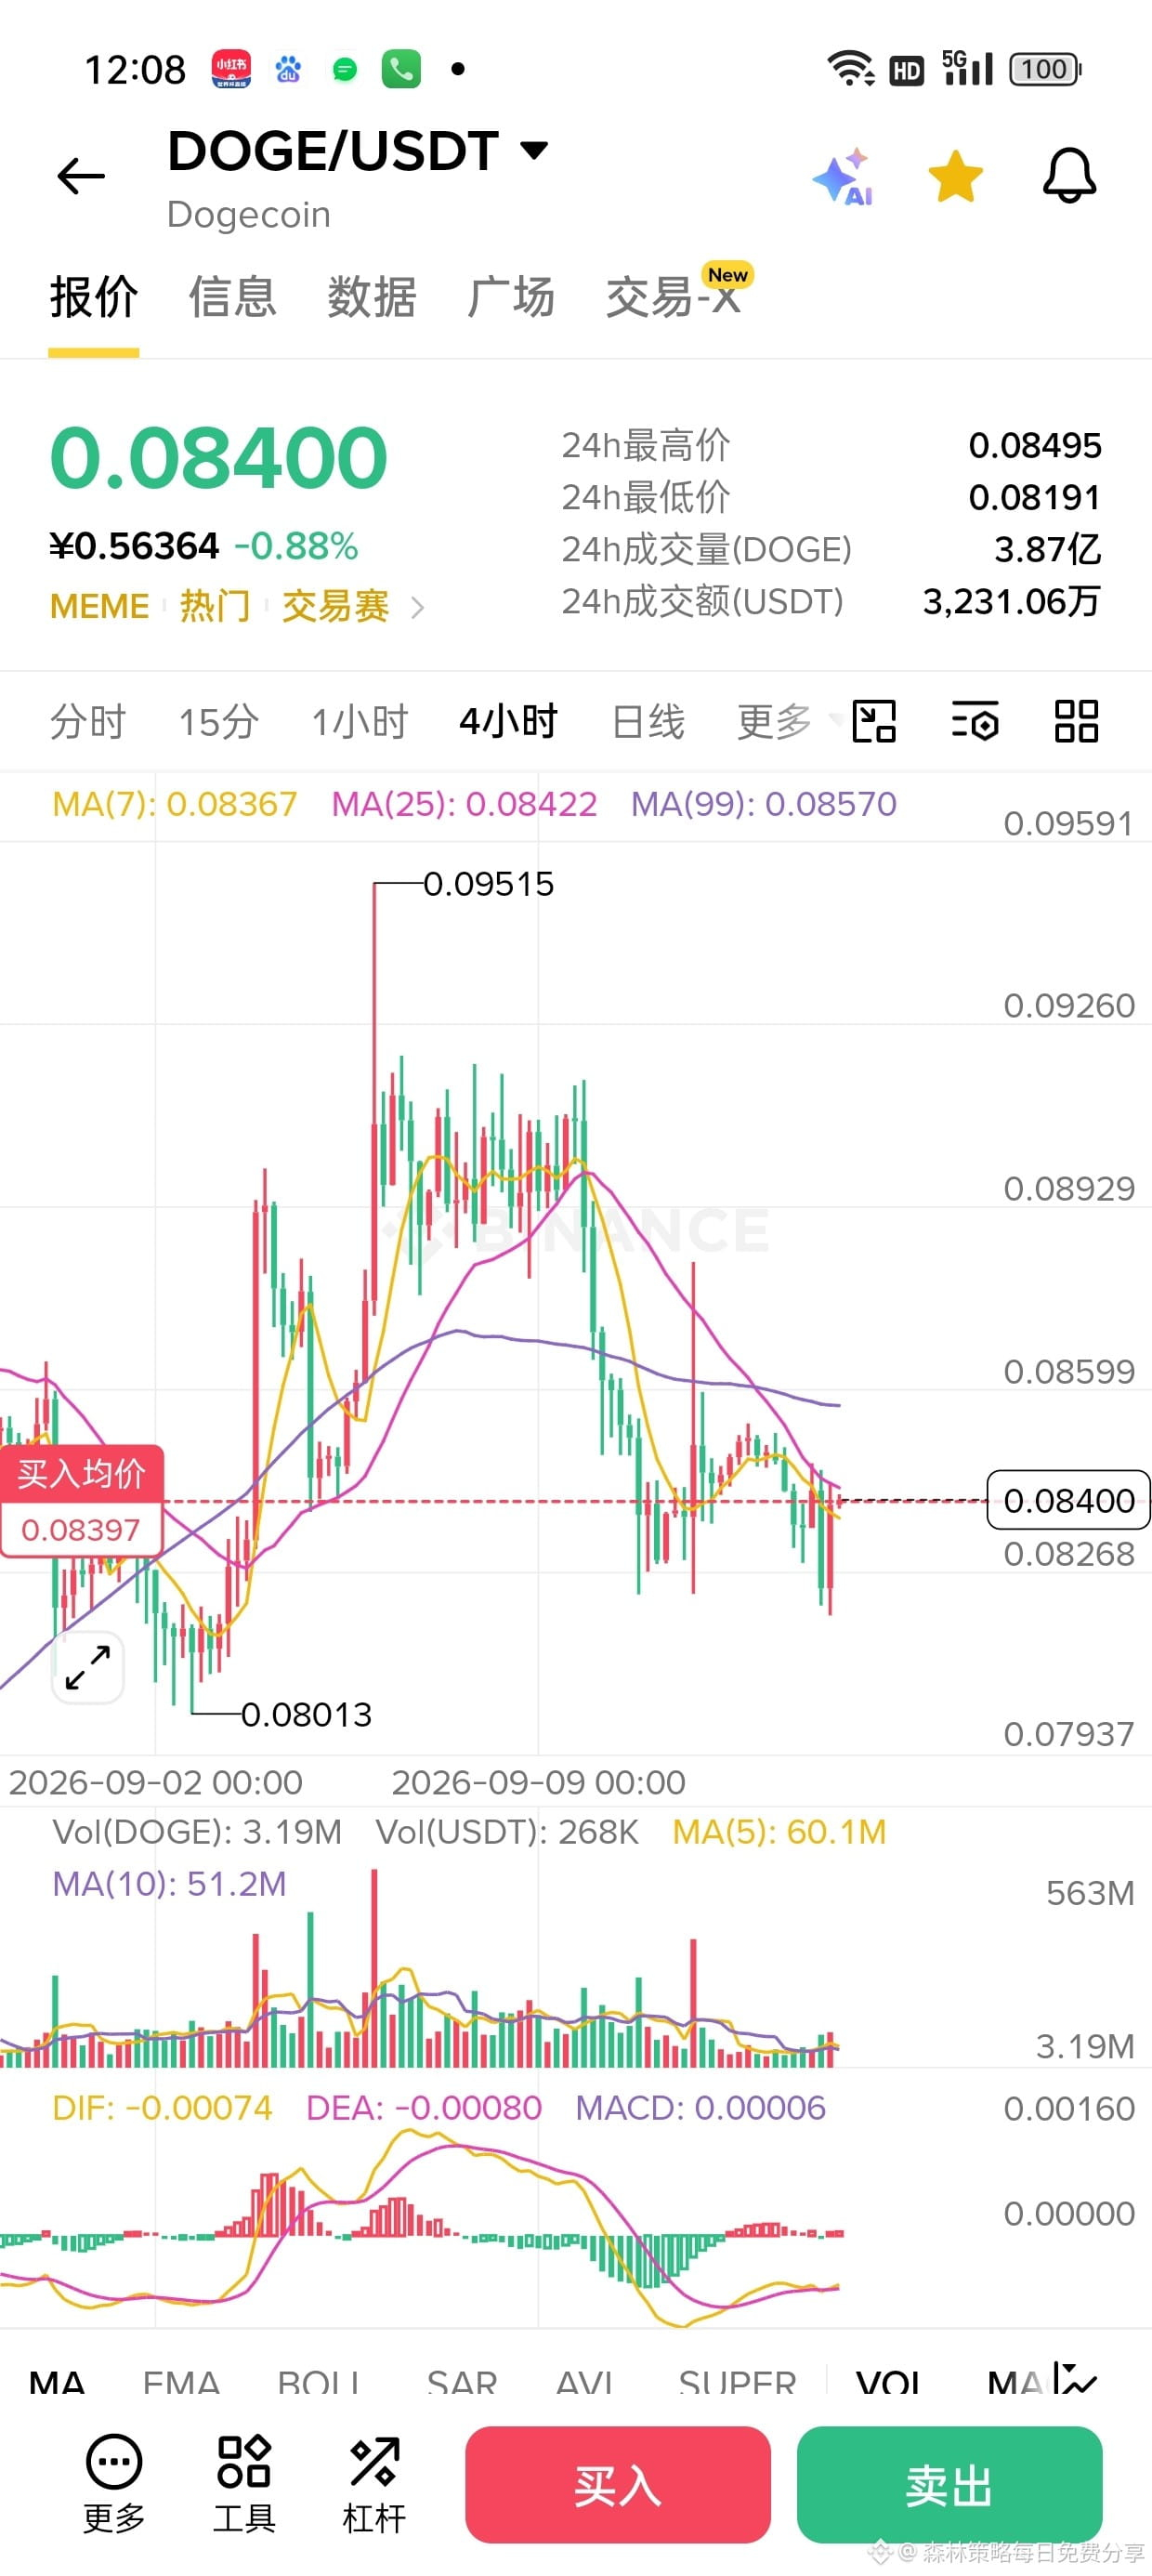
$DOGE This position structure is prone to a huge surge, with an unbeatable risk-reward ratio.
Place a limit order at 0.083 to go long. Stop loss at 0.08100
Target take-profit levels: 0.089—0.094—0.1
Take profit in three batches: first place limit orders and see if it can be filled. I estimate there will be a shakeout during the daytime today, and a big breakout will start when the US session opens tonight
{future}(DOGEUSDT)
$DOGE This position structure is prone to a huge surge, with an unbeatable risk-reward ratio.
Place a limit order at 0.083 to go long. Stop loss at 0.08100
Target take-profit levels: 0.089—0.094—0.1
Take profit in three batches: first place limit orders and see if it can be filled. I estimate there will be a shakeout during the daytime today, and a big breakout will start when the US session opens tonight
Place a limit order at 0.083 to go long. Stop loss at 0.08100
Target take-profit levels: 0.089—0.094—0.1
Take profit in three batches: first place limit orders and see if it can be filled. I estimate there will be a shakeout during the daytime today, and a big breakout will start when the US session opens tonight
1
1
1
256
·
--
Bullish
$币安人生 almost done, wait for the data. This round should be a big surge
{future}(币安人生USDT)
$币安人生 almost done, wait for the data. This round should be a big surge

10
564
·
--
Bullish
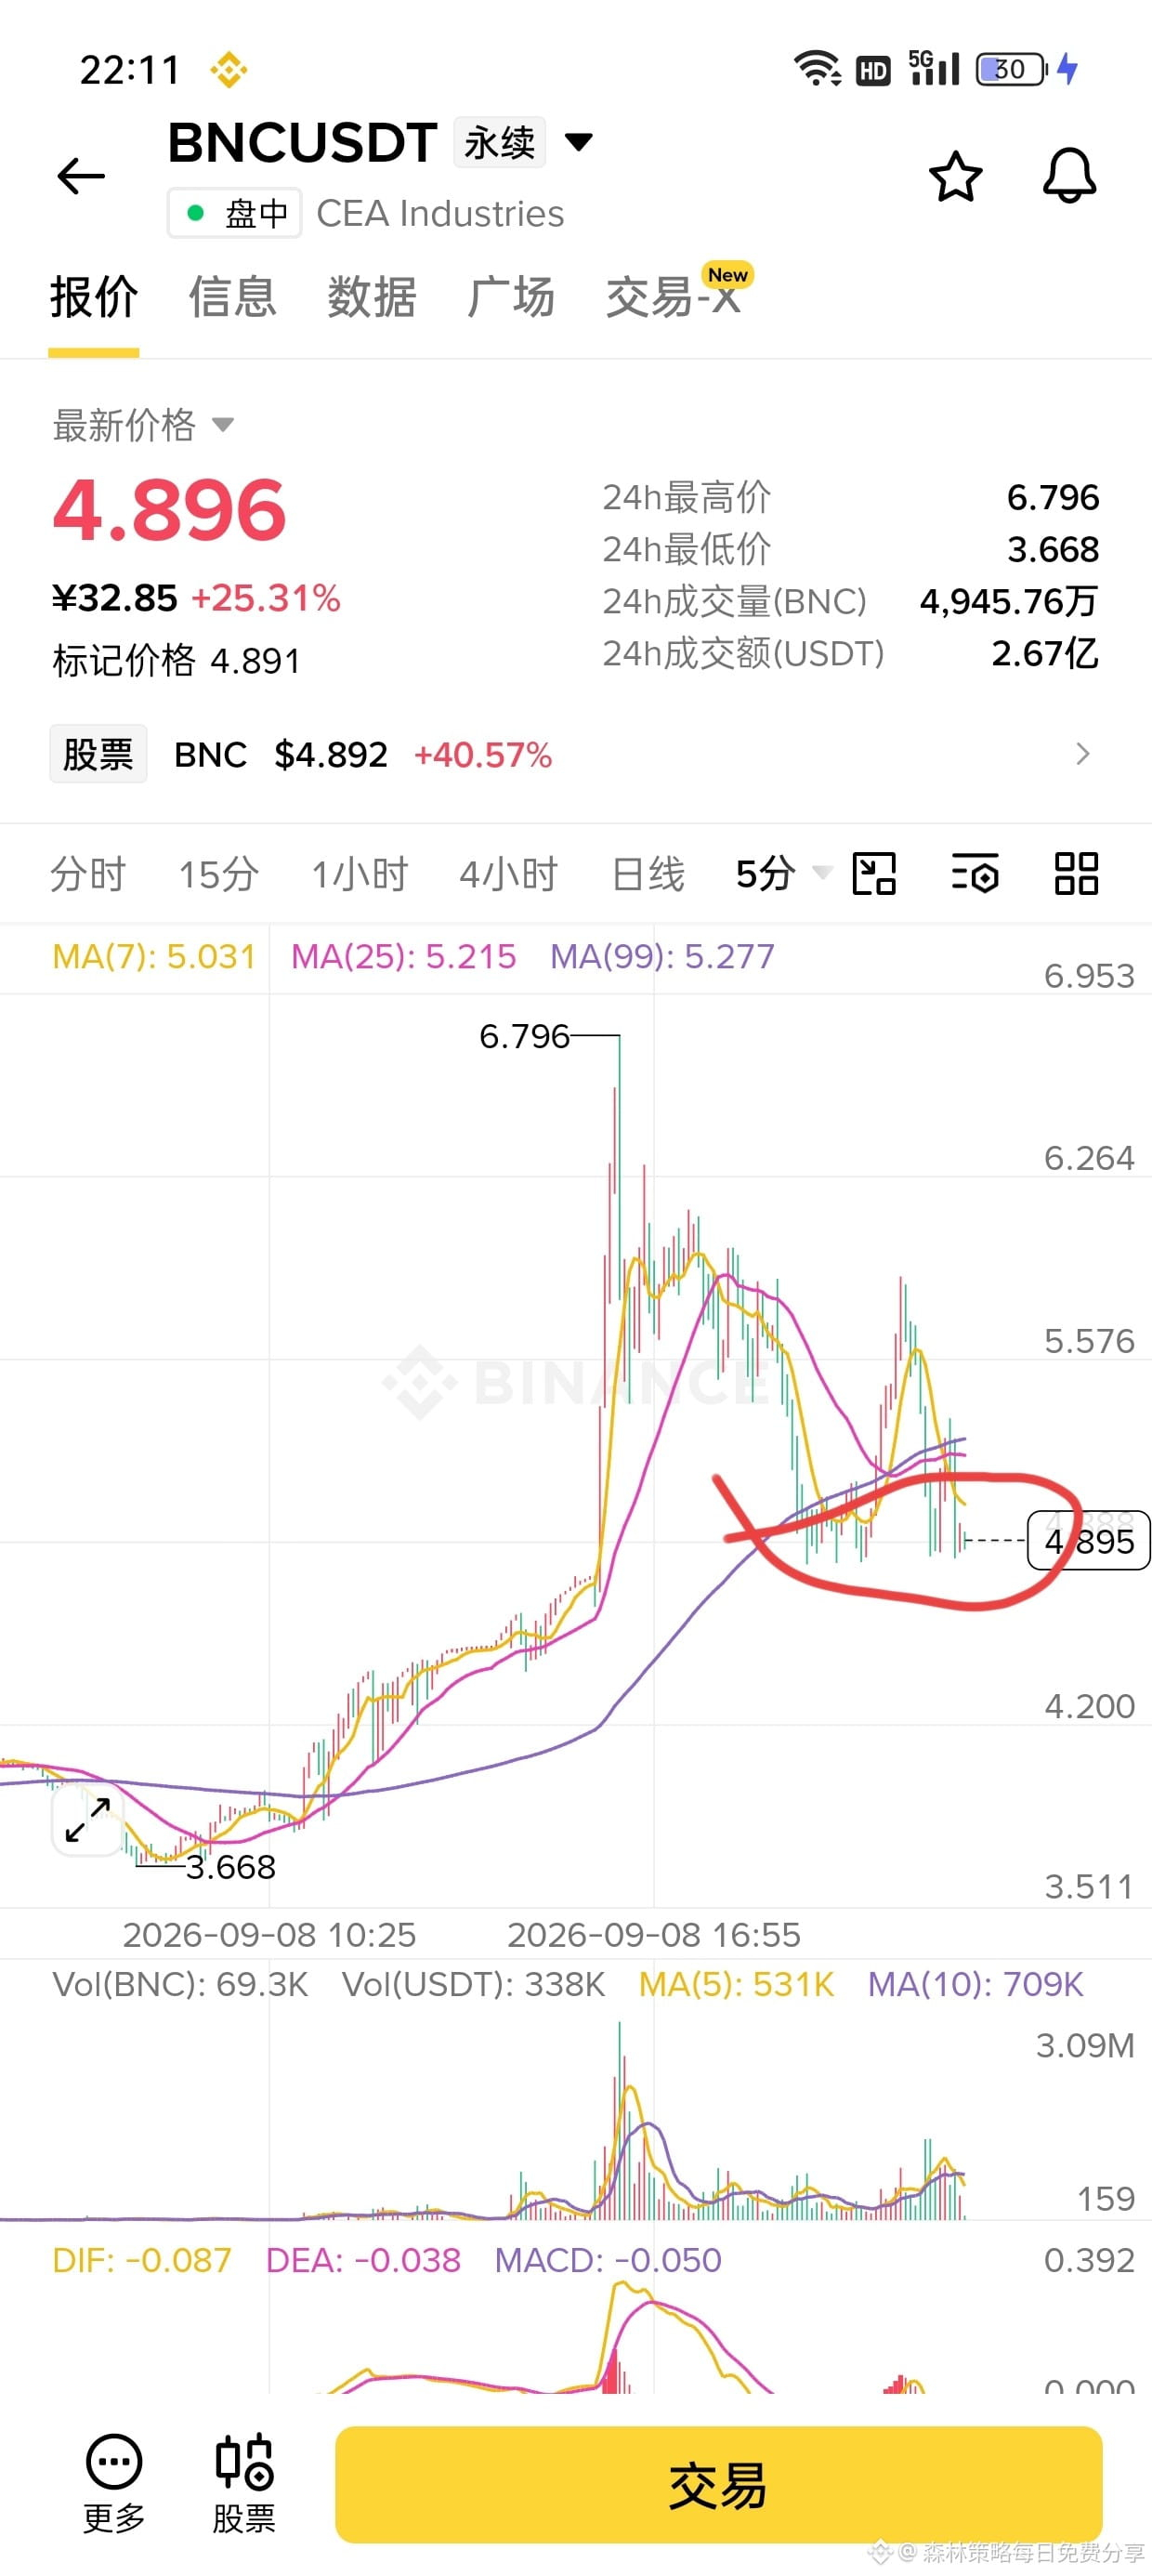
$BNC This counts as a minor support. Our original plan was to do a pullback to 6, which is short by more than 0.1. After that, the play can continue by waiting for the price—no rush.
$BNC This counts as a minor support. Our original plan was to do a pullback to 6, which is short by more than 0.1. After that, the play can continue by waiting for the price—no rush.
森林策略每日免费分享
·
--
Bullish$BNC Now let me give you a deep analysis of how BNC might move next.
Current latest data:
funding: +2.0%.
Large holder long/short ratio: 70% longs, 30% shorts.
For regular accounts, the long/short ratio is close to 1:1, with longs slightly higher: 53.2% longs, 46.8% shorts.
Order book data: 0.96, meaning the active sell side is higher.
Liquidations in the last 24 hours: longs about $310K, shorts about $3.0M.
OI: in the last 24 hours 24.1%, 4H 6.74%, 1H 1.34%. A very interesting combination. It suggests that profitable positions are being closed out, liquidations are happening, and leverage is being reduced actively.
Data breakdown: If you understand these metrics, you’ll see that the market maker’s first round of pumping up plus killing the shorts has already been completed. The liquidation amount for shorts is roughly ten times that of longs. Based on the current data, if the market maker wants to keep making money, they wouldn’t simply pump straight up. If they did, they’d allow many longs to become profitable—too heavy of a train is hard to pull and not worth it.
If I were the market maker, how would I maximize my profit?: First do a dead-cat bounce, then kill the longs. Current price is 5. I wouldn’t keep dumping lower. If I continued to sell off aggressively, the money I make would be much less. I’d slowly pull it up to 5.5, then quickly push it to around 6, so longs keep entering. Finally, I’d do a real leverage wipeout and smash it down to around 4.5. This way, the market maker’s profit would be maximized.
Of course, if you’re at 5 and you just go long now with a stop loss at 4.5, whether that price breaks or whether there will be another push up depends on the data at the time. For smaller positions, you can keep playing—just smashing the market isn’t very beneficial to this market maker, and could even be a loss.
Current latest data:
funding: +2.0%.
Large holder long/short ratio: 70% longs, 30% shorts.
For regular accounts, the long/short ratio is close to 1:1, with longs slightly higher: 53.2% longs, 46.8% shorts.
Order book data: 0.96, meaning the active sell side is higher.
Liquidations in the last 24 hours: longs about $310K, shorts about $3.0M.
OI: in the last 24 hours 24.1%, 4H 6.74%, 1H 1.34%. A very interesting combination. It suggests that profitable positions are being closed out, liquidations are happening, and leverage is being reduced actively.
Data breakdown: If you understand these metrics, you’ll see that the market maker’s first round of pumping up plus killing the shorts has already been completed. The liquidation amount for shorts is roughly ten times that of longs. Based on the current data, if the market maker wants to keep making money, they wouldn’t simply pump straight up. If they did, they’d allow many longs to become profitable—too heavy of a train is hard to pull and not worth it.
If I were the market maker, how would I maximize my profit?: First do a dead-cat bounce, then kill the longs. Current price is 5. I wouldn’t keep dumping lower. If I continued to sell off aggressively, the money I make would be much less. I’d slowly pull it up to 5.5, then quickly push it to around 6, so longs keep entering. Finally, I’d do a real leverage wipeout and smash it down to around 4.5. This way, the market maker’s profit would be maximized.
Of course, if you’re at 5 and you just go long now with a stop loss at 4.5, whether that price breaks or whether there will be another push up depends on the data at the time. For smaller positions, you can keep playing—just smashing the market isn’t very beneficial to this market maker, and could even be a loss.
107
·
--
Bullish
$BNC Now let me give you a deep analysis of how BNC might move next.
Current latest data:
funding: +2.0%.
Large holder long/short ratio: 70% longs, 30% shorts.
For regular accounts, the long/short ratio is close to 1:1, with longs slightly higher: 53.2% longs, 46.8% shorts.
Order book data: 0.96, meaning the active sell side is higher.
Liquidations in the last 24 hours: longs about $310K, shorts about $3.0M.
OI: in the last 24 hours 24.1%, 4H 6.74%, 1H 1.34%. A very interesting combination. It suggests that profitable positions are being closed out, liquidations are happening, and leverage is being reduced actively.
Data breakdown: If you understand these metrics, you’ll see that the market maker’s first round of pumping up plus killing the shorts has already been completed. The liquidation amount for shorts is roughly ten times that of longs. Based on the current data, if the market maker wants to keep making money, they wouldn’t simply pump straight up. If they did, they’d allow many longs to become profitable—too heavy of a train is hard to pull and not worth it.
If I were the market maker, how would I maximize my profit?: First do a dead-cat bounce, then kill the longs. Current price is 5. I wouldn’t keep dumping lower. If I continued to sell off aggressively, the money I make would be much less. I’d slowly pull it up to 5.5, then quickly push it to around 6, so longs keep entering. Finally, I’d do a real leverage wipeout and smash it down to around 4.5. This way, the market maker’s profit would be maximized.
Of course, if you’re at 5 and you just go long now with a stop loss at 4.5, whether that price breaks or whether there will be another push up depends on the data at the time. For smaller positions, you can keep playing—just smashing the market isn’t very beneficial to this market maker, and could even be a loss.
$BNC Now let me give you a deep analysis of how BNC might move next.
Current latest data:
funding: +2.0%.
Large holder long/short ratio: 70% longs, 30% shorts.
For regular accounts, the long/short ratio is close to 1:1, with longs slightly higher: 53.2% longs, 46.8% shorts.
Order book data: 0.96, meaning the active sell side is higher.
Liquidations in the last 24 hours: longs about $310K, shorts about $3.0M.
OI: in the last 24 hours 24.1%, 4H 6.74%, 1H 1.34%. A very interesting combination. It suggests that profitable positions are being closed out, liquidations are happening, and leverage is being reduced actively.
Data breakdown: If you understand these metrics, you’ll see that the market maker’s first round of pumping up plus killing the shorts has already been completed. The liquidation amount for shorts is roughly ten times that of longs. Based on the current data, if the market maker wants to keep making money, they wouldn’t simply pump straight up. If they did, they’d allow many longs to become profitable—too heavy of a train is hard to pull and not worth it.
If I were the market maker, how would I maximize my profit?: First do a dead-cat bounce, then kill the longs. Current price is 5. I wouldn’t keep dumping lower. If I continued to sell off aggressively, the money I make would be much less. I’d slowly pull it up to 5.5, then quickly push it to around 6, so longs keep entering. Finally, I’d do a real leverage wipeout and smash it down to around 4.5. This way, the market maker’s profit would be maximized.
Of course, if you’re at 5 and you just go long now with a stop loss at 4.5, whether that price breaks or whether there will be another push up depends on the data at the time. For smaller positions, you can keep playing—just smashing the market isn’t very beneficial to this market maker, and could even be a loss.
Current latest data:
funding: +2.0%.
Large holder long/short ratio: 70% longs, 30% shorts.
For regular accounts, the long/short ratio is close to 1:1, with longs slightly higher: 53.2% longs, 46.8% shorts.
Order book data: 0.96, meaning the active sell side is higher.
Liquidations in the last 24 hours: longs about $310K, shorts about $3.0M.
OI: in the last 24 hours 24.1%, 4H 6.74%, 1H 1.34%. A very interesting combination. It suggests that profitable positions are being closed out, liquidations are happening, and leverage is being reduced actively.
Data breakdown: If you understand these metrics, you’ll see that the market maker’s first round of pumping up plus killing the shorts has already been completed. The liquidation amount for shorts is roughly ten times that of longs. Based on the current data, if the market maker wants to keep making money, they wouldn’t simply pump straight up. If they did, they’d allow many longs to become profitable—too heavy of a train is hard to pull and not worth it.
If I were the market maker, how would I maximize my profit?: First do a dead-cat bounce, then kill the longs. Current price is 5. I wouldn’t keep dumping lower. If I continued to sell off aggressively, the money I make would be much less. I’d slowly pull it up to 5.5, then quickly push it to around 6, so longs keep entering. Finally, I’d do a real leverage wipeout and smash it down to around 4.5. This way, the market maker’s profit would be maximized.
Of course, if you’re at 5 and you just go long now with a stop loss at 4.5, whether that price breaks or whether there will be another push up depends on the data at the time. For smaller positions, you can keep playing—just smashing the market isn’t very beneficial to this market maker, and could even be a loss.
1
1
288
·
--
Article
Come for an in-depth analysis of ZEC's future trendHere are the latest market data for $ZEC : the 24H trading volume in contracts is more than 8 times that of spot. Across all platforms, the long/short ratio is: longs 30, shorts 70. And within these data, the proportion of large-capital accounts is around 1:1. Average funding across the entire platform is around +0.01%. Open interest has not increased explosively and is relatively healthy. The current price is 1185, and the highest price is 1256.98, which means the liquidity above has already been swept. The low is at 1125.51, while the liquidity below is around 1112, which means the liquidity below has not yet been swept.
And spot data also shows that there are real buyers in the spot market; it is not as simple as just whales pumping the price, and there is real catalyst as well.
Come for an in-depth analysis of ZEC's future trend
Here are the latest market data for $ZEC : the 24H trading volume in contracts is more than 8 times that of spot. Across all platforms, the long/short ratio is: longs 30, shorts 70. And within these data, the proportion of large-capital accounts is around 1:1. Average funding across the entire platform is around +0.01%. Open interest has not increased explosively and is relatively healthy. The current price is 1185, and the highest price is 1256.98, which means the liquidity above has already been swept. The low is at 1125.51, while the liquidity below is around 1112, which means the liquidity below has not yet been swept.
And spot data also shows that there are real buyers in the spot market; it is not as simple as just whales pumping the price, and there is real catalyst as well.
And spot data also shows that there are real buyers in the spot market; it is not as simple as just whales pumping the price, and there is real catalyst as well.
1
199
·
--
Bullish
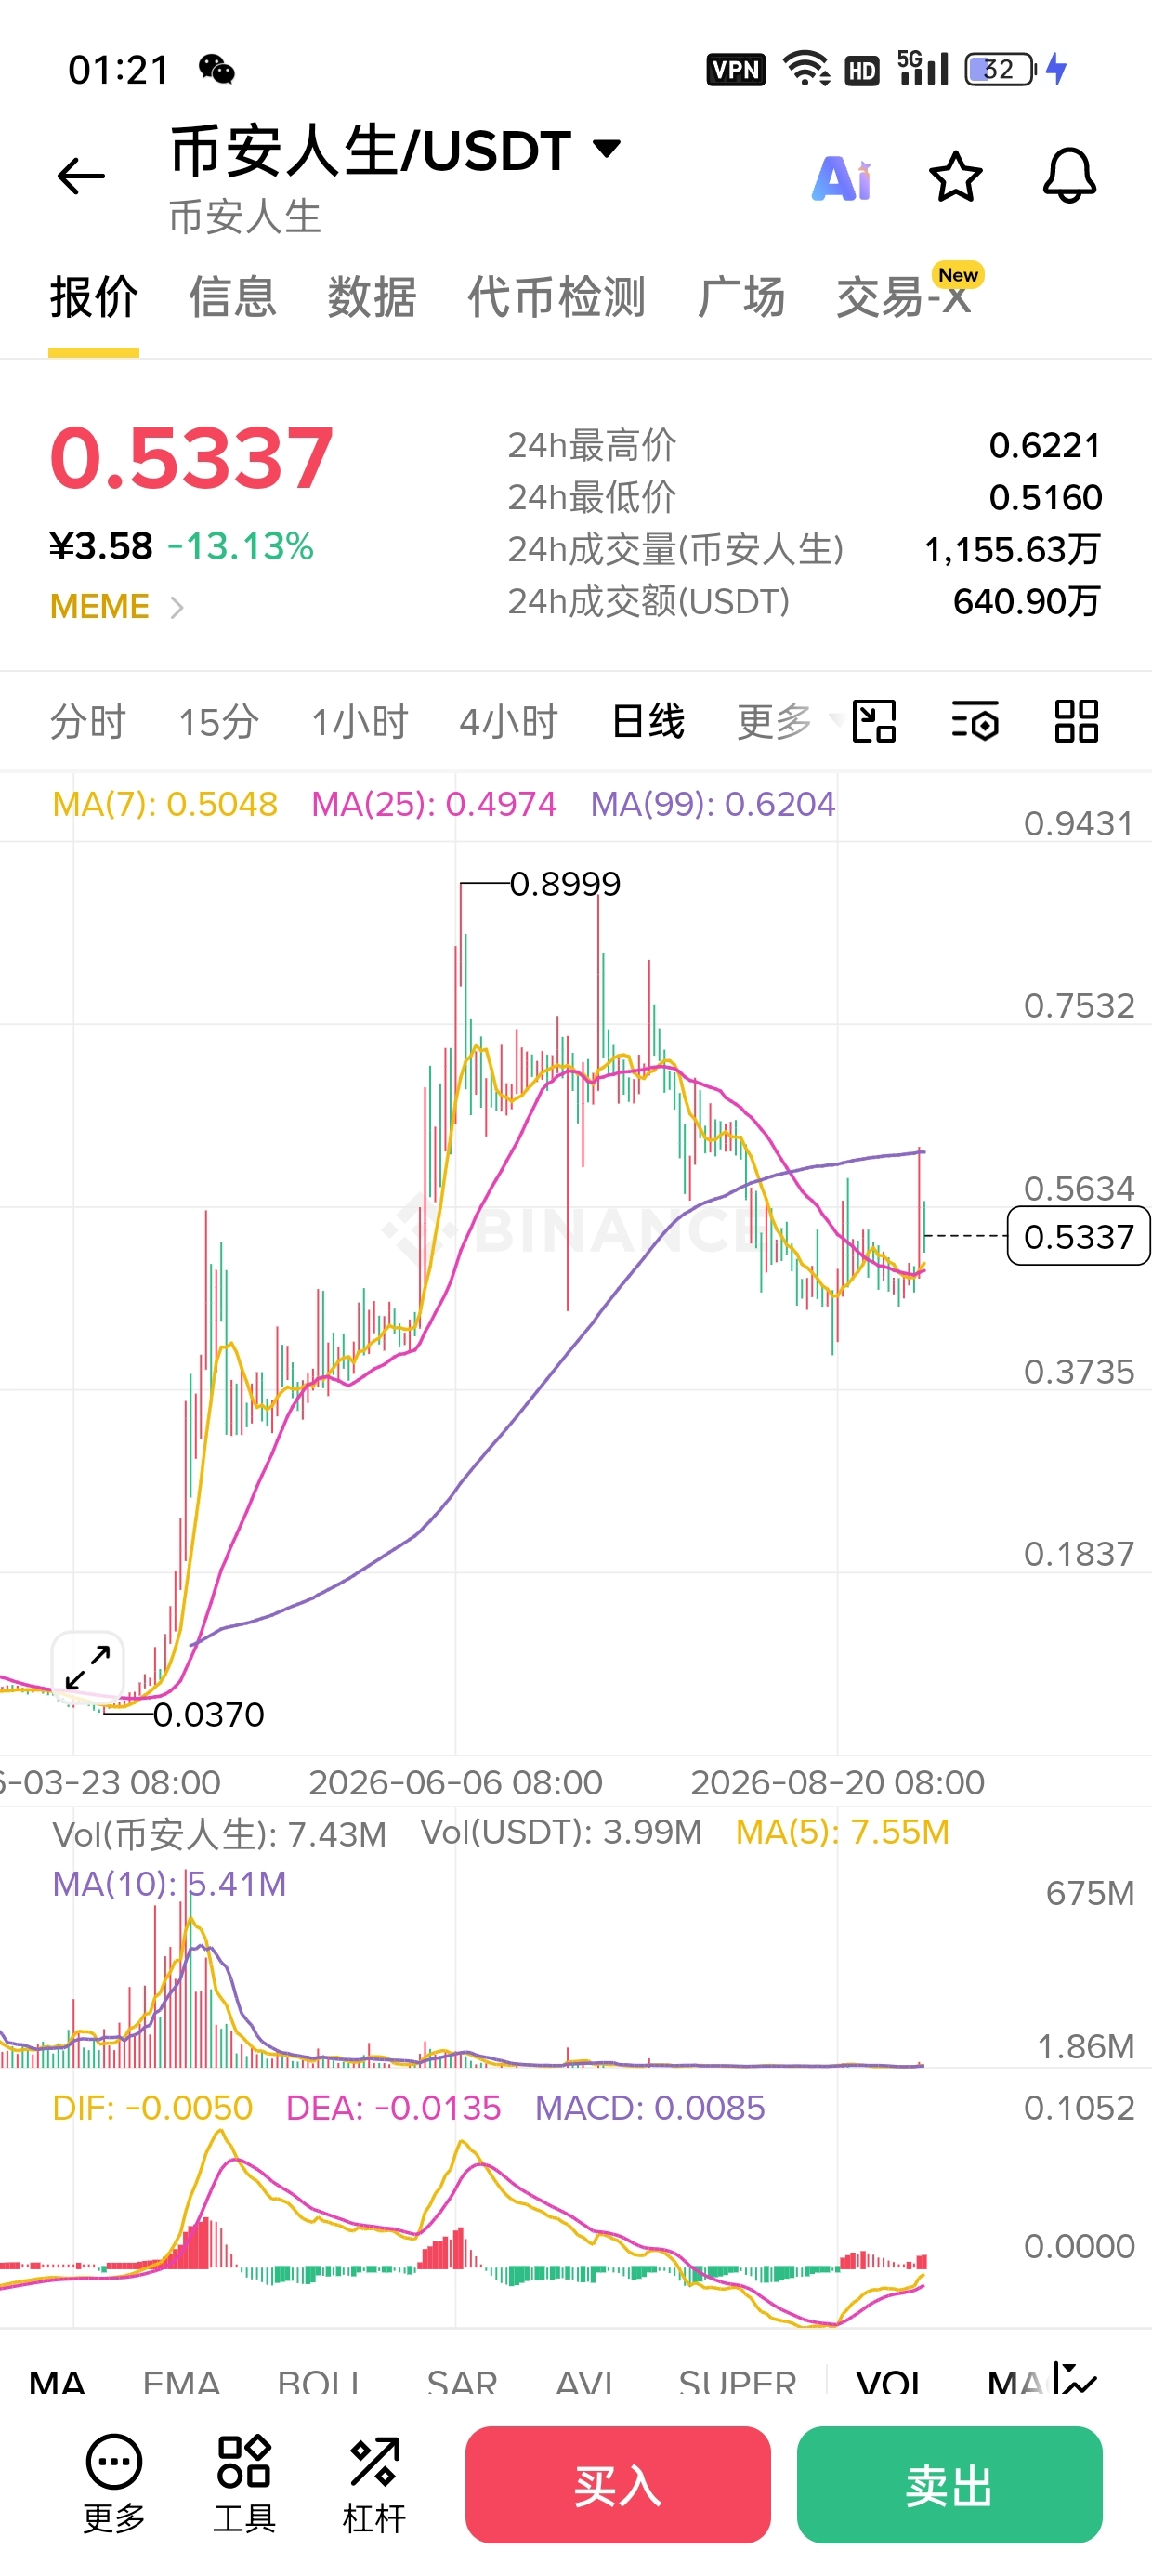
#币安人生 $币安人生 Now let’s use data to analyze the likely future trend of this Binance Life coin.
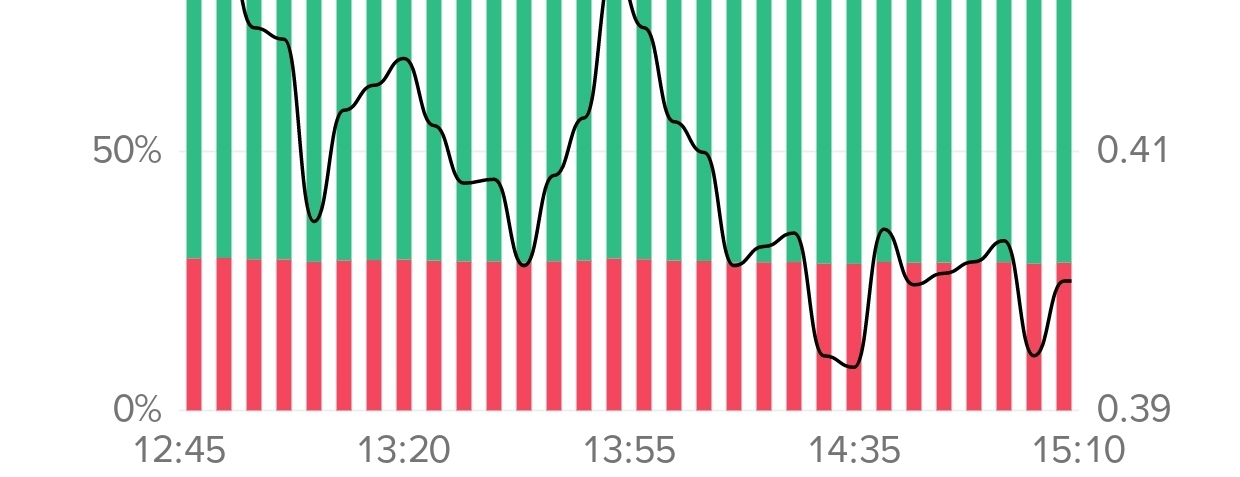
The current data for this coin: funding is mild, the long-short ratio is almost 1:1, and OI has been washed down from around 49M to around 41M.
If you understand these data, you can tell that this coin is not suitable for a rally right now. On the contrary, it is more likely to keep drifting lower and continue trapping bears. When looking at a coin like this, you should shift your perspective to the market maker and think about how they would act to maximize profits. Once you figure that out, you can reach the conclusion about the next move: a big pump now is not feasible, and a dump is also not suitable. If I were the market maker, I would continue to lure in shorts, repeatedly creating liquidity traps between 0.48 and 0.5, and then choose the opposite direction to harvest them. That is the most profitable way for the market maker.
So, this coin will continue to drift lower toward 0.48-0.5 to keep trapping and flushing out positions. There may even be a brief move below around 0.47, but it often quickly rebounds. If too many people are short, then there will be fuel for another aggressive pump. So if you trade this coin, you can short it for a very short term, but never hold it for too long. It is best to only take long positions for the long term. The next surge targets are 0.7——0.8——0.9.
If anyone has a coin they want me to analyze, leave a comment and I’ll take a look#BTC触及80000美元
{future}(币安人生USDT)
#币安人生 $币安人生 Now let’s use data to analyze the likely future trend of this Binance Life coin.
The current data for this coin: funding is mild, the long-short ratio is almost 1:1, and OI has been washed down from around 49M to around 41M.
If you understand these data, you can tell that this coin is not suitable for a rally right now. On the contrary, it is more likely to keep drifting lower and continue trapping bears. When looking at a coin like this, you should shift your perspective to the market maker and think about how they would act to maximize profits. Once you figure that out, you can reach the conclusion about the next move: a big pump now is not feasible, and a dump is also not suitable. If I were the market maker, I would continue to lure in shorts, repeatedly creating liquidity traps between 0.48 and 0.5, and then choose the opposite direction to harvest them. That is the most profitable way for the market maker.
So, this coin will continue to drift lower toward 0.48-0.5 to keep trapping and flushing out positions. There may even be a brief move below around 0.47, but it often quickly rebounds. If too many people are short, then there will be fuel for another aggressive pump. So if you trade this coin, you can short it for a very short term, but never hold it for too long. It is best to only take long positions for the long term. The next surge targets are 0.7——0.8——0.9.
If anyone has a coin they want me to analyze, leave a comment and I’ll take a look#BTC触及80000美元
The current data for this coin: funding is mild, the long-short ratio is almost 1:1, and OI has been washed down from around 49M to around 41M.
If you understand these data, you can tell that this coin is not suitable for a rally right now. On the contrary, it is more likely to keep drifting lower and continue trapping bears. When looking at a coin like this, you should shift your perspective to the market maker and think about how they would act to maximize profits. Once you figure that out, you can reach the conclusion about the next move: a big pump now is not feasible, and a dump is also not suitable. If I were the market maker, I would continue to lure in shorts, repeatedly creating liquidity traps between 0.48 and 0.5, and then choose the opposite direction to harvest them. That is the most profitable way for the market maker.
So, this coin will continue to drift lower toward 0.48-0.5 to keep trapping and flushing out positions. There may even be a brief move below around 0.47, but it often quickly rebounds. If too many people are short, then there will be fuel for another aggressive pump. So if you trade this coin, you can short it for a very short term, but never hold it for too long. It is best to only take long positions for the long term. The next surge targets are 0.7——0.8——0.9.
If anyone has a coin they want me to analyze, leave a comment and I’ll take a look#BTC触及80000美元
8
2
1.7k
·
--
Bullish
$RUNE current price 0.56 take profit 0.6
{future}(RUNEUSDT)
$RUNE current price 0.56 take profit 0.6
1
38
·
--
$FET deep capital map
Data time: 2026-08-28 00:17:12
Current price: 0.166
Futures contract funding
OI: 15m +0.00% | 30m -0.09% | 1h +0.24%
Price: 15m -0.12% | 30m -0.24% | Positions are declining
Funding rate: -0.0114% | Historical percentile 85% | Global long/short ratio 1.96
Large account long/short ratio: 2.53 | 30m change -0.018
Aggressive trades and order book
Aggressive buy share of the contract: 45.2% | Aggressive sell is dominant
CVD: 5m -0.097 | 15m -0.181
Order book: buy/sell depth ratio 0.97 | Buy and sell resting orders are nearly balanced | Spread 0.0000%
Trade density price ranges
POC (control point of volume): 0.165575
Value area: 0.1655 - 0.16605 | VWAP: 0.16537618
High trade-density area: 0.165575, 0.165775
Low trade-sparsity area: 0.165325, 0.165375
Note: POC/value area are derived from the executed volume distribution; order book depth reflects current resting orders and is not equivalent to actual buying or selling flows.
Spot–perp marker: +0.0000% (positive means the mark price is higher than the reference spot)
On-chain: There is currently no verifiable token-level public on-chain trade data. This post does not include it in the assessment.
Summary: Long/short data has not yet formed a consensus. No directional judgment is made for now—wait for funding and price to move in sync.
This is an observation of data and does not constitute trading advice; funding, order book, and on-chain data will continue to change.
$FET #FET行情 #资金流 #币安广场 #PISTACIO
$FET deep capital map
Data time: 2026-08-28 00:17:12
Current price: 0.166
Futures contract funding
OI: 15m +0.00% | 30m -0.09% | 1h +0.24%
Price: 15m -0.12% | 30m -0.24% | Positions are declining
Funding rate: -0.0114% | Historical percentile 85% | Global long/short ratio 1.96
Large account long/short ratio: 2.53 | 30m change -0.018
Aggressive trades and order book
Aggressive buy share of the contract: 45.2% | Aggressive sell is dominant
CVD: 5m -0.097 | 15m -0.181
Order book: buy/sell depth ratio 0.97 | Buy and sell resting orders are nearly balanced | Spread 0.0000%
Trade density price ranges
POC (control point of volume): 0.165575
Value area: 0.1655 - 0.16605 | VWAP: 0.16537618
High trade-density area: 0.165575, 0.165775
Low trade-sparsity area: 0.165325, 0.165375
Note: POC/value area are derived from the executed volume distribution; order book depth reflects current resting orders and is not equivalent to actual buying or selling flows.
Spot–perp marker: +0.0000% (positive means the mark price is higher than the reference spot)
On-chain: There is currently no verifiable token-level public on-chain trade data. This post does not include it in the assessment.
Summary: Long/short data has not yet formed a consensus. No directional judgment is made for now—wait for funding and price to move in sync.
This is an observation of data and does not constitute trading advice; funding, order book, and on-chain data will continue to change.
$FET #FET行情 #资金流 #币安广场 #PISTACIO
Data time: 2026-08-28 00:17:12
Current price: 0.166
Futures contract funding
OI: 15m +0.00% | 30m -0.09% | 1h +0.24%
Price: 15m -0.12% | 30m -0.24% | Positions are declining
Funding rate: -0.0114% | Historical percentile 85% | Global long/short ratio 1.96
Large account long/short ratio: 2.53 | 30m change -0.018
Aggressive trades and order book
Aggressive buy share of the contract: 45.2% | Aggressive sell is dominant
CVD: 5m -0.097 | 15m -0.181
Order book: buy/sell depth ratio 0.97 | Buy and sell resting orders are nearly balanced | Spread 0.0000%
Trade density price ranges
POC (control point of volume): 0.165575
Value area: 0.1655 - 0.16605 | VWAP: 0.16537618
High trade-density area: 0.165575, 0.165775
Low trade-sparsity area: 0.165325, 0.165375
Note: POC/value area are derived from the executed volume distribution; order book depth reflects current resting orders and is not equivalent to actual buying or selling flows.
Spot–perp marker: +0.0000% (positive means the mark price is higher than the reference spot)
On-chain: There is currently no verifiable token-level public on-chain trade data. This post does not include it in the assessment.
Summary: Long/short data has not yet formed a consensus. No directional judgment is made for now—wait for funding and price to move in sync.
This is an observation of data and does not constitute trading advice; funding, order book, and on-chain data will continue to change.
$FET #FET行情 #资金流 #币安广场 #PISTACIO
27
·
--
$ZRO Deep Capital Map
Data time: 2026-08-27 23:39:01
Current price: 1.2509
Futures contract funding
OI: 15m +0.60% | 30m +0.72% | 1h +0.61%
Price: 15m +3.46% | 30m +3.24% | price and open interest moving in sync
Funding rate: +0.0050% | Historical percentile 100% | Long/short ratio across the network 0.90
Large account long/short ratio: 1.03 | 30m change -0.154
Aggressive trades and order book
Proportion of contract aggressive buy orders: 62.7% | Aggressive buying dominates
CVD: 5m +0.254 | 15m +0.254
Order book: bid/ask depth ratio 0.71 | sell-side orders are thicker | spread 0.0000%
High-activity trade price zones
POC (volume control point): 1.2504
Value area: 1.2474 - 1.251 | VWAP: 1.1913
High-activity dense zones: 1.2463, 1.2485
Low-activity sparse zones: 1.2458, 1.2461
Note: POC/value area are derived from executed volume distribution; order book depth reflects current resting orders, not actual buys or sell-offs.
Spot-futures mark: +0.0000% (positive means mark price is higher than the reference spot)
On-chain: there is currently no verifiable public token-level on-chain trade data; this post does not include it in the assessment.
Summary: Multiple funding and execution metrics lean bullish; observe cautiously with a bullish bias. Do not chase if price falls back below the lower edge of the value area.
This is for data observation only and does not constitute buying/selling advice; funding, order book, and on-chain data will continue to change.
$ZRO #ZRO行情 #资金流 #币安广场 #PISTACIO
$ZRO Deep Capital Map
Data time: 2026-08-27 23:39:01
Current price: 1.2509
Futures contract funding
OI: 15m +0.60% | 30m +0.72% | 1h +0.61%
Price: 15m +3.46% | 30m +3.24% | price and open interest moving in sync
Funding rate: +0.0050% | Historical percentile 100% | Long/short ratio across the network 0.90
Large account long/short ratio: 1.03 | 30m change -0.154
Aggressive trades and order book
Proportion of contract aggressive buy orders: 62.7% | Aggressive buying dominates
CVD: 5m +0.254 | 15m +0.254
Order book: bid/ask depth ratio 0.71 | sell-side orders are thicker | spread 0.0000%
High-activity trade price zones
POC (volume control point): 1.2504
Value area: 1.2474 - 1.251 | VWAP: 1.1913
High-activity dense zones: 1.2463, 1.2485
Low-activity sparse zones: 1.2458, 1.2461
Note: POC/value area are derived from executed volume distribution; order book depth reflects current resting orders, not actual buys or sell-offs.
Spot-futures mark: +0.0000% (positive means mark price is higher than the reference spot)
On-chain: there is currently no verifiable public token-level on-chain trade data; this post does not include it in the assessment.
Summary: Multiple funding and execution metrics lean bullish; observe cautiously with a bullish bias. Do not chase if price falls back below the lower edge of the value area.
This is for data observation only and does not constitute buying/selling advice; funding, order book, and on-chain data will continue to change.
$ZRO #ZRO行情 #资金流 #币安广场 #PISTACIO
Data time: 2026-08-27 23:39:01
Current price: 1.2509
Futures contract funding
OI: 15m +0.60% | 30m +0.72% | 1h +0.61%
Price: 15m +3.46% | 30m +3.24% | price and open interest moving in sync
Funding rate: +0.0050% | Historical percentile 100% | Long/short ratio across the network 0.90
Large account long/short ratio: 1.03 | 30m change -0.154
Aggressive trades and order book
Proportion of contract aggressive buy orders: 62.7% | Aggressive buying dominates
CVD: 5m +0.254 | 15m +0.254
Order book: bid/ask depth ratio 0.71 | sell-side orders are thicker | spread 0.0000%
High-activity trade price zones
POC (volume control point): 1.2504
Value area: 1.2474 - 1.251 | VWAP: 1.1913
High-activity dense zones: 1.2463, 1.2485
Low-activity sparse zones: 1.2458, 1.2461
Note: POC/value area are derived from executed volume distribution; order book depth reflects current resting orders, not actual buys or sell-offs.
Spot-futures mark: +0.0000% (positive means mark price is higher than the reference spot)
On-chain: there is currently no verifiable public token-level on-chain trade data; this post does not include it in the assessment.
Summary: Multiple funding and execution metrics lean bullish; observe cautiously with a bullish bias. Do not chase if price falls back below the lower edge of the value area.
This is for data observation only and does not constitute buying/selling advice; funding, order book, and on-chain data will continue to change.
$ZRO #ZRO行情 #资金流 #币安广场 #PISTACIO
30
Log in to explore more content
Join global crypto users on Binance Square
⚡️ Get latest and useful information about crypto.
💬 Trusted by the world’s largest crypto exchange.
👍 Discover real insights from verified creators.
Email / Phone number
Trending Topics
UKFCAWinsCourtOrderToRecover851400Pounds
6,841 views
465 Discussing
🚨 CRYPTO REGULATION JUST ENTERED A NEW PHASE: THEY’RE NOT ONLY WRITING RULES — THEY’RE TAKING MONEY BACK.
The UK’s FCA has secured another court-backed asset recovery, reinforcing a broader enforcement push against unauthorized financial and crypto-related activity.
And look at what’s happening simultaneously:
🇬🇧 FCA → enforcement + asset recovery
🇺🇸 SEC → clearer rules for functional crypto assets
🇺🇸 Fed → formal stablecoin supervision under the GENIUS Act
That combination matters.
Regulators are no longer debating whether crypto belongs inside the financial system.
They’re increasingly deciding who gets access, what rules they follow, and what happens when those rules are broken.
The next crypto cycle may not be “regulation vs innovation.”
It may be regulated crypto vs everyone who can’t meet the standard. 👀
$COIN $CRCL $BTC
#ukfcawinscourtordertorecover851400pounds #ChainlinkLaunchesCCIP2WithEnterpriseVerification #GoldFallsTo$4144 #QNTFallsOver40%FromMorningHigh #USDTAdds845900HoldersInPast7Days
KimHotbae
·2 Likes
·3.9k views
ChainlinkLaunchesCCIP2WithEnterpriseVerification
19,985 views
704 Discussing
GoldFallsTo$4144
8,387 views
119 Discussing