

Scan Market Signals
2.6k Posts

Scan Market Signals
Report
Block User
Scanner Pro | Real-Time Binance Signals & Data-Driven TA 📊 Zero FOMO, Pure Execution
3 Following
67 Followers
77 Liked
Posts
All
Quotes
Videos
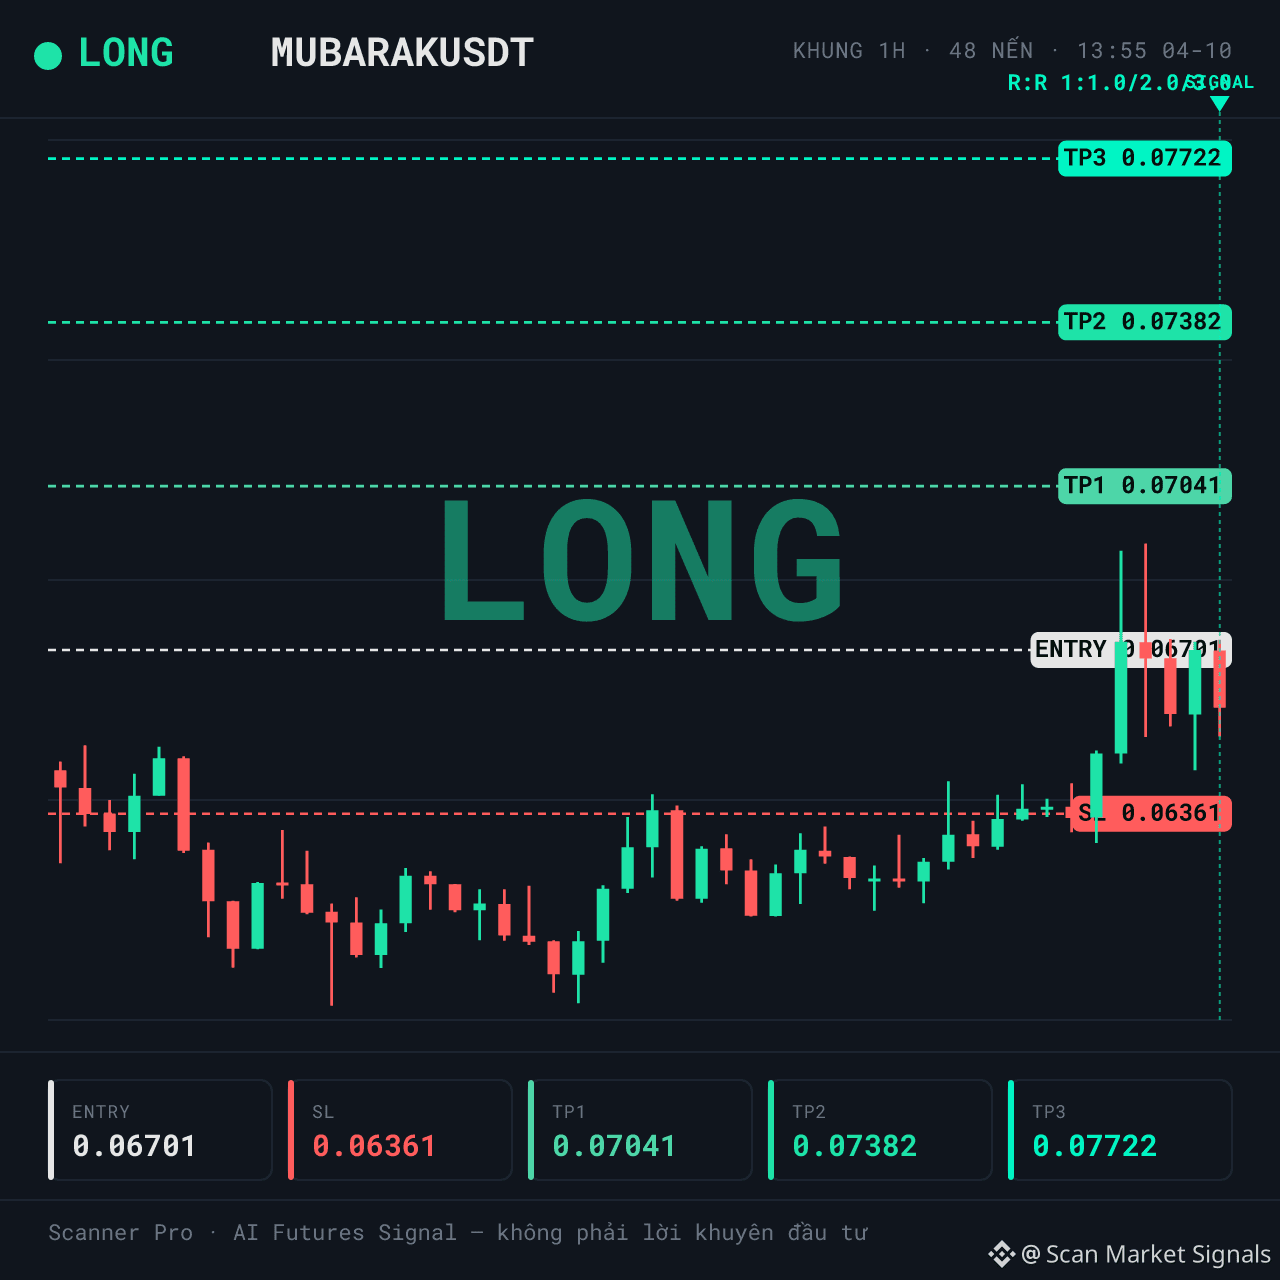
LONG $MUBARAK | Uptrend but the crowd is paying to maintain their position
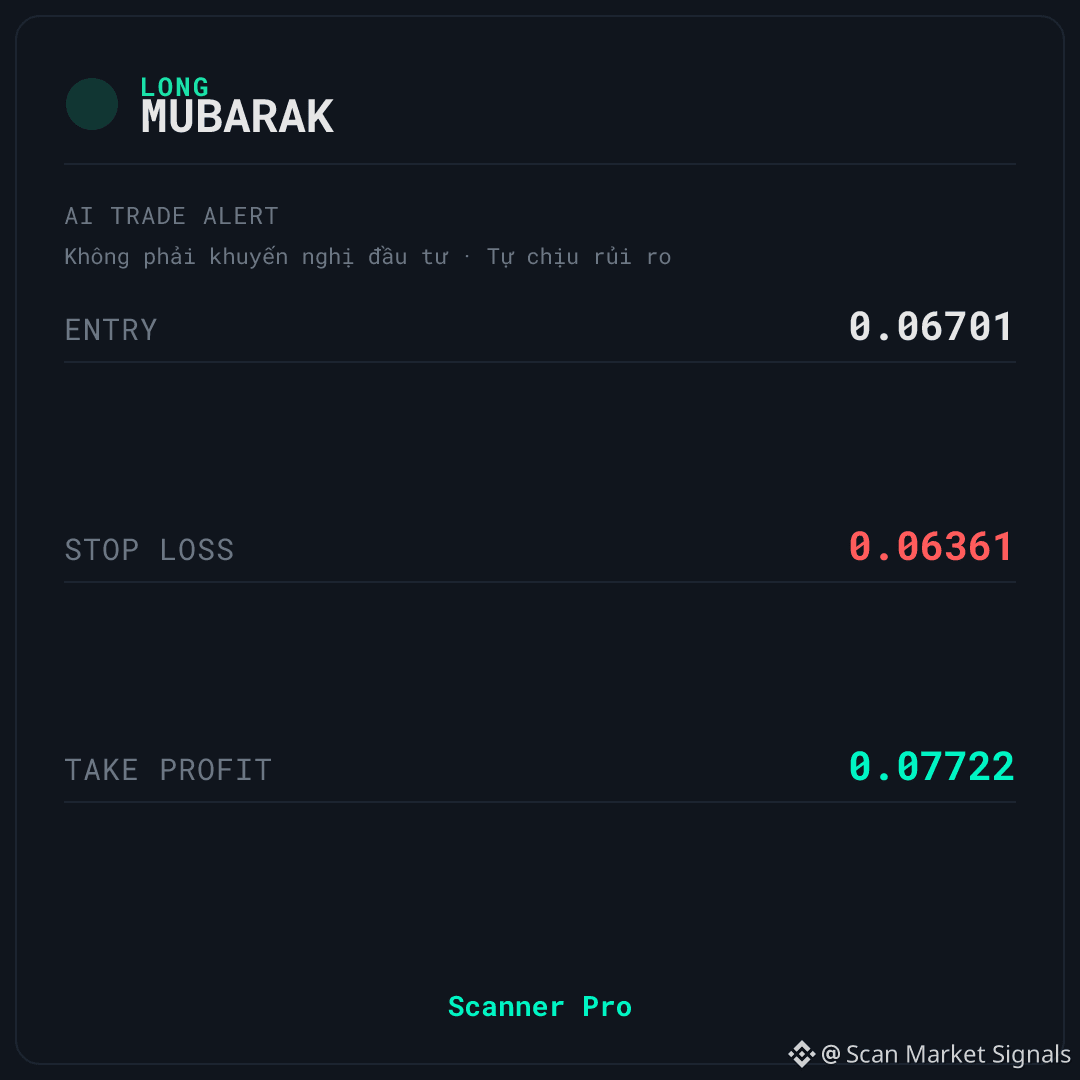
🚨 AI TRADE ALERT — $MUBARAK
🟢 LONG
📌 Entry: 0.06691 – 0.06711
🛑 Stop Loss: 0.06361
🎯 Take Profit: 0.07722
⏰ Valid for: 6 hours (13:55 – 19:55 VN) - Date: 04/10
📈 UPTREND — LONG follows the upward trend
$MUBARAK is being tracked by Scanner Pro for a LONG setup when the price reacts within 57% of the 24h range. The backdrop is classified as trend_up with 70% confidence; 24h volume is about 28,979,542 in the quote asset, with a volume spike of 1.20x.
📊 WHAT IS HAPPENING
Price is holding above the lower half of the 24h range. 24h volume is about 28,979,542 (quote asset) with a volume spike of 1.20x — money flow has returned, but it’s not strong enough to call it a breakout yet.
The backdrop is classified as trend_up with 70% confidence, fitting a trend-friendly scenario rather than trying to catch the bottom. 1h momentum is 59.8 — not yet in overbought territory, but also not cooling off.
⚠️ RISK YOU SHOULD KNOW BEFORE — $MUBARAK
🚫 Biggest downside: funding 0.0050% — the LONG side is paying the SHORT side. The crowd is leaning toward the same side with this signal, and that side has to pay fees. This is a disadvantage, not confirmation.
If price closes below the stop-loss level on the signal card, the current LONG scenario is no longer valid.
In your view, is this a push for continuation, or just a pullback for the selling side to unload?
This is educational technical analysis content, not investment advice. Crypto trading carries high risk—you may lose all your capital. Do your own research and take responsibility for your decisions.
#Binance #Crypto #Futures
LONG $MUBARAK | Uptrend but the crowd is paying to maintain their position
🚨 AI TRADE ALERT — $MUBARAK
🟢 LONG
📌 Entry: 0.06691 – 0.06711
🛑 Stop Loss: 0.06361
🎯 Take Profit: 0.07722
⏰ Valid for: 6 hours (13:55 – 19:55 VN) - Date: 04/10
📈 UPTREND — LONG follows the upward trend
$MUBARAK is being tracked by Scanner Pro for a LONG setup when the price reacts within 57% of the 24h range. The backdrop is classified as trend_up with 70% confidence; 24h volume is about 28,979,542 in the quote asset, with a volume spike of 1.20x.
📊 WHAT IS HAPPENING
Price is holding above the lower half of the 24h range. 24h volume is about 28,979,542 (quote asset) with a volume spike of 1.20x — money flow has returned, but it’s not strong enough to call it a breakout yet.
The backdrop is classified as trend_up with 70% confidence, fitting a trend-friendly scenario rather than trying to catch the bottom. 1h momentum is 59.8 — not yet in overbought territory, but also not cooling off.
⚠️ RISK YOU SHOULD KNOW BEFORE — $MUBARAK
🚫 Biggest downside: funding 0.0050% — the LONG side is paying the SHORT side. The crowd is leaning toward the same side with this signal, and that side has to pay fees. This is a disadvantage, not confirmation.
If price closes below the stop-loss level on the signal card, the current LONG scenario is no longer valid.
In your view, is this a push for continuation, or just a pullback for the selling side to unload?
This is educational technical analysis content, not investment advice. Crypto trading carries high risk—you may lose all your capital. Do your own research and take responsibility for your decisions.
#Binance #Crypto #Futures
🚨 AI TRADE ALERT — $MUBARAK
🟢 LONG
📌 Entry: 0.06691 – 0.06711
🛑 Stop Loss: 0.06361
🎯 Take Profit: 0.07722
⏰ Valid for: 6 hours (13:55 – 19:55 VN) - Date: 04/10
📈 UPTREND — LONG follows the upward trend
$MUBARAK is being tracked by Scanner Pro for a LONG setup when the price reacts within 57% of the 24h range. The backdrop is classified as trend_up with 70% confidence; 24h volume is about 28,979,542 in the quote asset, with a volume spike of 1.20x.
📊 WHAT IS HAPPENING
Price is holding above the lower half of the 24h range. 24h volume is about 28,979,542 (quote asset) with a volume spike of 1.20x — money flow has returned, but it’s not strong enough to call it a breakout yet.
The backdrop is classified as trend_up with 70% confidence, fitting a trend-friendly scenario rather than trying to catch the bottom. 1h momentum is 59.8 — not yet in overbought territory, but also not cooling off.
⚠️ RISK YOU SHOULD KNOW BEFORE — $MUBARAK
🚫 Biggest downside: funding 0.0050% — the LONG side is paying the SHORT side. The crowd is leaning toward the same side with this signal, and that side has to pay fees. This is a disadvantage, not confirmation.
If price closes below the stop-loss level on the signal card, the current LONG scenario is no longer valid.
In your view, is this a push for continuation, or just a pullback for the selling side to unload?
This is educational technical analysis content, not investment advice. Crypto trading carries high risk—you may lose all your capital. Do your own research and take responsibility for your decisions.
#Binance #Crypto #Futures
11
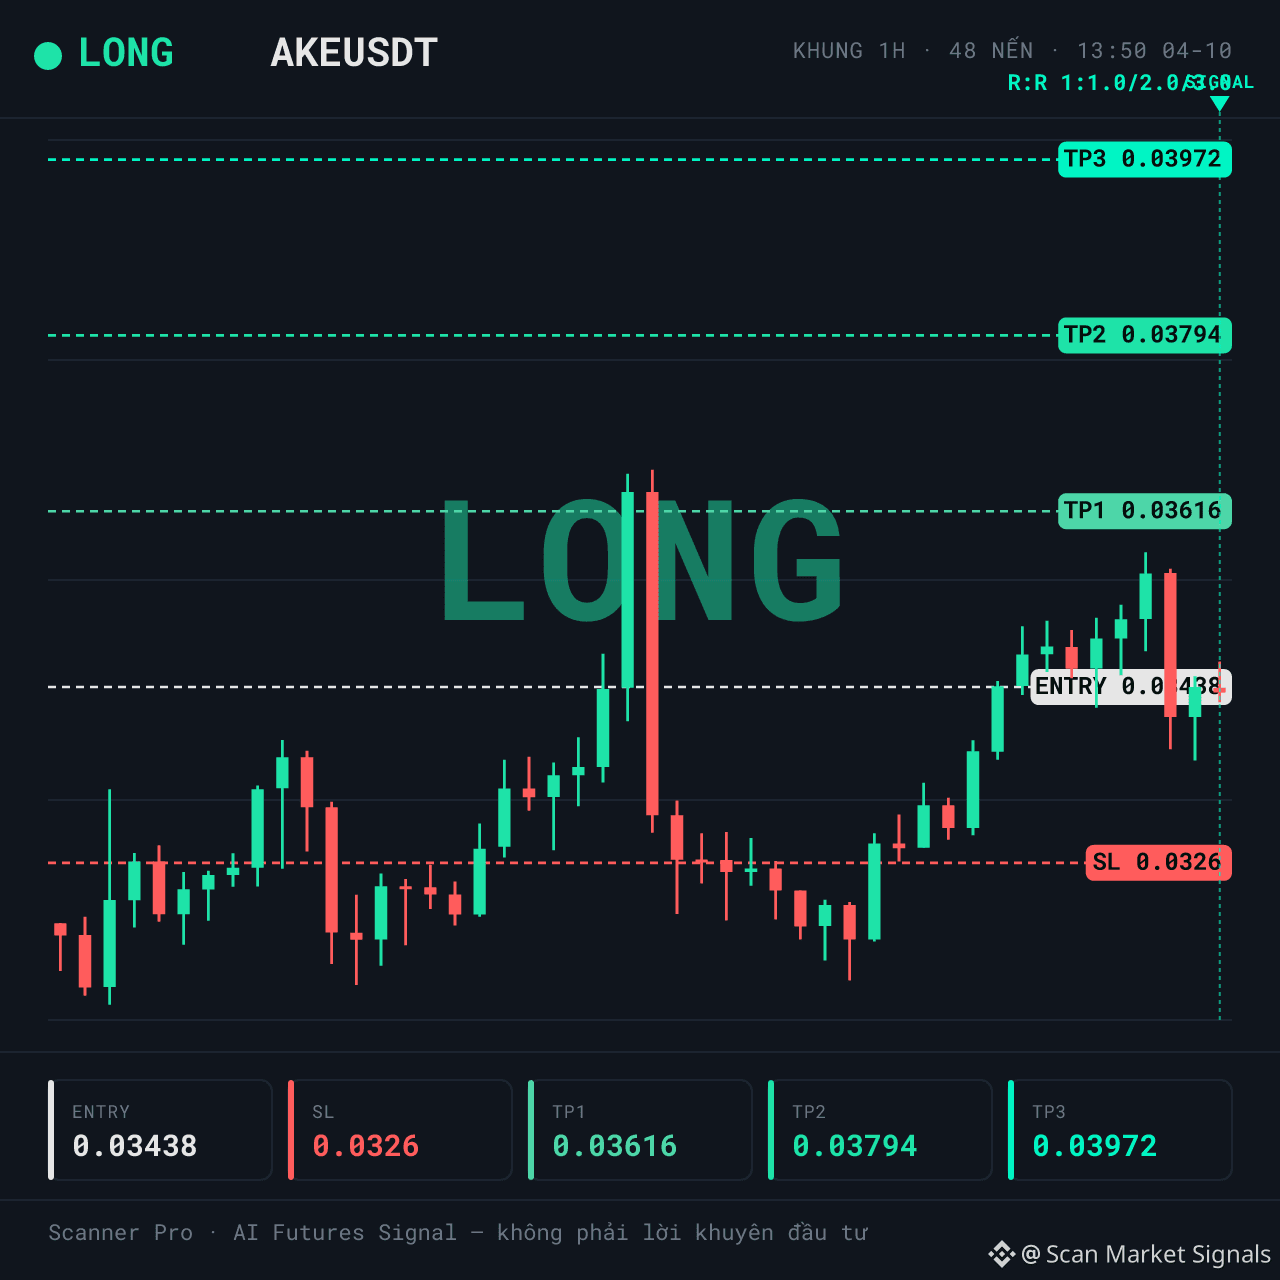
LONG $AKE | The 24h amplitude is tightening, but which side is paying the fees?
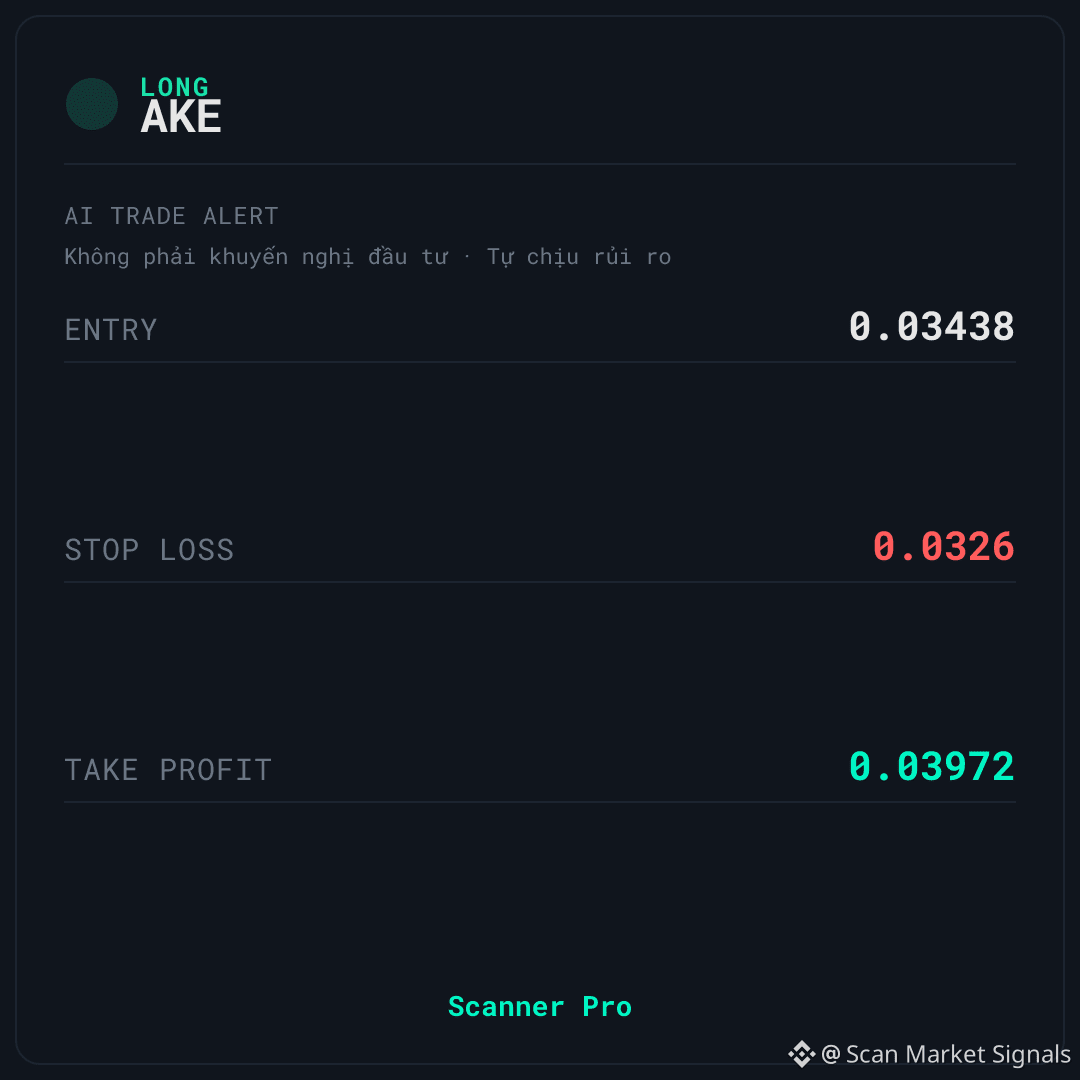
🚨 AI TRADE ALERT — $AKE
🟢 LONG
📌 Entry: 0.03433 – 0.03443
🛑 Stop Loss: 0.0326
🎯 Take Profit: 0.03972
⏰ Validity: 6 hours (13:50 – 19:50 VN) - Date: 04/10
↔️ SIDEWAY — the market is moving sideways, fade signal (mean reversion)
$AKE is being tracked by Scanner Pro for the LONG scenario when the price holds the structure around the entry zone. The context is classified as ranging/sideways with a classification confidence of 55, and a 24h amplitude of 15.1%.
📊 CONTEXT & DATA
The 24h volume is about 45.513.213 based on quote asset, with a volume spike of 0.59x — the money flow has not truly exploded yet. The price is sitting at 55% of the 24h range, meaning it’s in the middle of the trading band—not too high, not too low. Funding 0.0148%: the LONG side is paying the fee to the SHORT side; the market is leaning long.
🚫 INVALID LEVELS & RISK MANAGEMENT — $AKE
⚠️ The biggest downside: the crowd is leaning TOWARD the same side as this signal, and that side is the one paying the fees — this is a risk that needs to be monitored, not a supportive signal. Also, the confidence of the context classification is only 55, which is not high.
🚫 If the price closes below the stop-loss level on the signal card, the current LONG scenario is no longer valid.
💡 In your view, is this an accumulation phase before a breakout or just fluctuation within a narrow range?
This is educational technical analysis content, not investment advice. Crypto trading carries high risk; you could lose all of your capital. Please do your own research and take responsibility for your decisions.
#Binance #Crypto #Futures
LONG $AKE | The 24h amplitude is tightening, but which side is paying the fees?
🚨 AI TRADE ALERT — $AKE
🟢 LONG
📌 Entry: 0.03433 – 0.03443
🛑 Stop Loss: 0.0326
🎯 Take Profit: 0.03972
⏰ Validity: 6 hours (13:50 – 19:50 VN) - Date: 04/10
↔️ SIDEWAY — the market is moving sideways, fade signal (mean reversion)
$AKE is being tracked by Scanner Pro for the LONG scenario when the price holds the structure around the entry zone. The context is classified as ranging/sideways with a classification confidence of 55, and a 24h amplitude of 15.1%.
📊 CONTEXT & DATA
The 24h volume is about 45.513.213 based on quote asset, with a volume spike of 0.59x — the money flow has not truly exploded yet. The price is sitting at 55% of the 24h range, meaning it’s in the middle of the trading band—not too high, not too low. Funding 0.0148%: the LONG side is paying the fee to the SHORT side; the market is leaning long.
🚫 INVALID LEVELS & RISK MANAGEMENT — $AKE
⚠️ The biggest downside: the crowd is leaning TOWARD the same side as this signal, and that side is the one paying the fees — this is a risk that needs to be monitored, not a supportive signal. Also, the confidence of the context classification is only 55, which is not high.
🚫 If the price closes below the stop-loss level on the signal card, the current LONG scenario is no longer valid.
💡 In your view, is this an accumulation phase before a breakout or just fluctuation within a narrow range?
This is educational technical analysis content, not investment advice. Crypto trading carries high risk; you could lose all of your capital. Please do your own research and take responsibility for your decisions.
#Binance #Crypto #Futures
🚨 AI TRADE ALERT — $AKE
🟢 LONG
📌 Entry: 0.03433 – 0.03443
🛑 Stop Loss: 0.0326
🎯 Take Profit: 0.03972
⏰ Validity: 6 hours (13:50 – 19:50 VN) - Date: 04/10
↔️ SIDEWAY — the market is moving sideways, fade signal (mean reversion)
$AKE is being tracked by Scanner Pro for the LONG scenario when the price holds the structure around the entry zone. The context is classified as ranging/sideways with a classification confidence of 55, and a 24h amplitude of 15.1%.
📊 CONTEXT & DATA
The 24h volume is about 45.513.213 based on quote asset, with a volume spike of 0.59x — the money flow has not truly exploded yet. The price is sitting at 55% of the 24h range, meaning it’s in the middle of the trading band—not too high, not too low. Funding 0.0148%: the LONG side is paying the fee to the SHORT side; the market is leaning long.
🚫 INVALID LEVELS & RISK MANAGEMENT — $AKE
⚠️ The biggest downside: the crowd is leaning TOWARD the same side as this signal, and that side is the one paying the fees — this is a risk that needs to be monitored, not a supportive signal. Also, the confidence of the context classification is only 55, which is not high.
🚫 If the price closes below the stop-loss level on the signal card, the current LONG scenario is no longer valid.
💡 In your view, is this an accumulation phase before a breakout or just fluctuation within a narrow range?
This is educational technical analysis content, not investment advice. Crypto trading carries high risk; you could lose all of your capital. Please do your own research and take responsibility for your decisions.
#Binance #Crypto #Futures
9
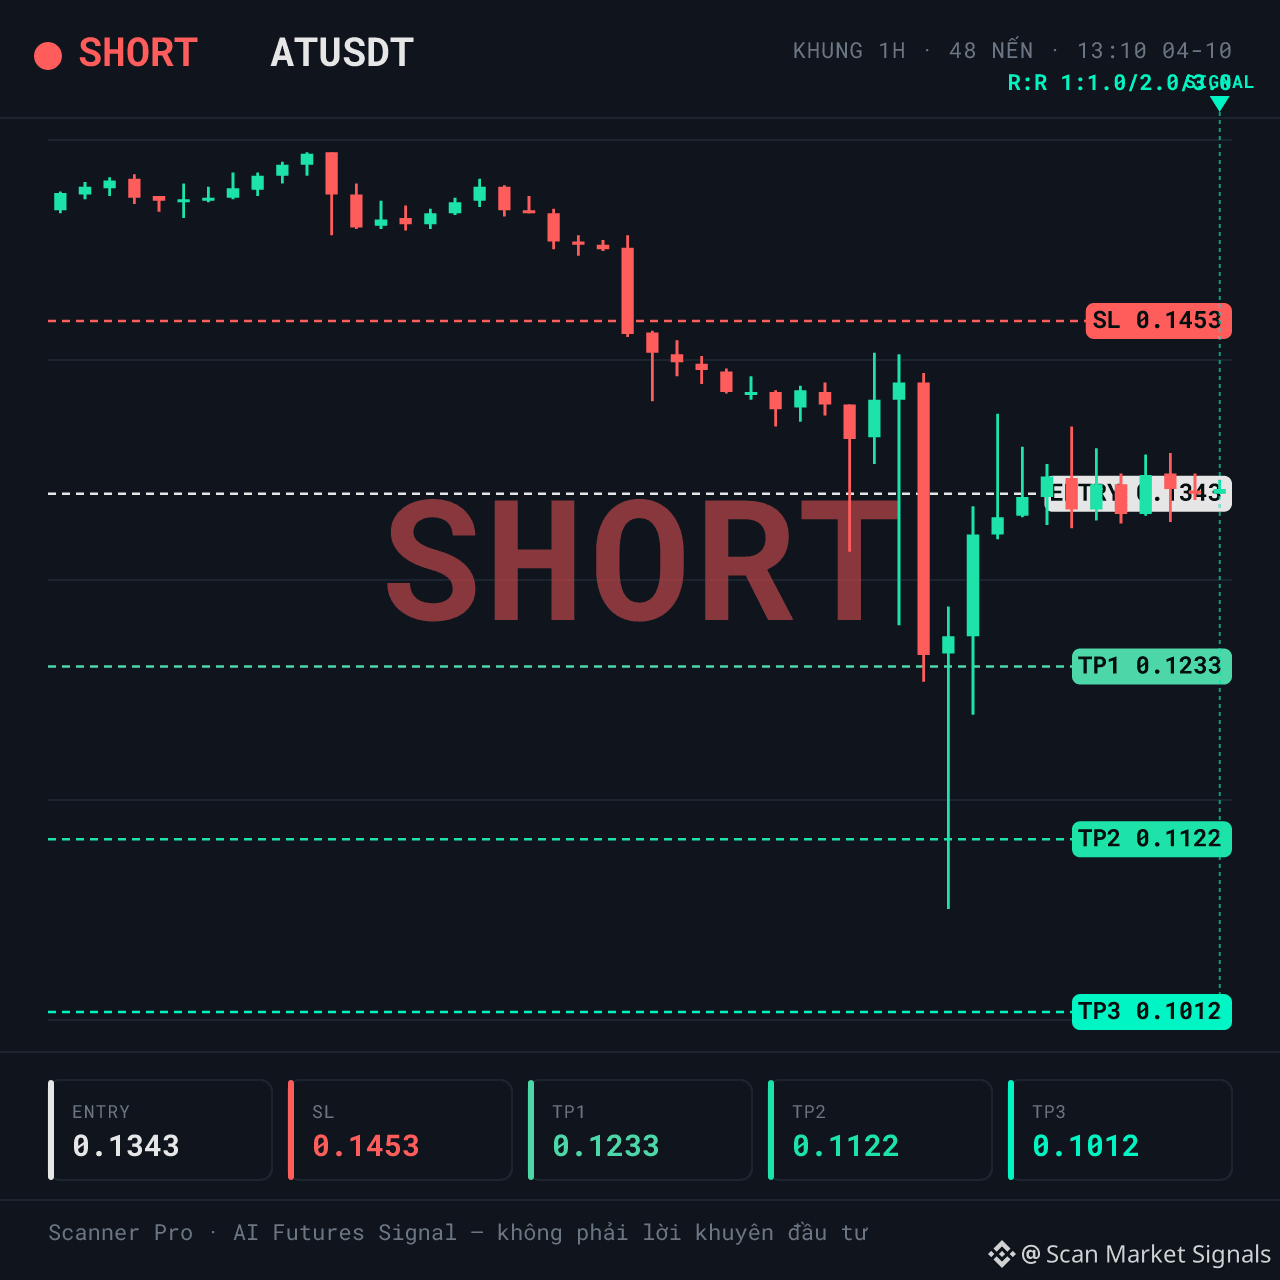
SHORT $AT | Faint volume spike, price hovering around the 24h range, not yet showing a breakout
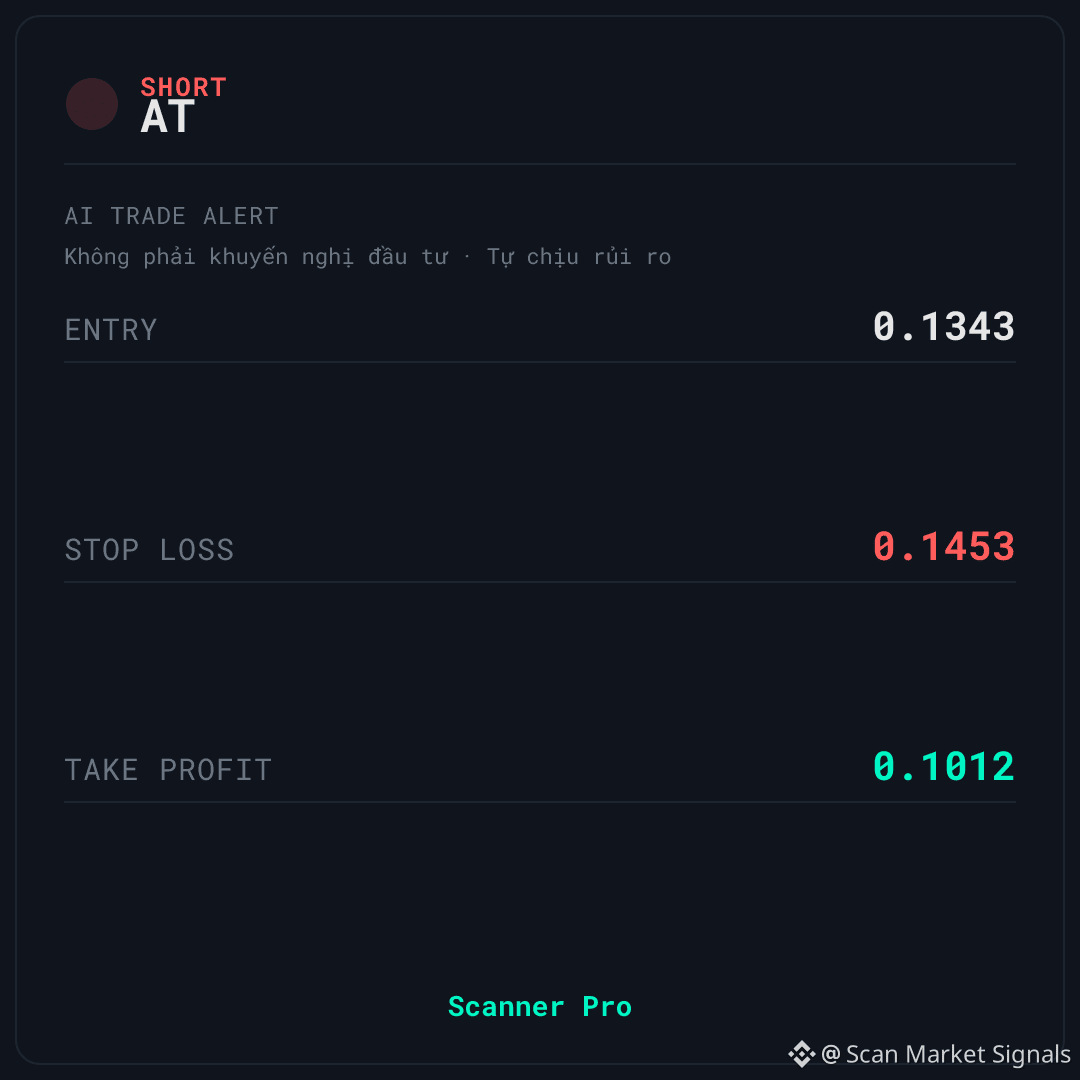
🚨 AI TRADE ALERT — $AT
🔴 SHORT
📌 Entry: 0.1341 – 0.1345
🛑 Stop Loss: 0.1453
🎯 Take Profit: 0.1012
⏰ Validity: 6 hours (13:10 – 19:10 VN) - Date: 04/10
↔️ SIDEWAY — the market is moving sideways; the signal is fading (mean-reversion)
$AT is being monitored by Scanner Pro under the SHORT scenario, since selling pressure is still clearly visible within the price structure. The context is classified as ranging with a classification confidence of 55; the 24h volume is around 26,850,896 in the quote asset, but the volume spike is only 0.03x.
📊 CONTEXT & DATA
The story here is quite clear: price is sitting around 63% of the 24h range—so it’s not at the lowest zone yet—while the 24h volatility reaches up to 31.4%. The 24h volume is about 26,850,896 in the quote asset, but the volume spike is only 0.03x—money flow hasn’t really stepped in.
What stands out is the funding: 0.0089%, meaning the LONG side is paying the SHORT side (the market is tilted bullish). The crowd is leaning the opposite way with this signal—this is a supporting point for the SHORT direction. The context is classified as sideways, so it fits a fade setup more than chasing the price.
🚫 INVALIDATION & RISK MANAGEMENT — $AT
⚠️ The biggest risk: the 1h momentum at 42.9 isn’t weak enough to be considered confirmation, and the price is still in the upper half of the 24h range—if buying pressure returns, the SHORT scenario could be pushed back. This is the point to watch, not to treat as a fully “matured” signal.
🚫 If price closes above the stop-loss level on the signal tag, the current SHORT scenario is no longer valid.
💡 Do you think this is genuine distribution, or just a liquidity sweep before price bounces back?
This is educational technical analysis content, not investment advice. Crypto trading is high risk; you may lose all your capital. Do your own research and take responsibility for your decisions.
#Binance #Crypto #Futures
SHORT $AT | Faint volume spike, price hovering around the 24h range, not yet showing a breakout
🚨 AI TRADE ALERT — $AT
🔴 SHORT
📌 Entry: 0.1341 – 0.1345
🛑 Stop Loss: 0.1453
🎯 Take Profit: 0.1012
⏰ Validity: 6 hours (13:10 – 19:10 VN) - Date: 04/10
↔️ SIDEWAY — the market is moving sideways; the signal is fading (mean-reversion)
$AT is being monitored by Scanner Pro under the SHORT scenario, since selling pressure is still clearly visible within the price structure. The context is classified as ranging with a classification confidence of 55; the 24h volume is around 26,850,896 in the quote asset, but the volume spike is only 0.03x.
📊 CONTEXT & DATA
The story here is quite clear: price is sitting around 63% of the 24h range—so it’s not at the lowest zone yet—while the 24h volatility reaches up to 31.4%. The 24h volume is about 26,850,896 in the quote asset, but the volume spike is only 0.03x—money flow hasn’t really stepped in.
What stands out is the funding: 0.0089%, meaning the LONG side is paying the SHORT side (the market is tilted bullish). The crowd is leaning the opposite way with this signal—this is a supporting point for the SHORT direction. The context is classified as sideways, so it fits a fade setup more than chasing the price.
🚫 INVALIDATION & RISK MANAGEMENT — $AT
⚠️ The biggest risk: the 1h momentum at 42.9 isn’t weak enough to be considered confirmation, and the price is still in the upper half of the 24h range—if buying pressure returns, the SHORT scenario could be pushed back. This is the point to watch, not to treat as a fully “matured” signal.
🚫 If price closes above the stop-loss level on the signal tag, the current SHORT scenario is no longer valid.
💡 Do you think this is genuine distribution, or just a liquidity sweep before price bounces back?
This is educational technical analysis content, not investment advice. Crypto trading is high risk; you may lose all your capital. Do your own research and take responsibility for your decisions.
#Binance #Crypto #Futures
🚨 AI TRADE ALERT — $AT
🔴 SHORT
📌 Entry: 0.1341 – 0.1345
🛑 Stop Loss: 0.1453
🎯 Take Profit: 0.1012
⏰ Validity: 6 hours (13:10 – 19:10 VN) - Date: 04/10
↔️ SIDEWAY — the market is moving sideways; the signal is fading (mean-reversion)
$AT is being monitored by Scanner Pro under the SHORT scenario, since selling pressure is still clearly visible within the price structure. The context is classified as ranging with a classification confidence of 55; the 24h volume is around 26,850,896 in the quote asset, but the volume spike is only 0.03x.
📊 CONTEXT & DATA
The story here is quite clear: price is sitting around 63% of the 24h range—so it’s not at the lowest zone yet—while the 24h volatility reaches up to 31.4%. The 24h volume is about 26,850,896 in the quote asset, but the volume spike is only 0.03x—money flow hasn’t really stepped in.
What stands out is the funding: 0.0089%, meaning the LONG side is paying the SHORT side (the market is tilted bullish). The crowd is leaning the opposite way with this signal—this is a supporting point for the SHORT direction. The context is classified as sideways, so it fits a fade setup more than chasing the price.
🚫 INVALIDATION & RISK MANAGEMENT — $AT
⚠️ The biggest risk: the 1h momentum at 42.9 isn’t weak enough to be considered confirmation, and the price is still in the upper half of the 24h range—if buying pressure returns, the SHORT scenario could be pushed back. This is the point to watch, not to treat as a fully “matured” signal.
🚫 If price closes above the stop-loss level on the signal tag, the current SHORT scenario is no longer valid.
💡 Do you think this is genuine distribution, or just a liquidity sweep before price bounces back?
This is educational technical analysis content, not investment advice. Crypto trading is high risk; you may lose all your capital. Do your own research and take responsibility for your decisions.
#Binance #Crypto #Futures
40
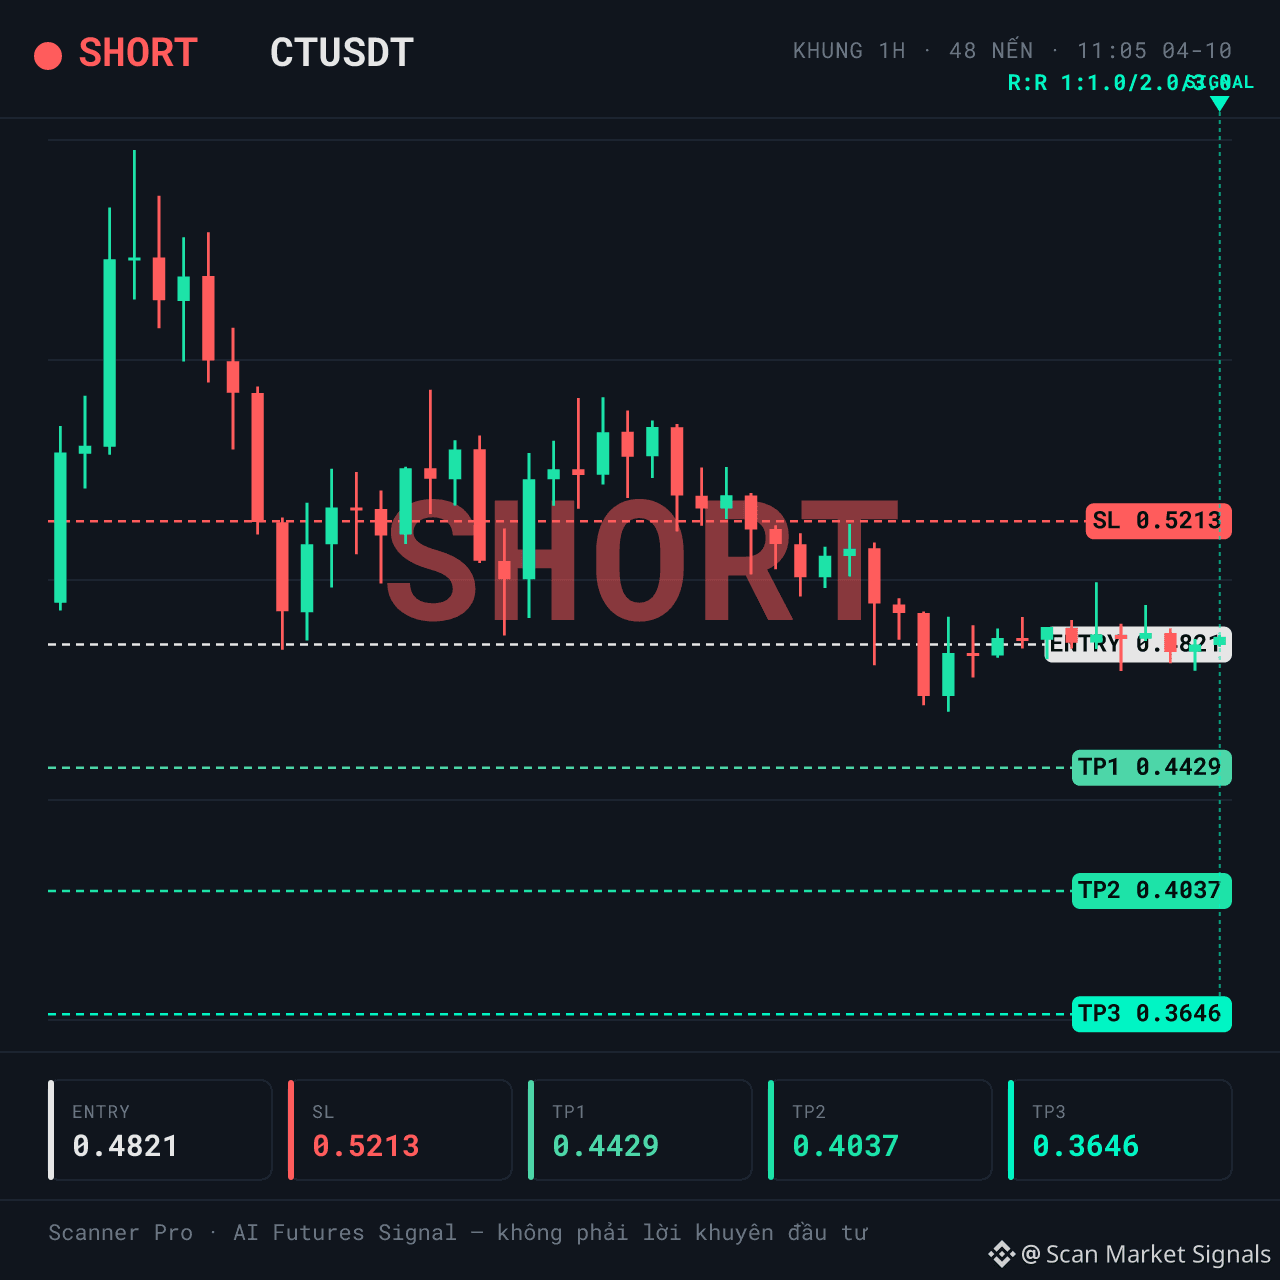
SHORT $CT | Volume spike is only 0.06x — is it a reversal signal or just noise?
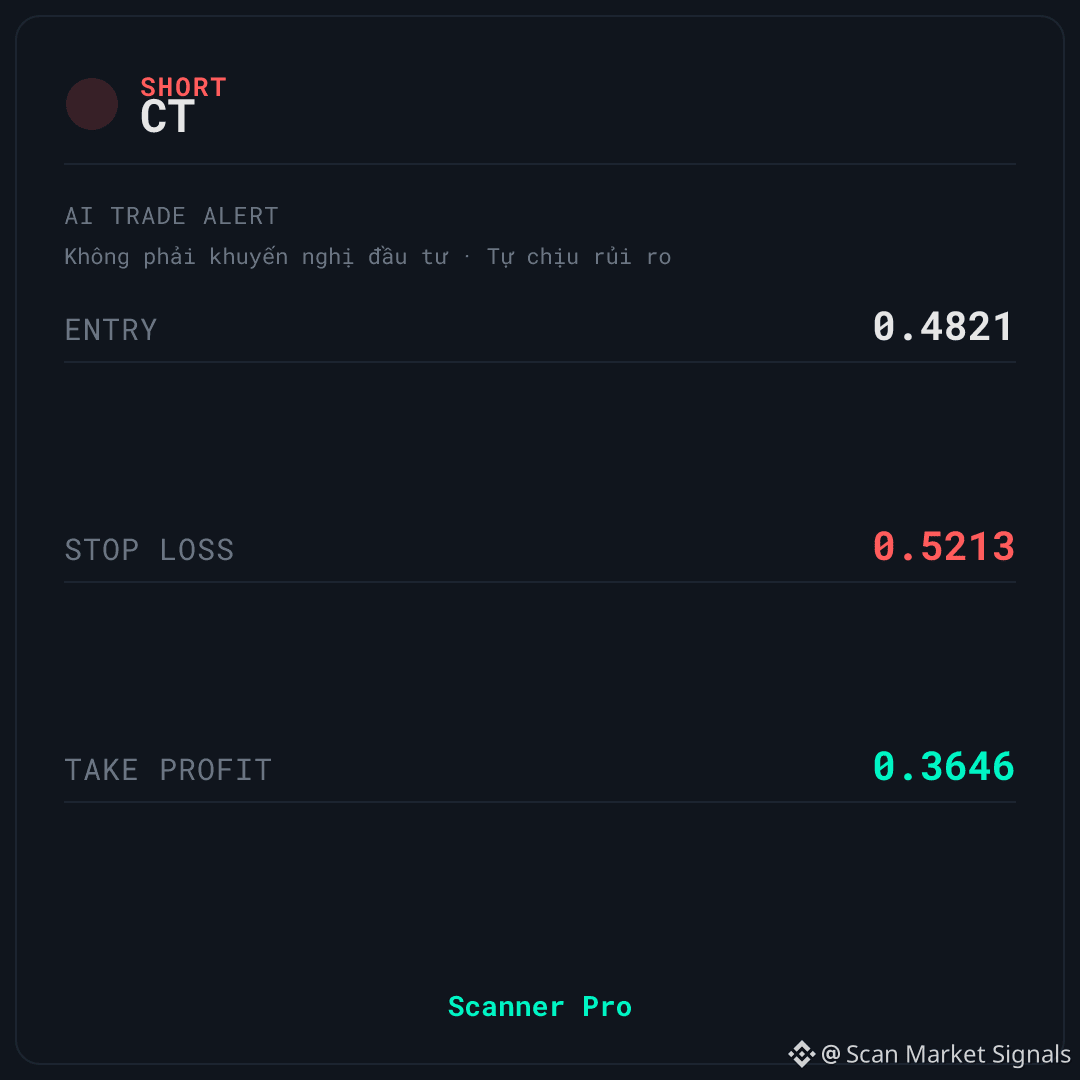
🚨 AI TRADE ALERT — $CT
🔴 SHORT
📌 Entry: 0.4814 – 0.4828
🛑 Stop Loss: 0.5213
🎯 Take Profit: 0.3646
⏰ Valid for: 6 hours (11:05 – 17:05 VN) - Date: 04/10
↔️ SIDEWAY — the market is moving sideways; the signal is fading (mean reversion)
$CT is being tracked by Scanner Pro for a SHORT scenario when price stays below the entry zone and the 1-hour momentum keeps weakening. The context is categorized as sideway with a classification confidence of 55; the 24h volume is about 44,084,681 (in the quote asset), but the volume spike is only 0.06x.
📊 CONTEXT & DATA
The first thing to suspect: the volume spike is only 0.06x — money hasn’t truly stepped in yet, so the current down move may just be fluctuation within the sideway range, not a trend. Price is at 24% of the 24h range, meaning it’s already near the lower zone—this is unfavorable for the SHORT setup because the room for further downside is limited.
On the other hand, the 1h momentum at 43.5 is below the neutral zone, indicating that buying pressure is weak. Funding at -0.0136% shows the SHORT side is paying the LONG side, meaning the crowd is leaning in the same direction as this signal.
🚫 INVALIDATION POINTS & RISK MANAGEMENT — $CT
⚠️ Biggest drawback: price is already at the low end of the 24h range, plus the SHORT side is crowded and has to pay—if buying suddenly appears, this side could easily get pulled into a reverse bounce. The confidence in the context classification is also not high (55).
If price closes above the stop-loss level on the signal card, the current SHORT scenario is no longer valid.
Do you think this is the final liquidity sweep before a rebound, or a real reversal signal?
This is educational technical analysis content, not investment advice. Crypto trading carries high risk; you may lose all your capital. Please research and take responsibility for your own decisions.
#Binance #Crypto #Futures
SHORT $CT | Volume spike is only 0.06x — is it a reversal signal or just noise?
🚨 AI TRADE ALERT — $CT
🔴 SHORT
📌 Entry: 0.4814 – 0.4828
🛑 Stop Loss: 0.5213
🎯 Take Profit: 0.3646
⏰ Valid for: 6 hours (11:05 – 17:05 VN) - Date: 04/10
↔️ SIDEWAY — the market is moving sideways; the signal is fading (mean reversion)
$CT is being tracked by Scanner Pro for a SHORT scenario when price stays below the entry zone and the 1-hour momentum keeps weakening. The context is categorized as sideway with a classification confidence of 55; the 24h volume is about 44,084,681 (in the quote asset), but the volume spike is only 0.06x.
📊 CONTEXT & DATA
The first thing to suspect: the volume spike is only 0.06x — money hasn’t truly stepped in yet, so the current down move may just be fluctuation within the sideway range, not a trend. Price is at 24% of the 24h range, meaning it’s already near the lower zone—this is unfavorable for the SHORT setup because the room for further downside is limited.
On the other hand, the 1h momentum at 43.5 is below the neutral zone, indicating that buying pressure is weak. Funding at -0.0136% shows the SHORT side is paying the LONG side, meaning the crowd is leaning in the same direction as this signal.
🚫 INVALIDATION POINTS & RISK MANAGEMENT — $CT
⚠️ Biggest drawback: price is already at the low end of the 24h range, plus the SHORT side is crowded and has to pay—if buying suddenly appears, this side could easily get pulled into a reverse bounce. The confidence in the context classification is also not high (55).
If price closes above the stop-loss level on the signal card, the current SHORT scenario is no longer valid.
Do you think this is the final liquidity sweep before a rebound, or a real reversal signal?
This is educational technical analysis content, not investment advice. Crypto trading carries high risk; you may lose all your capital. Please research and take responsibility for your own decisions.
#Binance #Crypto #Futures
🚨 AI TRADE ALERT — $CT
🔴 SHORT
📌 Entry: 0.4814 – 0.4828
🛑 Stop Loss: 0.5213
🎯 Take Profit: 0.3646
⏰ Valid for: 6 hours (11:05 – 17:05 VN) - Date: 04/10
↔️ SIDEWAY — the market is moving sideways; the signal is fading (mean reversion)
$CT is being tracked by Scanner Pro for a SHORT scenario when price stays below the entry zone and the 1-hour momentum keeps weakening. The context is categorized as sideway with a classification confidence of 55; the 24h volume is about 44,084,681 (in the quote asset), but the volume spike is only 0.06x.
📊 CONTEXT & DATA
The first thing to suspect: the volume spike is only 0.06x — money hasn’t truly stepped in yet, so the current down move may just be fluctuation within the sideway range, not a trend. Price is at 24% of the 24h range, meaning it’s already near the lower zone—this is unfavorable for the SHORT setup because the room for further downside is limited.
On the other hand, the 1h momentum at 43.5 is below the neutral zone, indicating that buying pressure is weak. Funding at -0.0136% shows the SHORT side is paying the LONG side, meaning the crowd is leaning in the same direction as this signal.
🚫 INVALIDATION POINTS & RISK MANAGEMENT — $CT
⚠️ Biggest drawback: price is already at the low end of the 24h range, plus the SHORT side is crowded and has to pay—if buying suddenly appears, this side could easily get pulled into a reverse bounce. The confidence in the context classification is also not high (55).
If price closes above the stop-loss level on the signal card, the current SHORT scenario is no longer valid.
Do you think this is the final liquidity sweep before a rebound, or a real reversal signal?
This is educational technical analysis content, not investment advice. Crypto trading carries high risk; you may lose all your capital. Please research and take responsibility for your own decisions.
#Binance #Crypto #Futures
93
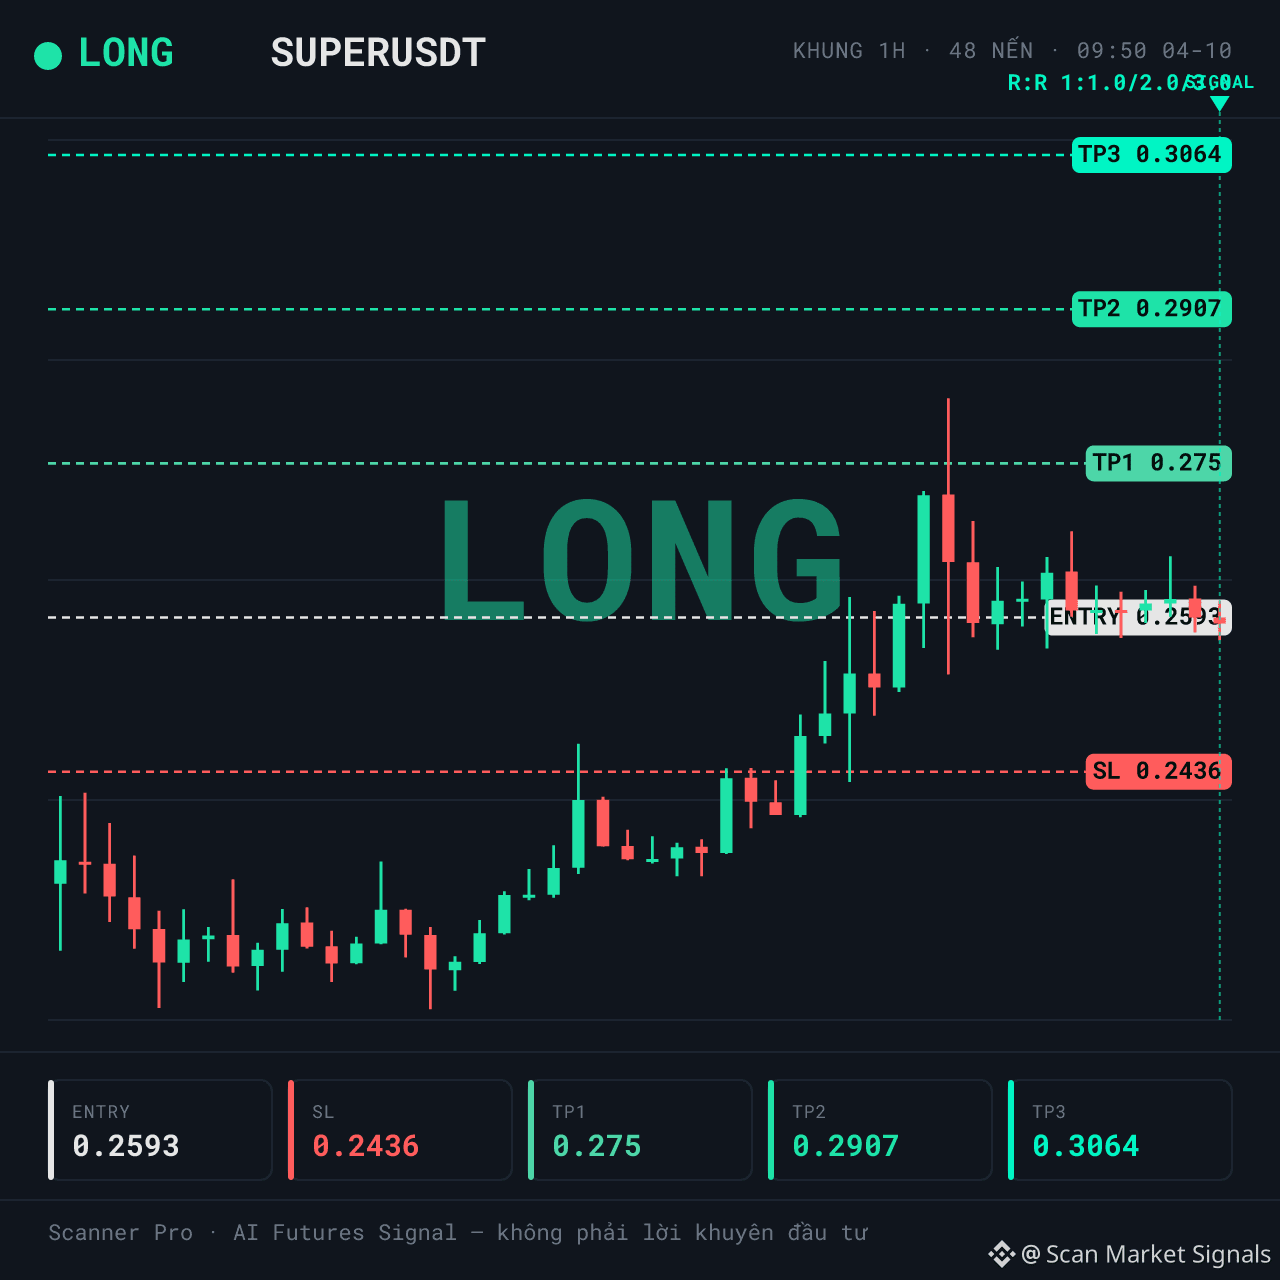
LONG $SUPER | The stop-loss zone is quite far from the price—be careful
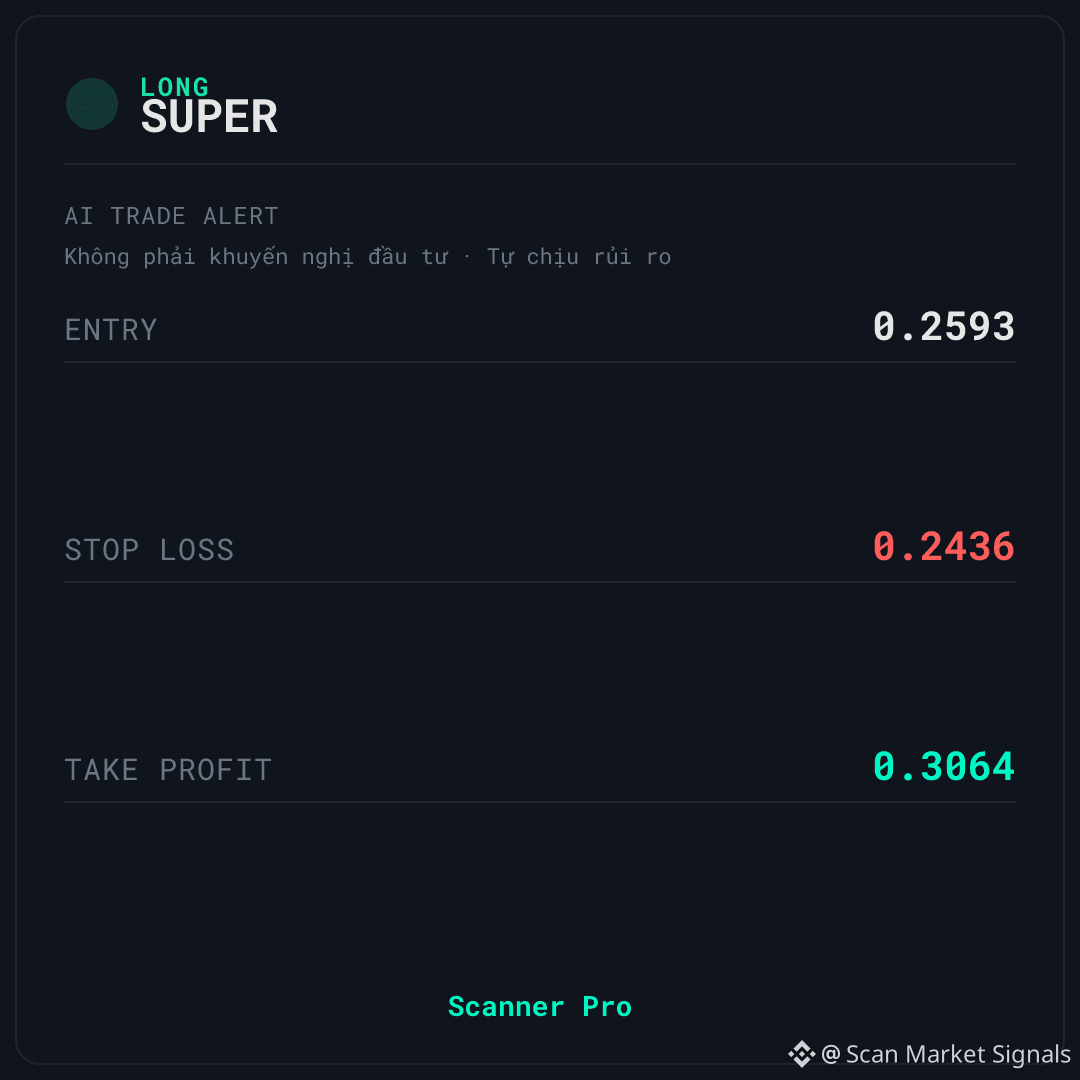
🚨 AI TRADE ALERT — $SUPER
🟢 LONG
📌 Entry: 0.2589 – 0.2597
🛑 Stop Loss: 0.2436
🎯 Take Profit: 0.3064
⏰ Validity: 6 hours (09:50 – 15:50 VN) - Date: 04/10
📈 UPTREND — LONG goes with the uptrend
$SUPER is being monitored by Scanner Pro for the LONG scenario when price holds above the entry zone. The backdrop is classified as an uptrend with 85 confidence, but funding shows that the LONG side is paying fees.
📊 WHAT IS HAPPENING
The current price is about 0.3% above the entry, sitting at 53% of the 24h range—neither near the top nor near the bottom. 24h volume is about 55,863,295 (in quote asset), volume spike 0.24x, liquidity is assessed as strong.
The backdrop is classified as an uptrend with 85 confidence. The 1h momentum is 59.4 and the 4h momentum is 74.1—it's heated up significantly; it's no longer a clear support point for the buy scenario.
⚠️ RISK TO BE AWARE OF — $SUPER
🚫 Funding 0.0050%: the LONG side is paying the SHORT side, meaning the crowd is leaning CLOSER with this signal—this is a disadvantage, not a good sign.
If the price closes below the stop-loss level in the signal card, the current LONG scenario is no longer valid.
Do you think this is an upswing with room left, or is the crowd arriving late in this zone?
This is educational technical analysis content, not investment advice. Cryptocurrency trading carries a high risk—you may lose all your capital. Please do your own research and take responsibility for your decisions.
#Binance #Crypto #Futures
LONG $SUPER | The stop-loss zone is quite far from the price—be careful
🚨 AI TRADE ALERT — $SUPER
🟢 LONG
📌 Entry: 0.2589 – 0.2597
🛑 Stop Loss: 0.2436
🎯 Take Profit: 0.3064
⏰ Validity: 6 hours (09:50 – 15:50 VN) - Date: 04/10
📈 UPTREND — LONG goes with the uptrend
$SUPER is being monitored by Scanner Pro for the LONG scenario when price holds above the entry zone. The backdrop is classified as an uptrend with 85 confidence, but funding shows that the LONG side is paying fees.
📊 WHAT IS HAPPENING
The current price is about 0.3% above the entry, sitting at 53% of the 24h range—neither near the top nor near the bottom. 24h volume is about 55,863,295 (in quote asset), volume spike 0.24x, liquidity is assessed as strong.
The backdrop is classified as an uptrend with 85 confidence. The 1h momentum is 59.4 and the 4h momentum is 74.1—it's heated up significantly; it's no longer a clear support point for the buy scenario.
⚠️ RISK TO BE AWARE OF — $SUPER
🚫 Funding 0.0050%: the LONG side is paying the SHORT side, meaning the crowd is leaning CLOSER with this signal—this is a disadvantage, not a good sign.
If the price closes below the stop-loss level in the signal card, the current LONG scenario is no longer valid.
Do you think this is an upswing with room left, or is the crowd arriving late in this zone?
This is educational technical analysis content, not investment advice. Cryptocurrency trading carries a high risk—you may lose all your capital. Please do your own research and take responsibility for your decisions.
#Binance #Crypto #Futures
🚨 AI TRADE ALERT — $SUPER
🟢 LONG
📌 Entry: 0.2589 – 0.2597
🛑 Stop Loss: 0.2436
🎯 Take Profit: 0.3064
⏰ Validity: 6 hours (09:50 – 15:50 VN) - Date: 04/10
📈 UPTREND — LONG goes with the uptrend
$SUPER is being monitored by Scanner Pro for the LONG scenario when price holds above the entry zone. The backdrop is classified as an uptrend with 85 confidence, but funding shows that the LONG side is paying fees.
📊 WHAT IS HAPPENING
The current price is about 0.3% above the entry, sitting at 53% of the 24h range—neither near the top nor near the bottom. 24h volume is about 55,863,295 (in quote asset), volume spike 0.24x, liquidity is assessed as strong.
The backdrop is classified as an uptrend with 85 confidence. The 1h momentum is 59.4 and the 4h momentum is 74.1—it's heated up significantly; it's no longer a clear support point for the buy scenario.
⚠️ RISK TO BE AWARE OF — $SUPER
🚫 Funding 0.0050%: the LONG side is paying the SHORT side, meaning the crowd is leaning CLOSER with this signal—this is a disadvantage, not a good sign.
If the price closes below the stop-loss level in the signal card, the current LONG scenario is no longer valid.
Do you think this is an upswing with room left, or is the crowd arriving late in this zone?
This is educational technical analysis content, not investment advice. Cryptocurrency trading carries a high risk—you may lose all your capital. Please do your own research and take responsibility for your decisions.
#Binance #Crypto #Futures
82
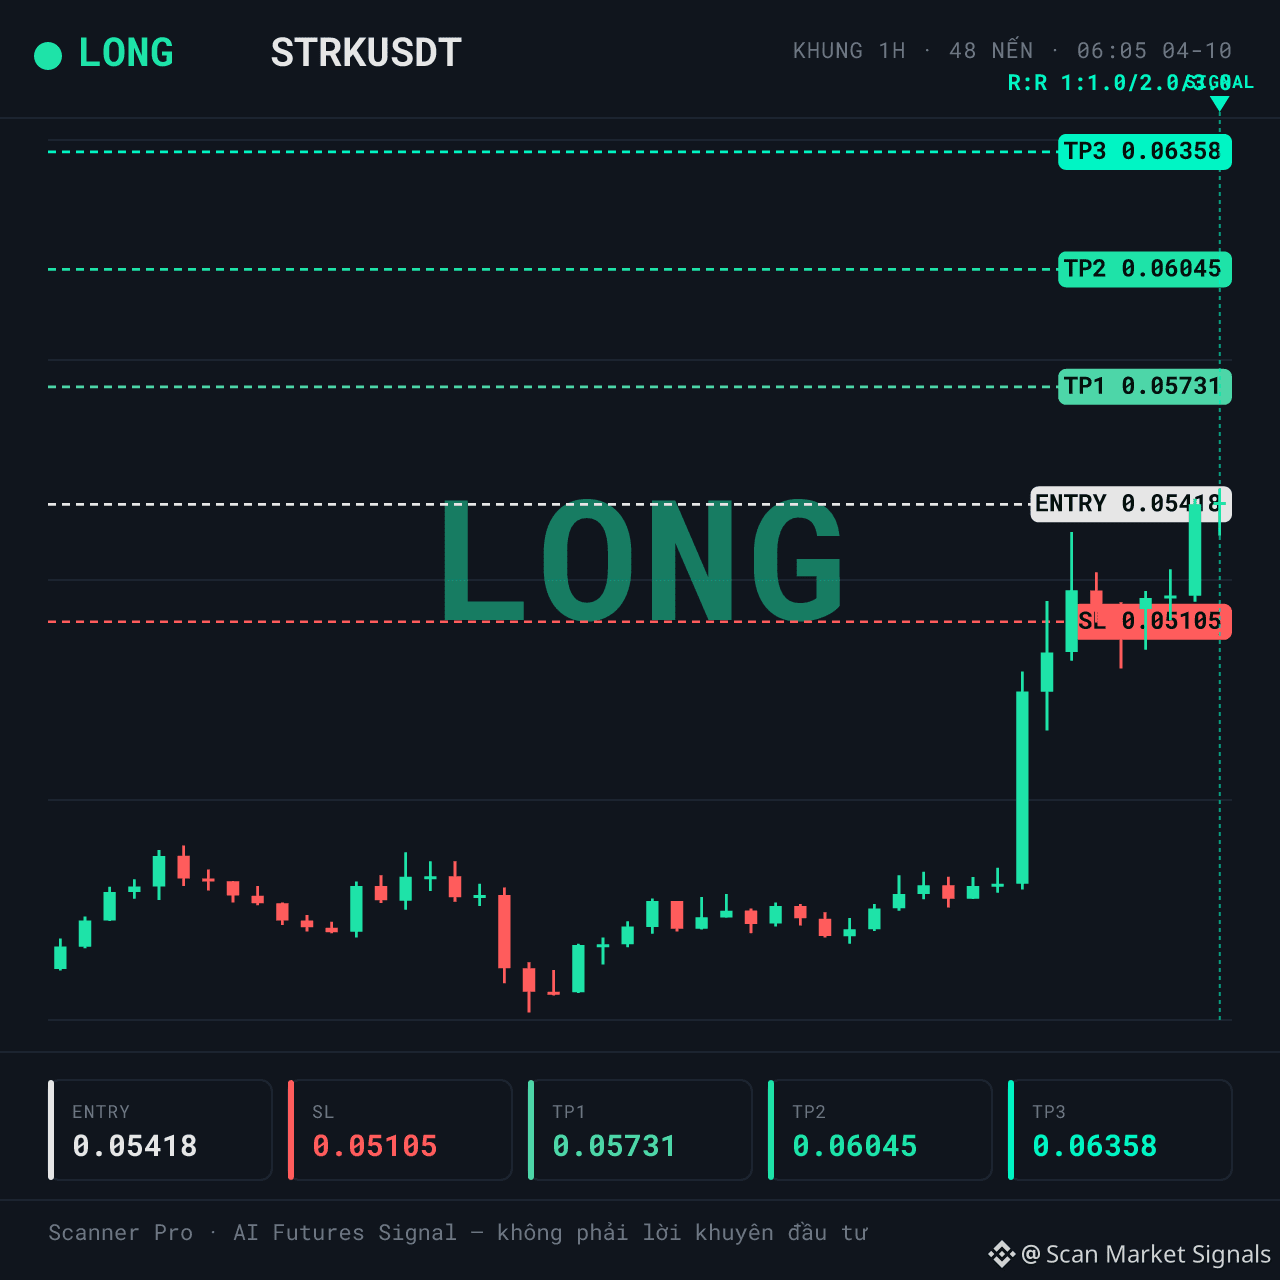
LONG $STRK | Hot momentum or cold momentum — read within a single time frame
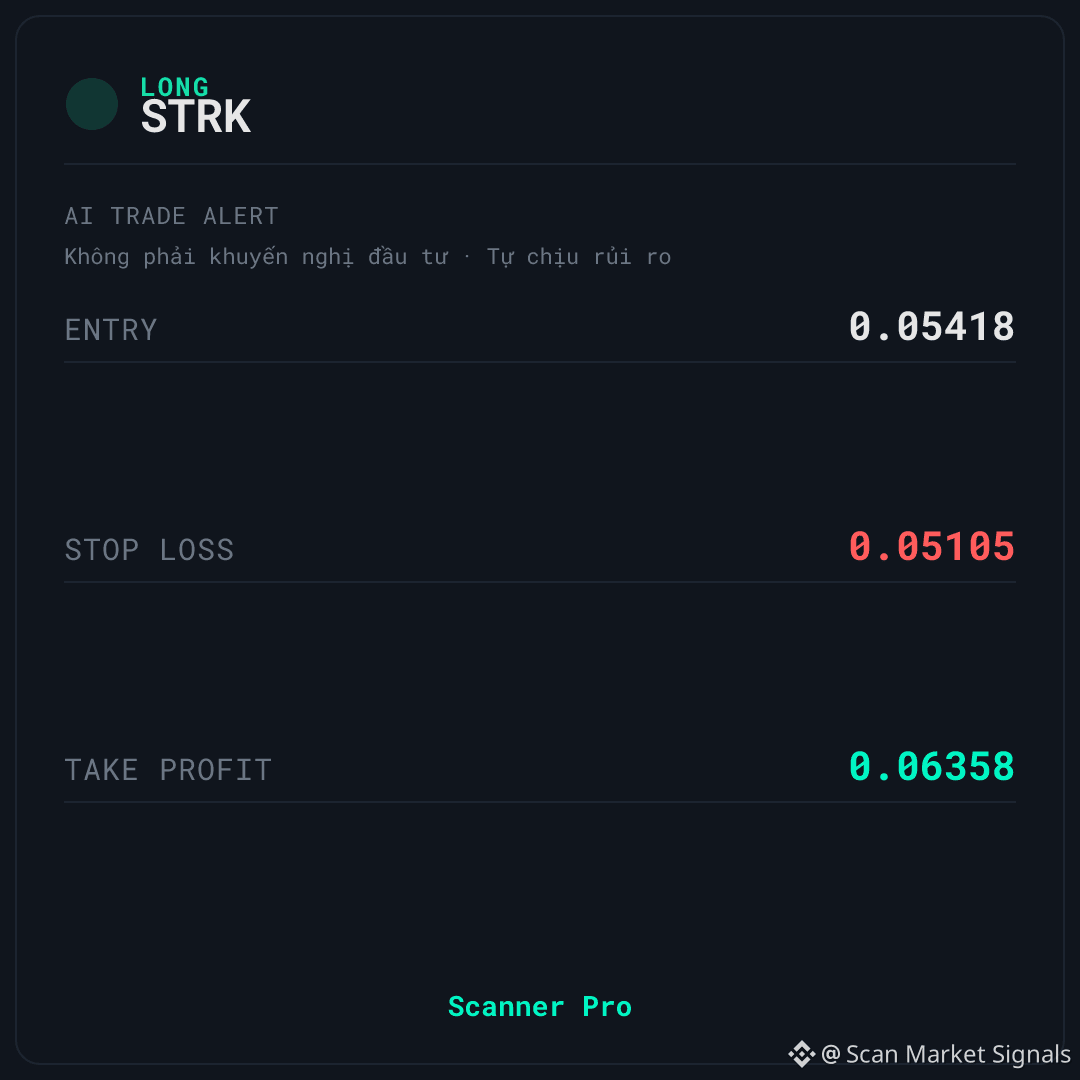
🚨 AI TRADE ALERT — $STRK
🟢 LONG
📌 Entry: 0.0541 – 0.05426
🛑 Stop Loss: 0.05105
🎯 Take Profit: 0.06358
⏰ Valid for: 6 hours (06:05 – 12:05 VN) - Date: 04/10
📈 UPTREND — LONG moves with the upward trend
$STRK is being tracked by Scanner Pro for a LONG scenario when price reacts positively within an uptrend. The context is classified as trend_up with confidence 85; the 24h volume is about 92.548.170 in quote asset terms.
📊 WHAT THE DATA IS SHOWING
The story here is that an uptrend is being confirmed: a regime trend_up with confidence 85, price is at 94% of the 24h range, and the 24h volatility reaches up to 22.7%. The 24h volume is about 92.548.170 in quote asset terms, and the volume spike is 0.54x — money has returned, but it hasn’t exploded yet.
Funding at 0.0050%: the LONG side is paying the SHORT side, meaning the market is leaning long. The crowd is aligning with this signal, and that side is paying fees — this is the disadvantage that needs to be said plainly.
💡 SCENARIO & OPEN QUESTIONS — $STRK
⚠️ The biggest downside: 1h momentum is up at 82.4 — it’s heating up, no longer a support point for the buy-in scenario. Price is again at the upper region of the 24h range, so short-term pullback risk is real.
🚫 If price closes below the stop-loss level on the signal card, the current LONG scenario is no longer valid.
In your view, is this still an ongoing up move, or just a late momentum pull before the price needs a deeper retest?
This is educational technical analysis content, not investment advice. Cryptocurrency trading carries high risk; you may lose all your capital. Do your own research and take responsibility for your decisions.
#Binance #Crypto #Futures
LONG $STRK | Hot momentum or cold momentum — read within a single time frame
🚨 AI TRADE ALERT — $STRK
🟢 LONG
📌 Entry: 0.0541 – 0.05426
🛑 Stop Loss: 0.05105
🎯 Take Profit: 0.06358
⏰ Valid for: 6 hours (06:05 – 12:05 VN) - Date: 04/10
📈 UPTREND — LONG moves with the upward trend
$STRK is being tracked by Scanner Pro for a LONG scenario when price reacts positively within an uptrend. The context is classified as trend_up with confidence 85; the 24h volume is about 92.548.170 in quote asset terms.
📊 WHAT THE DATA IS SHOWING
The story here is that an uptrend is being confirmed: a regime trend_up with confidence 85, price is at 94% of the 24h range, and the 24h volatility reaches up to 22.7%. The 24h volume is about 92.548.170 in quote asset terms, and the volume spike is 0.54x — money has returned, but it hasn’t exploded yet.
Funding at 0.0050%: the LONG side is paying the SHORT side, meaning the market is leaning long. The crowd is aligning with this signal, and that side is paying fees — this is the disadvantage that needs to be said plainly.
💡 SCENARIO & OPEN QUESTIONS — $STRK
⚠️ The biggest downside: 1h momentum is up at 82.4 — it’s heating up, no longer a support point for the buy-in scenario. Price is again at the upper region of the 24h range, so short-term pullback risk is real.
🚫 If price closes below the stop-loss level on the signal card, the current LONG scenario is no longer valid.
In your view, is this still an ongoing up move, or just a late momentum pull before the price needs a deeper retest?
This is educational technical analysis content, not investment advice. Cryptocurrency trading carries high risk; you may lose all your capital. Do your own research and take responsibility for your decisions.
#Binance #Crypto #Futures
🚨 AI TRADE ALERT — $STRK
🟢 LONG
📌 Entry: 0.0541 – 0.05426
🛑 Stop Loss: 0.05105
🎯 Take Profit: 0.06358
⏰ Valid for: 6 hours (06:05 – 12:05 VN) - Date: 04/10
📈 UPTREND — LONG moves with the upward trend
$STRK is being tracked by Scanner Pro for a LONG scenario when price reacts positively within an uptrend. The context is classified as trend_up with confidence 85; the 24h volume is about 92.548.170 in quote asset terms.
📊 WHAT THE DATA IS SHOWING
The story here is that an uptrend is being confirmed: a regime trend_up with confidence 85, price is at 94% of the 24h range, and the 24h volatility reaches up to 22.7%. The 24h volume is about 92.548.170 in quote asset terms, and the volume spike is 0.54x — money has returned, but it hasn’t exploded yet.
Funding at 0.0050%: the LONG side is paying the SHORT side, meaning the market is leaning long. The crowd is aligning with this signal, and that side is paying fees — this is the disadvantage that needs to be said plainly.
💡 SCENARIO & OPEN QUESTIONS — $STRK
⚠️ The biggest downside: 1h momentum is up at 82.4 — it’s heating up, no longer a support point for the buy-in scenario. Price is again at the upper region of the 24h range, so short-term pullback risk is real.
🚫 If price closes below the stop-loss level on the signal card, the current LONG scenario is no longer valid.
In your view, is this still an ongoing up move, or just a late momentum pull before the price needs a deeper retest?
This is educational technical analysis content, not investment advice. Cryptocurrency trading carries high risk; you may lose all your capital. Do your own research and take responsibility for your decisions.
#Binance #Crypto #Futures
11
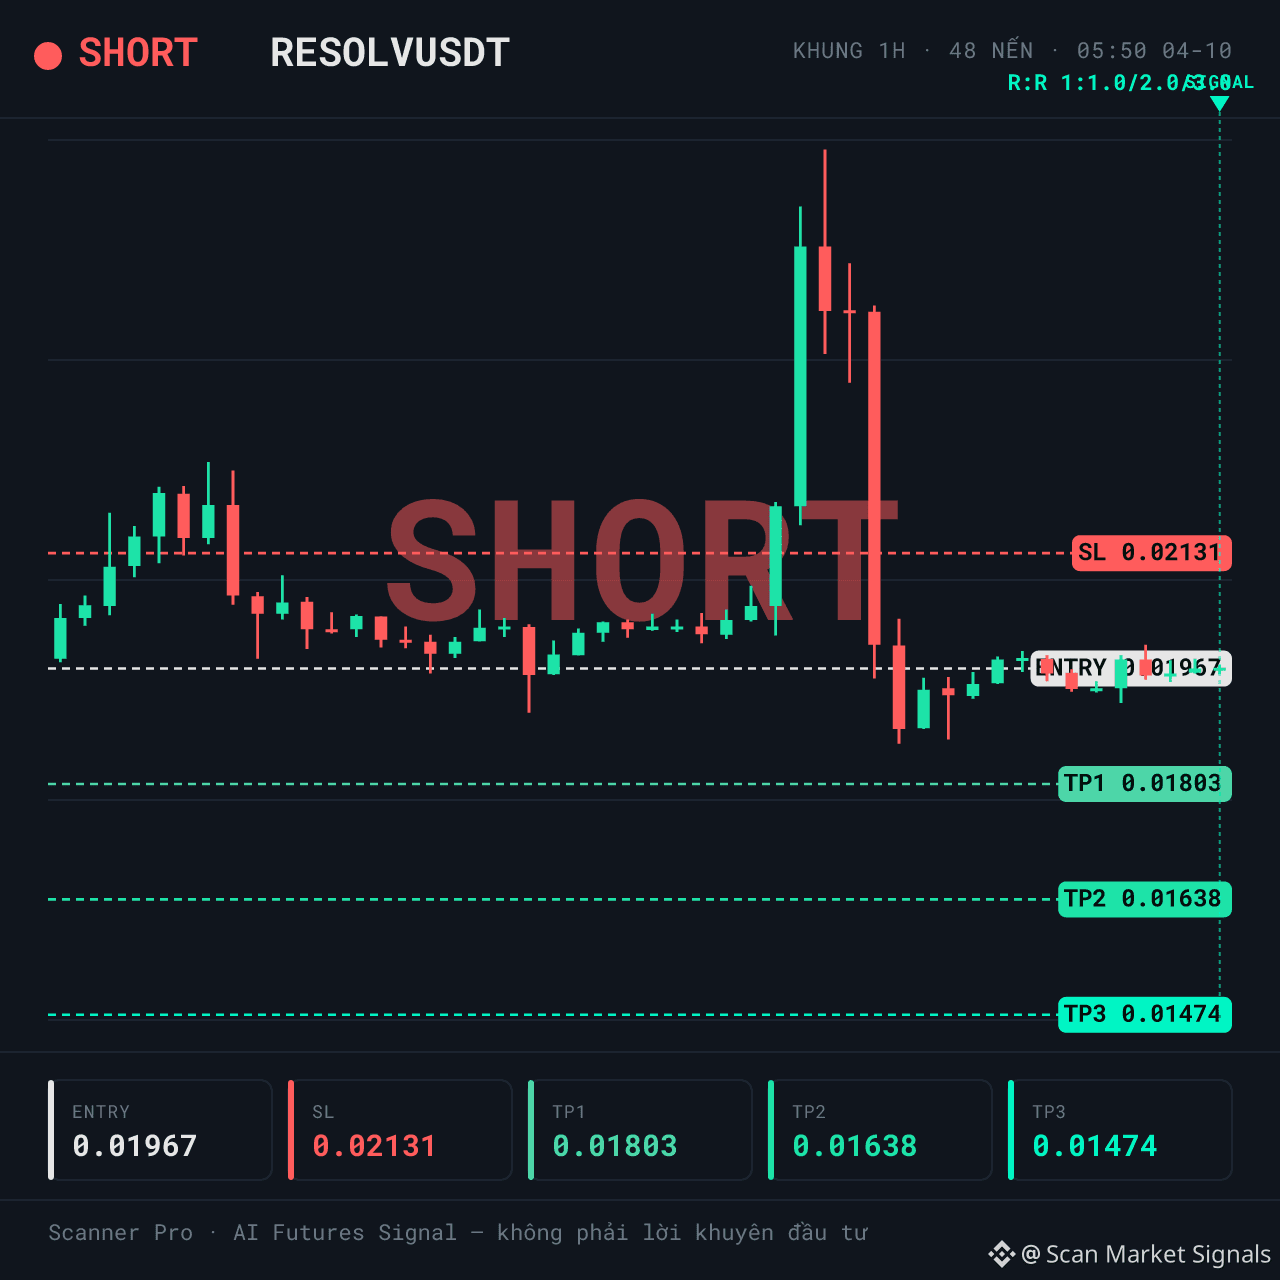
SHORT $RESOLV | Volume spike 0.04x — weak signal or just the start?
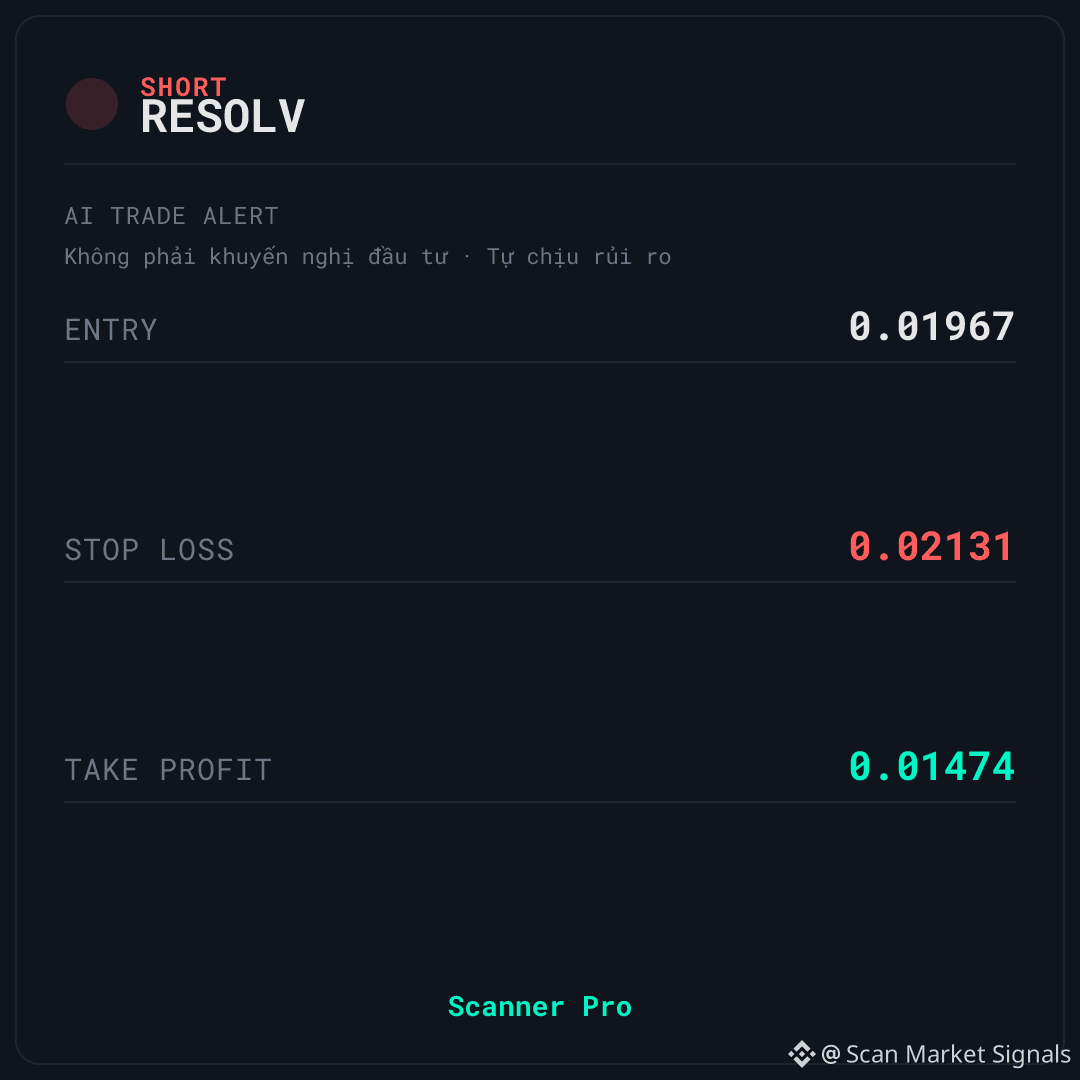
🚨 AI TRADE ALERT — $RESOLV
🔴 SHORT
📌 Entry: 0.01964 – 0.0197
🛑 Stop Loss: 0.02131
🎯 Take Profit: 0.01474
⏰ Validity: 6 hours (05:50 – 11:50 VN) - Date: 04/10
↔️ SIDEWAY — the market is moving sideways, the signal fades (mean-reversion)
$RESOLV is being tracked by Scanner Pro for a SHORT scenario when the price reacts weakly within the 24h range. The context is classified as sideways with a classification confidence of 55; the 24h volume is about 42.915.270 in quote asset, and the volume spike is only 0.04x.
📊 CONTEXT & DATA
24h volume is about 42.915.270 in quote asset, but the volume spike is only 0.04x — meaning liquidity is present, yet there has been almost no sudden inflow. The price position within the 24h range is 13%, so price is currently in the lower part of the range.
Funding 0.0050%: the LONG side is paying the SHORT side; the market leans long — the crowd is positioned against this signal, which is considered supportive for the SHORT direction. However, the context is only classified as sideways with confidence 55, which is not strong enough to confirm a trend.
🚫 INVALIDATION POINT & RISK MANAGEMENT — $RESOLV
⚠️ The biggest downside: this is a reversal strategy and the price is in the lower area of the 24h range (13%), so the risk of a technical rebound against the SHORT direction is real. In addition, the classification confidence of the context is only 55 — not high.
🚫 If the price closes above the stop-loss level on the signal tag, the current SHORT scenario is no longer valid.
💡 In your opinion, is this adjustment within a downtrend or just a liquidity sweep before the price bounces up?
This is educational technical analysis content, not investment advice. Crypto trading carries high risk, and you may lose all of your capital. Please research and take responsibility for your own decisions.
#Binance #Crypto #Futures
SHORT $RESOLV | Volume spike 0.04x — weak signal or just the start?
🚨 AI TRADE ALERT — $RESOLV
🔴 SHORT
📌 Entry: 0.01964 – 0.0197
🛑 Stop Loss: 0.02131
🎯 Take Profit: 0.01474
⏰ Validity: 6 hours (05:50 – 11:50 VN) - Date: 04/10
↔️ SIDEWAY — the market is moving sideways, the signal fades (mean-reversion)
$RESOLV is being tracked by Scanner Pro for a SHORT scenario when the price reacts weakly within the 24h range. The context is classified as sideways with a classification confidence of 55; the 24h volume is about 42.915.270 in quote asset, and the volume spike is only 0.04x.
📊 CONTEXT & DATA
24h volume is about 42.915.270 in quote asset, but the volume spike is only 0.04x — meaning liquidity is present, yet there has been almost no sudden inflow. The price position within the 24h range is 13%, so price is currently in the lower part of the range.
Funding 0.0050%: the LONG side is paying the SHORT side; the market leans long — the crowd is positioned against this signal, which is considered supportive for the SHORT direction. However, the context is only classified as sideways with confidence 55, which is not strong enough to confirm a trend.
🚫 INVALIDATION POINT & RISK MANAGEMENT — $RESOLV
⚠️ The biggest downside: this is a reversal strategy and the price is in the lower area of the 24h range (13%), so the risk of a technical rebound against the SHORT direction is real. In addition, the classification confidence of the context is only 55 — not high.
🚫 If the price closes above the stop-loss level on the signal tag, the current SHORT scenario is no longer valid.
💡 In your opinion, is this adjustment within a downtrend or just a liquidity sweep before the price bounces up?
This is educational technical analysis content, not investment advice. Crypto trading carries high risk, and you may lose all of your capital. Please research and take responsibility for your own decisions.
#Binance #Crypto #Futures
🚨 AI TRADE ALERT — $RESOLV
🔴 SHORT
📌 Entry: 0.01964 – 0.0197
🛑 Stop Loss: 0.02131
🎯 Take Profit: 0.01474
⏰ Validity: 6 hours (05:50 – 11:50 VN) - Date: 04/10
↔️ SIDEWAY — the market is moving sideways, the signal fades (mean-reversion)
$RESOLV is being tracked by Scanner Pro for a SHORT scenario when the price reacts weakly within the 24h range. The context is classified as sideways with a classification confidence of 55; the 24h volume is about 42.915.270 in quote asset, and the volume spike is only 0.04x.
📊 CONTEXT & DATA
24h volume is about 42.915.270 in quote asset, but the volume spike is only 0.04x — meaning liquidity is present, yet there has been almost no sudden inflow. The price position within the 24h range is 13%, so price is currently in the lower part of the range.
Funding 0.0050%: the LONG side is paying the SHORT side; the market leans long — the crowd is positioned against this signal, which is considered supportive for the SHORT direction. However, the context is only classified as sideways with confidence 55, which is not strong enough to confirm a trend.
🚫 INVALIDATION POINT & RISK MANAGEMENT — $RESOLV
⚠️ The biggest downside: this is a reversal strategy and the price is in the lower area of the 24h range (13%), so the risk of a technical rebound against the SHORT direction is real. In addition, the classification confidence of the context is only 55 — not high.
🚫 If the price closes above the stop-loss level on the signal tag, the current SHORT scenario is no longer valid.
💡 In your opinion, is this adjustment within a downtrend or just a liquidity sweep before the price bounces up?
This is educational technical analysis content, not investment advice. Crypto trading carries high risk, and you may lose all of your capital. Please research and take responsibility for your own decisions.
#Binance #Crypto #Futures
4
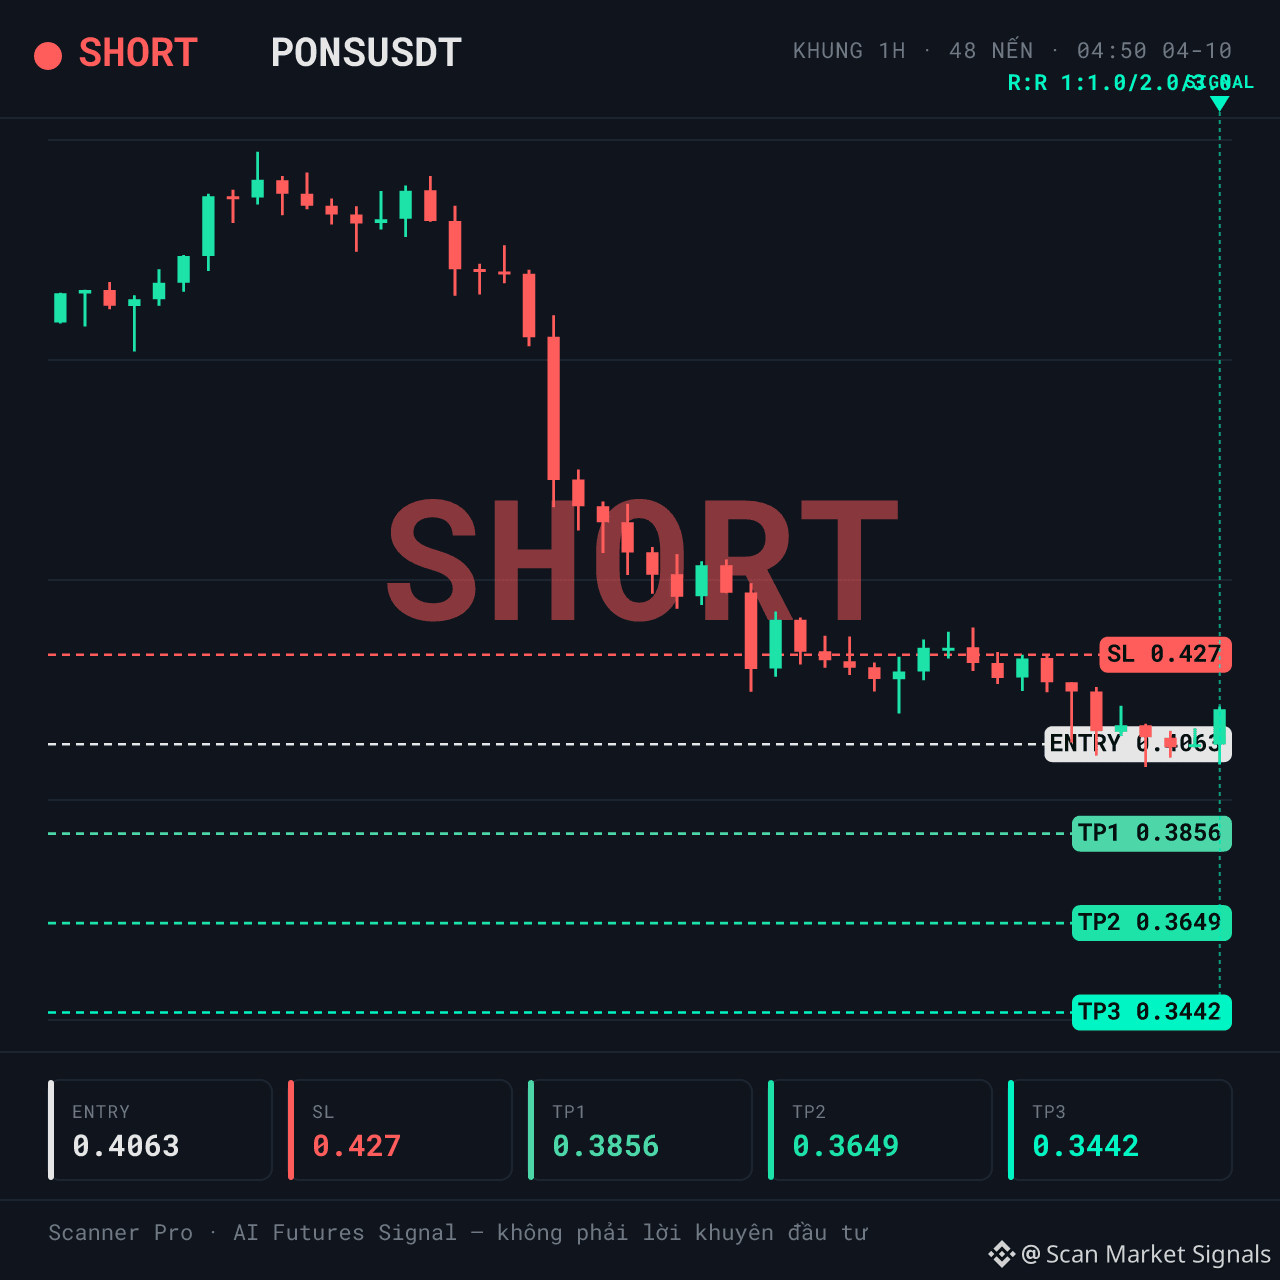
SHORT $PONS | Regime down — setup for or against the trend in this context?
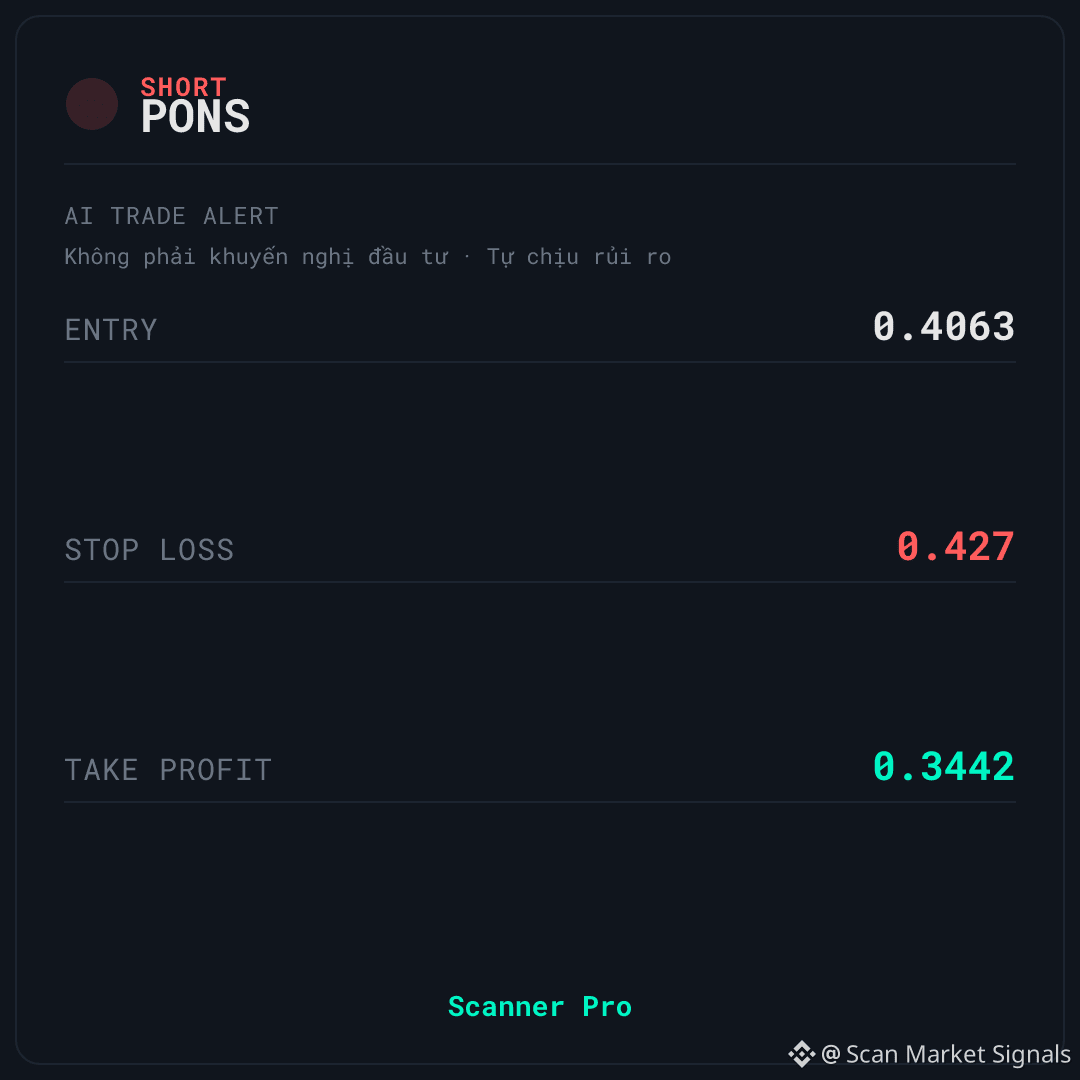
🚨 AI TRADE ALERT — $PONS
🔴 SHORT
📌 Entry: 0.4057 – 0.4069
🛑 Stop Loss: 0.427
🎯 Take Profit: 0.3442
⏰ Validity: 6 hours (04:50 – 10:50 VN) - Date: 04/10
📉 DOWNTREND — SHORT aligns with the downtrend
$PONS is being monitored by Scanner Pro for a SHORT scenario when price shows weak reaction in the low range of the 24h band. The context is classified as trend_down with a confidence level of 85; 24h volume is about 65,150,938 in quote asset terms. Volume spike is 0.75x.
📊 WHAT’S HAPPENING
Selling pressure is still clear; price is at about 26% of the 24h range — the lower part of today’s swing. 24h volume is about 65,150,938 in quote asset terms, with a volume spike of 0.75x. There hasn’t been a strong enough “buy the dip” flow yet.
Funding 0.0113%: the LONG side is paying fees to the SHORT side, meaning the crowd is leaning in the opposite direction of the signal — this is a supportive point for the SHORT scenario.
⚠️ RISK TO KNOW BEFOREHAND — $PONS
🚫 The 1h momentum of 34.07 is already weak, and price is below 25% of the 24h range. If buying strength suddenly returns from the lower end, the reversal scenario could get “pulled” the other way.
If price closes above the stop-loss level on the signal tag, the current SHORT setup is no longer valid.
In your view, is this another continuation leg down or just a liquidity sweep before a rebound?
This is educational technical analysis content, not investment advice. Crypto trading carries high risk; you may lose all your capital. Do your own research and take responsibility for your decisions.
#Binance #Crypto #Futures
SHORT $PONS | Regime down — setup for or against the trend in this context?
🚨 AI TRADE ALERT — $PONS
🔴 SHORT
📌 Entry: 0.4057 – 0.4069
🛑 Stop Loss: 0.427
🎯 Take Profit: 0.3442
⏰ Validity: 6 hours (04:50 – 10:50 VN) - Date: 04/10
📉 DOWNTREND — SHORT aligns with the downtrend
$PONS is being monitored by Scanner Pro for a SHORT scenario when price shows weak reaction in the low range of the 24h band. The context is classified as trend_down with a confidence level of 85; 24h volume is about 65,150,938 in quote asset terms. Volume spike is 0.75x.
📊 WHAT’S HAPPENING
Selling pressure is still clear; price is at about 26% of the 24h range — the lower part of today’s swing. 24h volume is about 65,150,938 in quote asset terms, with a volume spike of 0.75x. There hasn’t been a strong enough “buy the dip” flow yet.
Funding 0.0113%: the LONG side is paying fees to the SHORT side, meaning the crowd is leaning in the opposite direction of the signal — this is a supportive point for the SHORT scenario.
⚠️ RISK TO KNOW BEFOREHAND — $PONS
🚫 The 1h momentum of 34.07 is already weak, and price is below 25% of the 24h range. If buying strength suddenly returns from the lower end, the reversal scenario could get “pulled” the other way.
If price closes above the stop-loss level on the signal tag, the current SHORT setup is no longer valid.
In your view, is this another continuation leg down or just a liquidity sweep before a rebound?
This is educational technical analysis content, not investment advice. Crypto trading carries high risk; you may lose all your capital. Do your own research and take responsibility for your decisions.
#Binance #Crypto #Futures
🚨 AI TRADE ALERT — $PONS
🔴 SHORT
📌 Entry: 0.4057 – 0.4069
🛑 Stop Loss: 0.427
🎯 Take Profit: 0.3442
⏰ Validity: 6 hours (04:50 – 10:50 VN) - Date: 04/10
📉 DOWNTREND — SHORT aligns with the downtrend
$PONS is being monitored by Scanner Pro for a SHORT scenario when price shows weak reaction in the low range of the 24h band. The context is classified as trend_down with a confidence level of 85; 24h volume is about 65,150,938 in quote asset terms. Volume spike is 0.75x.
📊 WHAT’S HAPPENING
Selling pressure is still clear; price is at about 26% of the 24h range — the lower part of today’s swing. 24h volume is about 65,150,938 in quote asset terms, with a volume spike of 0.75x. There hasn’t been a strong enough “buy the dip” flow yet.
Funding 0.0113%: the LONG side is paying fees to the SHORT side, meaning the crowd is leaning in the opposite direction of the signal — this is a supportive point for the SHORT scenario.
⚠️ RISK TO KNOW BEFOREHAND — $PONS
🚫 The 1h momentum of 34.07 is already weak, and price is below 25% of the 24h range. If buying strength suddenly returns from the lower end, the reversal scenario could get “pulled” the other way.
If price closes above the stop-loss level on the signal tag, the current SHORT setup is no longer valid.
In your view, is this another continuation leg down or just a liquidity sweep before a rebound?
This is educational technical analysis content, not investment advice. Crypto trading carries high risk; you may lose all your capital. Do your own research and take responsibility for your decisions.
#Binance #Crypto #Futures
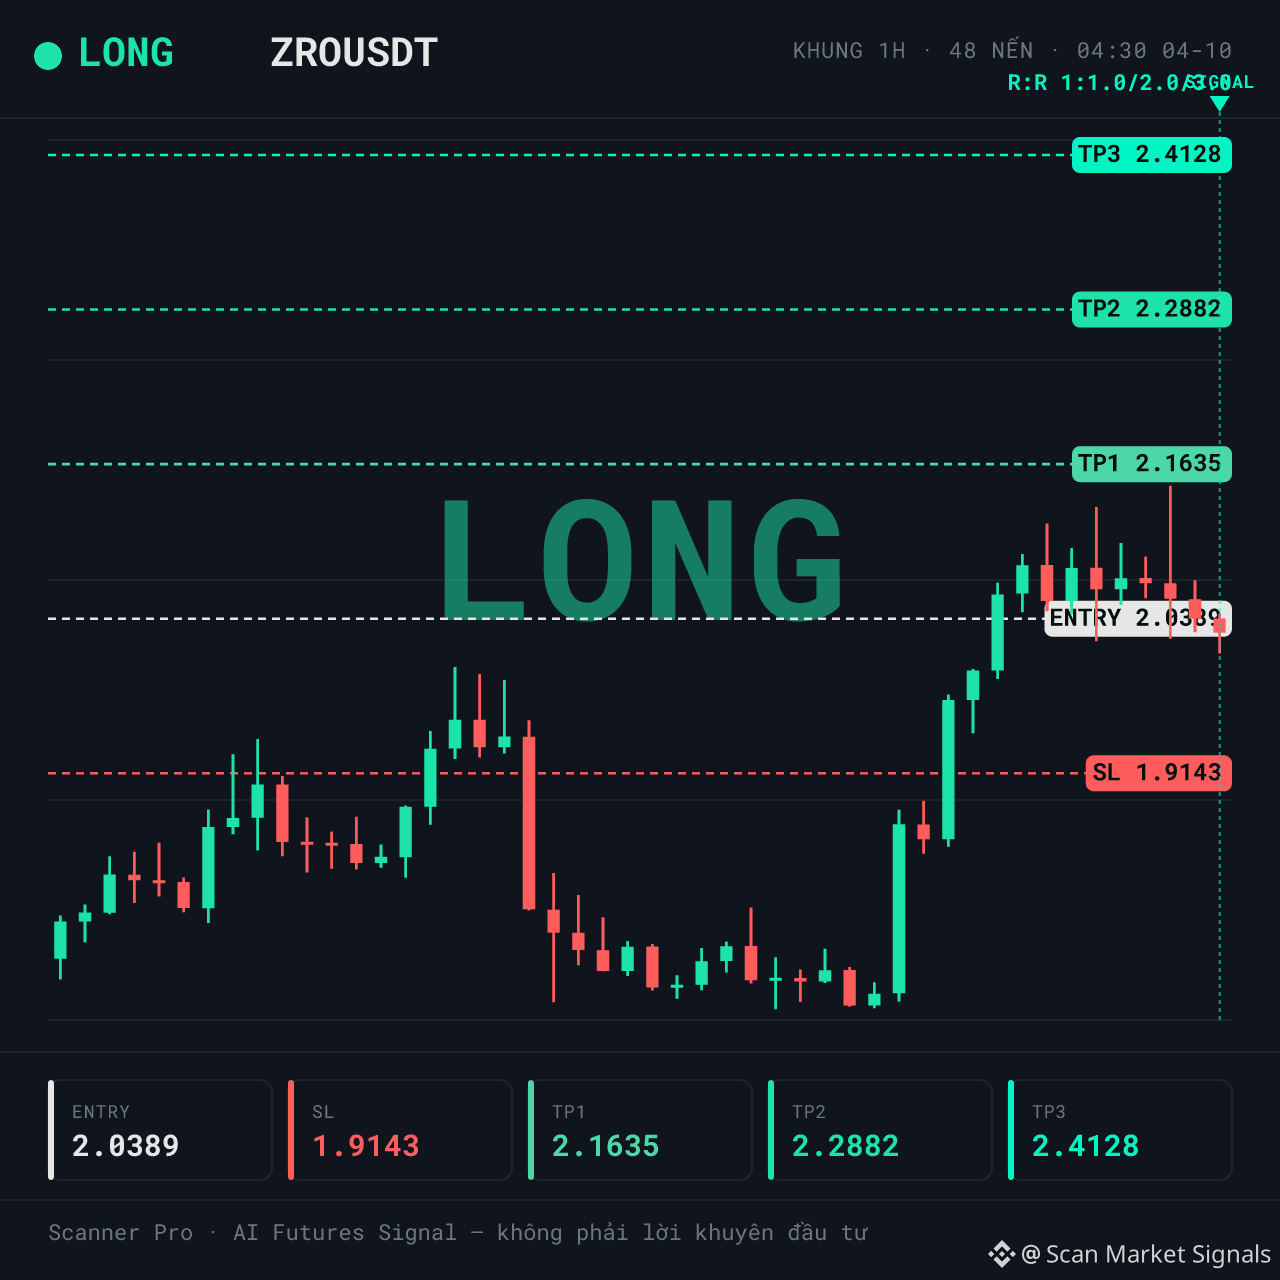
LONG $ZRO | The deactivation zone is quite far away, but the bullish side is having to pay fees
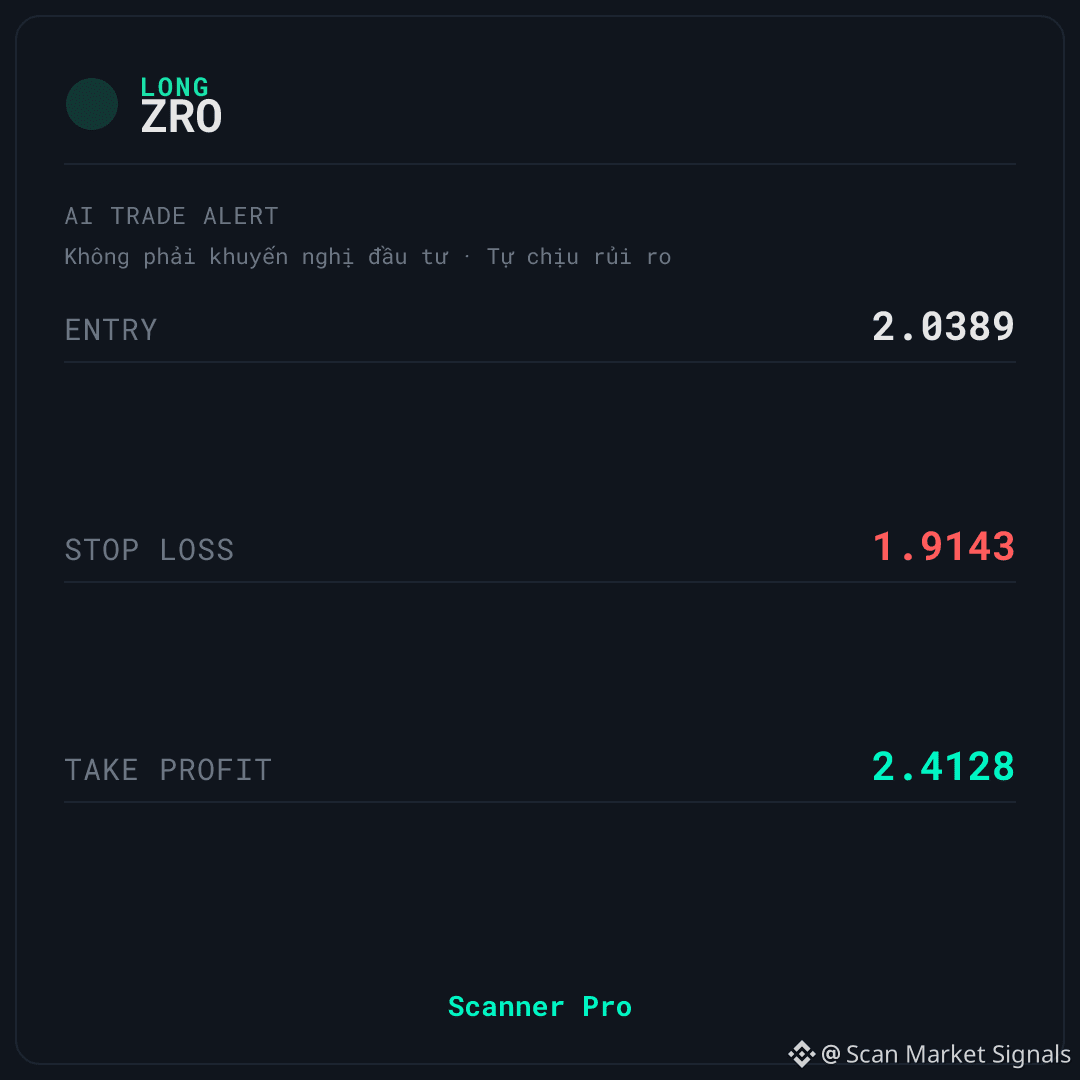
🚨 AI TRADE ALERT — $ZRO
🟢 LONG
📌 Entry: 2.0358 – 2.042
🛑 Stop Loss: 1.9143
🎯 Take Profit: 2.4128
⏰ Valid for: 6 hours (04:30 – 10:30 VN) - Date: 04/10
📈 UPTREND — LONG goes along with the uptrend
$ZRO is being tracked by Scanner Pro for the LONG scenario when the price holds above the entry zone and the 1h momentum is at 62.0. The context is classified as trend_up with a confidence of 70; the 24h volume is about 123,598.594 in the quote asset, with a volume spike of 0.38x.
📊 WHAT IS HAPPENING
The 24h volume is about 123,598.594 in the quote asset, with a volume spike of 0.38x — money flow has returned, but not yet in a dramatic way. The price is at 72% of the 24h range, i.e., the upper part of the trading range.
Funding 0.0050%: the LONG side is paying fees to the SHORT side, so the market is leaning long. The context is classified as trend_up with confidence 70; it’s not at a high level yet.
⚠️ RISK YOU NEED TO KNOW AHEAD OF TIME — $ZRO
⚠️ The crowd is leaning TOWARD the same side as this signal, and that side is paying fees — this is a disadvantage point to watch, not a confirmation. The 1h momentum has risen to 62.0; it’s getting hotter, so it’s no longer a support point for the buy scenario.
If the price closes below the stop-loss level on the signal card, the current LONG scenario is no longer valid.
In your view, which side—buyers or sellers—has the advantage in the current price zone?
This is educational technical analysis content, not investment advice. Crypto trading carries high risk; you may lose all your capital. Do your own research and take responsibility for your decisions.
#Binance #Crypto #Futures
LONG $ZRO | The deactivation zone is quite far away, but the bullish side is having to pay fees
🚨 AI TRADE ALERT — $ZRO
🟢 LONG
📌 Entry: 2.0358 – 2.042
🛑 Stop Loss: 1.9143
🎯 Take Profit: 2.4128
⏰ Valid for: 6 hours (04:30 – 10:30 VN) - Date: 04/10
📈 UPTREND — LONG goes along with the uptrend
$ZRO is being tracked by Scanner Pro for the LONG scenario when the price holds above the entry zone and the 1h momentum is at 62.0. The context is classified as trend_up with a confidence of 70; the 24h volume is about 123,598.594 in the quote asset, with a volume spike of 0.38x.
📊 WHAT IS HAPPENING
The 24h volume is about 123,598.594 in the quote asset, with a volume spike of 0.38x — money flow has returned, but not yet in a dramatic way. The price is at 72% of the 24h range, i.e., the upper part of the trading range.
Funding 0.0050%: the LONG side is paying fees to the SHORT side, so the market is leaning long. The context is classified as trend_up with confidence 70; it’s not at a high level yet.
⚠️ RISK YOU NEED TO KNOW AHEAD OF TIME — $ZRO
⚠️ The crowd is leaning TOWARD the same side as this signal, and that side is paying fees — this is a disadvantage point to watch, not a confirmation. The 1h momentum has risen to 62.0; it’s getting hotter, so it’s no longer a support point for the buy scenario.
If the price closes below the stop-loss level on the signal card, the current LONG scenario is no longer valid.
In your view, which side—buyers or sellers—has the advantage in the current price zone?
This is educational technical analysis content, not investment advice. Crypto trading carries high risk; you may lose all your capital. Do your own research and take responsibility for your decisions.
#Binance #Crypto #Futures
🚨 AI TRADE ALERT — $ZRO
🟢 LONG
📌 Entry: 2.0358 – 2.042
🛑 Stop Loss: 1.9143
🎯 Take Profit: 2.4128
⏰ Valid for: 6 hours (04:30 – 10:30 VN) - Date: 04/10
📈 UPTREND — LONG goes along with the uptrend
$ZRO is being tracked by Scanner Pro for the LONG scenario when the price holds above the entry zone and the 1h momentum is at 62.0. The context is classified as trend_up with a confidence of 70; the 24h volume is about 123,598.594 in the quote asset, with a volume spike of 0.38x.
📊 WHAT IS HAPPENING
The 24h volume is about 123,598.594 in the quote asset, with a volume spike of 0.38x — money flow has returned, but not yet in a dramatic way. The price is at 72% of the 24h range, i.e., the upper part of the trading range.
Funding 0.0050%: the LONG side is paying fees to the SHORT side, so the market is leaning long. The context is classified as trend_up with confidence 70; it’s not at a high level yet.
⚠️ RISK YOU NEED TO KNOW AHEAD OF TIME — $ZRO
⚠️ The crowd is leaning TOWARD the same side as this signal, and that side is paying fees — this is a disadvantage point to watch, not a confirmation. The 1h momentum has risen to 62.0; it’s getting hotter, so it’s no longer a support point for the buy scenario.
If the price closes below the stop-loss level on the signal card, the current LONG scenario is no longer valid.
In your view, which side—buyers or sellers—has the advantage in the current price zone?
This is educational technical analysis content, not investment advice. Crypto trading carries high risk; you may lose all your capital. Do your own research and take responsibility for your decisions.
#Binance #Crypto #Futures
4
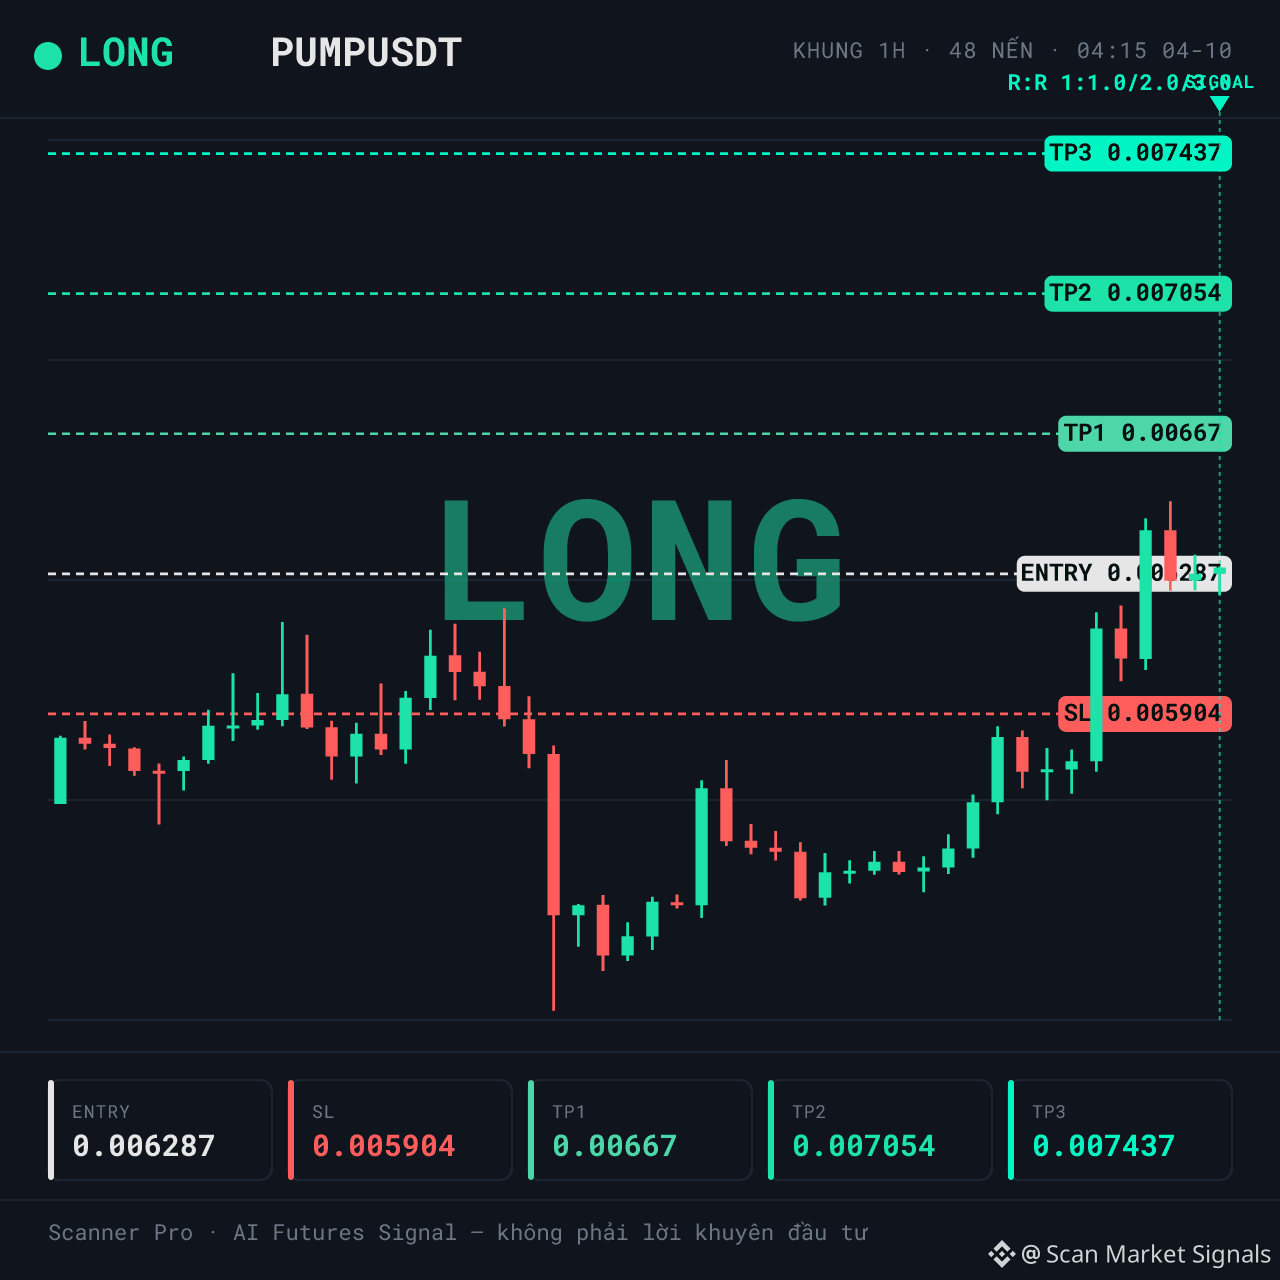
LONG $PUMP | Regime trend_up supports, but momentum is getting overheated
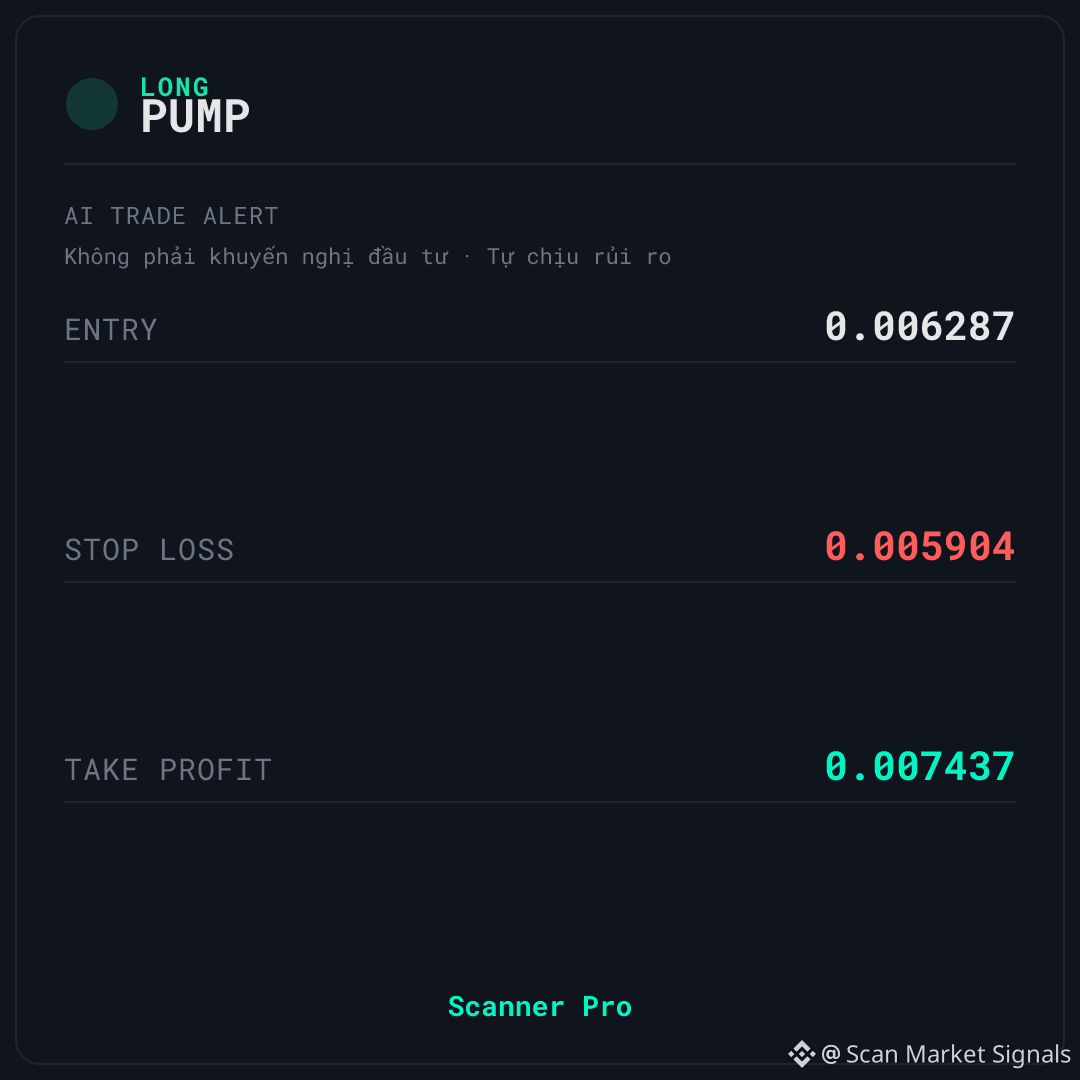
🚨 AI TRADE ALERT — $PUMP
🟢 LONG
📌 Entry: 0.006278 – 0.006296
🛑 Stop Loss: 0.005904
🎯 Take Profit: 0.007437
⏰ Valid for: 6 hours (04:15 – 10:15 VN) - Date: 04/10
📈 UPTREND — LONG goes along with the uptrend
$PUMP đang is being tracked by Scanner Pro for a LONG scenario when the regime is classified as trend_up with a confidence of 70. The 24h volume is about 326,287,464 in quote asset terms, with a volume spike of 0.19x and funding of 0.0050%.
📊 WHAT IS HAPPENING
Regime trend_up with confidence 70 — the overall backdrop leans toward the uptrend, aligning with the LONG scenario that Scanner Pro is monitoring. The 24h volume is about 326,287,464 (quote asset), and the 0.19x volume spike suggests capital has returned, but not yet with a major breakout.
Funding 0.0050% — the LONG side is paying the SHORT side, meaning the crowd is leaning TOWARD the same side as this signal. This is a disadvantage that needs to be watched—not a supportive factor.
⚠️ RISK YOU SHOULD KNOW BEFORE — $PUMP
🚫 RSI 1h 65,81 — momentum has already heated up, so it’s no longer a buy-supporting point for the scenario, and the price is currently at 83% of the 24h range, i.e., the upper end of the range.
On top of that, the LONG side is crowded and has to pay funding fees — the risk is higher when the crowd is positioned on the same side.
If the price closes below the stop-loss level on the signal card, the current LONG scenario is no longer valid.
Do you think this is continued upward momentum, or a sign that a deeper retest is needed before going further?
This is educational technical analysis content, not investment advice. Cryptocurrency trading carries high risk—you may lose all of your capital. Do your own research and take responsibility for your decisions.
#Binance #Crypto #Futures
LONG $PUMP | Regime trend_up supports, but momentum is getting overheated
🚨 AI TRADE ALERT — $PUMP
🟢 LONG
📌 Entry: 0.006278 – 0.006296
🛑 Stop Loss: 0.005904
🎯 Take Profit: 0.007437
⏰ Valid for: 6 hours (04:15 – 10:15 VN) - Date: 04/10
📈 UPTREND — LONG goes along with the uptrend
$PUMP đang is being tracked by Scanner Pro for a LONG scenario when the regime is classified as trend_up with a confidence of 70. The 24h volume is about 326,287,464 in quote asset terms, with a volume spike of 0.19x and funding of 0.0050%.
📊 WHAT IS HAPPENING
Regime trend_up with confidence 70 — the overall backdrop leans toward the uptrend, aligning with the LONG scenario that Scanner Pro is monitoring. The 24h volume is about 326,287,464 (quote asset), and the 0.19x volume spike suggests capital has returned, but not yet with a major breakout.
Funding 0.0050% — the LONG side is paying the SHORT side, meaning the crowd is leaning TOWARD the same side as this signal. This is a disadvantage that needs to be watched—not a supportive factor.
⚠️ RISK YOU SHOULD KNOW BEFORE — $PUMP
🚫 RSI 1h 65,81 — momentum has already heated up, so it’s no longer a buy-supporting point for the scenario, and the price is currently at 83% of the 24h range, i.e., the upper end of the range.
On top of that, the LONG side is crowded and has to pay funding fees — the risk is higher when the crowd is positioned on the same side.
If the price closes below the stop-loss level on the signal card, the current LONG scenario is no longer valid.
Do you think this is continued upward momentum, or a sign that a deeper retest is needed before going further?
This is educational technical analysis content, not investment advice. Cryptocurrency trading carries high risk—you may lose all of your capital. Do your own research and take responsibility for your decisions.
#Binance #Crypto #Futures
🚨 AI TRADE ALERT — $PUMP
🟢 LONG
📌 Entry: 0.006278 – 0.006296
🛑 Stop Loss: 0.005904
🎯 Take Profit: 0.007437
⏰ Valid for: 6 hours (04:15 – 10:15 VN) - Date: 04/10
📈 UPTREND — LONG goes along with the uptrend
$PUMP đang is being tracked by Scanner Pro for a LONG scenario when the regime is classified as trend_up with a confidence of 70. The 24h volume is about 326,287,464 in quote asset terms, with a volume spike of 0.19x and funding of 0.0050%.
📊 WHAT IS HAPPENING
Regime trend_up with confidence 70 — the overall backdrop leans toward the uptrend, aligning with the LONG scenario that Scanner Pro is monitoring. The 24h volume is about 326,287,464 (quote asset), and the 0.19x volume spike suggests capital has returned, but not yet with a major breakout.
Funding 0.0050% — the LONG side is paying the SHORT side, meaning the crowd is leaning TOWARD the same side as this signal. This is a disadvantage that needs to be watched—not a supportive factor.
⚠️ RISK YOU SHOULD KNOW BEFORE — $PUMP
🚫 RSI 1h 65,81 — momentum has already heated up, so it’s no longer a buy-supporting point for the scenario, and the price is currently at 83% of the 24h range, i.e., the upper end of the range.
On top of that, the LONG side is crowded and has to pay funding fees — the risk is higher when the crowd is positioned on the same side.
If the price closes below the stop-loss level on the signal card, the current LONG scenario is no longer valid.
Do you think this is continued upward momentum, or a sign that a deeper retest is needed before going further?
This is educational technical analysis content, not investment advice. Cryptocurrency trading carries high risk—you may lose all of your capital. Do your own research and take responsibility for your decisions.
#Binance #Crypto #Futures
6
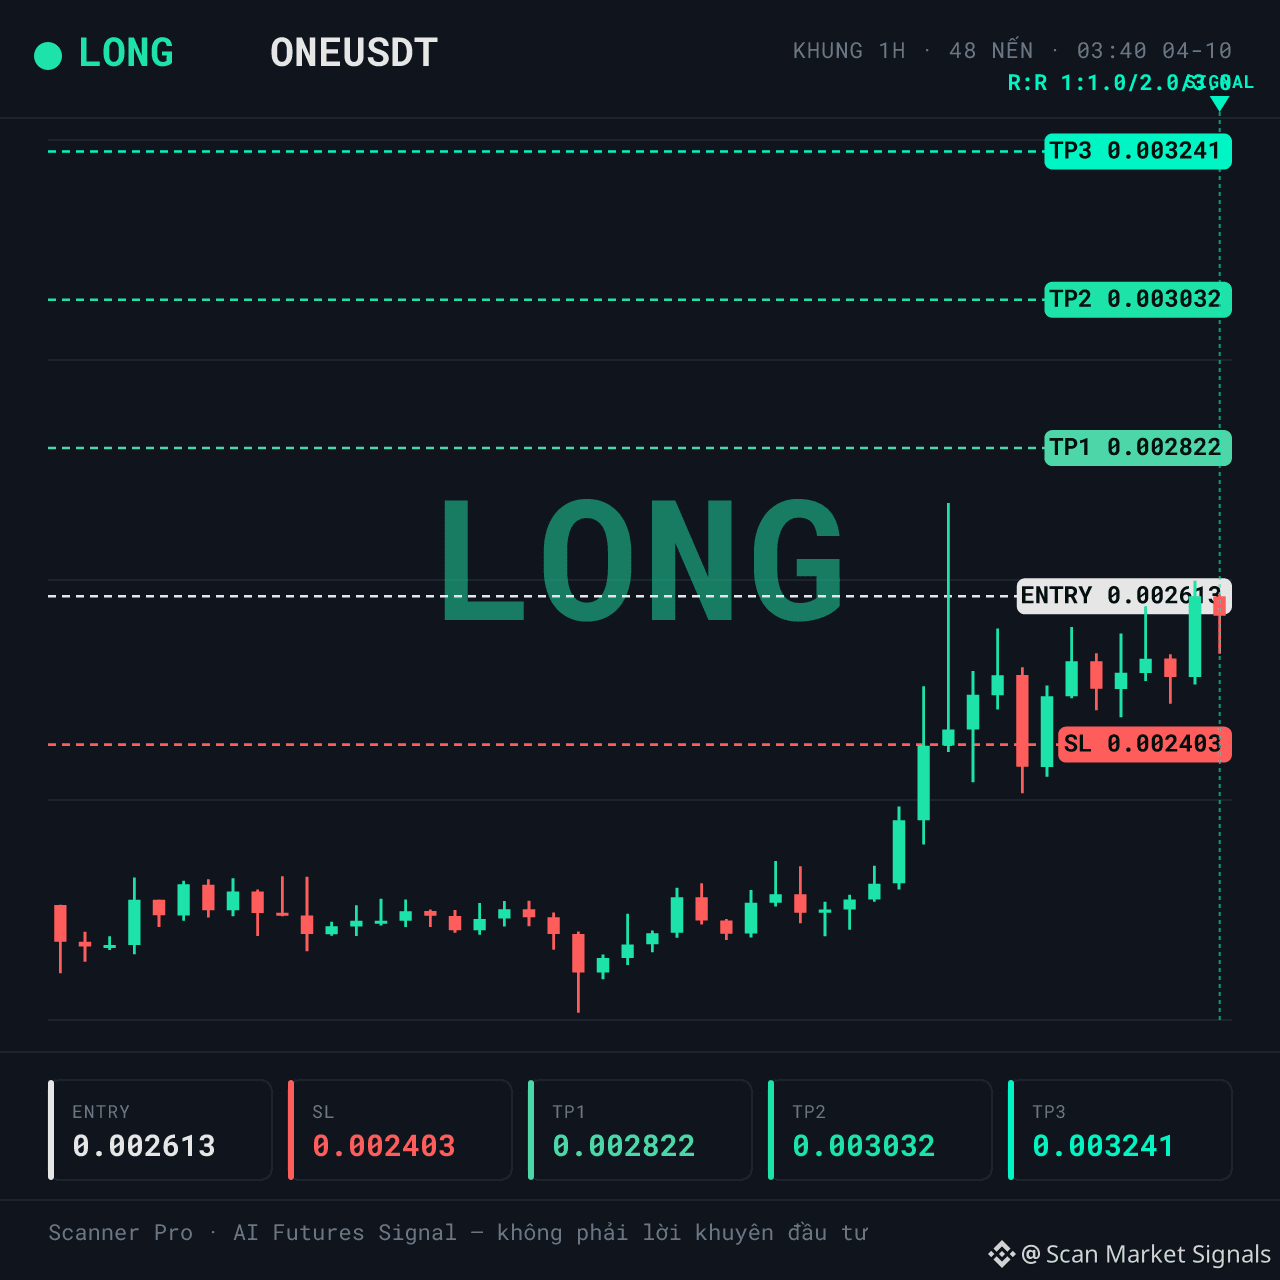
LONG $ONE | Deep liquidity, but momentum is already heating up, and the cash flow is leaning toward a short
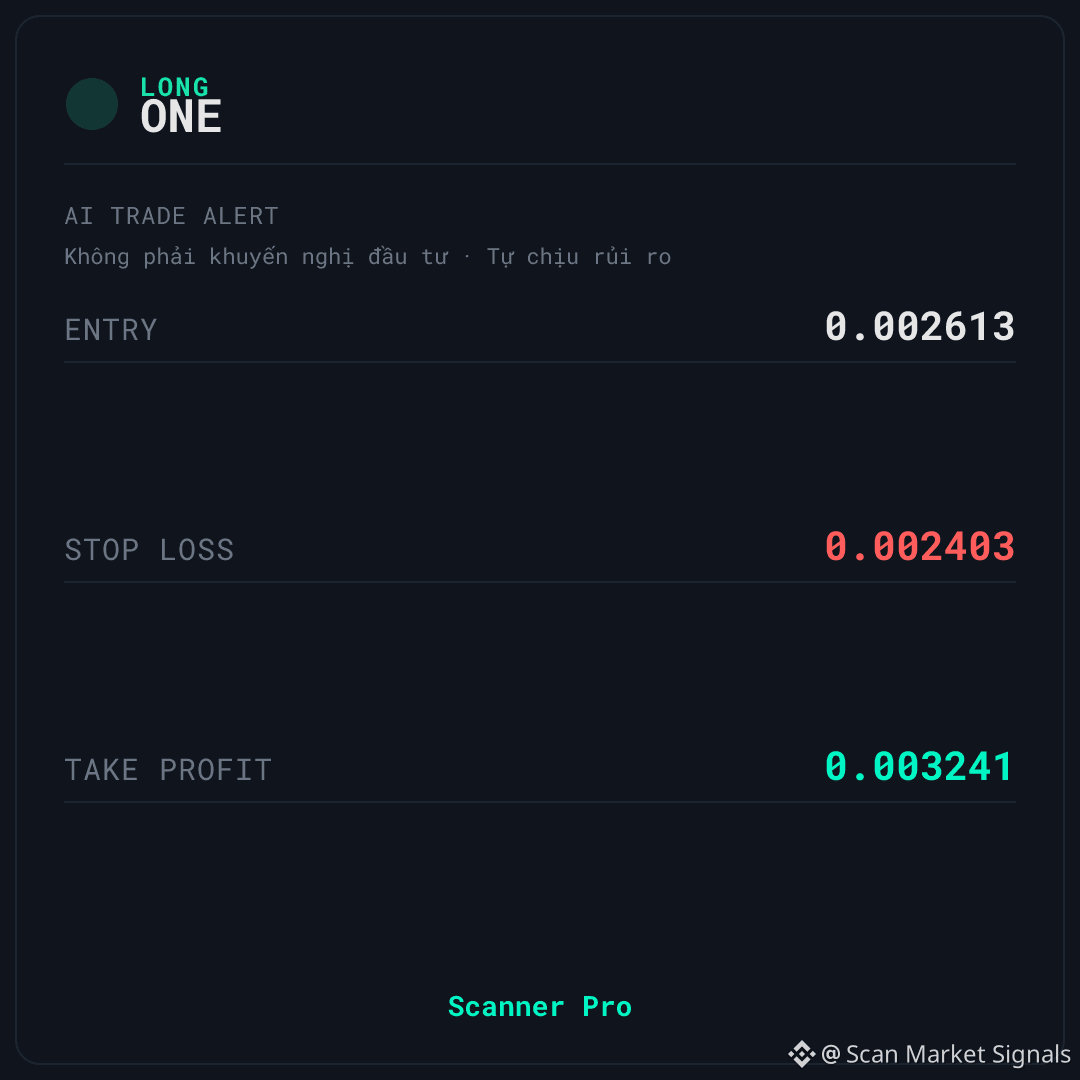
🚨 AI TRADE ALERT — $ONE
🟢 LONG
📌 Entry: 0.002609 – 0.002617
🛑 Stop Loss: 0.002403
🎯 Take Profit: 0.003241
⏰ Valid for: 6 hours (03:40 – 09:40 VN) - Date: 04/10
📈 UPTREND — LONG goes with the upward trend
$ONE đang được Scanner Pro theo dõi kịch bản LONG when the price maintains an uptrend structure on the 1-hour timeframe. The setup is classified as trend_up with 24h volume of about 148.017.374 in the quote asset, and a volume spike of 0.57x.
📊 WHY IT’S WORTH NOTING
Funding -0.7557% indicates the SHORT side is paying fees to the LONG side — the crowd is leaning against this signal, which supports the LONG direction. 24h volume is about 148.017.374 in the quote asset with a volume spike of 0.57x; liquidity is rated as high, helping reduce the risk of slippage when orders execute.
The price is at 75% of the 24h range, with a 24h fluctuation range of 24.6% — there is still room to rise, but not much headroom left above.
⚠️ SETUP & RISK — $ONE
🚫 The biggest downside: the 1-hour momentum indicator is already at 67.73 — an overbought zone. Momentum is heating up, so it’s no longer a support point for a buy setup. In addition, price is in the high area of the 24h range, making it prone to profit-taking pressure.
If the price closes below the stop-loss level on the signal card, the current LONG scenario is no longer valid.
What do you think: is this a sign that big money is accumulating, or just a technical pullback before the price retests deeper?
This is educational technical analysis content, not investment advice. Cryptocurrency trading carries a high risk, and you may lose all your capital. Please do your own research and take responsibility for your decisions.
#Binance #Crypto #Futures
LONG $ONE | Deep liquidity, but momentum is already heating up, and the cash flow is leaning toward a short
🚨 AI TRADE ALERT — $ONE
🟢 LONG
📌 Entry: 0.002609 – 0.002617
🛑 Stop Loss: 0.002403
🎯 Take Profit: 0.003241
⏰ Valid for: 6 hours (03:40 – 09:40 VN) - Date: 04/10
📈 UPTREND — LONG goes with the upward trend
$ONE đang được Scanner Pro theo dõi kịch bản LONG when the price maintains an uptrend structure on the 1-hour timeframe. The setup is classified as trend_up with 24h volume of about 148.017.374 in the quote asset, and a volume spike of 0.57x.
📊 WHY IT’S WORTH NOTING
Funding -0.7557% indicates the SHORT side is paying fees to the LONG side — the crowd is leaning against this signal, which supports the LONG direction. 24h volume is about 148.017.374 in the quote asset with a volume spike of 0.57x; liquidity is rated as high, helping reduce the risk of slippage when orders execute.
The price is at 75% of the 24h range, with a 24h fluctuation range of 24.6% — there is still room to rise, but not much headroom left above.
⚠️ SETUP & RISK — $ONE
🚫 The biggest downside: the 1-hour momentum indicator is already at 67.73 — an overbought zone. Momentum is heating up, so it’s no longer a support point for a buy setup. In addition, price is in the high area of the 24h range, making it prone to profit-taking pressure.
If the price closes below the stop-loss level on the signal card, the current LONG scenario is no longer valid.
What do you think: is this a sign that big money is accumulating, or just a technical pullback before the price retests deeper?
This is educational technical analysis content, not investment advice. Cryptocurrency trading carries a high risk, and you may lose all your capital. Please do your own research and take responsibility for your decisions.
#Binance #Crypto #Futures
🚨 AI TRADE ALERT — $ONE
🟢 LONG
📌 Entry: 0.002609 – 0.002617
🛑 Stop Loss: 0.002403
🎯 Take Profit: 0.003241
⏰ Valid for: 6 hours (03:40 – 09:40 VN) - Date: 04/10
📈 UPTREND — LONG goes with the upward trend
$ONE đang được Scanner Pro theo dõi kịch bản LONG when the price maintains an uptrend structure on the 1-hour timeframe. The setup is classified as trend_up with 24h volume of about 148.017.374 in the quote asset, and a volume spike of 0.57x.
📊 WHY IT’S WORTH NOTING
Funding -0.7557% indicates the SHORT side is paying fees to the LONG side — the crowd is leaning against this signal, which supports the LONG direction. 24h volume is about 148.017.374 in the quote asset with a volume spike of 0.57x; liquidity is rated as high, helping reduce the risk of slippage when orders execute.
The price is at 75% of the 24h range, with a 24h fluctuation range of 24.6% — there is still room to rise, but not much headroom left above.
⚠️ SETUP & RISK — $ONE
🚫 The biggest downside: the 1-hour momentum indicator is already at 67.73 — an overbought zone. Momentum is heating up, so it’s no longer a support point for a buy setup. In addition, price is in the high area of the 24h range, making it prone to profit-taking pressure.
If the price closes below the stop-loss level on the signal card, the current LONG scenario is no longer valid.
What do you think: is this a sign that big money is accumulating, or just a technical pullback before the price retests deeper?
This is educational technical analysis content, not investment advice. Cryptocurrency trading carries a high risk, and you may lose all your capital. Please do your own research and take responsibility for your decisions.
#Binance #Crypto #Futures
1
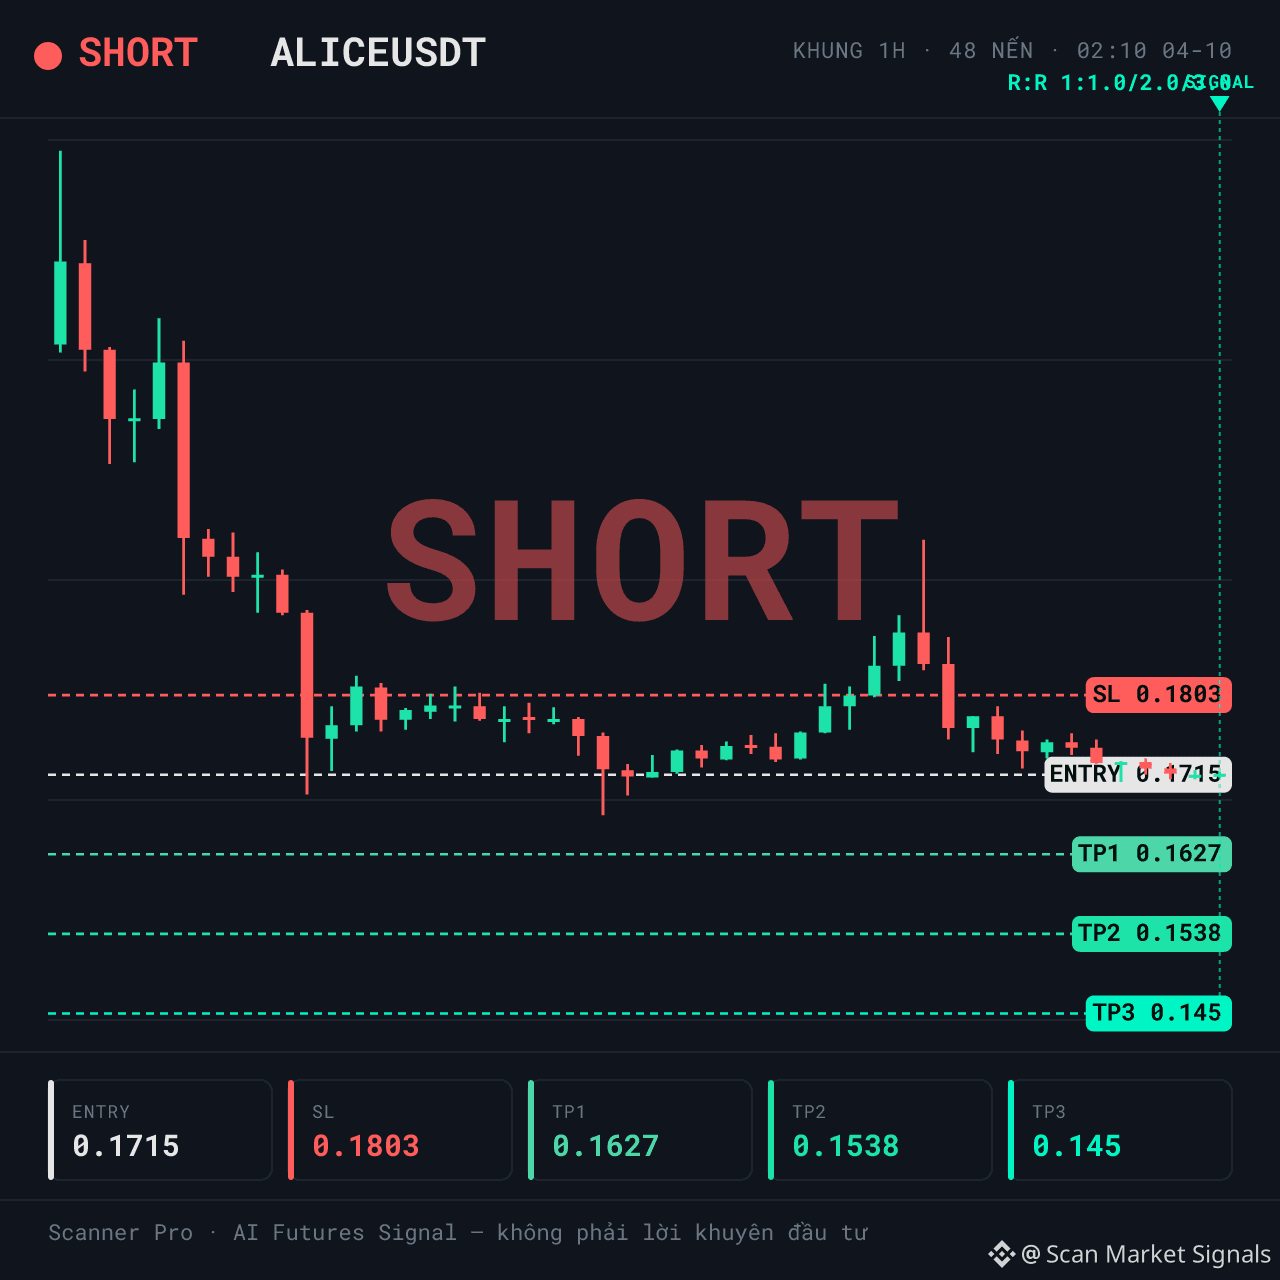
SHORT $ALICE | Volume barely moves 0.03x — reversal signal needs confirmation
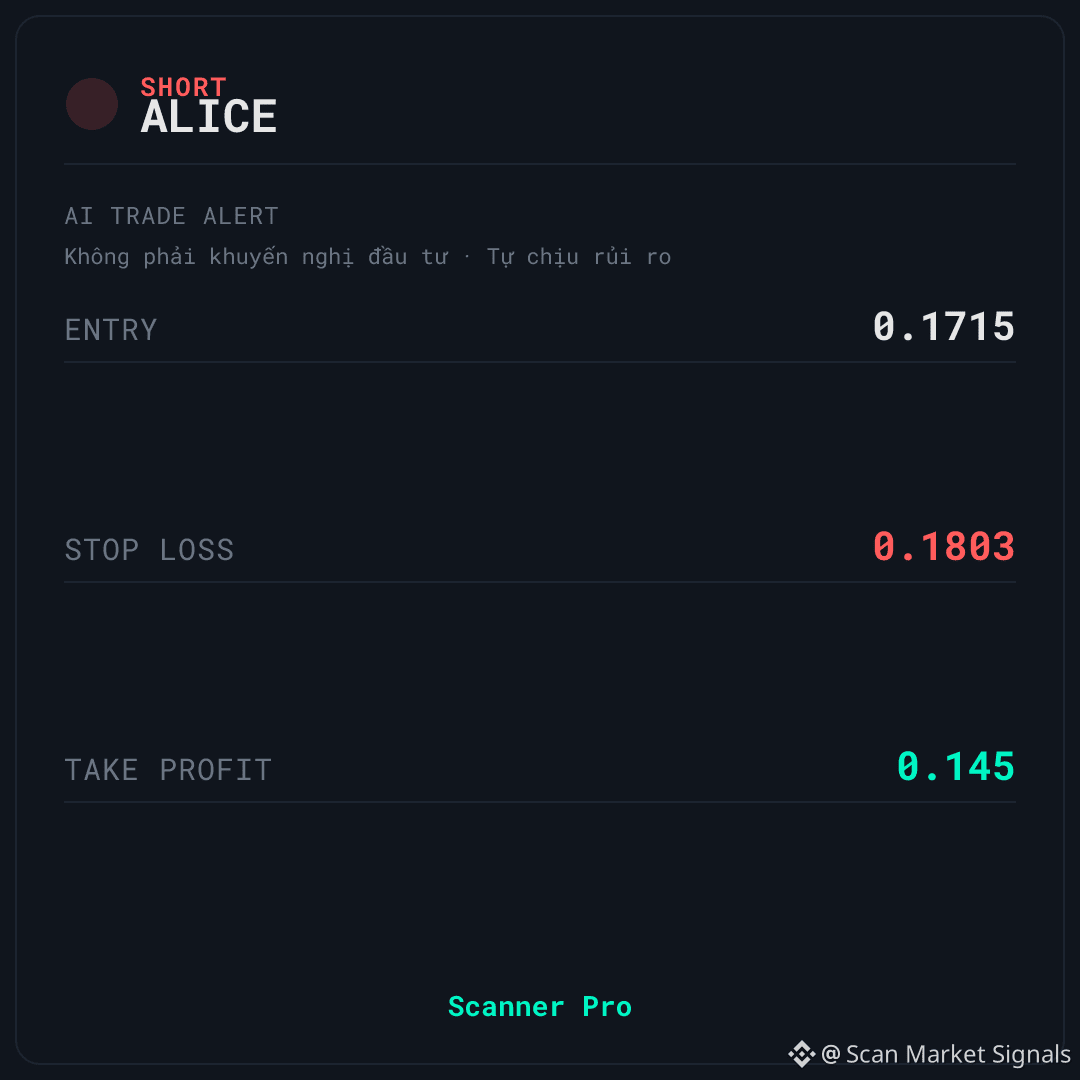
🚨 AI TRADE ALERT — $ALICE
🔴 SHORT
📌 Entry: 0.1712 – 0.1718
🛑 Stop Loss: 0.1803
🎯 Take Profit: 0.145
⏰ Valid for: 6 hours (02:10 – 08:10 VN time) - Date: 04/10
↔️ SIDEWAY — the market is ranging; the signal is fading (mean-reversion)
$ALICE is being monitored by Scanner Pro under the SHORT scenario when price reacts weakly at the upper end of the 24h range. The context is classified as sideways with a classification confidence of 55, and positive funding of 0.0050% indicates the LONG side is paying fees to the SHORT side.
📊 CONTEXT & DATA
24h volume is about 27,509,139 (in quote asset terms), but the volume spike is only 0.03x — meaning liquidity is normal with no sudden inflow to confirm the move. The price position within the 24h range is just 8%, indicating price is near the bottom of today’s trading band.
Noteworthy point: positive funding of 0.0050% means the LONG side is paying fees to the SHORT side — the crowd is leaning against this SHORT signal, which is considered a supportive factor for the selling direction.
🚫 INVALIDATION & RISK MANAGEMENT — $ALICE
Biggest downside: price is currently in the lower part of the 24h range, so additional upside room may be narrower than setups that form in the middle of the band. This is a risk to monitor, not a buy signal.
If price closes above the stop-loss level on the signal card, the current SHORT scenario is no longer valid.
Do you think this is a liquidity sweep or a real reversal signal?
This is educational technical analysis content, not investment advice. Crypto trading carries high risk, and you could lose all your capital. Do your own research and be responsible for your decisions.
#Binance #Crypto #Futures
SHORT $ALICE | Volume barely moves 0.03x — reversal signal needs confirmation
🚨 AI TRADE ALERT — $ALICE
🔴 SHORT
📌 Entry: 0.1712 – 0.1718
🛑 Stop Loss: 0.1803
🎯 Take Profit: 0.145
⏰ Valid for: 6 hours (02:10 – 08:10 VN time) - Date: 04/10
↔️ SIDEWAY — the market is ranging; the signal is fading (mean-reversion)
$ALICE is being monitored by Scanner Pro under the SHORT scenario when price reacts weakly at the upper end of the 24h range. The context is classified as sideways with a classification confidence of 55, and positive funding of 0.0050% indicates the LONG side is paying fees to the SHORT side.
📊 CONTEXT & DATA
24h volume is about 27,509,139 (in quote asset terms), but the volume spike is only 0.03x — meaning liquidity is normal with no sudden inflow to confirm the move. The price position within the 24h range is just 8%, indicating price is near the bottom of today’s trading band.
Noteworthy point: positive funding of 0.0050% means the LONG side is paying fees to the SHORT side — the crowd is leaning against this SHORT signal, which is considered a supportive factor for the selling direction.
🚫 INVALIDATION & RISK MANAGEMENT — $ALICE
Biggest downside: price is currently in the lower part of the 24h range, so additional upside room may be narrower than setups that form in the middle of the band. This is a risk to monitor, not a buy signal.
If price closes above the stop-loss level on the signal card, the current SHORT scenario is no longer valid.
Do you think this is a liquidity sweep or a real reversal signal?
This is educational technical analysis content, not investment advice. Crypto trading carries high risk, and you could lose all your capital. Do your own research and be responsible for your decisions.
#Binance #Crypto #Futures
🚨 AI TRADE ALERT — $ALICE
🔴 SHORT
📌 Entry: 0.1712 – 0.1718
🛑 Stop Loss: 0.1803
🎯 Take Profit: 0.145
⏰ Valid for: 6 hours (02:10 – 08:10 VN time) - Date: 04/10
↔️ SIDEWAY — the market is ranging; the signal is fading (mean-reversion)
$ALICE is being monitored by Scanner Pro under the SHORT scenario when price reacts weakly at the upper end of the 24h range. The context is classified as sideways with a classification confidence of 55, and positive funding of 0.0050% indicates the LONG side is paying fees to the SHORT side.
📊 CONTEXT & DATA
24h volume is about 27,509,139 (in quote asset terms), but the volume spike is only 0.03x — meaning liquidity is normal with no sudden inflow to confirm the move. The price position within the 24h range is just 8%, indicating price is near the bottom of today’s trading band.
Noteworthy point: positive funding of 0.0050% means the LONG side is paying fees to the SHORT side — the crowd is leaning against this SHORT signal, which is considered a supportive factor for the selling direction.
🚫 INVALIDATION & RISK MANAGEMENT — $ALICE
Biggest downside: price is currently in the lower part of the 24h range, so additional upside room may be narrower than setups that form in the middle of the band. This is a risk to monitor, not a buy signal.
If price closes above the stop-loss level on the signal card, the current SHORT scenario is no longer valid.
Do you think this is a liquidity sweep or a real reversal signal?
This is educational technical analysis content, not investment advice. Crypto trading carries high risk, and you could lose all your capital. Do your own research and be responsible for your decisions.
#Binance #Crypto #Futures
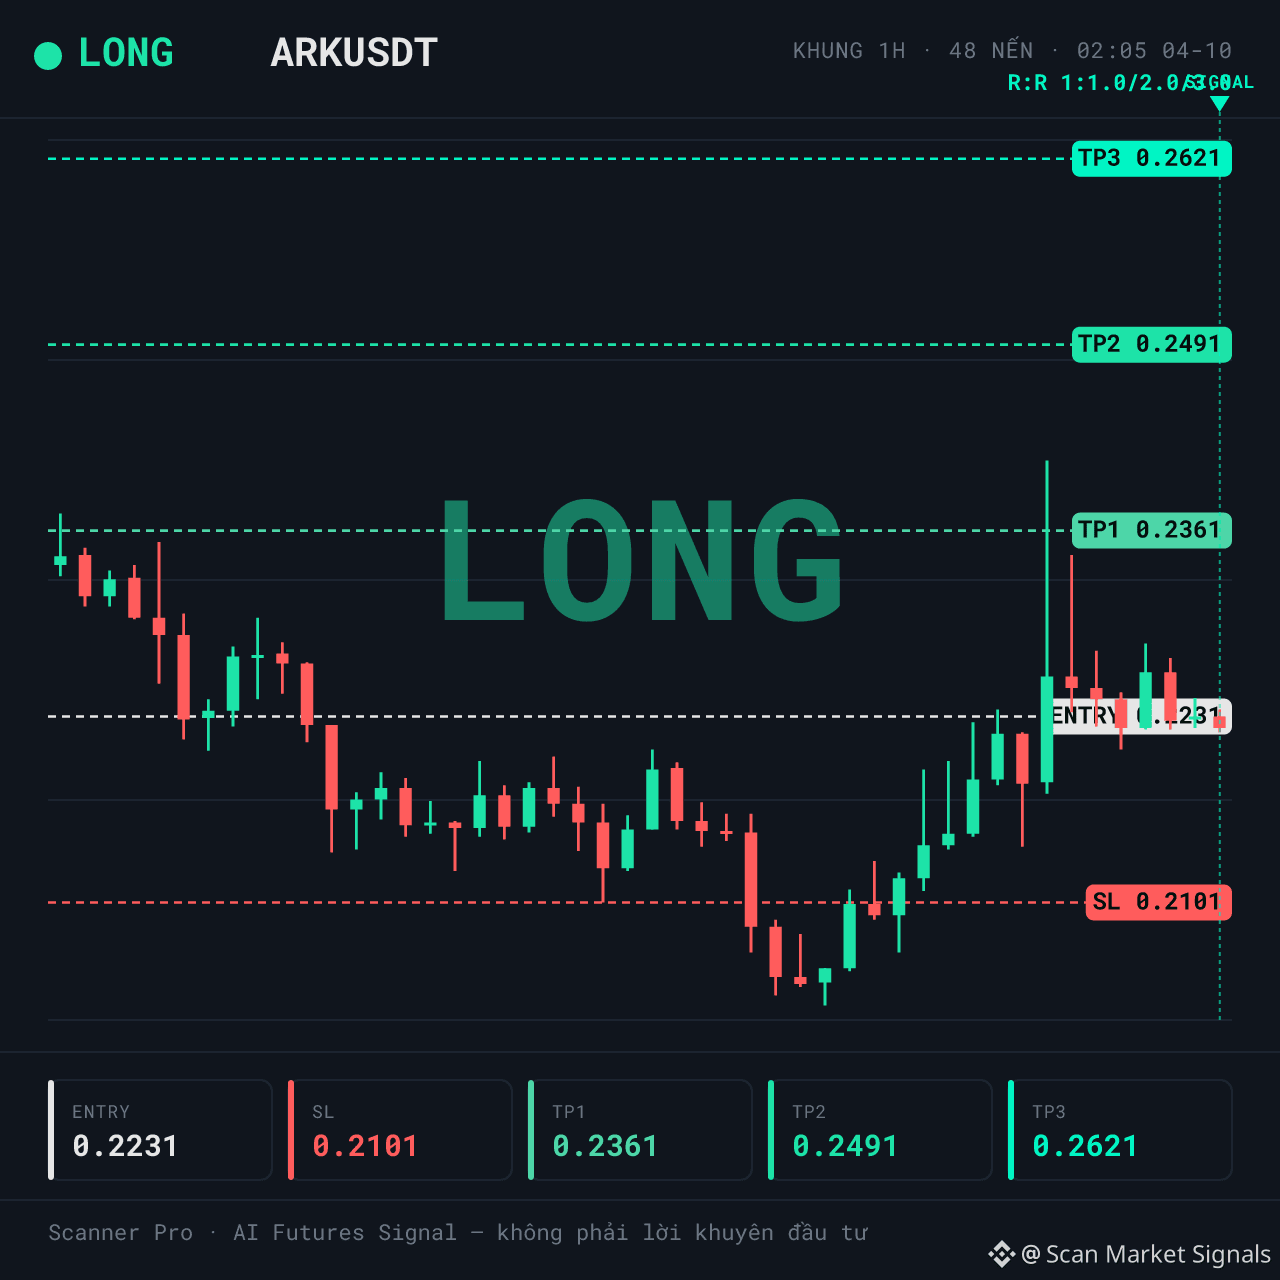
LONG $ARK | Why short positions are paying fees, but is the price really in the right place?
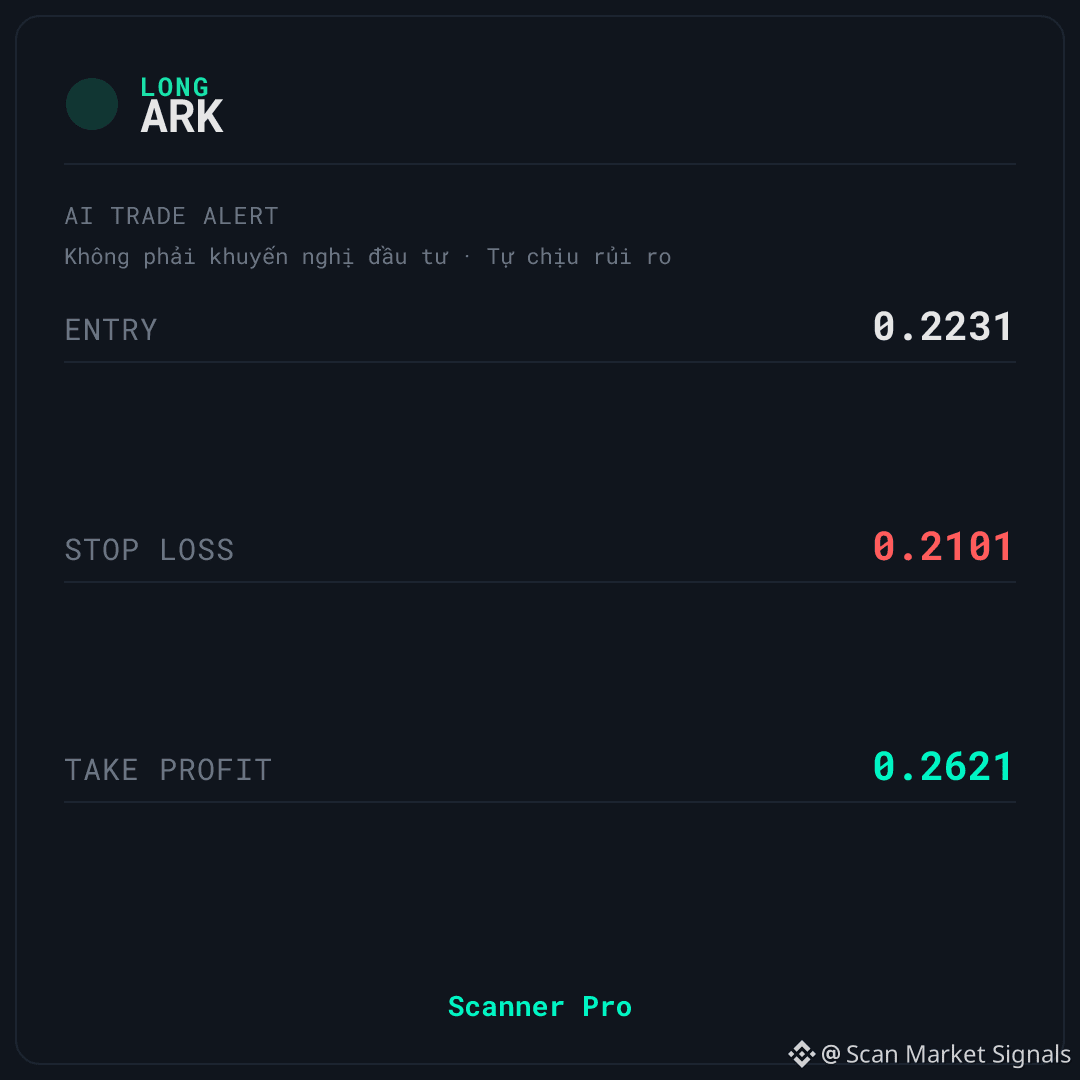
🚨 AI TRADE ALERT — $ARK
🟢 LONG
📌 Entry: 0.2228 – 0.2234
🛑 Stop Loss: 0.2101
🎯 Take Profit: 0.2621
⏰ Validity: 6 hours (02:05 – 08:05 VN) - Date: 04/10
↔️ SIDEWAY — the market is moving sideways; the signal is fading (mean-reversion)
$ARK is being monitored by Scanner Pro under the LONG scenario when the price stays above the entry zone and the short side is paying funding fees. The backdrop is classified as sideway with a classification confidence of 55; the 24h volume is about 40.772.691 in the quote asset.
📊 WHAT THE DATA IS SHOWING
The first point that could make this scenario wrong: the price is currently only around 52% of the 24h range — not a deeply discounted zone, and not an excessively high zone either, so there isn’t a clear positional advantage for buyers. In addition, the context is only classified as sideway with confidence 55, meaning the trend classification isn’t truly solid.
The point that could support this: funding -0.0535% with the literal meaning — the SHORT side is paying fees to the LONG side, and the crowd is leaning against this signal. 24h volume is about 40.772.691 in the quote asset, with a volume spike of 0.03x.
💡 SCENARIO & OPEN QUESTIONS — $ARK
⚠️ The biggest risk: the LONG direction is aligned with the side receiving funding — buyers are more crowded, and this is the key factor to watch. It is not a confirmed reversal signal.
🚫 If the price closes below the stop-loss level shown on the signal card, the current LONG scenario is no longer valid.
💡 Do you think this is a sign that the money flow is leaning toward buyers, or is it just a bounce within a market that hasn’t formed a clear trend yet?
This is educational technical analysis content, not investment advice. Cryptocurrency trading carries high risk; you may lose all of your capital. Do your own research and take responsibility for your decisions.
#Binance #Crypto #Futures
LONG $ARK | Why short positions are paying fees, but is the price really in the right place?
🚨 AI TRADE ALERT — $ARK
🟢 LONG
📌 Entry: 0.2228 – 0.2234
🛑 Stop Loss: 0.2101
🎯 Take Profit: 0.2621
⏰ Validity: 6 hours (02:05 – 08:05 VN) - Date: 04/10
↔️ SIDEWAY — the market is moving sideways; the signal is fading (mean-reversion)
$ARK is being monitored by Scanner Pro under the LONG scenario when the price stays above the entry zone and the short side is paying funding fees. The backdrop is classified as sideway with a classification confidence of 55; the 24h volume is about 40.772.691 in the quote asset.
📊 WHAT THE DATA IS SHOWING
The first point that could make this scenario wrong: the price is currently only around 52% of the 24h range — not a deeply discounted zone, and not an excessively high zone either, so there isn’t a clear positional advantage for buyers. In addition, the context is only classified as sideway with confidence 55, meaning the trend classification isn’t truly solid.
The point that could support this: funding -0.0535% with the literal meaning — the SHORT side is paying fees to the LONG side, and the crowd is leaning against this signal. 24h volume is about 40.772.691 in the quote asset, with a volume spike of 0.03x.
💡 SCENARIO & OPEN QUESTIONS — $ARK
⚠️ The biggest risk: the LONG direction is aligned with the side receiving funding — buyers are more crowded, and this is the key factor to watch. It is not a confirmed reversal signal.
🚫 If the price closes below the stop-loss level shown on the signal card, the current LONG scenario is no longer valid.
💡 Do you think this is a sign that the money flow is leaning toward buyers, or is it just a bounce within a market that hasn’t formed a clear trend yet?
This is educational technical analysis content, not investment advice. Cryptocurrency trading carries high risk; you may lose all of your capital. Do your own research and take responsibility for your decisions.
#Binance #Crypto #Futures
🚨 AI TRADE ALERT — $ARK
🟢 LONG
📌 Entry: 0.2228 – 0.2234
🛑 Stop Loss: 0.2101
🎯 Take Profit: 0.2621
⏰ Validity: 6 hours (02:05 – 08:05 VN) - Date: 04/10
↔️ SIDEWAY — the market is moving sideways; the signal is fading (mean-reversion)
$ARK is being monitored by Scanner Pro under the LONG scenario when the price stays above the entry zone and the short side is paying funding fees. The backdrop is classified as sideway with a classification confidence of 55; the 24h volume is about 40.772.691 in the quote asset.
📊 WHAT THE DATA IS SHOWING
The first point that could make this scenario wrong: the price is currently only around 52% of the 24h range — not a deeply discounted zone, and not an excessively high zone either, so there isn’t a clear positional advantage for buyers. In addition, the context is only classified as sideway with confidence 55, meaning the trend classification isn’t truly solid.
The point that could support this: funding -0.0535% with the literal meaning — the SHORT side is paying fees to the LONG side, and the crowd is leaning against this signal. 24h volume is about 40.772.691 in the quote asset, with a volume spike of 0.03x.
💡 SCENARIO & OPEN QUESTIONS — $ARK
⚠️ The biggest risk: the LONG direction is aligned with the side receiving funding — buyers are more crowded, and this is the key factor to watch. It is not a confirmed reversal signal.
🚫 If the price closes below the stop-loss level shown on the signal card, the current LONG scenario is no longer valid.
💡 Do you think this is a sign that the money flow is leaning toward buyers, or is it just a bounce within a market that hasn’t formed a clear trend yet?
This is educational technical analysis content, not investment advice. Cryptocurrency trading carries high risk; you may lose all of your capital. Do your own research and take responsibility for your decisions.
#Binance #Crypto #Futures
2
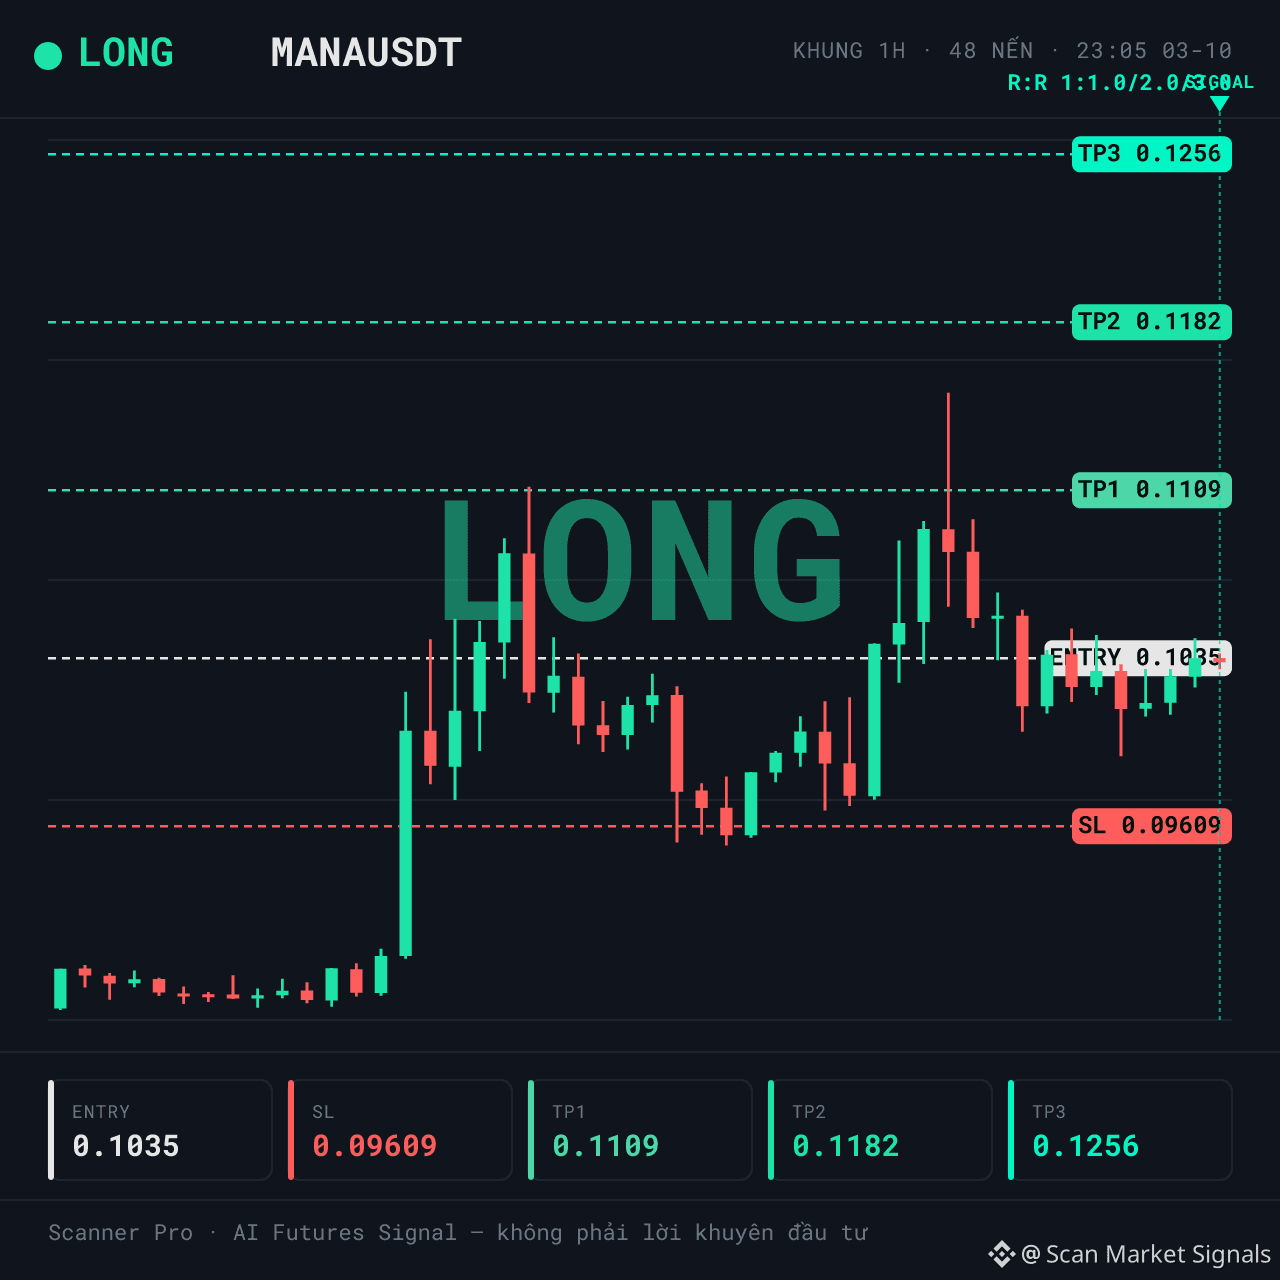
LONG $MANA | The short side is paying the long side fees
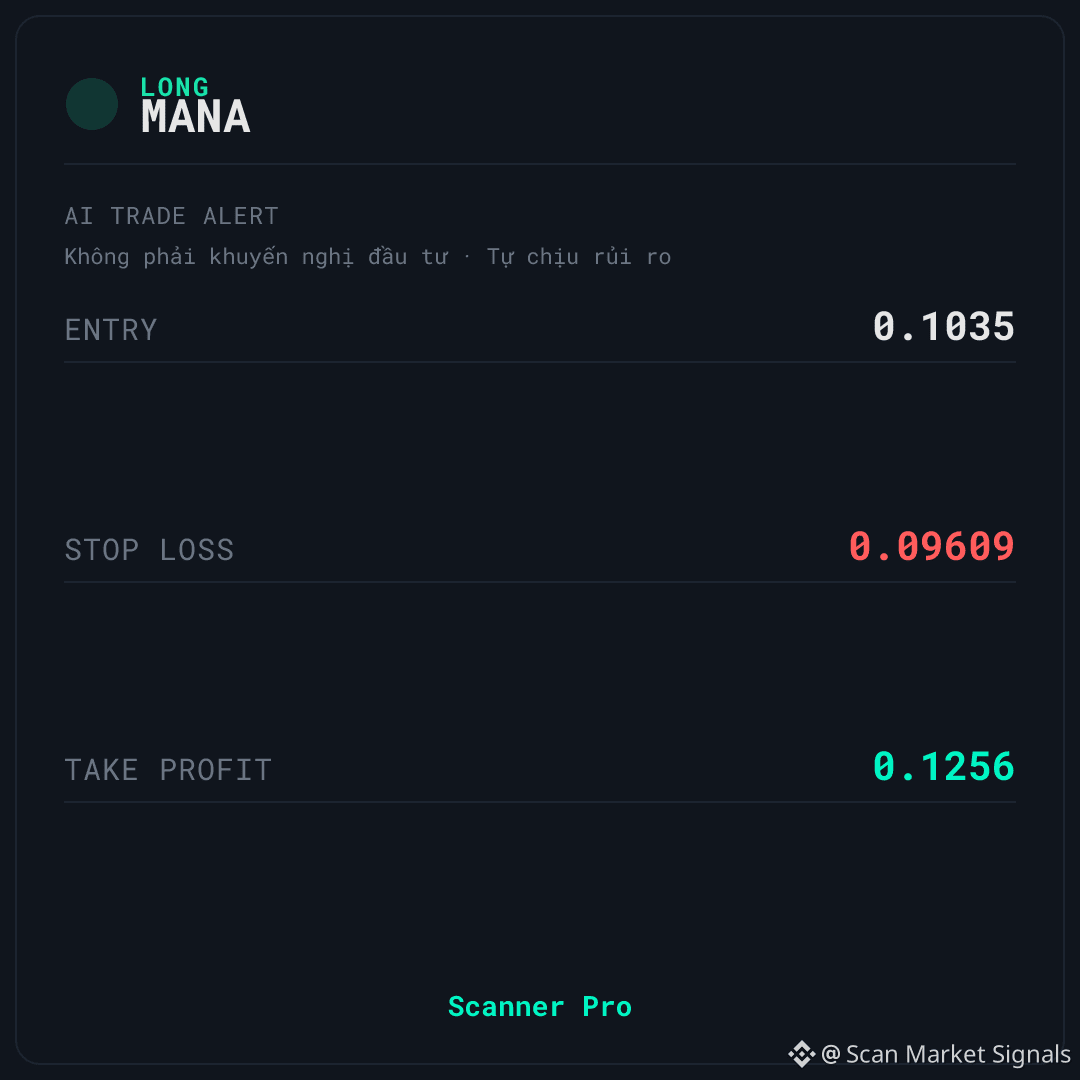
🚨 AI TRADE ALERT — $MANA
🟢 LONG
📌 Entry: 0.1033 – 0.1036
🛑 Stop Loss: 0.09609
🎯 Take Profit: 0.1256
⏰ Valid for: 6 hours (23:05 on 03/10 – 05:05 on 04/10, VN time)
↔️ SIDEWAYS — the market is moving sideways; the signal is fading (mean reversion)
$MANA is being monitored by Scanner Pro under the LONG scenario when the price holds the current range. The overall context is classified as sideways with a confidence of 55, and the 24h volume is about 101,833,670 in the quote asset.
📊 WHAT THE DATA IS SHOWING
The notable part is on the derivatives side: funding -0.0888%, meaning the SHORT side is paying fees to the LONG side — the crowd is leaning against the direction of the signal.
📊 The current price is at 41% within the 24h range; the 24h range is 19.2%. The 24h volume is about 101,833,670 in the quote asset, with a volume spike of 0.04x. The context is classified as sideways, and the confidence of this classification is not high.
💡 SCENARIO & OPEN QUESTIONS — $MANA
⚠️ The biggest downside: the direction of the LONG order matches the side that is being paid (the LONG side). That means this side is more crowded—this is a risk to monitor. The sideways context with confidence 55 also still doesn’t provide a clear confirmation.
If the price closes below the stop-loss level shown in the signal card, the current LONG scenario is no longer valid.
Do you think short-side funding paying fees is a sign the crowd is betting on the wrong direction, or is it just a temporary state while the market is trading sideways?
This is educational technical analysis content, not investment advice. Cryptocurrency trading carries high risk—you could lose all your capital. Please do your own research and take responsibility for your decisions.
#Binance #Crypto #Futures
LONG $MANA | The short side is paying the long side fees
🚨 AI TRADE ALERT — $MANA
🟢 LONG
📌 Entry: 0.1033 – 0.1036
🛑 Stop Loss: 0.09609
🎯 Take Profit: 0.1256
⏰ Valid for: 6 hours (23:05 on 03/10 – 05:05 on 04/10, VN time)
↔️ SIDEWAYS — the market is moving sideways; the signal is fading (mean reversion)
$MANA is being monitored by Scanner Pro under the LONG scenario when the price holds the current range. The overall context is classified as sideways with a confidence of 55, and the 24h volume is about 101,833,670 in the quote asset.
📊 WHAT THE DATA IS SHOWING
The notable part is on the derivatives side: funding -0.0888%, meaning the SHORT side is paying fees to the LONG side — the crowd is leaning against the direction of the signal.
📊 The current price is at 41% within the 24h range; the 24h range is 19.2%. The 24h volume is about 101,833,670 in the quote asset, with a volume spike of 0.04x. The context is classified as sideways, and the confidence of this classification is not high.
💡 SCENARIO & OPEN QUESTIONS — $MANA
⚠️ The biggest downside: the direction of the LONG order matches the side that is being paid (the LONG side). That means this side is more crowded—this is a risk to monitor. The sideways context with confidence 55 also still doesn’t provide a clear confirmation.
If the price closes below the stop-loss level shown in the signal card, the current LONG scenario is no longer valid.
Do you think short-side funding paying fees is a sign the crowd is betting on the wrong direction, or is it just a temporary state while the market is trading sideways?
This is educational technical analysis content, not investment advice. Cryptocurrency trading carries high risk—you could lose all your capital. Please do your own research and take responsibility for your decisions.
#Binance #Crypto #Futures
🚨 AI TRADE ALERT — $MANA
🟢 LONG
📌 Entry: 0.1033 – 0.1036
🛑 Stop Loss: 0.09609
🎯 Take Profit: 0.1256
⏰ Valid for: 6 hours (23:05 on 03/10 – 05:05 on 04/10, VN time)
↔️ SIDEWAYS — the market is moving sideways; the signal is fading (mean reversion)
$MANA is being monitored by Scanner Pro under the LONG scenario when the price holds the current range. The overall context is classified as sideways with a confidence of 55, and the 24h volume is about 101,833,670 in the quote asset.
📊 WHAT THE DATA IS SHOWING
The notable part is on the derivatives side: funding -0.0888%, meaning the SHORT side is paying fees to the LONG side — the crowd is leaning against the direction of the signal.
📊 The current price is at 41% within the 24h range; the 24h range is 19.2%. The 24h volume is about 101,833,670 in the quote asset, with a volume spike of 0.04x. The context is classified as sideways, and the confidence of this classification is not high.
💡 SCENARIO & OPEN QUESTIONS — $MANA
⚠️ The biggest downside: the direction of the LONG order matches the side that is being paid (the LONG side). That means this side is more crowded—this is a risk to monitor. The sideways context with confidence 55 also still doesn’t provide a clear confirmation.
If the price closes below the stop-loss level shown in the signal card, the current LONG scenario is no longer valid.
Do you think short-side funding paying fees is a sign the crowd is betting on the wrong direction, or is it just a temporary state while the market is trading sideways?
This is educational technical analysis content, not investment advice. Cryptocurrency trading carries high risk—you could lose all your capital. Please do your own research and take responsibility for your decisions.
#Binance #Crypto #Futures
7
LONG $WLD | Regime trend_up, nhưng momentum đã nóng — is it favorable or against?
🚨 AI TRADE ALERT — $WLD
🟢 LONG
📌 Entry: 0.6084 – 0.6102
🛑 Stop Loss: 0.5774
🎯 Take Profit: 0.7051
⏰ Valid for: 6 hours (23:00 on 03/10 – 05:00 on 04/10, VN time)
📈 UPTREND — LONG goes along with the uptrend
$WLD is being tracked by Scanner Pro for a LONG scenario when the price responds by holding above the range within the last 24 hours. The trend context is classified as trend_up; the classification confidence is 70; the 24h volume is about 554.207.698 in the quote asset; volume spike is 1.25x.
📊 WHAT’S GOING ON
Price is currently at 76% of the 24h range — i.e., the upper half of the trading zone, not the bottom. The context is classified as trend_up, and this is the only point that truly supports the LONG direction.
The 24h volume is about 554.207.698 in the quote asset, along with a volume spike of 1.25x. Funding is 0.0100% — not high, but read the section below carefully to see the issue.
⚠️ KEY RISKS TO KNOW BEFOREHAND — $WLD
🚫 Biggest downside: positive funding of 0.0100% means the LONG side is paying fees to the SHORT side. The crowd is leaning SAME-direction with this signal and is paying fees — that’s a disadvantage, not confirmation. Also, the 1h RSI at 65.01 indicates momentum is getting hot, not a supportive factor.
If the price closes below the stop-loss level on the signal card, the current LONG scenario is no longer valid.
You think this 76% area of the range will hold, or does it need a deeper retest?
This is educational technical analysis content, not investment advice. Crypto trading carries high risk; you may lose all your capital. Do your own research and take responsibility for your decisions.
#Binance #Crypto #Futures
LONG $WLD | Regime trend_up, nhưng momentum đã nóng — is it favorable or against?
🚨 AI TRADE ALERT — $WLD
🟢 LONG
📌 Entry: 0.6084 – 0.6102
🛑 Stop Loss: 0.5774
🎯 Take Profit: 0.7051
⏰ Valid for: 6 hours (23:00 on 03/10 – 05:00 on 04/10, VN time)
📈 UPTREND — LONG goes along with the uptrend
$WLD is being tracked by Scanner Pro for a LONG scenario when the price responds by holding above the range within the last 24 hours. The trend context is classified as trend_up; the classification confidence is 70; the 24h volume is about 554.207.698 in the quote asset; volume spike is 1.25x.
📊 WHAT’S GOING ON
Price is currently at 76% of the 24h range — i.e., the upper half of the trading zone, not the bottom. The context is classified as trend_up, and this is the only point that truly supports the LONG direction.
The 24h volume is about 554.207.698 in the quote asset, along with a volume spike of 1.25x. Funding is 0.0100% — not high, but read the section below carefully to see the issue.
⚠️ KEY RISKS TO KNOW BEFOREHAND — $WLD
🚫 Biggest downside: positive funding of 0.0100% means the LONG side is paying fees to the SHORT side. The crowd is leaning SAME-direction with this signal and is paying fees — that’s a disadvantage, not confirmation. Also, the 1h RSI at 65.01 indicates momentum is getting hot, not a supportive factor.
If the price closes below the stop-loss level on the signal card, the current LONG scenario is no longer valid.
You think this 76% area of the range will hold, or does it need a deeper retest?
This is educational technical analysis content, not investment advice. Crypto trading carries high risk; you may lose all your capital. Do your own research and take responsibility for your decisions.
#Binance #Crypto #Futures
🚨 AI TRADE ALERT — $WLD
🟢 LONG
📌 Entry: 0.6084 – 0.6102
🛑 Stop Loss: 0.5774
🎯 Take Profit: 0.7051
⏰ Valid for: 6 hours (23:00 on 03/10 – 05:00 on 04/10, VN time)
📈 UPTREND — LONG goes along with the uptrend
$WLD is being tracked by Scanner Pro for a LONG scenario when the price responds by holding above the range within the last 24 hours. The trend context is classified as trend_up; the classification confidence is 70; the 24h volume is about 554.207.698 in the quote asset; volume spike is 1.25x.
📊 WHAT’S GOING ON
Price is currently at 76% of the 24h range — i.e., the upper half of the trading zone, not the bottom. The context is classified as trend_up, and this is the only point that truly supports the LONG direction.
The 24h volume is about 554.207.698 in the quote asset, along with a volume spike of 1.25x. Funding is 0.0100% — not high, but read the section below carefully to see the issue.
⚠️ KEY RISKS TO KNOW BEFOREHAND — $WLD
🚫 Biggest downside: positive funding of 0.0100% means the LONG side is paying fees to the SHORT side. The crowd is leaning SAME-direction with this signal and is paying fees — that’s a disadvantage, not confirmation. Also, the 1h RSI at 65.01 indicates momentum is getting hot, not a supportive factor.
If the price closes below the stop-loss level on the signal card, the current LONG scenario is no longer valid.
You think this 76% area of the range will hold, or does it need a deeper retest?
This is educational technical analysis content, not investment advice. Crypto trading carries high risk; you may lose all your capital. Do your own research and take responsibility for your decisions.
#Binance #Crypto #Futures
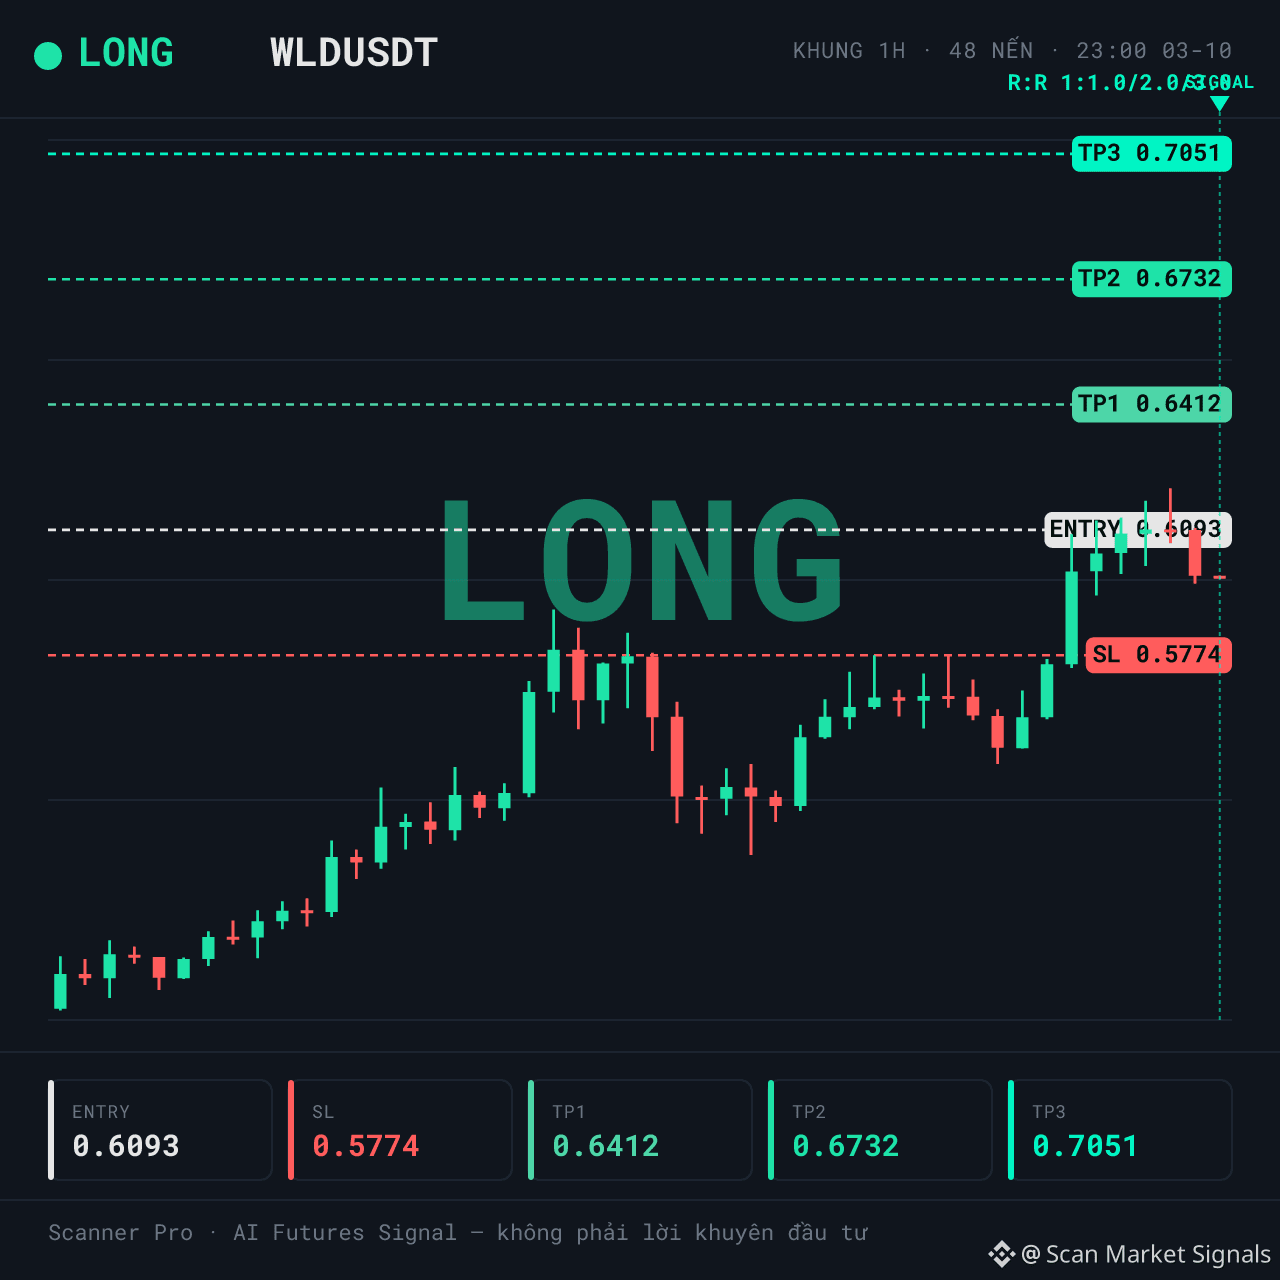
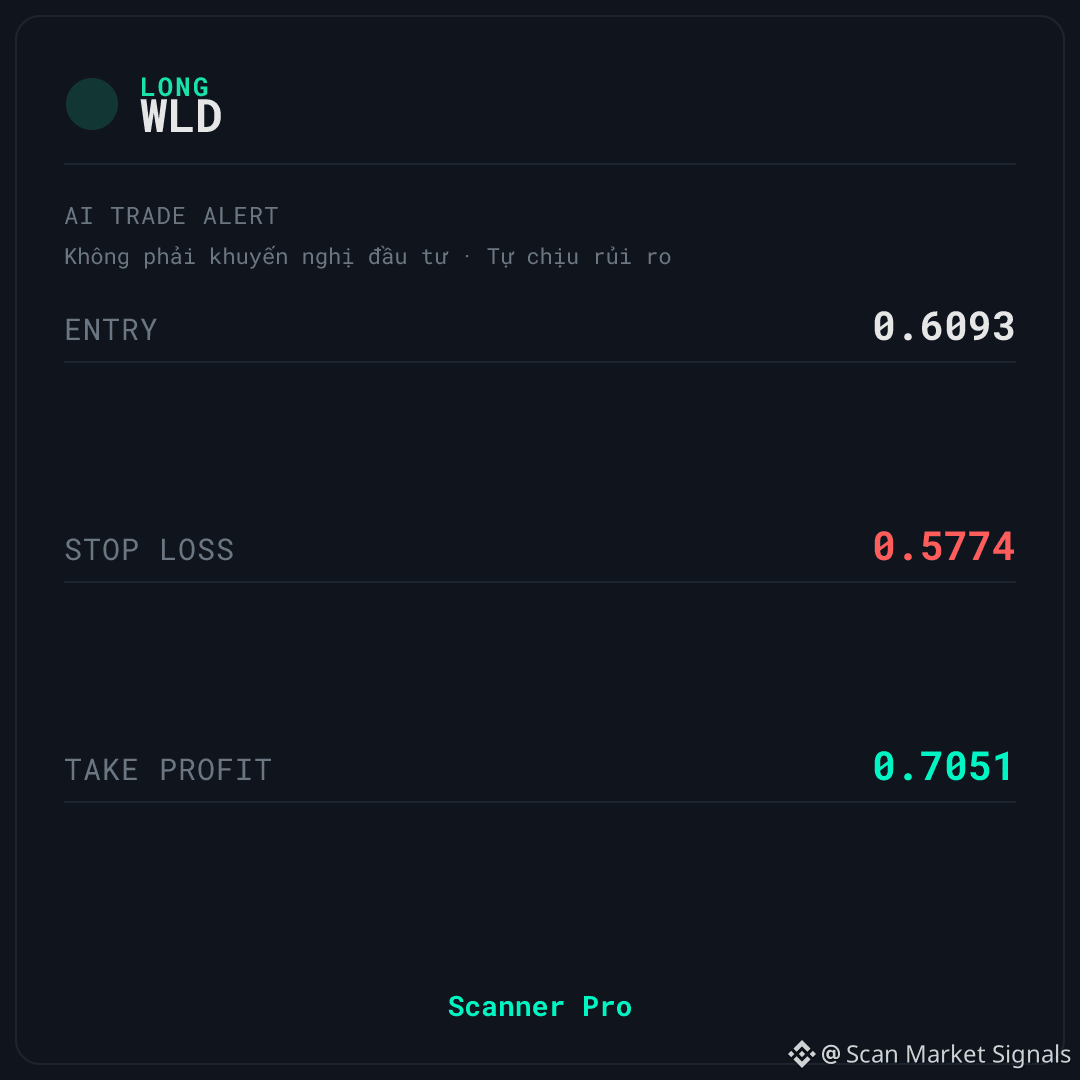
24
LONG $QNT | Volume spike 0.69x — what is the money flow really saying?
🚨 AI TRADE ALERT — $QNT
🟢 LONG
📌 Entry: 253.9485 – 254.7115
🛑 Stop Loss: 237.7747
🎯 Take Profit: 303.9959
⏰ Valid for: 6 hours (21:40 on 03/10 – 03:40 on 04/10, VN time)
↔️ SIDEWAY — the market is moving sideways; the signal is fading (mean reversion)
$QNT is being tracked by Scanner Pro under the LONG scenario when price reacts around the entry zone on the 1h timeframe. With a sideway backdrop, a 0.69x volume spike, and negative funding, the story is not decided yet.
📊 CONTEXT & DATA
24h volume is about 491,149,351 (in quote asset). Volume spike is 0.69x — the money flow shows signs of returning, but it hasn’t exploded yet. Funding -0.1212%: the SHORT side is paying fees to the LONG side, meaning the crowd is leaning toward the opposite of this signal.
Price is at 56% of the 24h range—middle zone, not too high and not too low. The context is categorized as sideway, which suits accumulation more than chasing price.
🚫 INVALIDATION & RISK MANAGEMENT — $QNT
The biggest downside: the confidence level of the context classification is only 55—too low to confirm a clear trend, so the current LONG scenario is easily disturbed by two-way sweep moves.
If price closes below the stop-loss level in the signal card, the current LONG scenario is no longer valid.
In your opinion, is this 0.69x volume spike a sign of real money flowing in—or just a technical bounce?
This is technical analysis content for educational purposes only, not investment advice. Cryptocurrency trading is highly risky, and you may lose all your capital. Please do your own research and take responsibility for your decisions.
#Binance #Crypto #Futures
LONG $QNT | Volume spike 0.69x — what is the money flow really saying?
🚨 AI TRADE ALERT — $QNT
🟢 LONG
📌 Entry: 253.9485 – 254.7115
🛑 Stop Loss: 237.7747
🎯 Take Profit: 303.9959
⏰ Valid for: 6 hours (21:40 on 03/10 – 03:40 on 04/10, VN time)
↔️ SIDEWAY — the market is moving sideways; the signal is fading (mean reversion)
$QNT is being tracked by Scanner Pro under the LONG scenario when price reacts around the entry zone on the 1h timeframe. With a sideway backdrop, a 0.69x volume spike, and negative funding, the story is not decided yet.
📊 CONTEXT & DATA
24h volume is about 491,149,351 (in quote asset). Volume spike is 0.69x — the money flow shows signs of returning, but it hasn’t exploded yet. Funding -0.1212%: the SHORT side is paying fees to the LONG side, meaning the crowd is leaning toward the opposite of this signal.
Price is at 56% of the 24h range—middle zone, not too high and not too low. The context is categorized as sideway, which suits accumulation more than chasing price.
🚫 INVALIDATION & RISK MANAGEMENT — $QNT
The biggest downside: the confidence level of the context classification is only 55—too low to confirm a clear trend, so the current LONG scenario is easily disturbed by two-way sweep moves.
If price closes below the stop-loss level in the signal card, the current LONG scenario is no longer valid.
In your opinion, is this 0.69x volume spike a sign of real money flowing in—or just a technical bounce?
This is technical analysis content for educational purposes only, not investment advice. Cryptocurrency trading is highly risky, and you may lose all your capital. Please do your own research and take responsibility for your decisions.
#Binance #Crypto #Futures
🚨 AI TRADE ALERT — $QNT
🟢 LONG
📌 Entry: 253.9485 – 254.7115
🛑 Stop Loss: 237.7747
🎯 Take Profit: 303.9959
⏰ Valid for: 6 hours (21:40 on 03/10 – 03:40 on 04/10, VN time)
↔️ SIDEWAY — the market is moving sideways; the signal is fading (mean reversion)
$QNT is being tracked by Scanner Pro under the LONG scenario when price reacts around the entry zone on the 1h timeframe. With a sideway backdrop, a 0.69x volume spike, and negative funding, the story is not decided yet.
📊 CONTEXT & DATA
24h volume is about 491,149,351 (in quote asset). Volume spike is 0.69x — the money flow shows signs of returning, but it hasn’t exploded yet. Funding -0.1212%: the SHORT side is paying fees to the LONG side, meaning the crowd is leaning toward the opposite of this signal.
Price is at 56% of the 24h range—middle zone, not too high and not too low. The context is categorized as sideway, which suits accumulation more than chasing price.
🚫 INVALIDATION & RISK MANAGEMENT — $QNT
The biggest downside: the confidence level of the context classification is only 55—too low to confirm a clear trend, so the current LONG scenario is easily disturbed by two-way sweep moves.
If price closes below the stop-loss level in the signal card, the current LONG scenario is no longer valid.
In your opinion, is this 0.69x volume spike a sign of real money flowing in—or just a technical bounce?
This is technical analysis content for educational purposes only, not investment advice. Cryptocurrency trading is highly risky, and you may lose all your capital. Please do your own research and take responsibility for your decisions.
#Binance #Crypto #Futures
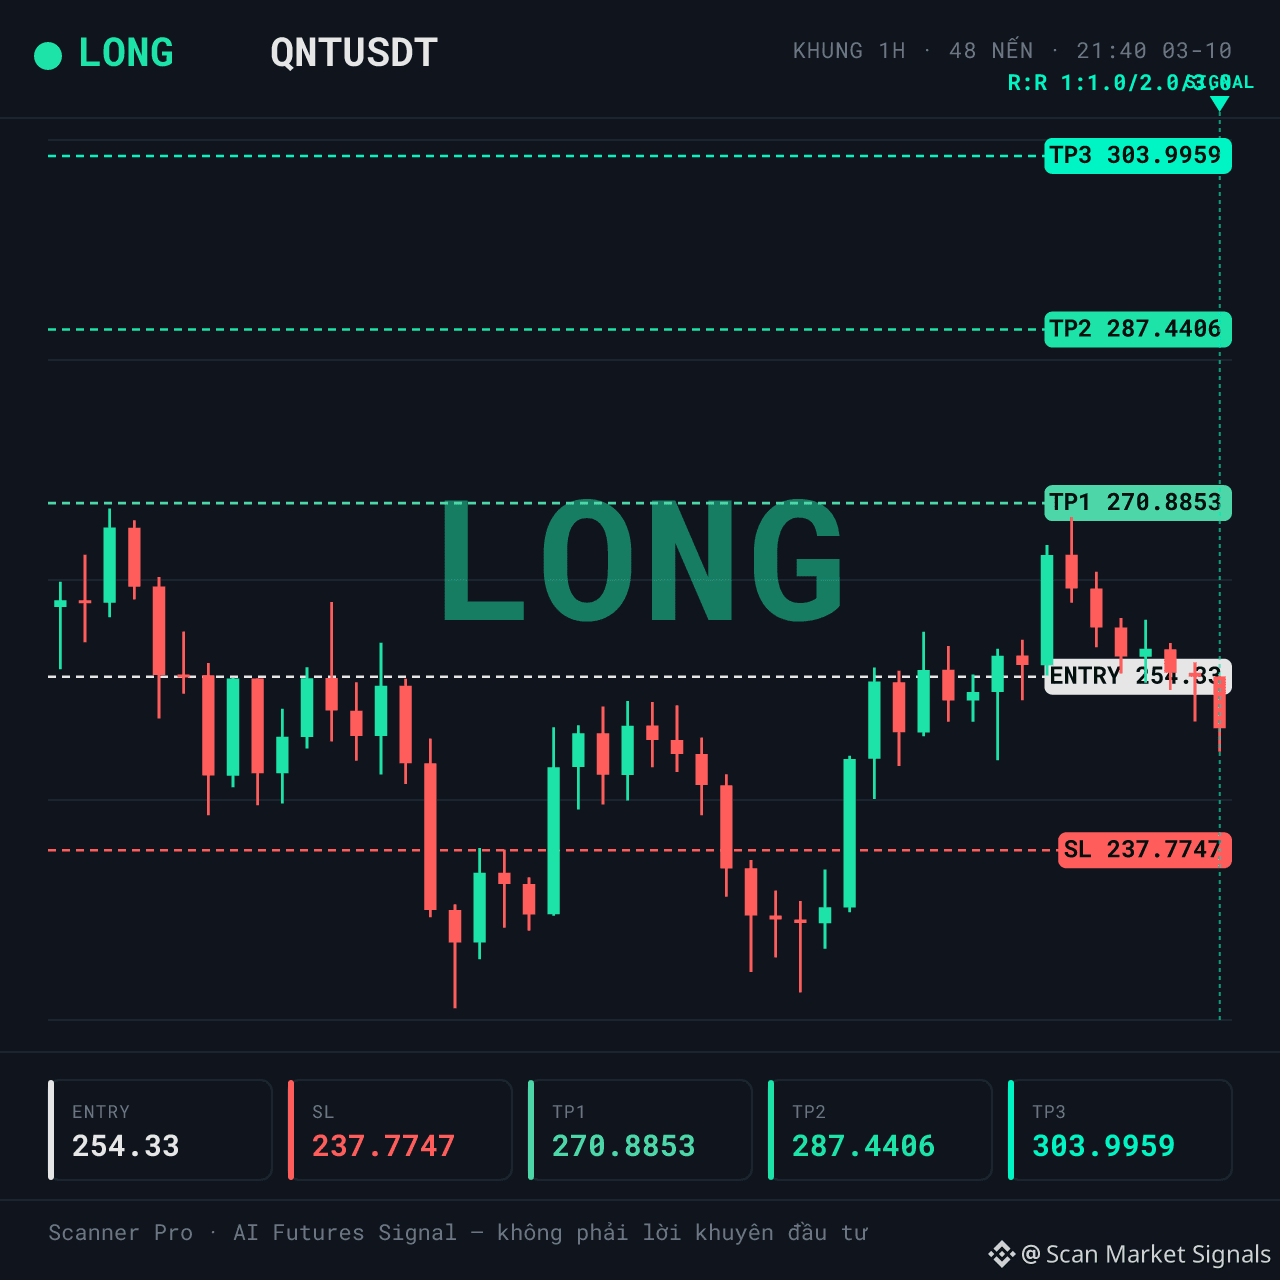
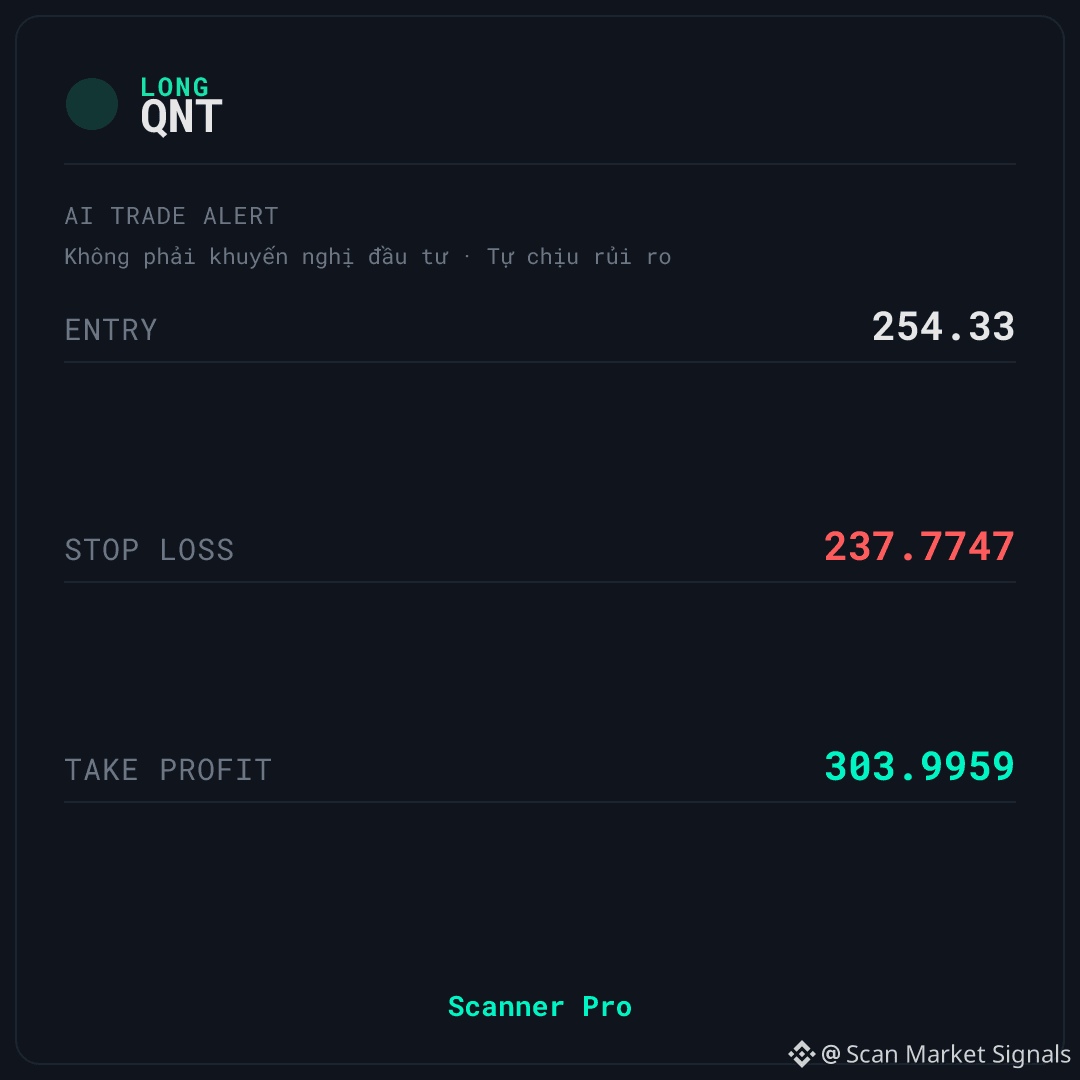
16
SHORT $SCR | A crowd leans long, but funding is only half the story
🚨 AI TRADE ALERT — $SCR
🔴 SHORT
📌 Entry: 0.02574 – 0.02582
🛑 Stop Loss: 0.02782
🎯 Take Profit: 0.01967
⏰ Duration: 6 hours (21:35 on 03/10 – 03:35 on 04/10, VN time)
↔️ SIDEWAY — the market is moving sideways; the signal is fading (mean reversion)
$SCR is being tracked by Scanner Pro under a SHORT scenario after a sell-off within the session. The context is classified as ranging (sideways) with a classification confidence of 55; the 24h volume is about 20,531,661 in the quote asset, with a volume spike of 0.20x.
📊 WHAT DATA IS SHOWING
The point most likely to make this scenario wrong is in the very part that looks favorable: funding 0.0050%, meaning the LONG side is paying the SHORT side, so the market leans long. The crowd is leaning opposite to the signal—this supports the SHORT direction, but it’s also an area where a reversal move is likely when the crowded side gets squeezed.
On the other hand, the price is 3% within the 24h range—near the bottom of the swing—and the decline during the session is -5.6%. The context is classified as sideways, which fits a fade setup better than chasing price.
💡 SCENARIO & OPEN QUESTION — $SCR
⚠️ Biggest risk: the SHORT direction is aligned with the side that is receiving funding—there are more on the SHORT side. This is something to watch, because fee pressure can flip direction quickly.
🚫 If price closes above the stop-loss level on the signal tag, the current SHORT scenario is no longer valid.
What do you think—does this mean the market is already weak, or is it just a retest before a bounce?
This is educational technical analysis content, not investment advice. Cryptocurrency trading carries a high level of risk; you may lose all of your capital. Do your own research and be responsible for your decisions.
#Binance #Crypto #Futures
SHORT $SCR | A crowd leans long, but funding is only half the story
🚨 AI TRADE ALERT — $SCR
🔴 SHORT
📌 Entry: 0.02574 – 0.02582
🛑 Stop Loss: 0.02782
🎯 Take Profit: 0.01967
⏰ Duration: 6 hours (21:35 on 03/10 – 03:35 on 04/10, VN time)
↔️ SIDEWAY — the market is moving sideways; the signal is fading (mean reversion)
$SCR is being tracked by Scanner Pro under a SHORT scenario after a sell-off within the session. The context is classified as ranging (sideways) with a classification confidence of 55; the 24h volume is about 20,531,661 in the quote asset, with a volume spike of 0.20x.
📊 WHAT DATA IS SHOWING
The point most likely to make this scenario wrong is in the very part that looks favorable: funding 0.0050%, meaning the LONG side is paying the SHORT side, so the market leans long. The crowd is leaning opposite to the signal—this supports the SHORT direction, but it’s also an area where a reversal move is likely when the crowded side gets squeezed.
On the other hand, the price is 3% within the 24h range—near the bottom of the swing—and the decline during the session is -5.6%. The context is classified as sideways, which fits a fade setup better than chasing price.
💡 SCENARIO & OPEN QUESTION — $SCR
⚠️ Biggest risk: the SHORT direction is aligned with the side that is receiving funding—there are more on the SHORT side. This is something to watch, because fee pressure can flip direction quickly.
🚫 If price closes above the stop-loss level on the signal tag, the current SHORT scenario is no longer valid.
What do you think—does this mean the market is already weak, or is it just a retest before a bounce?
This is educational technical analysis content, not investment advice. Cryptocurrency trading carries a high level of risk; you may lose all of your capital. Do your own research and be responsible for your decisions.
#Binance #Crypto #Futures
🚨 AI TRADE ALERT — $SCR
🔴 SHORT
📌 Entry: 0.02574 – 0.02582
🛑 Stop Loss: 0.02782
🎯 Take Profit: 0.01967
⏰ Duration: 6 hours (21:35 on 03/10 – 03:35 on 04/10, VN time)
↔️ SIDEWAY — the market is moving sideways; the signal is fading (mean reversion)
$SCR is being tracked by Scanner Pro under a SHORT scenario after a sell-off within the session. The context is classified as ranging (sideways) with a classification confidence of 55; the 24h volume is about 20,531,661 in the quote asset, with a volume spike of 0.20x.
📊 WHAT DATA IS SHOWING
The point most likely to make this scenario wrong is in the very part that looks favorable: funding 0.0050%, meaning the LONG side is paying the SHORT side, so the market leans long. The crowd is leaning opposite to the signal—this supports the SHORT direction, but it’s also an area where a reversal move is likely when the crowded side gets squeezed.
On the other hand, the price is 3% within the 24h range—near the bottom of the swing—and the decline during the session is -5.6%. The context is classified as sideways, which fits a fade setup better than chasing price.
💡 SCENARIO & OPEN QUESTION — $SCR
⚠️ Biggest risk: the SHORT direction is aligned with the side that is receiving funding—there are more on the SHORT side. This is something to watch, because fee pressure can flip direction quickly.
🚫 If price closes above the stop-loss level on the signal tag, the current SHORT scenario is no longer valid.
What do you think—does this mean the market is already weak, or is it just a retest before a bounce?
This is educational technical analysis content, not investment advice. Cryptocurrency trading carries a high level of risk; you may lose all of your capital. Do your own research and be responsible for your decisions.
#Binance #Crypto #Futures
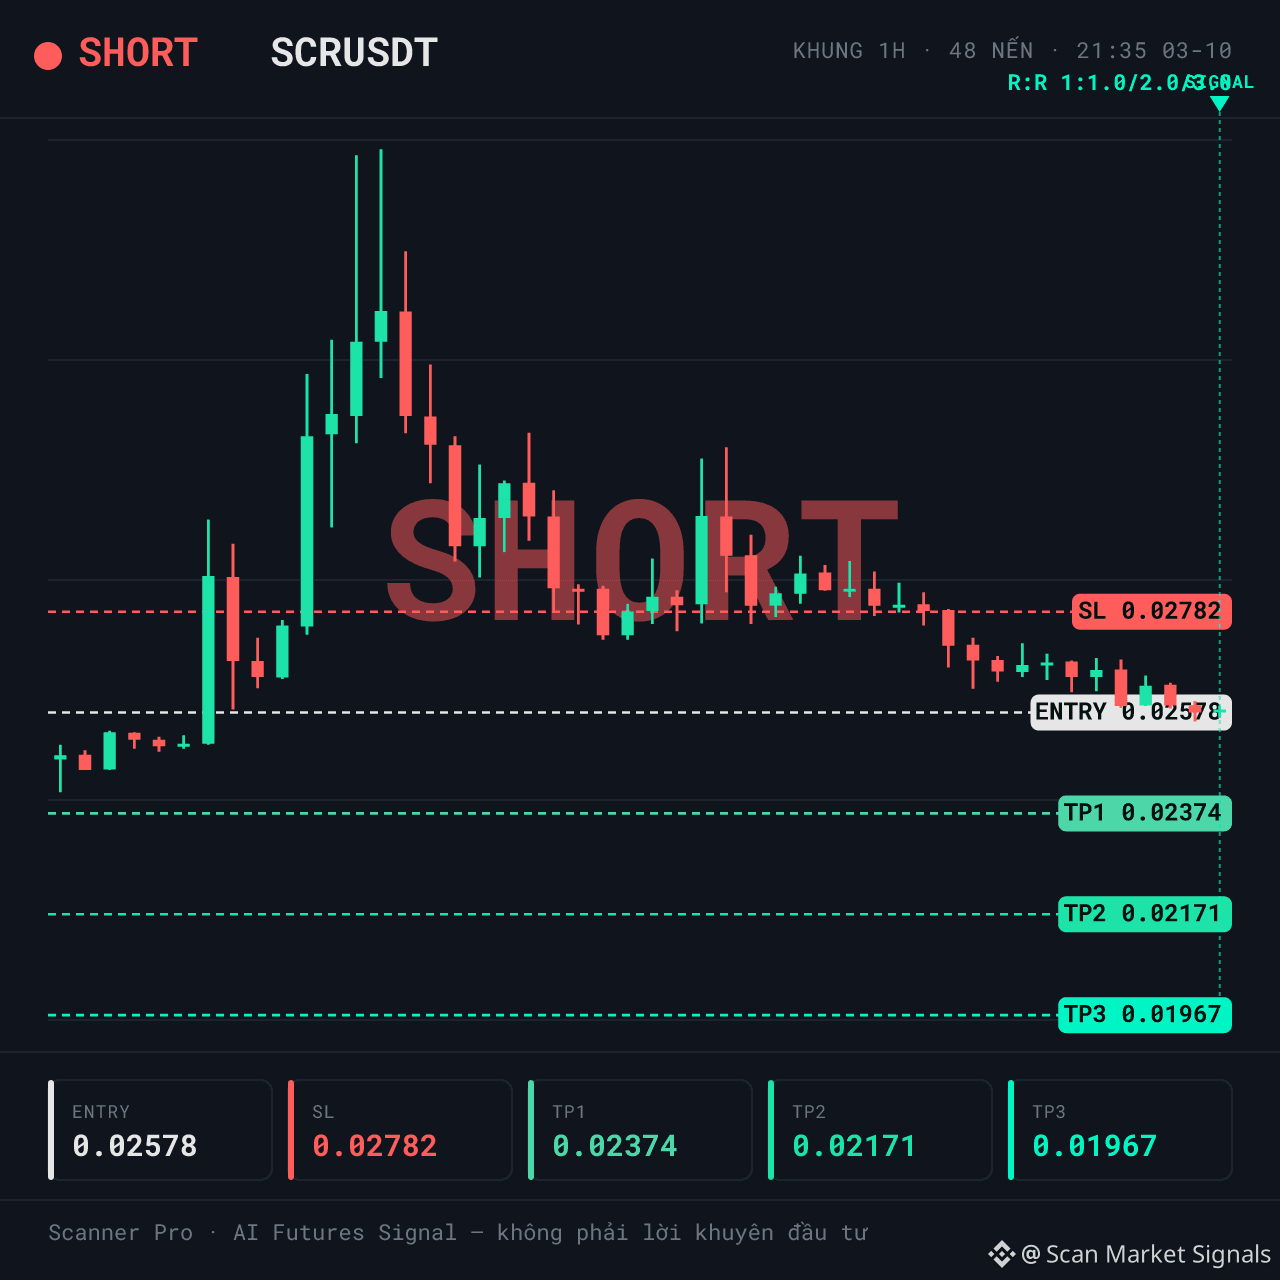
2
LONG $ENJ | Funding short: the side paying fees to the long side
🚨 AI TRADE ALERT — $ENJ
🟢 LONG
📌 Entry: 0.03369 – 0.03379
🛑 Stop Loss: 0.03099
🎯 Take Profit: 0.042
⏰ Valid for: 6 hours (20:45 on 03/10 – 02:45 on 04/10, VN time)
↔️ SIDEWAY — the market is moving sideways; the signal is fading (mean-reversion)
$ENJ is being tracked by Scanner Pro under a LONG scenario when price holds structure around the support zone. The backdrop is classified as sideways, with classification confidence at 55.
📊 WHAT THE DATA IS SHOWING
The funding rate is a periodic fee that one side pays to the other to maintain positions. Here funding is -0.1507%, meaning the SHORT side is paying fees to the LONG side — the market is tilted short, i.e., the crowd is betting in the opposite direction of what this signal indicates.
The 24h volume is about 86,134,287 (in quote asset terms), with a volume spike of 0.28x. The current price is at 31% within the 24h range, meaning it has not been pushed up toward the high end.
💡 SCENARIO & OPEN QUESTION — $ENJ
⚠️ The biggest downside: the LONG direction of the signal aligns with the side that is paying fees (the LONG side), meaning that side is more crowded — this is a risk to monitor. Also, the confidence of the background classification is only 55, which is not high.
🚫 If price closes below the stop-loss level in the signal card, the current LONG scenario is no longer valid.
What do you think: is the crowd leaning short while price has not left the low area a real reversal signal, or just a continuation accumulation move?
This is educational technical analysis content, not investment advice. Crypto trading carries high risk; you may lose all your capital. Please do your own research and take responsibility for your decisions.
#Binance #Crypto #Futures
LONG $ENJ | Funding short: the side paying fees to the long side
🚨 AI TRADE ALERT — $ENJ
🟢 LONG
📌 Entry: 0.03369 – 0.03379
🛑 Stop Loss: 0.03099
🎯 Take Profit: 0.042
⏰ Valid for: 6 hours (20:45 on 03/10 – 02:45 on 04/10, VN time)
↔️ SIDEWAY — the market is moving sideways; the signal is fading (mean-reversion)
$ENJ is being tracked by Scanner Pro under a LONG scenario when price holds structure around the support zone. The backdrop is classified as sideways, with classification confidence at 55.
📊 WHAT THE DATA IS SHOWING
The funding rate is a periodic fee that one side pays to the other to maintain positions. Here funding is -0.1507%, meaning the SHORT side is paying fees to the LONG side — the market is tilted short, i.e., the crowd is betting in the opposite direction of what this signal indicates.
The 24h volume is about 86,134,287 (in quote asset terms), with a volume spike of 0.28x. The current price is at 31% within the 24h range, meaning it has not been pushed up toward the high end.
💡 SCENARIO & OPEN QUESTION — $ENJ
⚠️ The biggest downside: the LONG direction of the signal aligns with the side that is paying fees (the LONG side), meaning that side is more crowded — this is a risk to monitor. Also, the confidence of the background classification is only 55, which is not high.
🚫 If price closes below the stop-loss level in the signal card, the current LONG scenario is no longer valid.
What do you think: is the crowd leaning short while price has not left the low area a real reversal signal, or just a continuation accumulation move?
This is educational technical analysis content, not investment advice. Crypto trading carries high risk; you may lose all your capital. Please do your own research and take responsibility for your decisions.
#Binance #Crypto #Futures
🚨 AI TRADE ALERT — $ENJ
🟢 LONG
📌 Entry: 0.03369 – 0.03379
🛑 Stop Loss: 0.03099
🎯 Take Profit: 0.042
⏰ Valid for: 6 hours (20:45 on 03/10 – 02:45 on 04/10, VN time)
↔️ SIDEWAY — the market is moving sideways; the signal is fading (mean-reversion)
$ENJ is being tracked by Scanner Pro under a LONG scenario when price holds structure around the support zone. The backdrop is classified as sideways, with classification confidence at 55.
📊 WHAT THE DATA IS SHOWING
The funding rate is a periodic fee that one side pays to the other to maintain positions. Here funding is -0.1507%, meaning the SHORT side is paying fees to the LONG side — the market is tilted short, i.e., the crowd is betting in the opposite direction of what this signal indicates.
The 24h volume is about 86,134,287 (in quote asset terms), with a volume spike of 0.28x. The current price is at 31% within the 24h range, meaning it has not been pushed up toward the high end.
💡 SCENARIO & OPEN QUESTION — $ENJ
⚠️ The biggest downside: the LONG direction of the signal aligns with the side that is paying fees (the LONG side), meaning that side is more crowded — this is a risk to monitor. Also, the confidence of the background classification is only 55, which is not high.
🚫 If price closes below the stop-loss level in the signal card, the current LONG scenario is no longer valid.
What do you think: is the crowd leaning short while price has not left the low area a real reversal signal, or just a continuation accumulation move?
This is educational technical analysis content, not investment advice. Crypto trading carries high risk; you may lose all your capital. Please do your own research and take responsibility for your decisions.
#Binance #Crypto #Futures
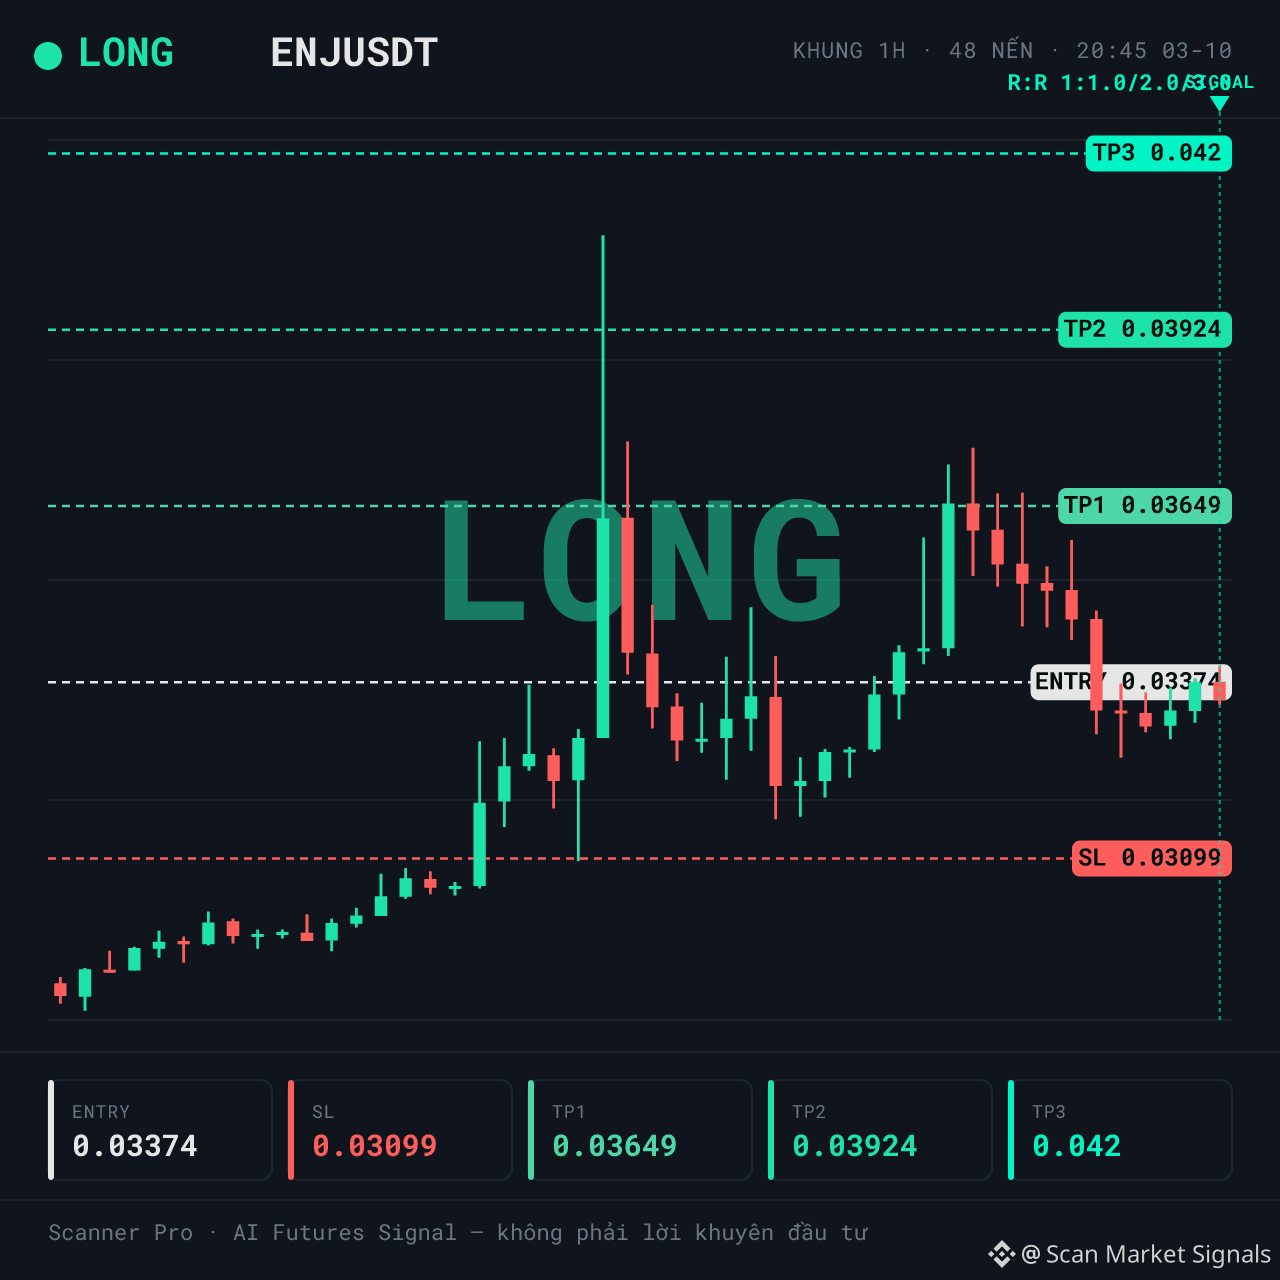
6
SHORT $CAP | Thick liquidity but price sits in the middle of the range
🚨 AI TRADE ALERT — $CAP
🔴 SHORT
📌 Entry: 0.07098 – 0.0712
🛑 Stop Loss: 0.07693
🎯 Take Profit: 0.05357
⏰ Validity: 6 hours (17:10 – 23:10 VN) - Date: 03/10
↔️ SIDEWAY — the market is moving sideways; signals are fading (mean-reversion)
$CAP is being monitored by Scanner Pro for a SHORT scenario when price holds within the 24h range. The 24h volume is about 49,178,258 (by quote asset). The volume spike is only 0.04x — there is liquidity, but no clear burst of money flow yet.
📊 WHY IT’S WORTH PAYING ATTENTION
Funding 0.0050%: the LONG side is paying fees to the SHORT side, meaning the crowd is leaning opposite to the direction of this order. That supports the SHORT scenario, not a certain confirmation.
The price position within the 24h range is only 48% — it’s in the middle, not an extreme zone. The context is classified as sideway, with a classification confidence of 55 — not high, so don’t treat it like an already-established trend.
⚠️ SETUP & RISK — $CAP
🚫 Biggest downside: price is in the middle of the 24h range, with no positional advantage for either side. 1h momentum is 46.6 — the market is already weak, not a great reversal signal.
If price closes above the stop-loss level on the signal card, the current SHORT scenario is no longer valid.
💡 Do you think this is a technical retracement to sell further, or a sign that the buying side is regaining control?
This is educational technical analysis content, not investment advice. Crypto trading carries high risk; you may lose all your capital. Do your own research and be responsible for your decisions.
#Binance #Crypto #Futures
SHORT $CAP | Thick liquidity but price sits in the middle of the range
🚨 AI TRADE ALERT — $CAP
🔴 SHORT
📌 Entry: 0.07098 – 0.0712
🛑 Stop Loss: 0.07693
🎯 Take Profit: 0.05357
⏰ Validity: 6 hours (17:10 – 23:10 VN) - Date: 03/10
↔️ SIDEWAY — the market is moving sideways; signals are fading (mean-reversion)
$CAP is being monitored by Scanner Pro for a SHORT scenario when price holds within the 24h range. The 24h volume is about 49,178,258 (by quote asset). The volume spike is only 0.04x — there is liquidity, but no clear burst of money flow yet.
📊 WHY IT’S WORTH PAYING ATTENTION
Funding 0.0050%: the LONG side is paying fees to the SHORT side, meaning the crowd is leaning opposite to the direction of this order. That supports the SHORT scenario, not a certain confirmation.
The price position within the 24h range is only 48% — it’s in the middle, not an extreme zone. The context is classified as sideway, with a classification confidence of 55 — not high, so don’t treat it like an already-established trend.
⚠️ SETUP & RISK — $CAP
🚫 Biggest downside: price is in the middle of the 24h range, with no positional advantage for either side. 1h momentum is 46.6 — the market is already weak, not a great reversal signal.
If price closes above the stop-loss level on the signal card, the current SHORT scenario is no longer valid.
💡 Do you think this is a technical retracement to sell further, or a sign that the buying side is regaining control?
This is educational technical analysis content, not investment advice. Crypto trading carries high risk; you may lose all your capital. Do your own research and be responsible for your decisions.
#Binance #Crypto #Futures
🚨 AI TRADE ALERT — $CAP
🔴 SHORT
📌 Entry: 0.07098 – 0.0712
🛑 Stop Loss: 0.07693
🎯 Take Profit: 0.05357
⏰ Validity: 6 hours (17:10 – 23:10 VN) - Date: 03/10
↔️ SIDEWAY — the market is moving sideways; signals are fading (mean-reversion)
$CAP is being monitored by Scanner Pro for a SHORT scenario when price holds within the 24h range. The 24h volume is about 49,178,258 (by quote asset). The volume spike is only 0.04x — there is liquidity, but no clear burst of money flow yet.
📊 WHY IT’S WORTH PAYING ATTENTION
Funding 0.0050%: the LONG side is paying fees to the SHORT side, meaning the crowd is leaning opposite to the direction of this order. That supports the SHORT scenario, not a certain confirmation.
The price position within the 24h range is only 48% — it’s in the middle, not an extreme zone. The context is classified as sideway, with a classification confidence of 55 — not high, so don’t treat it like an already-established trend.
⚠️ SETUP & RISK — $CAP
🚫 Biggest downside: price is in the middle of the 24h range, with no positional advantage for either side. 1h momentum is 46.6 — the market is already weak, not a great reversal signal.
If price closes above the stop-loss level on the signal card, the current SHORT scenario is no longer valid.
💡 Do you think this is a technical retracement to sell further, or a sign that the buying side is regaining control?
This is educational technical analysis content, not investment advice. Crypto trading carries high risk; you may lose all your capital. Do your own research and be responsible for your decisions.
#Binance #Crypto #Futures
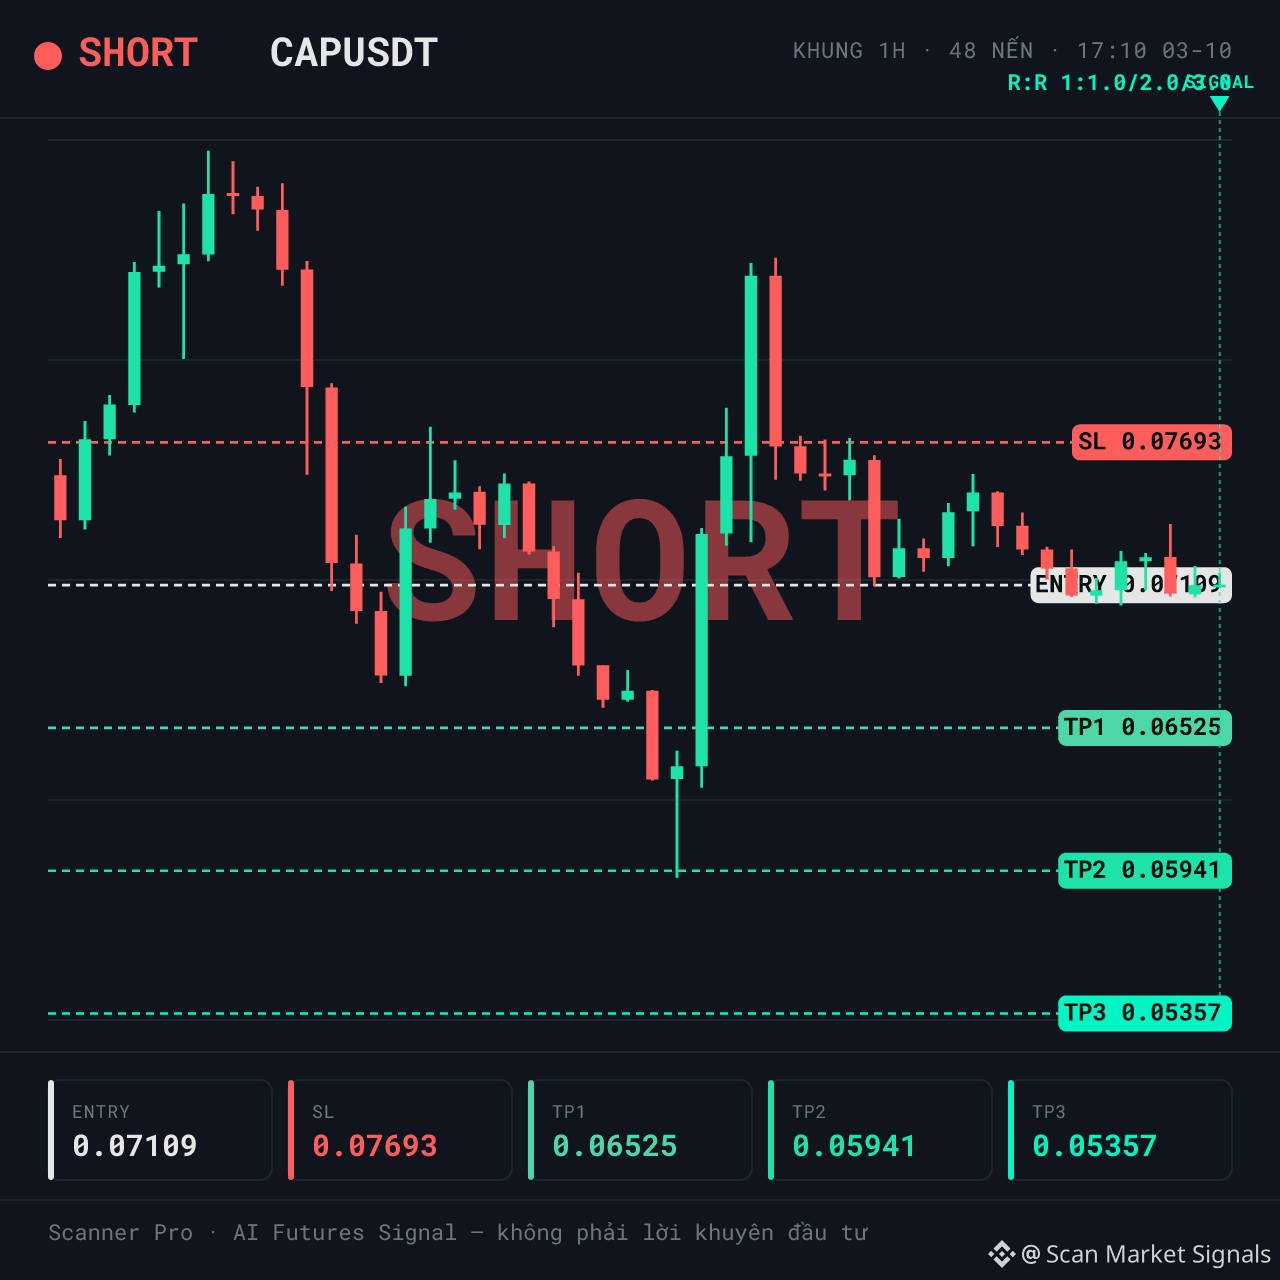
7
LONG $GALA | Regime trend_up is supported, but the crowd leaning in the same direction is paying fees
🚨 AI TRADE ALERT — $GALA
🟢 LONG
📌 Entry: 0.002658 – 0.002666
🛑 Stop Loss: 0.002474
🎯 Take Profit: 0.003227
⏰ Validity: 6 hours (13:25 – 19:25 VN) - Date: 03/10
📈 UPTREND — LONG follows the uptrend
$GALA is being tracked by Scanner Pro according to the LONG scenario when the price structure keeps the uptrend on the 1h timeframe. The context is classified as trend_up with 70% confidence; 24h volume is about 115.223.181 in the quote asset; volume spike is 0.36x.
📊 WHAT IS HAPPENING
Price is at 73% of the 24h range, with 24h volatility of 16.0% — the structure is leaning bullish. Regime trend_up with 70% confidence; reasons: 4h momentum 69.8 (>60) + 24h change level 12.9% + price position at 73% of the range.
24h volume is about 115.223.181 in the quote asset; volume spike 0.36x. Funding 0.0001% — the LONG side is paying fees to the SHORT side.
⚠️ RISKS TO KNOW BEFORE — $GALA
🚫 The crowd is leaning in the SAME direction with LONG signals, and that same side is paying fees — this is a disadvantage point that needs to be monitored. 1h momentum is 58.1, not yet in the overbought zone but has warmed up significantly; it’s no longer a clear support point.
If the price closes below the stop-loss level on the signal card, the current LONG scenario is no longer valid.
In your opinion, is this a correction within the uptrend or a sign that the crowd is getting stuck in the high zone?
This is educational technical analysis content, not investment advice. Crypto trading has high risk; you may lose all your capital. Do your own research and take responsibility for your decisions.
#Binance #Crypto #Futures
LONG $GALA | Regime trend_up is supported, but the crowd leaning in the same direction is paying fees
🚨 AI TRADE ALERT — $GALA
🟢 LONG
📌 Entry: 0.002658 – 0.002666
🛑 Stop Loss: 0.002474
🎯 Take Profit: 0.003227
⏰ Validity: 6 hours (13:25 – 19:25 VN) - Date: 03/10
📈 UPTREND — LONG follows the uptrend
$GALA is being tracked by Scanner Pro according to the LONG scenario when the price structure keeps the uptrend on the 1h timeframe. The context is classified as trend_up with 70% confidence; 24h volume is about 115.223.181 in the quote asset; volume spike is 0.36x.
📊 WHAT IS HAPPENING
Price is at 73% of the 24h range, with 24h volatility of 16.0% — the structure is leaning bullish. Regime trend_up with 70% confidence; reasons: 4h momentum 69.8 (>60) + 24h change level 12.9% + price position at 73% of the range.
24h volume is about 115.223.181 in the quote asset; volume spike 0.36x. Funding 0.0001% — the LONG side is paying fees to the SHORT side.
⚠️ RISKS TO KNOW BEFORE — $GALA
🚫 The crowd is leaning in the SAME direction with LONG signals, and that same side is paying fees — this is a disadvantage point that needs to be monitored. 1h momentum is 58.1, not yet in the overbought zone but has warmed up significantly; it’s no longer a clear support point.
If the price closes below the stop-loss level on the signal card, the current LONG scenario is no longer valid.
In your opinion, is this a correction within the uptrend or a sign that the crowd is getting stuck in the high zone?
This is educational technical analysis content, not investment advice. Crypto trading has high risk; you may lose all your capital. Do your own research and take responsibility for your decisions.
#Binance #Crypto #Futures
🚨 AI TRADE ALERT — $GALA
🟢 LONG
📌 Entry: 0.002658 – 0.002666
🛑 Stop Loss: 0.002474
🎯 Take Profit: 0.003227
⏰ Validity: 6 hours (13:25 – 19:25 VN) - Date: 03/10
📈 UPTREND — LONG follows the uptrend
$GALA is being tracked by Scanner Pro according to the LONG scenario when the price structure keeps the uptrend on the 1h timeframe. The context is classified as trend_up with 70% confidence; 24h volume is about 115.223.181 in the quote asset; volume spike is 0.36x.
📊 WHAT IS HAPPENING
Price is at 73% of the 24h range, with 24h volatility of 16.0% — the structure is leaning bullish. Regime trend_up with 70% confidence; reasons: 4h momentum 69.8 (>60) + 24h change level 12.9% + price position at 73% of the range.
24h volume is about 115.223.181 in the quote asset; volume spike 0.36x. Funding 0.0001% — the LONG side is paying fees to the SHORT side.
⚠️ RISKS TO KNOW BEFORE — $GALA
🚫 The crowd is leaning in the SAME direction with LONG signals, and that same side is paying fees — this is a disadvantage point that needs to be monitored. 1h momentum is 58.1, not yet in the overbought zone but has warmed up significantly; it’s no longer a clear support point.
If the price closes below the stop-loss level on the signal card, the current LONG scenario is no longer valid.
In your opinion, is this a correction within the uptrend or a sign that the crowd is getting stuck in the high zone?
This is educational technical analysis content, not investment advice. Crypto trading has high risk; you may lose all your capital. Do your own research and take responsibility for your decisions.
#Binance #Crypto #Futures
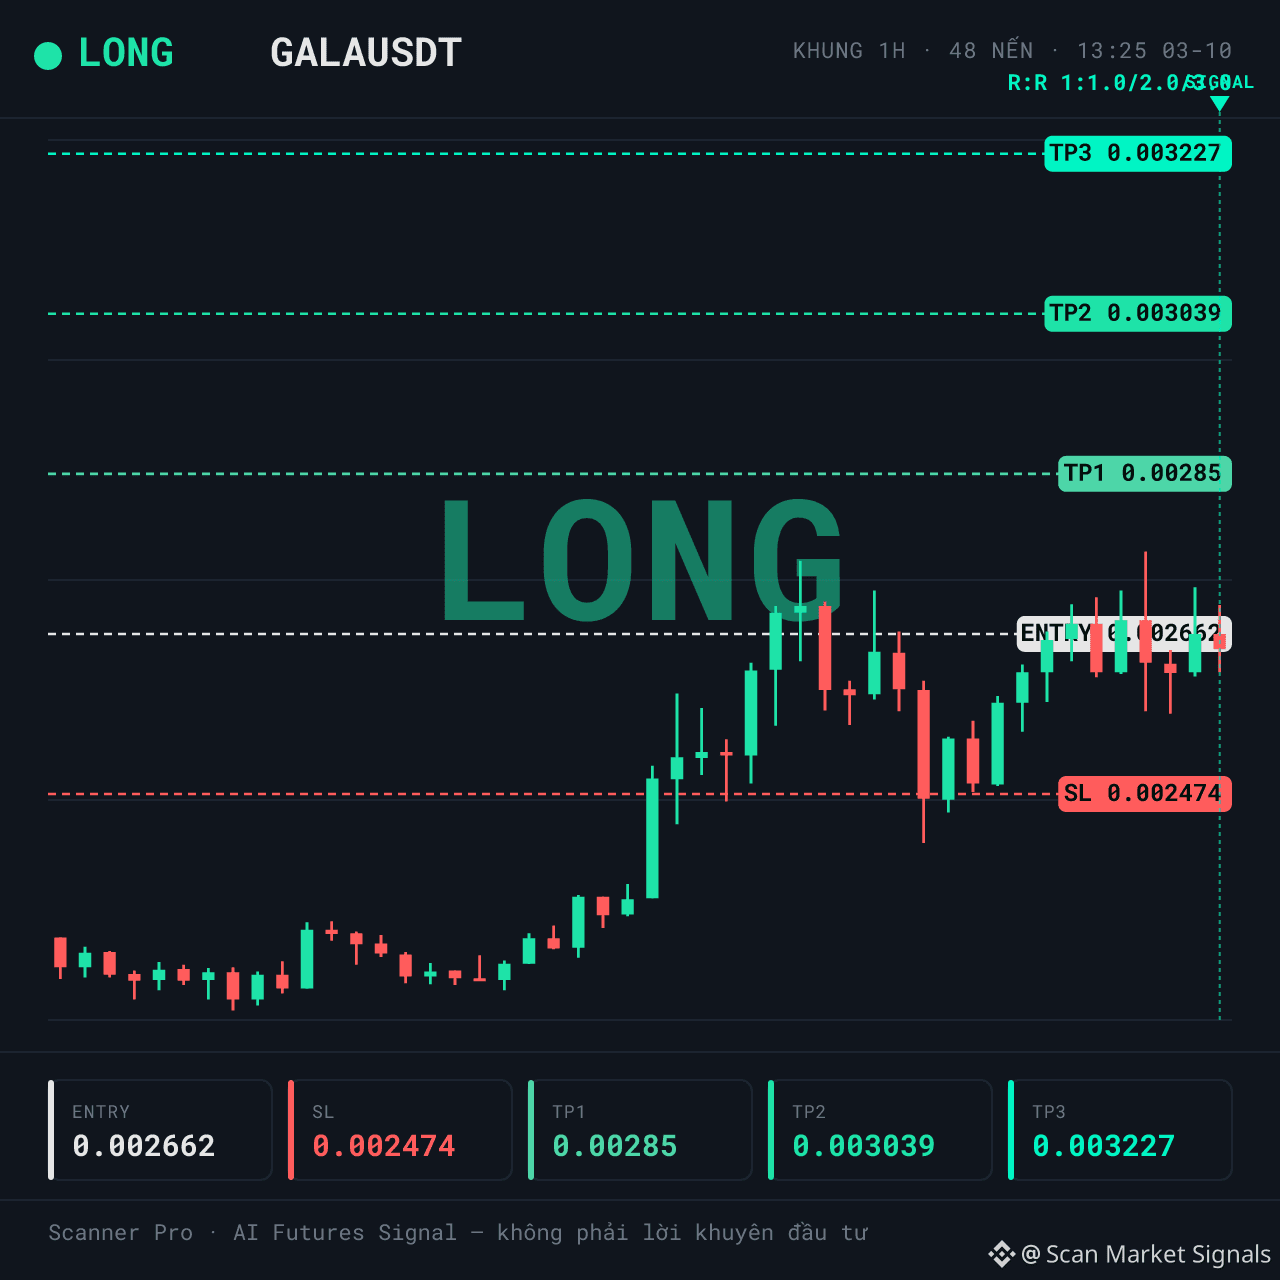
10
Log in to explore more content
Join global crypto users on Binance Square
⚡️ Get latest and useful information about crypto.
💬 Trusted by the world’s largest crypto exchange.
👍 Discover real insights from verified creators.
Email / Phone number
Trending Topics
SECHaltsCryptoETFReviewsAmidFundingLapse
24,310 views
343 Discussing
😳 THE “ETF CRYPTOBER” RALLY MAY HAVE TO WAIT
Crypto was expecting a wave of ETF decisions.
Instead, the SEC funding lapse has reportedly put new ETF reviews on pause.
The surprising part?
This isn't a rejection — it's a regulatory delay.
The next SEC move could become a major market catalyst.
$BTC $ETH $SOL $XRP $DOGE
#sechaltscryptoetfreviewsamidfundinglapse
CryptoMahibaloch
·2 Likes
·1.4k views
ZcashETFPostsFirstWeeklyOutflow$93.6M
58,779 views
183 Discussing
GreekPoliceBustCryptoScamRingArrest17
185,710 views
1,328 Discussing