
raintures
104 Posts

raintures
 Square Verified
Report
Block User
I'm Rain | | Alpha Content |

Macro KOL
28 Following
1.9K+ Followers
1.6K+ Liked
1 Badges
Posts
·
--
Verified

Article
Why Verifiable Data Matters for AI, Tokenization and DeFiAn ai agent is about to move capital into a lending protocol.
Before it signs anything, it pulls the protocol's recorded fees for the last quarter.
Simple question: how does it know that number is real?
Right now it mostly doesn't.
The figure comes from an api or someone's database, and the agent acts on whatever it's handed, at machine speed.
This gap is what @SpaceandTimeDB is built around.
Space and Time is a data blockchain backed by M12, Microsoft's venture fund.
It indexes chain data, stores offchain datasets next to it, and returns sql results with a zk proof attached (Proof of SQL).
Whoever consumes the result, agent or contract, checks the proof and skips trusting the operator.
AI
The agent stack is filling in fast: wallets, signing, payment rails, cross-chain execution. What sits between an agent’s intent and its transaction is still thin: the data that tells it whether the transaction makes sense at all.
Think about what a serious financial agent has to do before acting.
Read how a position behaved over weeks, aggregate activity across protocols and chains, pull offchain inputs like reserve levels, then run logic over all of it.
An agent evaluating a loan wants to know how the borrower’s collateral ratio moved over the last 30 days, and a smart contract can’t answer that from the current state.
A human trader would sanity check the dashboard before clicking. An agent has no such pause.
A stale or manipulated figure goes straight into a signed transaction. When the fee history or collateral data comes back as a proven query result, the agent can verify its own input, and the counterparty can check what the agent saw before capital moves.
That second part is what turns “let an agent manage money” from a leap of faith into something a risk team can sign off on.
Tokenization
First-wave tokenization was a wrapper: a token that tracks a bond or a stock. The products institutions run now are math.
-a tokenized money market fund rebalances on yield curves and applies redemption rules against liquidity thresholds.
-a private credit pool takes payments across dozens of loans, runs waterfall logic across tranches and adjusts valuations as defaults come in.
The asset is the output of that computation.
This is where most programs stall: contracts can enforce rules but can’t compute over large or historical datasets. Offchain systems can compute, and then every holder trusts the output.
Issuers end up simplifying the asset or adding a trusted middleman, which undercuts the reason to tokenize in the first place.
Space and Time sits in that gap: an administrator or issuer runs the nav calculation as a sql query over holdings data and publishes the result with a proof that it executed correctly against that data.
Custody and audit still establish what the holdings are. The proof closes the last mile between those records and the number a holder sees onchain.
Same logic for a tokenized stock trading in several pools: total volume across all of them becomes one calculation, proven against committed data.
DeFi
A contract sees the current block and nothing before it. That's why most defi incentives are blunt.
One fee tier for everyone. rewards distributed on snapshots that farmers learn to game. loyalty programs that can’t see loyalty.
Uniswap v4 hooks show both the ceiling and the fix. A hook can run custom logic on every swap, but it only knows current pool state and whatever gets passed in.
Space and Time publishes hook templates where the hook asks a historical question, something like how much has this wallet swapped in the last 30 days, and gets back a proven answer.
The loyalty discount template caches the user’s tier once eligibility is proven and applies the lower fee at swap time. The sql query is the only piece a developer writes.
The same pattern extends to reward programs where eligibility gets computed from real past activity and proven, so nobody self-reports and anyone can audit who qualified and why.
Protocols can finally price behavior over time instead of a single moment.
Token
The token ties back to actual work. Every workload on the network settles in $SXT : indexing chain data, inserting offchain datasets, generating and verifying query proofs.
Each query costs SXT because it’s real compute. On the other side, SXT is staked to back the validators that execute queries and secure the chain.
Usage and security draw on the same asset, and the fees land onchain where anyone can track them.
If your agent or protocol could prove one historical query before acting, which query would you pick first?
#SXT
{spot}(SXTUSDT)
Why Verifiable Data Matters for AI, Tokenization and DeFi
An ai agent is about to move capital into a lending protocol.
Before it signs anything, it pulls the protocol's recorded fees for the last quarter.
Simple question: how does it know that number is real?
Right now it mostly doesn't.
The figure comes from an api or someone's database, and the agent acts on whatever it's handed, at machine speed.
This gap is what @SpaceandTime is built around.
Space and Time is a data blockchain backed by M12, Microsoft's venture fund.
It indexes chain data, stores offchain datasets next to it, and returns sql results with a zk proof attached (Proof of SQL).
Whoever consumes the result, agent or contract, checks the proof and skips trusting the operator.
AI
The agent stack is filling in fast: wallets, signing, payment rails, cross-chain execution. What sits between an agent’s intent and its transaction is still thin: the data that tells it whether the transaction makes sense at all.
Think about what a serious financial agent has to do before acting.
Read how a position behaved over weeks, aggregate activity across protocols and chains, pull offchain inputs like reserve levels, then run logic over all of it.
An agent evaluating a loan wants to know how the borrower’s collateral ratio moved over the last 30 days, and a smart contract can’t answer that from the current state.
A human trader would sanity check the dashboard before clicking. An agent has no such pause.
A stale or manipulated figure goes straight into a signed transaction. When the fee history or collateral data comes back as a proven query result, the agent can verify its own input, and the counterparty can check what the agent saw before capital moves.
That second part is what turns “let an agent manage money” from a leap of faith into something a risk team can sign off on.
Tokenization
First-wave tokenization was a wrapper: a token that tracks a bond or a stock. The products institutions run now are math.
-a tokenized money market fund rebalances on yield curves and applies redemption rules against liquidity thresholds.
-a private credit pool takes payments across dozens of loans, runs waterfall logic across tranches and adjusts valuations as defaults come in.
The asset is the output of that computation.
This is where most programs stall: contracts can enforce rules but can’t compute over large or historical datasets. Offchain systems can compute, and then every holder trusts the output.
Issuers end up simplifying the asset or adding a trusted middleman, which undercuts the reason to tokenize in the first place.
Space and Time sits in that gap: an administrator or issuer runs the nav calculation as a sql query over holdings data and publishes the result with a proof that it executed correctly against that data.
Custody and audit still establish what the holdings are. The proof closes the last mile between those records and the number a holder sees onchain.
Same logic for a tokenized stock trading in several pools: total volume across all of them becomes one calculation, proven against committed data.
DeFi
A contract sees the current block and nothing before it. That's why most defi incentives are blunt.
One fee tier for everyone. rewards distributed on snapshots that farmers learn to game. loyalty programs that can’t see loyalty.
Uniswap v4 hooks show both the ceiling and the fix. A hook can run custom logic on every swap, but it only knows current pool state and whatever gets passed in.
Space and Time publishes hook templates where the hook asks a historical question, something like how much has this wallet swapped in the last 30 days, and gets back a proven answer.
The loyalty discount template caches the user’s tier once eligibility is proven and applies the lower fee at swap time. The sql query is the only piece a developer writes.
The same pattern extends to reward programs where eligibility gets computed from real past activity and proven, so nobody self-reports and anyone can audit who qualified and why.
Protocols can finally price behavior over time instead of a single moment.
Token
The token ties back to actual work. Every workload on the network settles in $SXT : indexing chain data, inserting offchain datasets, generating and verifying query proofs.
Each query costs SXT because it’s real compute. On the other side, SXT is staked to back the validators that execute queries and secure the chain.
Usage and security draw on the same asset, and the fees land onchain where anyone can track them.
If your agent or protocol could prove one historical query before acting, which query would you pick first?
#SXT
Before it signs anything, it pulls the protocol's recorded fees for the last quarter.
Simple question: how does it know that number is real?
Right now it mostly doesn't.
The figure comes from an api or someone's database, and the agent acts on whatever it's handed, at machine speed.
This gap is what @SpaceandTime is built around.
Space and Time is a data blockchain backed by M12, Microsoft's venture fund.
It indexes chain data, stores offchain datasets next to it, and returns sql results with a zk proof attached (Proof of SQL).
Whoever consumes the result, agent or contract, checks the proof and skips trusting the operator.
AI
The agent stack is filling in fast: wallets, signing, payment rails, cross-chain execution. What sits between an agent’s intent and its transaction is still thin: the data that tells it whether the transaction makes sense at all.
Think about what a serious financial agent has to do before acting.
Read how a position behaved over weeks, aggregate activity across protocols and chains, pull offchain inputs like reserve levels, then run logic over all of it.
An agent evaluating a loan wants to know how the borrower’s collateral ratio moved over the last 30 days, and a smart contract can’t answer that from the current state.
A human trader would sanity check the dashboard before clicking. An agent has no such pause.
A stale or manipulated figure goes straight into a signed transaction. When the fee history or collateral data comes back as a proven query result, the agent can verify its own input, and the counterparty can check what the agent saw before capital moves.
That second part is what turns “let an agent manage money” from a leap of faith into something a risk team can sign off on.
Tokenization
First-wave tokenization was a wrapper: a token that tracks a bond or a stock. The products institutions run now are math.
-a tokenized money market fund rebalances on yield curves and applies redemption rules against liquidity thresholds.
-a private credit pool takes payments across dozens of loans, runs waterfall logic across tranches and adjusts valuations as defaults come in.
The asset is the output of that computation.
This is where most programs stall: contracts can enforce rules but can’t compute over large or historical datasets. Offchain systems can compute, and then every holder trusts the output.
Issuers end up simplifying the asset or adding a trusted middleman, which undercuts the reason to tokenize in the first place.
Space and Time sits in that gap: an administrator or issuer runs the nav calculation as a sql query over holdings data and publishes the result with a proof that it executed correctly against that data.
Custody and audit still establish what the holdings are. The proof closes the last mile between those records and the number a holder sees onchain.
Same logic for a tokenized stock trading in several pools: total volume across all of them becomes one calculation, proven against committed data.
DeFi
A contract sees the current block and nothing before it. That's why most defi incentives are blunt.
One fee tier for everyone. rewards distributed on snapshots that farmers learn to game. loyalty programs that can’t see loyalty.
Uniswap v4 hooks show both the ceiling and the fix. A hook can run custom logic on every swap, but it only knows current pool state and whatever gets passed in.
Space and Time publishes hook templates where the hook asks a historical question, something like how much has this wallet swapped in the last 30 days, and gets back a proven answer.
The loyalty discount template caches the user’s tier once eligibility is proven and applies the lower fee at swap time. The sql query is the only piece a developer writes.
The same pattern extends to reward programs where eligibility gets computed from real past activity and proven, so nobody self-reports and anyone can audit who qualified and why.
Protocols can finally price behavior over time instead of a single moment.
Token
The token ties back to actual work. Every workload on the network settles in $SXT : indexing chain data, inserting offchain datasets, generating and verifying query proofs.
Each query costs SXT because it’s real compute. On the other side, SXT is staked to back the validators that execute queries and secure the chain.
Usage and security draw on the same asset, and the fees land onchain where anyone can track them.
If your agent or protocol could prove one historical query before acting, which query would you pick first?
#SXT
2
4
4.4k
·
--
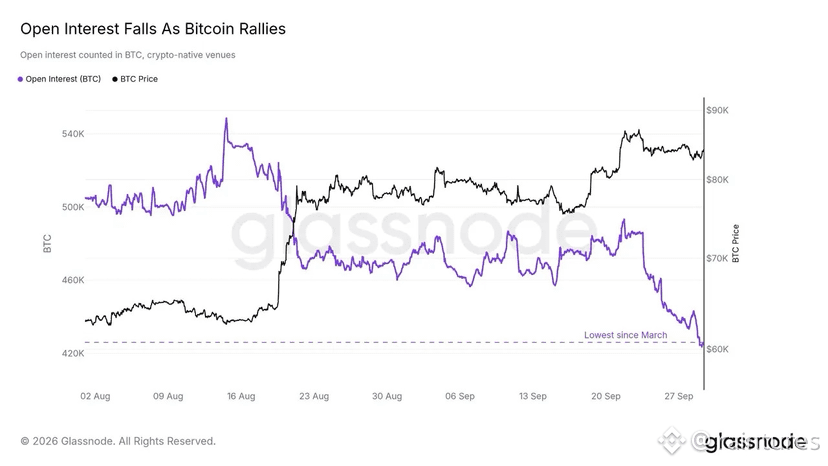
$BTC is up 35% from the August low while BTC-denominated futures OI is down almost 20%.
A much healthier setup than another rally built on leverage.
BTC enters Q4 around $83.5K after its best Q3 since 2017 (+42.7%), while coin-denominated OI sits at its lowest since March.
But less leverage doesn’t solve the supply overhead.
The latest move rejected at $85.6K, with sell orders and long-term holder supply clustered around $84–85K.
Even softer PCE couldn’t push BTC through it.
So we have less leverage to flush, but still need enough spot demand to absorb sellers.
Does lower OI make the next breakout cleaner?
$BTC is up 35% from the August low while BTC-denominated futures OI is down almost 20%.
A much healthier setup than another rally built on leverage.
BTC enters Q4 around $83.5K after its best Q3 since 2017 (+42.7%), while coin-denominated OI sits at its lowest since March.
But less leverage doesn’t solve the supply overhead.
The latest move rejected at $85.6K, with sell orders and long-term holder supply clustered around $84–85K.
Even softer PCE couldn’t push BTC through it.
So we have less leverage to flush, but still need enough spot demand to absorb sellers.
Does lower OI make the next breakout cleaner?
A much healthier setup than another rally built on leverage.
BTC enters Q4 around $83.5K after its best Q3 since 2017 (+42.7%), while coin-denominated OI sits at its lowest since March.
But less leverage doesn’t solve the supply overhead.
The latest move rejected at $85.6K, with sell orders and long-term holder supply clustered around $84–85K.
Even softer PCE couldn’t push BTC through it.
So we have less leverage to flush, but still need enough spot demand to absorb sellers.
Does lower OI make the next breakout cleaner?
2
2
788
·
--

Article
How I Filter New Tokens With BubblemapsI don't really have a token discovery problem.
I have a token rejection problem.
There are already more new launches, tickers and narratives crossing my feed every day than I could reasonably research.
So, another platform showing me what's trending isn't particularly useful unless it also helps me eliminate the garbage faster.
I've been testing the revamped version of @bubblemaps through this lens.
The new feed brings fresh and trending tokens across chains into one place, but the interesting part is the amount of context attached before you decide something deserves deeper research.
Hover a token and you can inspect its bubble map immediately.
Bubblemaps Score flags insider clusters and bundled wallets.
You can filter by chain, launchpad, liquidity, volume, price and other variables.
Wallet labels are reviewed by professional onchain sleuths, and project socials are verified/reviewed.
Put those together and my first interaction with a new token doesn't have to be:
“Is this interesting?”
It can be:
“Is there already a reason to discard this?”
That's a better filter.
And only after something survives that first pass do features like historical holder distribution become useful.
You can click a candle and inspect how ownership looked at that specific moment, rather than only seeing today's map.
The platform now goes all the way through to execution too, with a built-in swap charging 0.5%, plus token boosting and support for new chains including Arc from day one.
I'm still going to do my own research before touching anything that appears in a discovery feed.
That's actually the point.
Sometimes the best research tool is the one that gives me better reasons to stop researching something.
🔗 If you wanna test it yourself visit v2.bubblemaps.io
How I Filter New Tokens With Bubblemaps
I don't really have a token discovery problem.
I have a token rejection problem.
There are already more new launches, tickers and narratives crossing my feed every day than I could reasonably research.
So, another platform showing me what's trending isn't particularly useful unless it also helps me eliminate the garbage faster.
I've been testing the revamped version of @Bubblemaps.io through this lens.
The new feed brings fresh and trending tokens across chains into one place, but the interesting part is the amount of context attached before you decide something deserves deeper research.
Hover a token and you can inspect its bubble map immediately.
Bubblemaps Score flags insider clusters and bundled wallets.
You can filter by chain, launchpad, liquidity, volume, price and other variables.
Wallet labels are reviewed by professional onchain sleuths, and project socials are verified/reviewed.
Put those together and my first interaction with a new token doesn't have to be:
“Is this interesting?”
It can be:
“Is there already a reason to discard this?”
That's a better filter.
And only after something survives that first pass do features like historical holder distribution become useful.
You can click a candle and inspect how ownership looked at that specific moment, rather than only seeing today's map.
The platform now goes all the way through to execution too, with a built-in swap charging 0.5%, plus token boosting and support for new chains including Arc from day one.
I'm still going to do my own research before touching anything that appears in a discovery feed.
That's actually the point.
Sometimes the best research tool is the one that gives me better reasons to stop researching something.
🔗 If you wanna test it yourself visit v2.bubblemaps.io
I have a token rejection problem.
There are already more new launches, tickers and narratives crossing my feed every day than I could reasonably research.
So, another platform showing me what's trending isn't particularly useful unless it also helps me eliminate the garbage faster.
I've been testing the revamped version of @Bubblemaps.io through this lens.
The new feed brings fresh and trending tokens across chains into one place, but the interesting part is the amount of context attached before you decide something deserves deeper research.
Hover a token and you can inspect its bubble map immediately.
Bubblemaps Score flags insider clusters and bundled wallets.
You can filter by chain, launchpad, liquidity, volume, price and other variables.
Wallet labels are reviewed by professional onchain sleuths, and project socials are verified/reviewed.
Put those together and my first interaction with a new token doesn't have to be:
“Is this interesting?”
It can be:
“Is there already a reason to discard this?”
That's a better filter.
And only after something survives that first pass do features like historical holder distribution become useful.
You can click a candle and inspect how ownership looked at that specific moment, rather than only seeing today's map.
The platform now goes all the way through to execution too, with a built-in swap charging 0.5%, plus token boosting and support for new chains including Arc from day one.
I'm still going to do my own research before touching anything that appears in a discovery feed.
That's actually the point.
Sometimes the best research tool is the one that gives me better reasons to stop researching something.
🔗 If you wanna test it yourself visit v2.bubblemaps.io
26
4
131
21.3k
·
--
$ETH is up 58% in two months and still down 16.6% for the year.
August alone was +33%, beating bitcoin's +25%.
Real number, but it's recovering from a february crash to $1,747, after topping at $3,400 in january.
This rally is repair work rather than new highs.
Price has been stuck in a range the last two weeks. support at $2,410, then $2,285, main support at $2,200.
A lot of levels packed close together right after the best two month run in a year.
$2,500 is resistance now.
Same zone that's capped bounces before this cycle.. getting here is the next test.
Does eth actually clear $2,500??
$ETH is up 58% in two months and still down 16.6% for the year.
August alone was +33%, beating bitcoin's +25%.
Real number, but it's recovering from a february crash to $1,747, after topping at $3,400 in january.
This rally is repair work rather than new highs.
Price has been stuck in a range the last two weeks. support at $2,410, then $2,285, main support at $2,200.
A lot of levels packed close together right after the best two month run in a year.
$2,500 is resistance now.
Same zone that's capped bounces before this cycle.. getting here is the next test.
Does eth actually clear $2,500??
August alone was +33%, beating bitcoin's +25%.
Real number, but it's recovering from a february crash to $1,747, after topping at $3,400 in january.
This rally is repair work rather than new highs.
Price has been stuck in a range the last two weeks. support at $2,410, then $2,285, main support at $2,200.
A lot of levels packed close together right after the best two month run in a year.
$2,500 is resistance now.
Same zone that's capped bounces before this cycle.. getting here is the next test.
Does eth actually clear $2,500??

1
9
1.4k
·
--
162,000 new jobs is why $BTC dropped, not the other way around.
Good economic news raised rate hike odds past 50% in minutes, and that's what actually moved the price.
Worth sitting with: btc got rejected at 82,400 hours before the report even dropped.
The setup for a pullback was already there, the jobs number was the trigger, not the root cause.
The "system is broken" framing misses the actual mechanism.
Strong jobs data isn't inflationary on its own, it just removes the fed's excuse to cut, which is what risk assets were actually pricing in.
Nothing broke, the market repriced a probability.
The long-term bull case rests on structural deficits and debt outlasting any single rate decision. that's a real argument.
It also has nothing to do with why the price moved friday, and conflating the two is how a short-term repricing turns into a permanent narrative.
162,000 new jobs is why $BTC dropped, not the other way around.
Good economic news raised rate hike odds past 50% in minutes, and that's what actually moved the price.
Worth sitting with: btc got rejected at 82,400 hours before the report even dropped.
The setup for a pullback was already there, the jobs number was the trigger, not the root cause.
The "system is broken" framing misses the actual mechanism.
Strong jobs data isn't inflationary on its own, it just removes the fed's excuse to cut, which is what risk assets were actually pricing in.
Nothing broke, the market repriced a probability.
The long-term bull case rests on structural deficits and debt outlasting any single rate decision. that's a real argument.
It also has nothing to do with why the price moved friday, and conflating the two is how a short-term repricing turns into a permanent narrative.
Good economic news raised rate hike odds past 50% in minutes, and that's what actually moved the price.
Worth sitting with: btc got rejected at 82,400 hours before the report even dropped.
The setup for a pullback was already there, the jobs number was the trigger, not the root cause.
The "system is broken" framing misses the actual mechanism.
Strong jobs data isn't inflationary on its own, it just removes the fed's excuse to cut, which is what risk assets were actually pricing in.
Nothing broke, the market repriced a probability.
The long-term bull case rests on structural deficits and debt outlasting any single rate decision. that's a real argument.
It also has nothing to do with why the price moved friday, and conflating the two is how a short-term repricing turns into a permanent narrative.

6
467
·
--
Bitcoin is starting to lose the demand support that helped the August rally.
$BTC briefly fell to $76.4K as apparent demand turned negative again, after only a short-lived recovery in August.
That matters because the indicator points to whether the market is absorbing both newly issued and previously inactive BTC.
A negative reading suggests that older coins are not being absorbed at the same pace.
The timing is not great either: US spot BTC ETFs saw $236M in outflows, while Asian equities sold off and bond yields remained elevated.
To me, the bigger issue is not the $77K level itself. It is that price is struggling at the same time underlying spot demand is weakening.
If that persists, how much downside can BTC absorb before $77K stops being support and starts becoming resistance?
Bitcoin is starting to lose the demand support that helped the August rally.
$BTC briefly fell to $76.4K as apparent demand turned negative again, after only a short-lived recovery in August.
That matters because the indicator points to whether the market is absorbing both newly issued and previously inactive BTC.
A negative reading suggests that older coins are not being absorbed at the same pace.
The timing is not great either: US spot BTC ETFs saw $236M in outflows, while Asian equities sold off and bond yields remained elevated.
To me, the bigger issue is not the $77K level itself. It is that price is struggling at the same time underlying spot demand is weakening.
If that persists, how much downside can BTC absorb before $77K stops being support and starts becoming resistance?
$BTC briefly fell to $76.4K as apparent demand turned negative again, after only a short-lived recovery in August.
That matters because the indicator points to whether the market is absorbing both newly issued and previously inactive BTC.
A negative reading suggests that older coins are not being absorbed at the same pace.
The timing is not great either: US spot BTC ETFs saw $236M in outflows, while Asian equities sold off and bond yields remained elevated.
To me, the bigger issue is not the $77K level itself. It is that price is struggling at the same time underlying spot demand is weakening.
If that persists, how much downside can BTC absorb before $77K stops being support and starts becoming resistance?

3
377
·
--
Verified
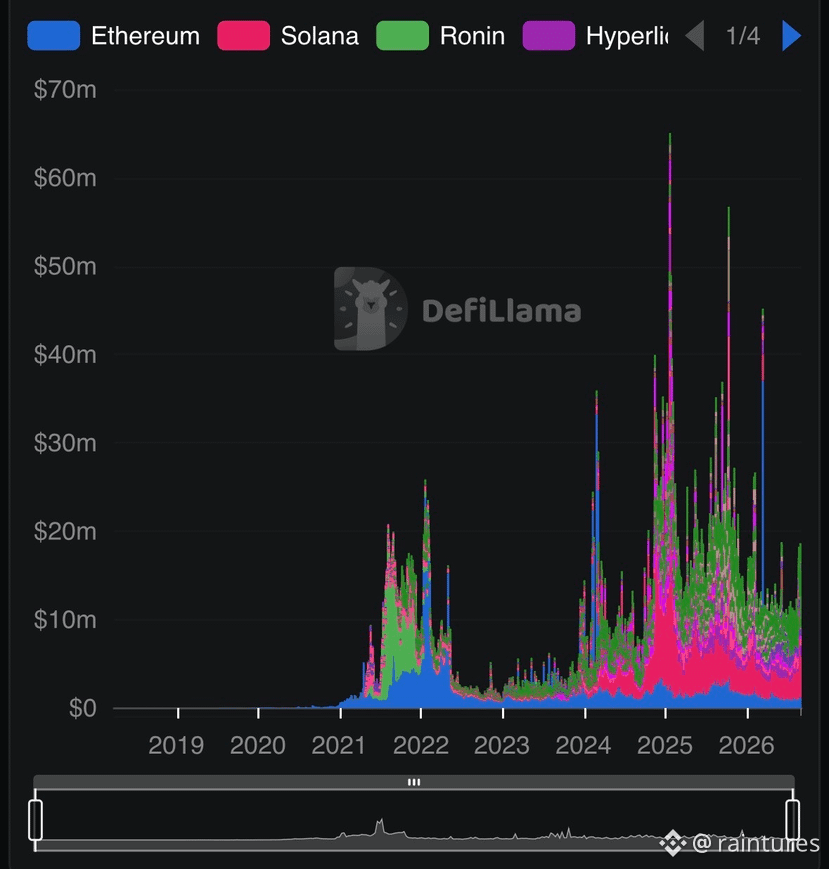
Robinhood chain outearned $ETH in daily app revenue.
$2.66m vs $1.28m, two months after launch.
The number is concrete but it's a 24h snapshot on a metric that already strips stablecoins, liquid staking and gas from the comparison.
Zoom out to 7 days and ethereum's back on top, $11.91m vs $9.34m.
30 days it's not close, $45.8m vs $23.23m.
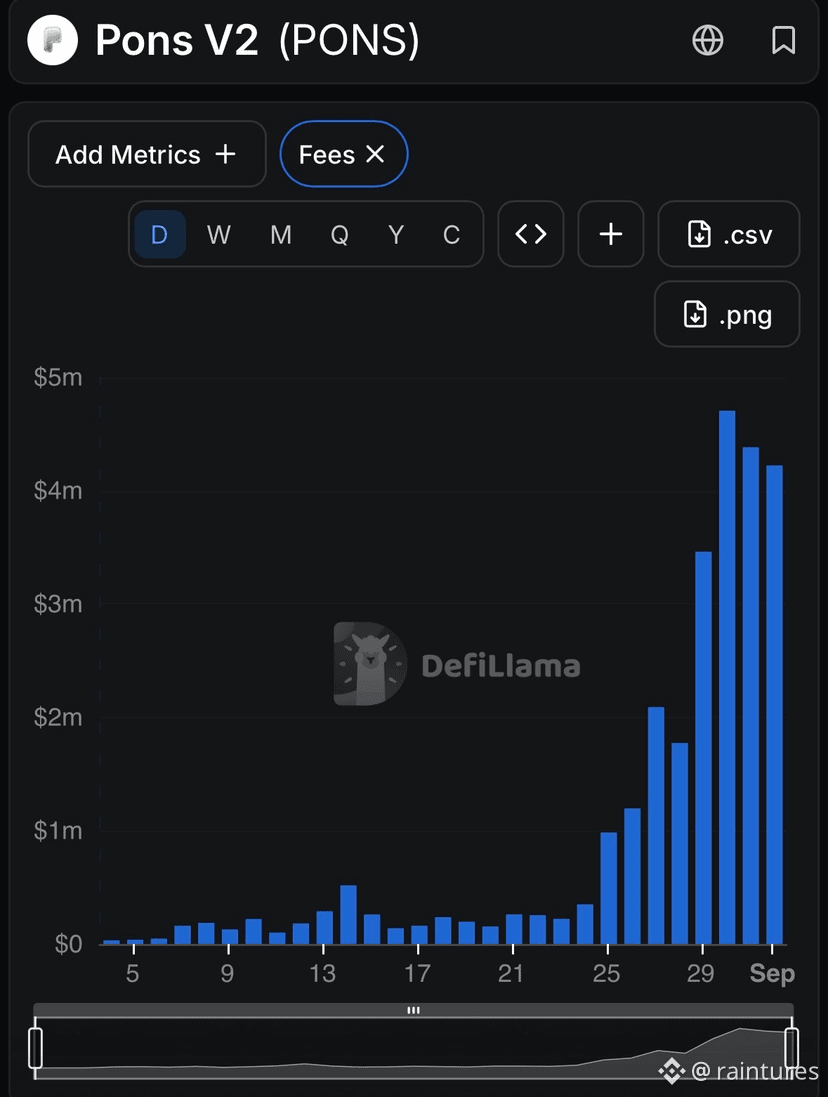
What's actually driving the daily win is pons: a memecoin launchpad that lives only on this chain and pulled $5.34m in fees in 24h on its own, more than double the entire ethereum figure it's being compared against.
Robinhood itself sees none of that app revenue.
It collects gas, $963k over 24h, and even that gets trimmed 10% under the arbitrum expansion program license before it lands.
Robinhood chain outearned $ETH in daily app revenue.
$2.66m vs $1.28m, two months after launch.
The number is concrete but it's a 24h snapshot on a metric that already strips stablecoins, liquid staking and gas from the comparison.
Zoom out to 7 days and ethereum's back on top, $11.91m vs $9.34m.
30 days it's not close, $45.8m vs $23.23m.
What's actually driving the daily win is pons: a memecoin launchpad that lives only on this chain and pulled $5.34m in fees in 24h on its own, more than double the entire ethereum figure it's being compared against.
Robinhood itself sees none of that app revenue.
It collects gas, $963k over 24h, and even that gets trimmed 10% under the arbitrum expansion program license before it lands.
$2.66m vs $1.28m, two months after launch.
The number is concrete but it's a 24h snapshot on a metric that already strips stablecoins, liquid staking and gas from the comparison.
Zoom out to 7 days and ethereum's back on top, $11.91m vs $9.34m.
30 days it's not close, $45.8m vs $23.23m.
What's actually driving the daily win is pons: a memecoin launchpad that lives only on this chain and pulled $5.34m in fees in 24h on its own, more than double the entire ethereum figure it's being compared against.
Robinhood itself sees none of that app revenue.
It collects gas, $963k over 24h, and even that gets trimmed 10% under the arbitrum expansion program license before it lands.
4
1.3k
·
--
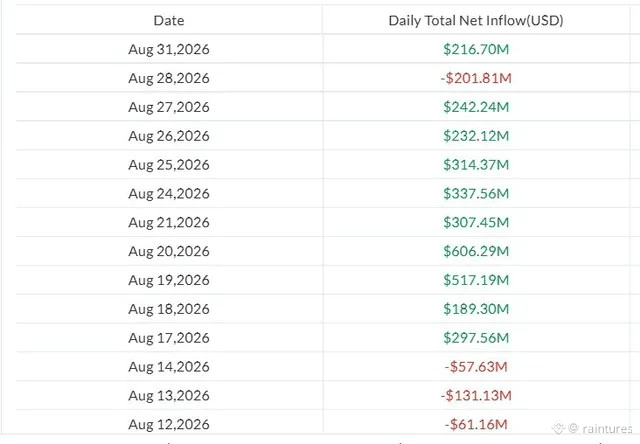
The ETF data is getting interesting precisely because the headline is stronger than the underlying picture.
$BTC ETFs took in $216.7M on Monday, but $205.9M came from BlackRock.
That means roughly 95% of the day’s inflows were concentrated in a single fund.
Meanwhile, $ETH has now recorded 11 straight inflow sessions, with $XRP and $SOL at 10.
That broader persistence matters more to me than any single Bitcoin flow figure.
But there is also a divergence worth watching: Solana’s latest inflow dropped to just $925K, down sharply from $18.1M on Friday.
How much of this market strength is broad-based accumulation, and how much is simply a few large funds carrying the tape?
The ETF data is getting interesting precisely because the headline is stronger than the underlying picture.
$BTC ETFs took in $216.7M on Monday, but $205.9M came from BlackRock.
That means roughly 95% of the day’s inflows were concentrated in a single fund.
Meanwhile, $ETH has now recorded 11 straight inflow sessions, with $XRP and $SOL at 10.
That broader persistence matters more to me than any single Bitcoin flow figure.
But there is also a divergence worth watching: Solana’s latest inflow dropped to just $925K, down sharply from $18.1M on Friday.
How much of this market strength is broad-based accumulation, and how much is simply a few large funds carrying the tape?
$BTC ETFs took in $216.7M on Monday, but $205.9M came from BlackRock.
That means roughly 95% of the day’s inflows were concentrated in a single fund.
Meanwhile, $ETH has now recorded 11 straight inflow sessions, with $XRP and $SOL at 10.
That broader persistence matters more to me than any single Bitcoin flow figure.
But there is also a divergence worth watching: Solana’s latest inflow dropped to just $925K, down sharply from $18.1M on Friday.
How much of this market strength is broad-based accumulation, and how much is simply a few large funds carrying the tape?
3
766
·
--
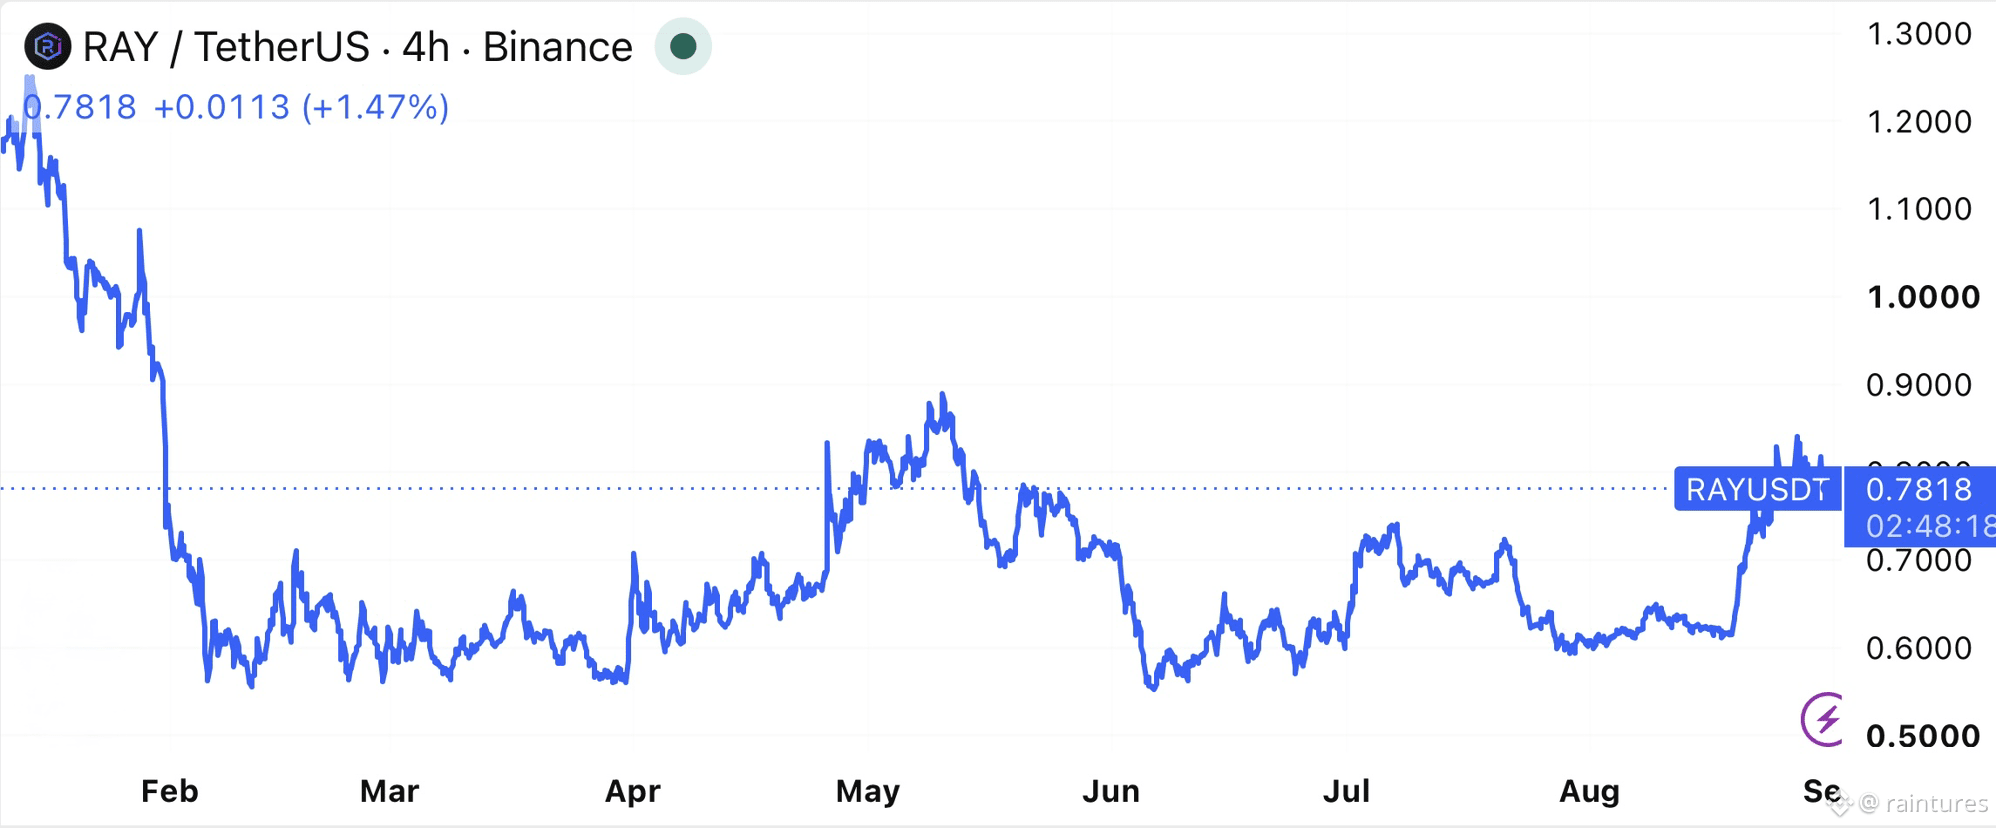
$RAY is cooling down after a powerful breakout
Price recently surged from the $0.59 region to a local high near $0.85 before pulling back toward $0.78. This looks more like a healthy consolidation than a full trend reversal so far.
$RAY remains well above its 30 day and 200 day moving averages, while RSI sits near 65 and keeps momentum in bullish territory. Trading volume has also increased by roughly 88%, showing that market interest is still strong.
The key level to watch now is $0.76. Holding this area could open the door for another test of $0.85. A clean breakout above that resistance may bring $0.90 into focus, while losing $0.76 could lead to a deeper retest near $0.68.
Momentum is strong, but confirmation still matters
$RAY is cooling down after a powerful breakout
Price recently surged from the $0.59 region to a local high near $0.85 before pulling back toward $0.78. This looks more like a healthy consolidation than a full trend reversal so far.
$RAY remains well above its 30 day and 200 day moving averages, while RSI sits near 65 and keeps momentum in bullish territory. Trading volume has also increased by roughly 88%, showing that market interest is still strong.
The key level to watch now is $0.76. Holding this area could open the door for another test of $0.85. A clean breakout above that resistance may bring $0.90 into focus, while losing $0.76 could lead to a deeper retest near $0.68.
Momentum is strong, but confirmation still matters
Price recently surged from the $0.59 region to a local high near $0.85 before pulling back toward $0.78. This looks more like a healthy consolidation than a full trend reversal so far.
$RAY remains well above its 30 day and 200 day moving averages, while RSI sits near 65 and keeps momentum in bullish territory. Trading volume has also increased by roughly 88%, showing that market interest is still strong.
The key level to watch now is $0.76. Holding this area could open the door for another test of $0.85. A clean breakout above that resistance may bring $0.90 into focus, while losing $0.76 could lead to a deeper retest near $0.68.
Momentum is strong, but confirmation still matters
2
468
·
--
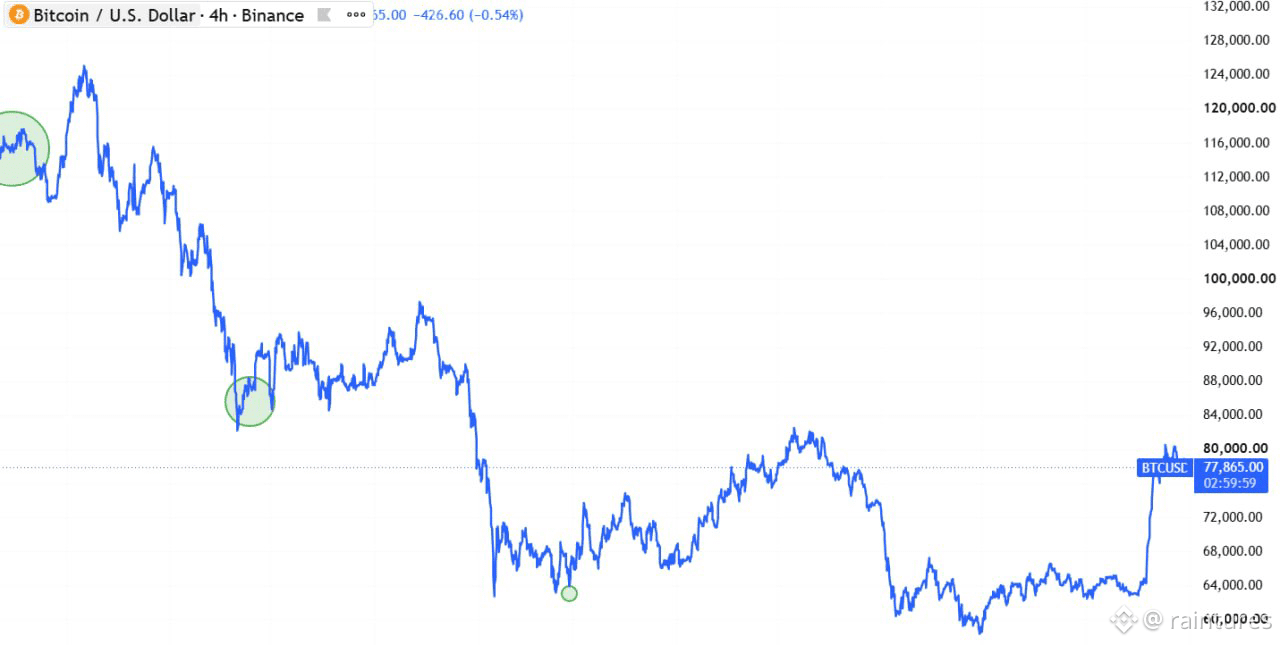
$BTC is doing something I find more interesting than simply “going up”.
- Oil is repricing geopolitical risk
- Equities are absorbing the shock
- BTC meanwhile, barely flinches
That does not make Bitcoin a safe haven yet.
The sample is too small, and crypto has a long history of breaking its own narratives when conditions get worse.
But the divergence matters.
If BTC keeps holding up while traditional risk markets price in higher geopolitical and energy risk, the correlation story around Bitcoin may be changing in real time.
What happens when the next serious risk-off move hits?
$BTC is doing something I find more interesting than simply “going up”.
- Oil is repricing geopolitical risk
- Equities are absorbing the shock
- BTC meanwhile, barely flinches
That does not make Bitcoin a safe haven yet.
The sample is too small, and crypto has a long history of breaking its own narratives when conditions get worse.
But the divergence matters.
If BTC keeps holding up while traditional risk markets price in higher geopolitical and energy risk, the correlation story around Bitcoin may be changing in real time.
What happens when the next serious risk-off move hits?
- Oil is repricing geopolitical risk
- Equities are absorbing the shock
- BTC meanwhile, barely flinches
That does not make Bitcoin a safe haven yet.
The sample is too small, and crypto has a long history of breaking its own narratives when conditions get worse.
But the divergence matters.
If BTC keeps holding up while traditional risk markets price in higher geopolitical and energy risk, the correlation story around Bitcoin may be changing in real time.
What happens when the next serious risk-off move hits?
2
354
·
--
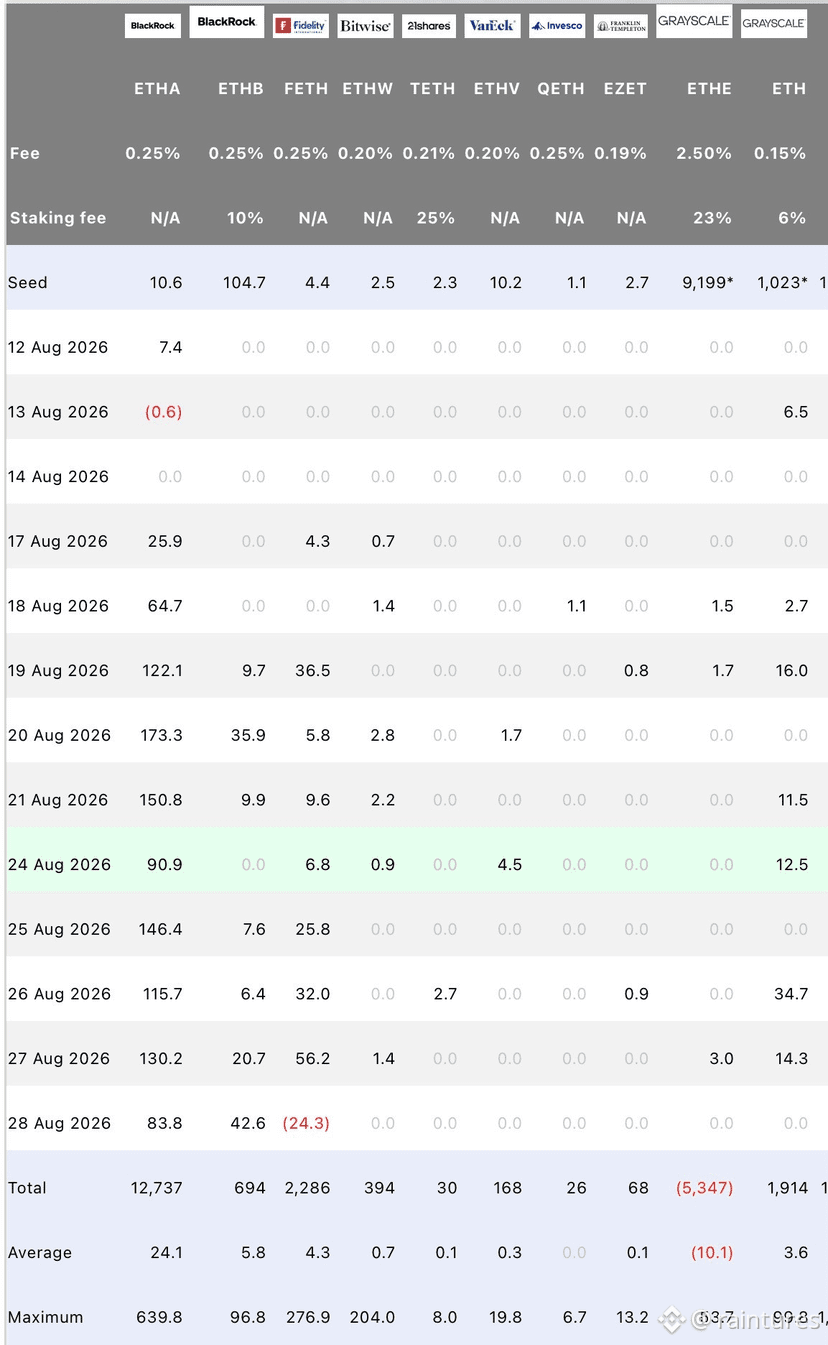
$ETH has a strange problem right now…
The spot demand looks strong, but the price still cannot break free.
ETH has seen 12 straight days of spot ETF inflows, with more than $1.5B entering during the streak.
BlackRock alone accounted for roughly $1B of purchases without a negative day.
Yet on Binance, the taker buy/sell ratio has fallen to 0.81: aggressive market selling is outweighing buying by roughly 23%.
That makes the $2.26K–$2.35K realized-price cluster the level I would watch most closely.
ETH holding above it suggests the market is absorbing that supply.
Losing it while aggressive selling persists would tell a very different story.
For me, $2.53K is the real short-term test. Until ETH clears it convincingly, ETF inflows alone are not enough confirmation that buyers have regained control.
Is ETH quietly absorbing a wall of supply before the next leg higher?
$ETH has a strange problem right now…
The spot demand looks strong, but the price still cannot break free.
ETH has seen 12 straight days of spot ETF inflows, with more than $1.5B entering during the streak.
BlackRock alone accounted for roughly $1B of purchases without a negative day.
Yet on Binance, the taker buy/sell ratio has fallen to 0.81: aggressive market selling is outweighing buying by roughly 23%.
That makes the $2.26K–$2.35K realized-price cluster the level I would watch most closely.
ETH holding above it suggests the market is absorbing that supply.
Losing it while aggressive selling persists would tell a very different story.
For me, $2.53K is the real short-term test. Until ETH clears it convincingly, ETF inflows alone are not enough confirmation that buyers have regained control.
Is ETH quietly absorbing a wall of supply before the next leg higher?
The spot demand looks strong, but the price still cannot break free.
ETH has seen 12 straight days of spot ETF inflows, with more than $1.5B entering during the streak.
BlackRock alone accounted for roughly $1B of purchases without a negative day.
Yet on Binance, the taker buy/sell ratio has fallen to 0.81: aggressive market selling is outweighing buying by roughly 23%.
That makes the $2.26K–$2.35K realized-price cluster the level I would watch most closely.
ETH holding above it suggests the market is absorbing that supply.
Losing it while aggressive selling persists would tell a very different story.
For me, $2.53K is the real short-term test. Until ETH clears it convincingly, ETF inflows alone are not enough confirmation that buyers have regained control.
Is ETH quietly absorbing a wall of supply before the next leg higher?
1
15
13.1k
·
--
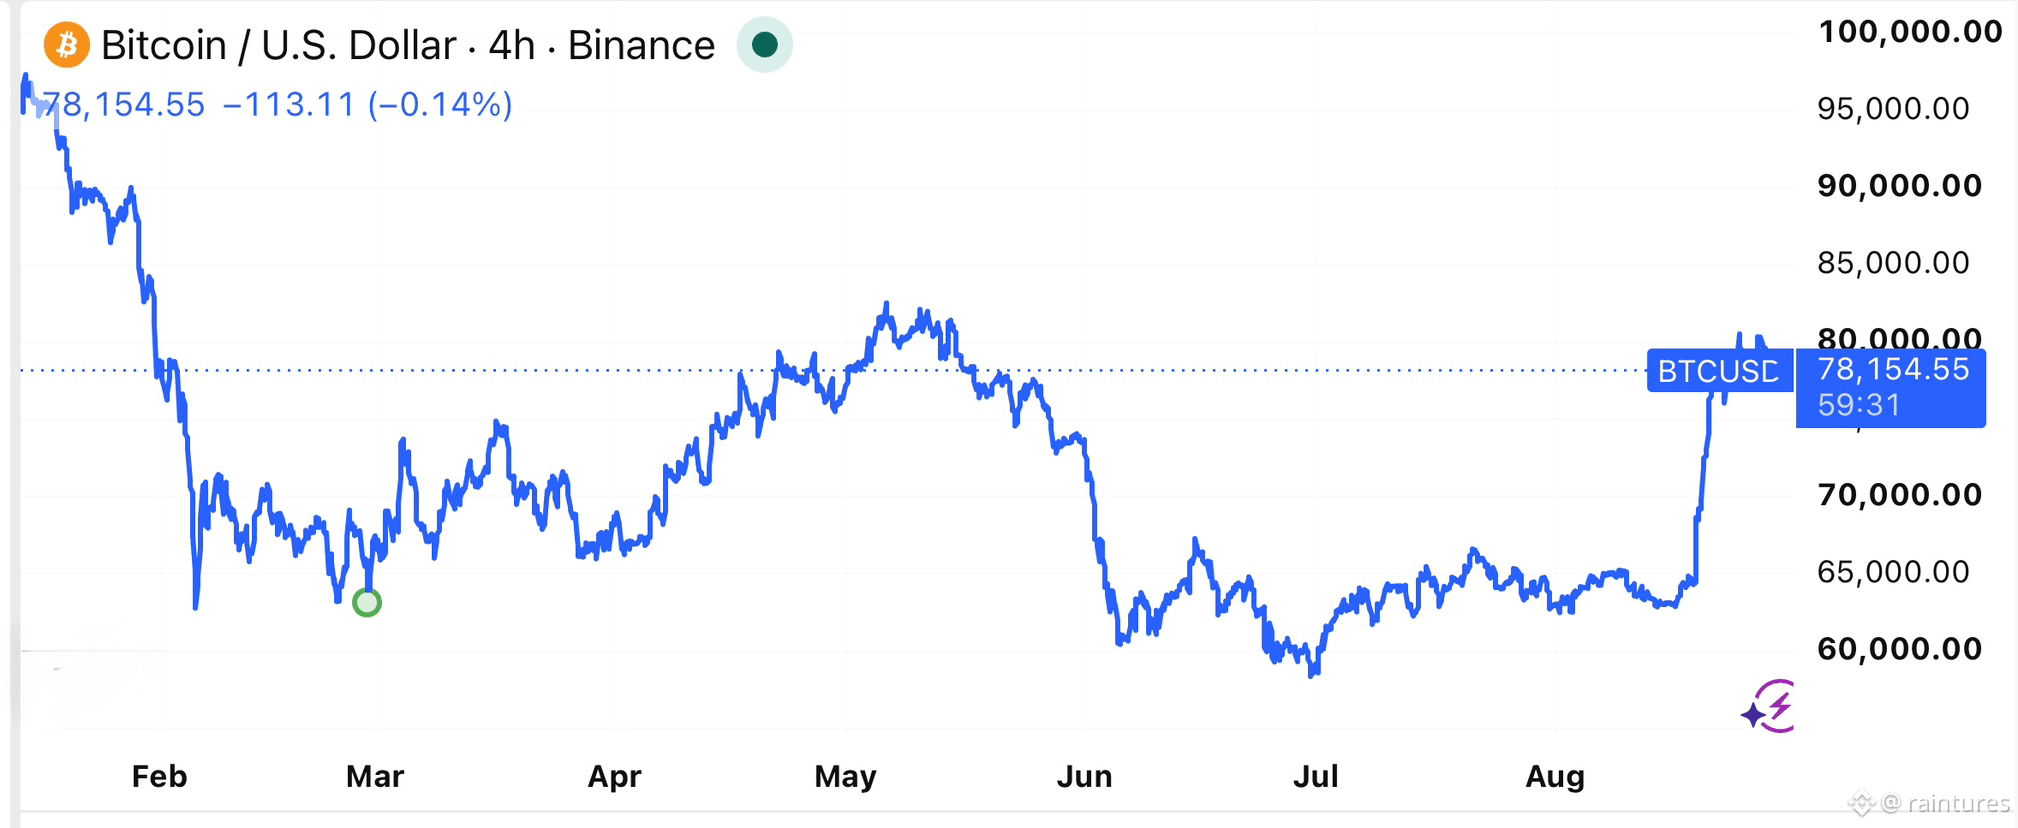
Bitcoin’s pullback matters less than what is happening underneath it.
$BTC pushed above $81K before falling back below $78K after Jackson Hole, with a more hawkish Fed message putting pressure on risk assets.
But I think the more interesting signal is the divergence between short-term price action and the structural developments underneath it.
Meanwhile, traditional finance keeps moving deeper into crypto infrastructure: SBI is investing $270M into Ajaib, Visa is expanding stablecoin payment initiatives in Korea, and BitGo is acquiring NYDIG’s trading business.
So while the market is reacting to rates and taking profits, the institutional build-out continues in the background.
Are we focusing too much on this week’s price action while missing where the underlying infrastructure is heading?
Bitcoin’s pullback matters less than what is happening underneath it.
$BTC pushed above $81K before falling back below $78K after Jackson Hole, with a more hawkish Fed message putting pressure on risk assets.
But I think the more interesting signal is the divergence between short-term price action and the structural developments underneath it.
Meanwhile, traditional finance keeps moving deeper into crypto infrastructure: SBI is investing $270M into Ajaib, Visa is expanding stablecoin payment initiatives in Korea, and BitGo is acquiring NYDIG’s trading business.
So while the market is reacting to rates and taking profits, the institutional build-out continues in the background.
Are we focusing too much on this week’s price action while missing where the underlying infrastructure is heading?
$BTC pushed above $81K before falling back below $78K after Jackson Hole, with a more hawkish Fed message putting pressure on risk assets.
But I think the more interesting signal is the divergence between short-term price action and the structural developments underneath it.
Meanwhile, traditional finance keeps moving deeper into crypto infrastructure: SBI is investing $270M into Ajaib, Visa is expanding stablecoin payment initiatives in Korea, and BitGo is acquiring NYDIG’s trading business.
So while the market is reacting to rates and taking profits, the institutional build-out continues in the background.
Are we focusing too much on this week’s price action while missing where the underlying infrastructure is heading?
2
1.2k
·
--
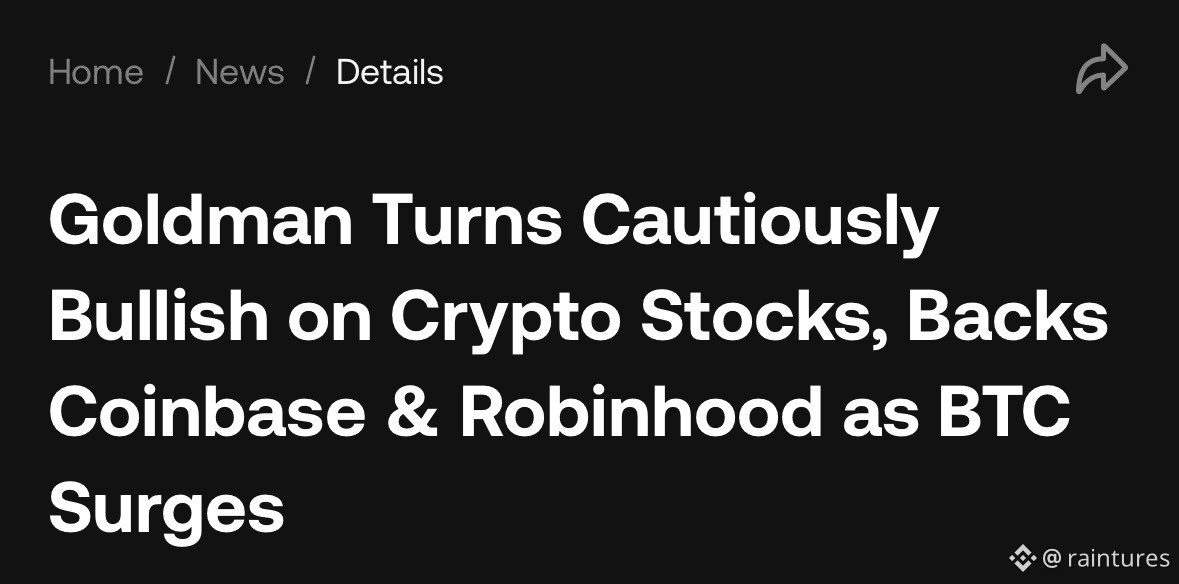
Goldman Sachs tuned cautiously bullish on crypto stocks for H2 as $BTC and alts rise.
According to their latest research crypto trading volumes fell 30% in July and another 21% in August, extending the contraction beyond previous cycles.
Yet market cap has rebounded roughly 21% to $2.8T in just a week, while total trading activity remains around 75% below its peak.
This divergence is the key.
If market cap can hold these levels, Goldman sees room for volumes to catch up as the institutional picture is changing too:
- 35% of institutions still cite regulation as the biggest barrier
- 32% see regulatory clarity as the main catalyst for adoption
Goldman Sachs tuned cautiously bullish on crypto stocks for H2 as $BTC and alts rise.
According to their latest research crypto trading volumes fell 30% in July and another 21% in August, extending the contraction beyond previous cycles.
Yet market cap has rebounded roughly 21% to $2.8T in just a week, while total trading activity remains around 75% below its peak.
This divergence is the key.
If market cap can hold these levels, Goldman sees room for volumes to catch up as the institutional picture is changing too:
- 35% of institutions still cite regulation as the biggest barrier
- 32% see regulatory clarity as the main catalyst for adoption
According to their latest research crypto trading volumes fell 30% in July and another 21% in August, extending the contraction beyond previous cycles.
Yet market cap has rebounded roughly 21% to $2.8T in just a week, while total trading activity remains around 75% below its peak.
This divergence is the key.
If market cap can hold these levels, Goldman sees room for volumes to catch up as the institutional picture is changing too:
- 35% of institutions still cite regulation as the biggest barrier
- 32% see regulatory clarity as the main catalyst for adoption
2
442
·
--
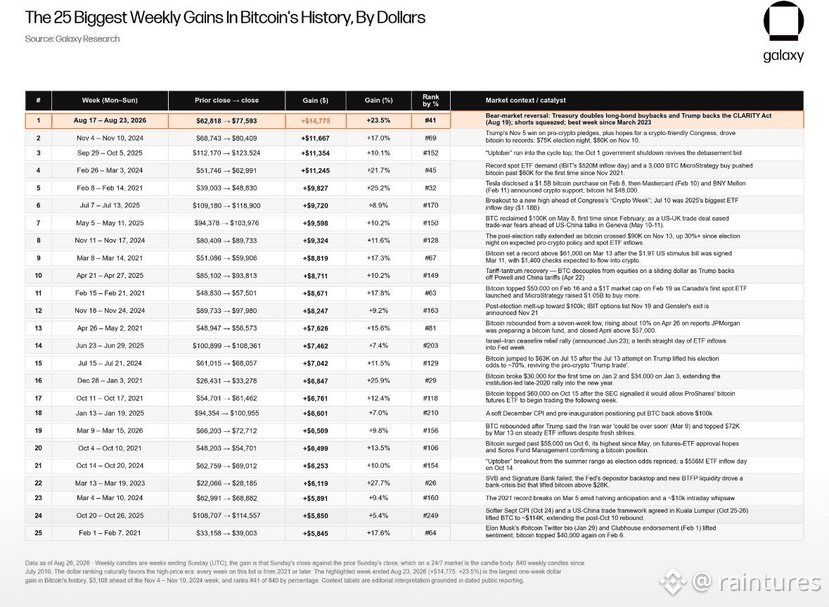
$BTC added $14,775 in seven days, closing at $77,593 after a 23.5% weekly gain.
By percentage, it was Bitcoin’s strongest week since March 2023.
Several forces hit at once: the Treasury increased long-duration bond buybacks, Trump pushed for the CLARITY Act, and roughly $2.7B in crypto shorts were liquidated.
But ETF flows give the move more substance.
US spot Bitcoin ETFs recorded their strongest weekly inflows since October 2025.
That is important because ETF demand had been a persistent drag on Bitcoin throughout much of 2026.
There’s still a catch: ETF holders have an estimated average cost of $84,029, meaning the group remains underwater around current prices.
For me, September becomes the real test.
Can ETF demand keep absorbing supply after the short squeeze is gone?
$BTC added $14,775 in seven days, closing at $77,593 after a 23.5% weekly gain.
By percentage, it was Bitcoin’s strongest week since March 2023.
Several forces hit at once: the Treasury increased long-duration bond buybacks, Trump pushed for the CLARITY Act, and roughly $2.7B in crypto shorts were liquidated.
But ETF flows give the move more substance.
US spot Bitcoin ETFs recorded their strongest weekly inflows since October 2025.
That is important because ETF demand had been a persistent drag on Bitcoin throughout much of 2026.
There’s still a catch: ETF holders have an estimated average cost of $84,029, meaning the group remains underwater around current prices.
For me, September becomes the real test.
Can ETF demand keep absorbing supply after the short squeeze is gone?
By percentage, it was Bitcoin’s strongest week since March 2023.
Several forces hit at once: the Treasury increased long-duration bond buybacks, Trump pushed for the CLARITY Act, and roughly $2.7B in crypto shorts were liquidated.
But ETF flows give the move more substance.
US spot Bitcoin ETFs recorded their strongest weekly inflows since October 2025.
That is important because ETF demand had been a persistent drag on Bitcoin throughout much of 2026.
There’s still a catch: ETF holders have an estimated average cost of $84,029, meaning the group remains underwater around current prices.
For me, September becomes the real test.
Can ETF demand keep absorbing supply after the short squeeze is gone?
2
1
8
3.8k
·
--
Extreme greed is back. Is the top already in?
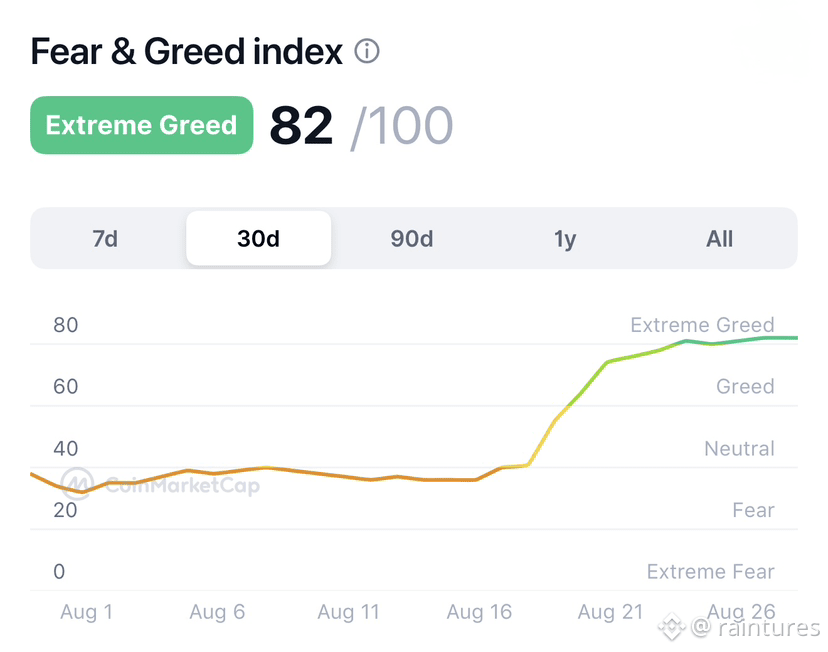
The Crypto Fear and Greed Index just hit 82 as $BTC reclaimed $80K. Some see a local top, but strong bull markets can stay overheated much longer than expected
Greed is a warning, not a sell signal
Extreme greed is back. Is the top already in?
The Crypto Fear and Greed Index just hit 82 as $BTC reclaimed $80K. Some see a local top, but strong bull markets can stay overheated much longer than expected
Greed is a warning, not a sell signal
The Crypto Fear and Greed Index just hit 82 as $BTC reclaimed $80K. Some see a local top, but strong bull markets can stay overheated much longer than expected
Greed is a warning, not a sell signal
2
1.4k
·
--
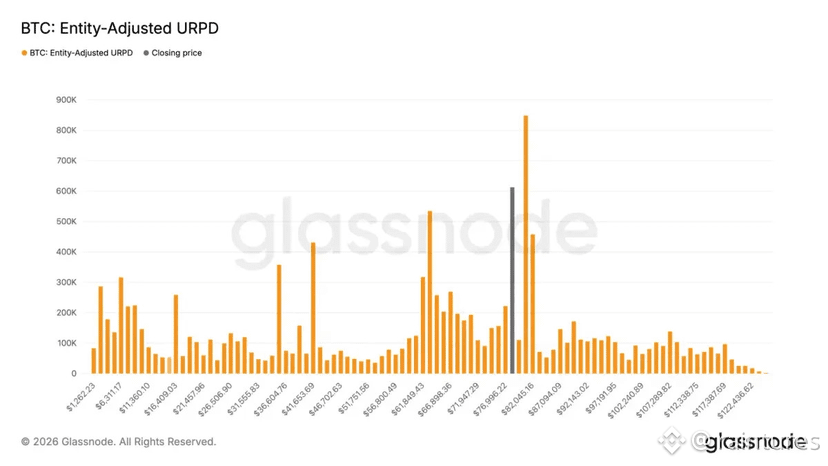
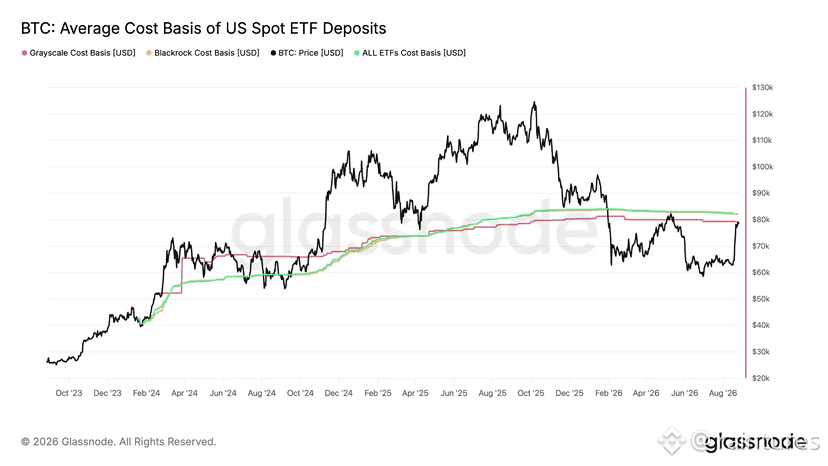
$BTC biggest test is right where everyone is watching: $80K.
Around 5% of BTC supply is concentrated at $80K, while roughly 8% sits between $80K–$82K.
The largest supply wall at any comparable range.
What makes it more interesting is that U.S. spot ETF holders also have an average cost basis around $80K–$82K.
So if BTC pushes into this zone, I’d expect a meaningful battle between holders looking to break even and buyers willing to absorb that supply.
The technical picture adds another layer: the 50-week moving average is around $81,081, and BTC has been below it since November 2025.
Historically, reclaiming this trend line has mattered.
BTC moved back above it in May 2020 and March 2023, with both recoveries preceding much larger upside moves.
If BTC reclaims $82K decisively, does that change the market structure enough to open the door for the next major leg higher?
$BTC biggest test is right where everyone is watching: $80K.
Around 5% of BTC supply is concentrated at $80K, while roughly 8% sits between $80K–$82K.
The largest supply wall at any comparable range.
What makes it more interesting is that U.S. spot ETF holders also have an average cost basis around $80K–$82K.
So if BTC pushes into this zone, I’d expect a meaningful battle between holders looking to break even and buyers willing to absorb that supply.
The technical picture adds another layer: the 50-week moving average is around $81,081, and BTC has been below it since November 2025.
Historically, reclaiming this trend line has mattered.
BTC moved back above it in May 2020 and March 2023, with both recoveries preceding much larger upside moves.
If BTC reclaims $82K decisively, does that change the market structure enough to open the door for the next major leg higher?
Around 5% of BTC supply is concentrated at $80K, while roughly 8% sits between $80K–$82K.
The largest supply wall at any comparable range.
What makes it more interesting is that U.S. spot ETF holders also have an average cost basis around $80K–$82K.
So if BTC pushes into this zone, I’d expect a meaningful battle between holders looking to break even and buyers willing to absorb that supply.
The technical picture adds another layer: the 50-week moving average is around $81,081, and BTC has been below it since November 2025.
Historically, reclaiming this trend line has mattered.
BTC moved back above it in May 2020 and March 2023, with both recoveries preceding much larger upside moves.
If BTC reclaims $82K decisively, does that change the market structure enough to open the door for the next major leg higher?
2
4
1.9k
·
--
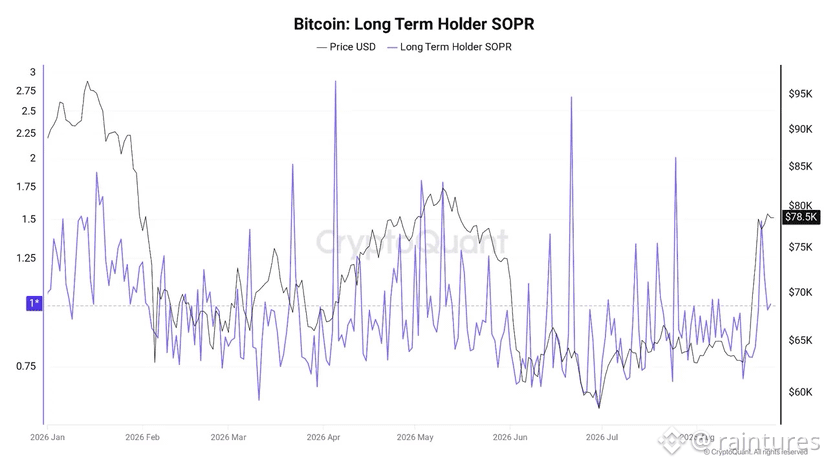
Onchain data explains why $BTC can touch $80k but the hard part is staying there.
All major holder cohorts are now sitting in aggregate profit, which creates a much larger pool of potential sellers.
Long-term holder SOPR jumped to 1.48, while short-term holders are now realizing profits at a faster rate.
At the same time, the Coinbase premium remains negative at -0.015.
It suggests US spot demand still hasn’t fully returned, even after BTC’s 25%+ weekly move.
So the key variable now is whether fresh demand can absorb the BTC being sold by profitable holders.
If ETF inflows continue while the Coinbase premium turns sustainably positive, the structure changes quite a bit.
$80K is the headline level. Is new demand strong enough to turn it into support
{spot}(BTCUSDT)
Onchain data explains why $BTC can touch $80k but the hard part is staying there.
All major holder cohorts are now sitting in aggregate profit, which creates a much larger pool of potential sellers.
Long-term holder SOPR jumped to 1.48, while short-term holders are now realizing profits at a faster rate.
At the same time, the Coinbase premium remains negative at -0.015.
It suggests US spot demand still hasn’t fully returned, even after BTC’s 25%+ weekly move.
So the key variable now is whether fresh demand can absorb the BTC being sold by profitable holders.
If ETF inflows continue while the Coinbase premium turns sustainably positive, the structure changes quite a bit.
$80K is the headline level. Is new demand strong enough to turn it into support
All major holder cohorts are now sitting in aggregate profit, which creates a much larger pool of potential sellers.
Long-term holder SOPR jumped to 1.48, while short-term holders are now realizing profits at a faster rate.
At the same time, the Coinbase premium remains negative at -0.015.
It suggests US spot demand still hasn’t fully returned, even after BTC’s 25%+ weekly move.
So the key variable now is whether fresh demand can absorb the BTC being sold by profitable holders.
If ETF inflows continue while the Coinbase premium turns sustainably positive, the structure changes quite a bit.
$80K is the headline level. Is new demand strong enough to turn it into support
2
477
·
--
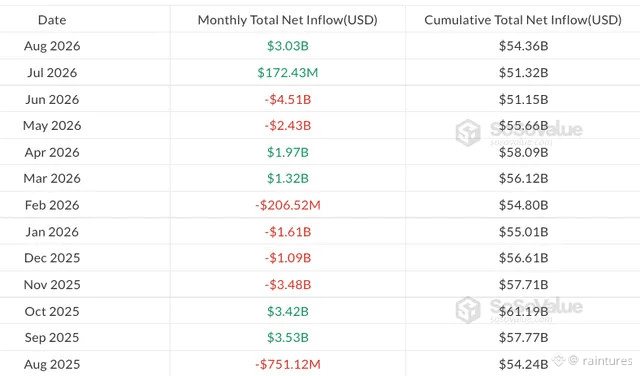
Bitcoin ETF flows are finally starting to tell a different story in 2026.
US spot $BTC ETFs just posted their 7th consecutive day of inflows, adding another $314M on Tuesday.
August inflows have now reached $3.03B, leaving the month only $390M short of October 2025’s total with four sessions still left.
More importantly, the rebound has cut the 2026 net outflow deficit by more than half, from much deeper levels to around $2.26B.
Total ETF assets are now back above $99B, while $ETH ETFs are also showing strong demand, with roughly $1B of inflows over the same seven-day streak.
If ETF flows keep accelerating even through pullbacks, how much further can recovery run?
Bitcoin ETF flows are finally starting to tell a different story in 2026.
US spot $BTC ETFs just posted their 7th consecutive day of inflows, adding another $314M on Tuesday.
August inflows have now reached $3.03B, leaving the month only $390M short of October 2025’s total with four sessions still left.
More importantly, the rebound has cut the 2026 net outflow deficit by more than half, from much deeper levels to around $2.26B.
Total ETF assets are now back above $99B, while $ETH ETFs are also showing strong demand, with roughly $1B of inflows over the same seven-day streak.
If ETF flows keep accelerating even through pullbacks, how much further can recovery run?
US spot $BTC ETFs just posted their 7th consecutive day of inflows, adding another $314M on Tuesday.
August inflows have now reached $3.03B, leaving the month only $390M short of October 2025’s total with four sessions still left.
More importantly, the rebound has cut the 2026 net outflow deficit by more than half, from much deeper levels to around $2.26B.
Total ETF assets are now back above $99B, while $ETH ETFs are also showing strong demand, with roughly $1B of inflows over the same seven-day streak.
If ETF flows keep accelerating even through pullbacks, how much further can recovery run?
2
4
720
·
--
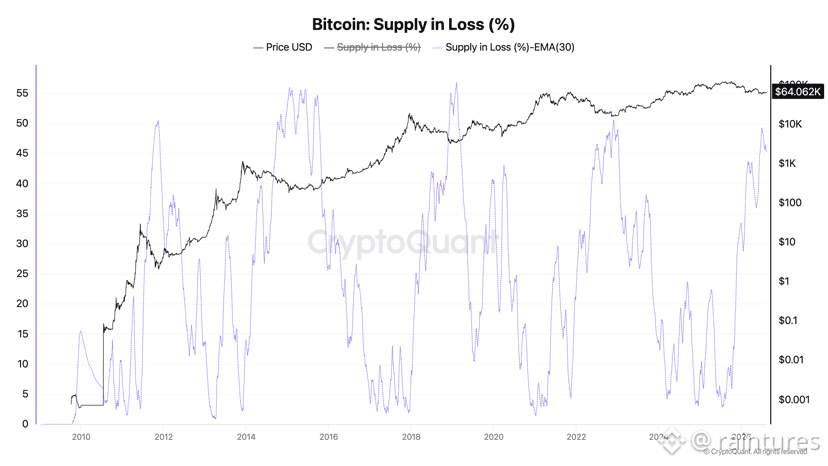
Nearly half of $BTC supply is underwater now.
Around 45–46% of BTC sits at an unrealized loss, a zone historically associated with deep bear-market stress rather than cycle tops.
But price still trades below the 20D and 50D EMAs, with $61K–$62K acting as the line I’d watch.
To me, that creates a strange setup: onchain pain already looks advanced, while the chart still leaves room for another leg lower toward the low-$50Ks if support fails.
How much more selling can the market absorb before loss turns into capitulation?
Nearly half of $BTC supply is underwater now.
Around 45–46% of BTC sits at an unrealized loss, a zone historically associated with deep bear-market stress rather than cycle tops.
But price still trades below the 20D and 50D EMAs, with $61K–$62K acting as the line I’d watch.
To me, that creates a strange setup: onchain pain already looks advanced, while the chart still leaves room for another leg lower toward the low-$50Ks if support fails.
How much more selling can the market absorb before loss turns into capitulation?
Around 45–46% of BTC sits at an unrealized loss, a zone historically associated with deep bear-market stress rather than cycle tops.
But price still trades below the 20D and 50D EMAs, with $61K–$62K acting as the line I’d watch.
To me, that creates a strange setup: onchain pain already looks advanced, while the chart still leaves room for another leg lower toward the low-$50Ks if support fails.
How much more selling can the market absorb before loss turns into capitulation?
4
193
·
--
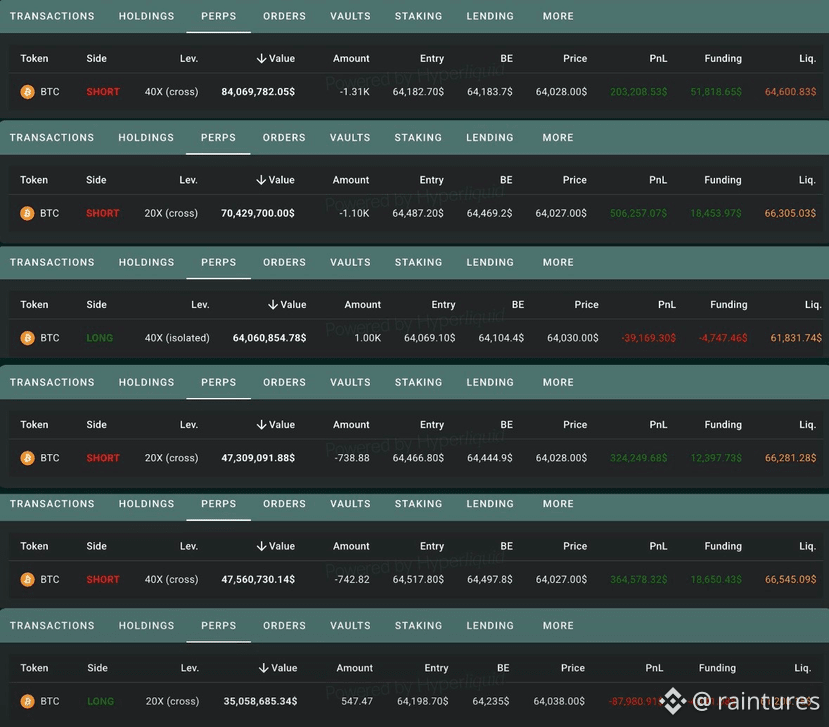
$84.6M in short liquidations sit less than 4% above where $BTC is trading right now.
That's the part of this hyperliquid standoff that gets buried under the headline framing.
Yes, short notional outweighs long notional by roughly 60%, four whale addresses are carrying $249.4m in short exposure against two addresses holding $99m long.
And yes, btc is down 20.6% over 90 days while the s&p climbed 4.8% and euro stoxx put up 12.5%. on paper that reads as bears in control.
But look at where the liquidation prices actually sit.
The shorts cluster between $64,600 and $66,545, some running 40x leverage, barely above spot. the longs don't liquidate until $61,200 to $61,831, a much wider cushion.
That’s an asymmetric setup: a small push up unwinds a quarter billion in shorts fast, a much larger drop is needed to touch the longs at all.
Positioning looks bearish but liquidation geometry looks like a coiled spring pointed the other way.
Which one actually moves price first here?
$84.6M in short liquidations sit less than 4% above where $BTC is trading right now.
That's the part of this hyperliquid standoff that gets buried under the headline framing.
Yes, short notional outweighs long notional by roughly 60%, four whale addresses are carrying $249.4m in short exposure against two addresses holding $99m long.
And yes, btc is down 20.6% over 90 days while the s&p climbed 4.8% and euro stoxx put up 12.5%. on paper that reads as bears in control.
But look at where the liquidation prices actually sit.
The shorts cluster between $64,600 and $66,545, some running 40x leverage, barely above spot. the longs don't liquidate until $61,200 to $61,831, a much wider cushion.
That’s an asymmetric setup: a small push up unwinds a quarter billion in shorts fast, a much larger drop is needed to touch the longs at all.
Positioning looks bearish but liquidation geometry looks like a coiled spring pointed the other way.
Which one actually moves price first here?
That's the part of this hyperliquid standoff that gets buried under the headline framing.
Yes, short notional outweighs long notional by roughly 60%, four whale addresses are carrying $249.4m in short exposure against two addresses holding $99m long.
And yes, btc is down 20.6% over 90 days while the s&p climbed 4.8% and euro stoxx put up 12.5%. on paper that reads as bears in control.
But look at where the liquidation prices actually sit.
The shorts cluster between $64,600 and $66,545, some running 40x leverage, barely above spot. the longs don't liquidate until $61,200 to $61,831, a much wider cushion.
That’s an asymmetric setup: a small push up unwinds a quarter billion in shorts fast, a much larger drop is needed to touch the longs at all.
Positioning looks bearish but liquidation geometry looks like a coiled spring pointed the other way.
Which one actually moves price first here?
152
Log in to explore more content
Join global crypto users on Binance Square
⚡️ Get latest and useful information about crypto.
💬 Trusted by the world’s largest crypto exchange.
👍 Discover real insights from verified creators.
Email / Phone number
Trending Topics
A Packed Week of Earnings and Data Tests Markets
45,840 views
317 Discussing
🚨🇺🇸 BIG WEEK AHEAD FOR THE MARKETS!
Markets are pricing in a Fed rate hike in December and $BTC could see some big moves next week.
Here's what's coming:
• Monday: Fed Chair Warsh speaks
• Tuesday: US Retail Sales + $NVDA earnings
• Wednesday: FOMC Minutes
• Thursday: Jobless Claims + Philly Fed Index
• Friday: Consumer Sentiment + Fed speeches
All eyes on $BTC as another important week begins.
#bitcoin
Mookie
·14 Likes
·6k views
AnthropicIPOTestsInvestorAppetiteForAI
67,640 views
1,087 Discussing
BitcoinExtendsLosingStreakToSixWeeks
28,737 views
436 Discussing