
Trad7
159 Posts

Trad7
Report
Block User
تابعونا لكل جديد في عالم العملات الرقمية تحليلات السوق .أخبار العملات . فرص استثمارية متابعة الأسعار وأهم التحديثات المعرفة أولا والقرار لك.
High-Frequency Trader
1.9 Months
4 Following
11 Followers
339 Liked
Posts
All
Quotes
·
--
Bullish
TIA$ At an important weekly support area… and the price is testing the buyers' strength! 🔍
Celestia is moving in an accumulation range near a key support zone on the weekly timeframe, with early signs of increasing buying pressure.
The most important point here is the weekly candle closes; each new close above the support zone strengthens the chances of a strong bullish reversal.
🎯 Target levels in case the bounce succeeds:
- $0.76
- $1.30
- $4.25
- $9.20
The current zone is worth watching, but confirming buyer strength through weekly closes is the decisive factor.
TIA$ At an important weekly support area… and the price is testing the buyers' strength! 🔍
Celestia is moving in an accumulation range near a key support zone on the weekly timeframe, with early signs of increasing buying pressure.
The most important point here is the weekly candle closes; each new close above the support zone strengthens the chances of a strong bullish reversal.
🎯 Target levels in case the bounce succeeds:
- $0.76
- $1.30
- $4.25
- $9.20
The current zone is worth watching, but confirming buyer strength through weekly closes is the decisive factor.
Celestia is moving in an accumulation range near a key support zone on the weekly timeframe, with early signs of increasing buying pressure.
The most important point here is the weekly candle closes; each new close above the support zone strengthens the chances of a strong bullish reversal.
🎯 Target levels in case the bounce succeeds:
- $0.76
- $1.30
- $4.25
- $9.20
The current zone is worth watching, but confirming buyer strength through weekly closes is the decisive factor.
1
2
·
--
Please note: any rebound in the market will give you a strong bearish candle
$EVAA
Please note: any rebound in the market will give you a strong bearish candle
$EVAA
$EVAA
1
143
·
--
$SHIB The Retest Is Live. 1.7 Million Holders Are Watching 🔍
Shiba Inu is hovering above the broken falling wedge on the weekly timeframe, holding the retest zone with quiet confidence.
Meanwhile, #SHIB holder addresses on Ethereum have reached 1,700,870, with the total count across Base, Solana, and BNB Chain pushing the number even higher.
Target levels after a confirmed bounce:
🎯 $0.0000040
🎯 $0.0000066
🎯 $0.0000110
🎯 $0.0000160
🎯 $0.0000330
$SHIB The Retest Is Live. 1.7 Million Holders Are Watching 🔍
Shiba Inu is hovering above the broken falling wedge on the weekly timeframe, holding the retest zone with quiet confidence.
Meanwhile, #SHIB holder addresses on Ethereum have reached 1,700,870, with the total count across Base, Solana, and BNB Chain pushing the number even higher.
Target levels after a confirmed bounce:
🎯 $0.0000040
🎯 $0.0000066
🎯 $0.0000110
🎯 $0.0000160
🎯 $0.0000330
Shiba Inu is hovering above the broken falling wedge on the weekly timeframe, holding the retest zone with quiet confidence.
Meanwhile, #SHIB holder addresses on Ethereum have reached 1,700,870, with the total count across Base, Solana, and BNB Chain pushing the number even higher.
Target levels after a confirmed bounce:
🎯 $0.0000040
🎯 $0.0000066
🎯 $0.0000110
🎯 $0.0000160
🎯 $0.0000330
1
253
·
--
Uniswap is seeing a sharp surge in trading volume… but there’s one detail worth paying attention to! 🦄
Trading volume on Uniswap V3 and V4 has risen by 26.57% in a week. Here are the figures:
🔹 Uniswap V3
- 24-hour trading volume: $1.39 billion.
- 7-day trading volume: $8.36 billion.
🔹 Uniswap V4
- 24-hour trading volume: $1.28 billion.
- 7-day trading volume: $6.14 billion.
Total weekly trading volume reached around $14.5 billion.
But the picture isn’t all positive…
Despite the rise in trading volume, total value locked (TVL) is declining:
- V3: around $1.2 billion, down 14.65% in a week.
- V4: around $987 million, down 10.95%.
In other words, trading volume is increasing while the liquidity held in the protocol is decreasing.
Uniswap is seeing a sharp surge in trading volume… but there’s one detail worth paying attention to! 🦄
Trading volume on Uniswap V3 and V4 has risen by 26.57% in a week. Here are the figures:
🔹 Uniswap V3
- 24-hour trading volume: $1.39 billion.
- 7-day trading volume: $8.36 billion.
🔹 Uniswap V4
- 24-hour trading volume: $1.28 billion.
- 7-day trading volume: $6.14 billion.
Total weekly trading volume reached around $14.5 billion.
But the picture isn’t all positive…
Despite the rise in trading volume, total value locked (TVL) is declining:
- V3: around $1.2 billion, down 14.65% in a week.
- V4: around $987 million, down 10.95%.
In other words, trading volume is increasing while the liquidity held in the protocol is decreasing.
Trading volume on Uniswap V3 and V4 has risen by 26.57% in a week. Here are the figures:
🔹 Uniswap V3
- 24-hour trading volume: $1.39 billion.
- 7-day trading volume: $8.36 billion.
🔹 Uniswap V4
- 24-hour trading volume: $1.28 billion.
- 7-day trading volume: $6.14 billion.
Total weekly trading volume reached around $14.5 billion.
But the picture isn’t all positive…
Despite the rise in trading volume, total value locked (TVL) is declining:
- V3: around $1.2 billion, down 14.65% in a week.
- V4: around $987 million, down 10.95%.
In other words, trading volume is increasing while the liquidity held in the protocol is decreasing.
1
136
·
--
Bearish
As I told you, focus on this point now
$BTC
As I told you, focus on this point now
$BTC
$BTC
Trad7
·
--
BearishI told you, welcome to Area 55 😂 The Bitcoin bubble is fading
$BTC
$BTC
1
24
·
--
If Bitcoin disappeared from the cryptocurrency market, where do you expect investment liquidity to go? Would it move to Ethereum, Solana, and altcoins, or leave the crypto market entirely and shift to gold, the dollar, and stocks?
$BTC
If Bitcoin disappeared from the cryptocurrency market, where do you expect investment liquidity to go? Would it move to Ethereum, Solana, and altcoins, or leave the crypto market entirely and shift to gold, the dollar, and stocks?
$BTC
$BTC
1
144
·
--
Bearish
I told you, welcome to Area 55 😂 The Bitcoin bubble is fading
$BTC
I told you, welcome to Area 55 😂 The Bitcoin bubble is fading
$BTC
$BTC
1
1
76
·
--
Gold’s collapse isn’t happening for no reason
We warned that 3885 would break
And the rapid plunge to 3500–3400
How did it feel standing in line to buy gold above 5000?
Gold’s collapse isn’t happening for no reason
We warned that 3885 would break
And the rapid plunge to 3500–3400
How did it feel standing in line to buy gold above 5000?
We warned that 3885 would break
And the rapid plunge to 3500–3400
How did it feel standing in line to buy gold above 5000?
1
115
·
--
Bearish
The closest historical case is the March 2020 crash during COVID.
Stocks (S&P) fell about 34%, Bitcoin more than 50% (to below $4,000), and gold temporarily dropped about 12% because of the need for liquidity.
After the Fed cut interest rates to zero and injected massive liquidity, markets quickly turned around: stocks regained their peak in August, and Bitcoin surged, rising hundreds of percent by the end of the year.
$BTC
The closest historical case is the March 2020 crash during COVID.
Stocks (S&P) fell about 34%, Bitcoin more than 50% (to below $4,000), and gold temporarily dropped about 12% because of the need for liquidity.
After the Fed cut interest rates to zero and injected massive liquidity, markets quickly turned around: stocks regained their peak in August, and Bitcoin surged, rising hundreds of percent by the end of the year.
$BTC
Stocks (S&P) fell about 34%, Bitcoin more than 50% (to below $4,000), and gold temporarily dropped about 12% because of the need for liquidity.
After the Fed cut interest rates to zero and injected massive liquidity, markets quickly turned around: stocks regained their peak in August, and Bitcoin surged, rising hundreds of percent by the end of the year.
$BTC
2
71
·
--
The worst thing that can happen to you in the crypto market isn’t losing your money, but losing your faith in yourself along with it.
Cryptocurrencies may crash, your profits may vanish, and you may find yourself facing decisions you wish you’d never made.
But remember one thing:
A loss may take your money, but it doesn’t have to take away your ability to get back up.
Don’t let your worst days in the market define the rest of your future.
Learn, rebuild yourself, and rise with a different mindset.
The greatest gain after a crash isn’t a winning trade, but a stronger version of you.
$BTC
#BTC #Crypto_Jobs🎯 #ETH
The worst thing that can happen to you in the crypto market isn’t losing your money, but losing your faith in yourself along with it.
Cryptocurrencies may crash, your profits may vanish, and you may find yourself facing decisions you wish you’d never made.
But remember one thing:
A loss may take your money, but it doesn’t have to take away your ability to get back up.
Don’t let your worst days in the market define the rest of your future.
Learn, rebuild yourself, and rise with a different mindset.
The greatest gain after a crash isn’t a winning trade, but a stronger version of you.
$BTC
#BTC #Crypto_Jobs🎯 #ETH
Cryptocurrencies may crash, your profits may vanish, and you may find yourself facing decisions you wish you’d never made.
But remember one thing:
A loss may take your money, but it doesn’t have to take away your ability to get back up.
Don’t let your worst days in the market define the rest of your future.
Learn, rebuild yourself, and rise with a different mindset.
The greatest gain after a crash isn’t a winning trade, but a stronger version of you.
$BTC
#BTC #Crypto_Jobs🎯 #ETH
2
50
·
--
Important economic data today .. during the U.S. session 🇺🇸
$BTC $ETH
Important economic data today .. during the U.S. session 🇺🇸
$BTC $ETH
$BTC $ETH
2
170
·
--
Note: This currency may be removed from the platform at the end of the month
$ONE
Note: This currency may be removed from the platform at the end of the month
$ONE
$ONE
2
321
·
--
Historic outflows from BlackRock’s Bitcoin fund!
🔴 IBIT records its largest-ever single-day outflow: $541 million!
🔴 Total outflows from U.S. Bitcoin funds: $582 million in a single session.
🔴 Around $1.13 billion left the funds in just 3 sessions!
⚠️ Continued outflows threaten Bitcoin’s $60,000 level and increase liquidation risks.
📉 Are we witnessing institutional capitulation or a historic buying opportunity?
$BTC $ETH
Historic outflows from BlackRock’s Bitcoin fund!
🔴 IBIT records its largest-ever single-day outflow: $541 million!
🔴 Total outflows from U.S. Bitcoin funds: $582 million in a single session.
🔴 Around $1.13 billion left the funds in just 3 sessions!
⚠️ Continued outflows threaten Bitcoin’s $60,000 level and increase liquidation risks.
📉 Are we witnessing institutional capitulation or a historic buying opportunity?
$BTC $ETH
🔴 IBIT records its largest-ever single-day outflow: $541 million!
🔴 Total outflows from U.S. Bitcoin funds: $582 million in a single session.
🔴 Around $1.13 billion left the funds in just 3 sessions!
⚠️ Continued outflows threaten Bitcoin’s $60,000 level and increase liquidation risks.
📉 Are we witnessing institutional capitulation or a historic buying opportunity?
$BTC $ETH
BTC-1.59%
IBITETF-4.95%
2
135
·
--
$ERA Pressing beneath descending resistance... and there’s a clear attempt to accumulate!
The price is currently holding an important demand zone between $0.067 and $0.070, while moving in a tight range beneath a descending resistance line.
The most important thing is to reclaim resistance with a daily close, as this could be the first confirmation that the price action is starting to improve.
🎯 Target levels:
- First target: $0.10
- Main target: $0.1424
Reaching the main target from current levels would mean a potential gain of around 88%.
For me, the $0.067–$0.070 zone is the key area to watch, and a breakout above resistance with a daily close is the confirmation I’m waiting for.
$ERA is starting to show a setup worth following. 🔥
$ERA Pressing beneath descending resistance... and there’s a clear attempt to accumulate!
The price is currently holding an important demand zone between $0.067 and $0.070, while moving in a tight range beneath a descending resistance line.
The most important thing is to reclaim resistance with a daily close, as this could be the first confirmation that the price action is starting to improve.
🎯 Target levels:
- First target: $0.10
- Main target: $0.1424
Reaching the main target from current levels would mean a potential gain of around 88%.
For me, the $0.067–$0.070 zone is the key area to watch, and a breakout above resistance with a daily close is the confirmation I’m waiting for.
$ERA is starting to show a setup worth following. 🔥
The price is currently holding an important demand zone between $0.067 and $0.070, while moving in a tight range beneath a descending resistance line.
The most important thing is to reclaim resistance with a daily close, as this could be the first confirmation that the price action is starting to improve.
🎯 Target levels:
- First target: $0.10
- Main target: $0.1424
Reaching the main target from current levels would mean a potential gain of around 88%.
For me, the $0.067–$0.070 zone is the key area to watch, and a breakout above resistance with a daily close is the confirmation I’m waiting for.
$ERA is starting to show a setup worth following. 🔥
2
237
·
--
$SIREN is pressing against descending resistance… and the current price action pattern is worth watching!
On the daily timeframe, the price is moving within a tight range below the descending trendline, while holding the demand zone near $0.026.
What stands out is that the current structure resembles the price action seen in September and October, which preceded a strong rally for the coin.
🎯 Bullish scenario:
A daily close above the descending trendline could pave the way toward a target of:
$0.0477 🚀
That would represent a potential gain of nearly 80% from current levels.
For me, the $0.026 zone is the key level to watch, and a breakout above the trendline with a daily close is the confirmation I’m waiting for before considering the bullish scenario underway.
$SIREN is on the watchlist. 🔥
$SIREN is pressing against descending resistance… and the current price action pattern is worth watching!
On the daily timeframe, the price is moving within a tight range below the descending trendline, while holding the demand zone near $0.026.
What stands out is that the current structure resembles the price action seen in September and October, which preceded a strong rally for the coin.
🎯 Bullish scenario:
A daily close above the descending trendline could pave the way toward a target of:
$0.0477 🚀
That would represent a potential gain of nearly 80% from current levels.
For me, the $0.026 zone is the key level to watch, and a breakout above the trendline with a daily close is the confirmation I’m waiting for before considering the bullish scenario underway.
$SIREN is on the watchlist. 🔥
On the daily timeframe, the price is moving within a tight range below the descending trendline, while holding the demand zone near $0.026.
What stands out is that the current structure resembles the price action seen in September and October, which preceded a strong rally for the coin.
🎯 Bullish scenario:
A daily close above the descending trendline could pave the way toward a target of:
$0.0477 🚀
That would represent a potential gain of nearly 80% from current levels.
For me, the $0.026 zone is the key level to watch, and a breakout above the trendline with a daily close is the confirmation I’m waiting for before considering the bullish scenario underway.
$SIREN is on the watchlist. 🔥
1
524
·
--
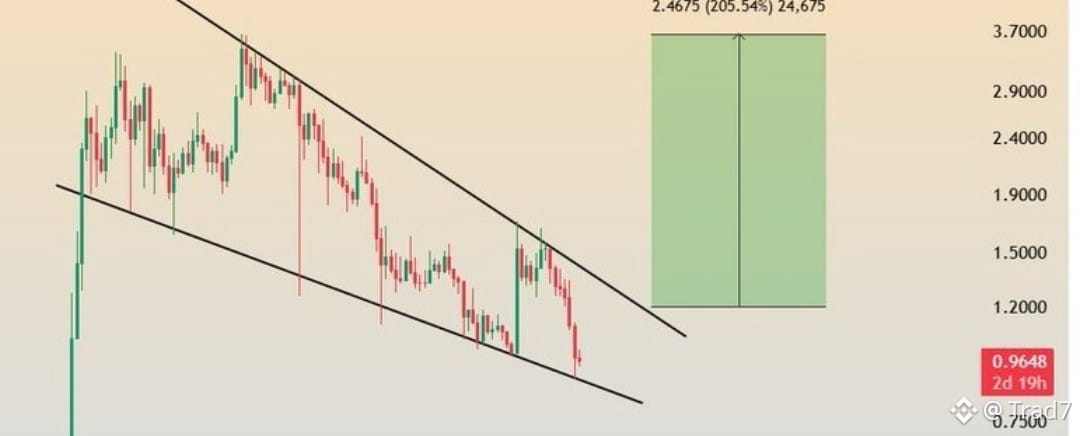
$XRP is approaching a critical zone... and the Falling Wedge pattern is worth watching!
Ripple is currently testing an important support zone within a long-term Falling Wedge pattern.
This zone could be a launchpad for a new reversal attempt, but the key signal will be a strong bounce followed by a breakout above the pattern’s upper boundary.
🚀 A breakout from the wedge could pave the way for a strong recovery rally for XRP.
The focus is currently on support holding firm, followed by confirmation of the breakout before judging whether an uptrend is beginning.
$XRP is approaching a critical zone... and the Falling Wedge pattern is worth watching!
Ripple is currently testing an important support zone within a long-term Falling Wedge pattern.
This zone could be a launchpad for a new reversal attempt, but the key signal will be a strong bounce followed by a breakout above the pattern’s upper boundary.
🚀 A breakout from the wedge could pave the way for a strong recovery rally for XRP.
The focus is currently on support holding firm, followed by confirmation of the breakout before judging whether an uptrend is beginning.
Ripple is currently testing an important support zone within a long-term Falling Wedge pattern.
This zone could be a launchpad for a new reversal attempt, but the key signal will be a strong bounce followed by a breakout above the pattern’s upper boundary.
🚀 A breakout from the wedge could pave the way for a strong recovery rally for XRP.
The focus is currently on support holding firm, followed by confirmation of the breakout before judging whether an uptrend is beginning.
3
2.5k
·
--
Bullish
As I told you, as long as the market is down, $EVAA will keep rising dramatically.
As I told you, as long as the market is down, $EVAA will keep rising dramatically.
2
163
·
--
📉 $ETH is still in a bearish structure, and I see no reason to call a bottom just yet!
For me, 2,807$ is the key level to watch at this stage.
A decisive break above it, confirmed by a strong close on higher timeframes (HTF), would be the first real sign that buyers are starting to regain control. That could then open the way to targeting new all-time highs, with distant targets between 10,000$ and 15,000$.
But until this level is reclaimed, I won’t treat every green candle as the start of a reversal, because the current bounces could turn into new selling zones.
📍 Zones to watch in the event of a bounce:
🔹 1,646$ – 1,744$
FVG zone.
🔹 2,160$ – 2,451$
Bearish Order Block + FVG zone.
These are the zones where I’ll watch for potential selling opportunities, rather than chasing price in the middle of a move.
🔻 What if the decline continues?
1,500$ is the next level to watch.
📉 $ETH is still in a bearish structure, and I see no reason to call a bottom just yet!
For me, 2,807$ is the key level to watch at this stage.
A decisive break above it, confirmed by a strong close on higher timeframes (HTF), would be the first real sign that buyers are starting to regain control. That could then open the way to targeting new all-time highs, with distant targets between 10,000$ and 15,000$.
But until this level is reclaimed, I won’t treat every green candle as the start of a reversal, because the current bounces could turn into new selling zones.
📍 Zones to watch in the event of a bounce:
🔹 1,646$ – 1,744$
FVG zone.
🔹 2,160$ – 2,451$
Bearish Order Block + FVG zone.
These are the zones where I’ll watch for potential selling opportunities, rather than chasing price in the middle of a move.
🔻 What if the decline continues?
1,500$ is the next level to watch.
For me, 2,807$ is the key level to watch at this stage.
A decisive break above it, confirmed by a strong close on higher timeframes (HTF), would be the first real sign that buyers are starting to regain control. That could then open the way to targeting new all-time highs, with distant targets between 10,000$ and 15,000$.
But until this level is reclaimed, I won’t treat every green candle as the start of a reversal, because the current bounces could turn into new selling zones.
📍 Zones to watch in the event of a bounce:
🔹 1,646$ – 1,744$
FVG zone.
🔹 2,160$ – 2,451$
Bearish Order Block + FVG zone.
These are the zones where I’ll watch for potential selling opportunities, rather than chasing price in the middle of a move.
🔻 What if the decline continues?
1,500$ is the next level to watch.
2
253
·
--
$APT More than 63% of the supply is staked, and over 2.1 million coins have been burned!
Aptos is approaching an important technical zone on the weekly timeframe, after the price reached the upper boundary of a Falling Wedge pattern—a zone that could mark the start of a new rebound.
But the chart isn't the only thing drawing attention; there are important figures within the ecosystem:
🔹 63% of the supply is locked in staking.
🔹 The total number of burned coins has exceeded 2.1 million APT.
🔹 Transaction fees remain extremely low, despite the significant increase in network fees.
🎯 Target price levels:
- $0.80
- $1.25
- $2.00
- $3.85
- $8.00
The combination of a higher staking ratio, continued coin burns, and low usage costs presents a set of factors worth watching.
Technically, a successful rebound from the upper boundary of the Falling Wedge would be an important signal confirming the start of a recovery.
$APT More than 63% of the supply is staked, and over 2.1 million coins have been burned!
Aptos is approaching an important technical zone on the weekly timeframe, after the price reached the upper boundary of a Falling Wedge pattern—a zone that could mark the start of a new rebound.
But the chart isn't the only thing drawing attention; there are important figures within the ecosystem:
🔹 63% of the supply is locked in staking.
🔹 The total number of burned coins has exceeded 2.1 million APT.
🔹 Transaction fees remain extremely low, despite the significant increase in network fees.
🎯 Target price levels:
- $0.80
- $1.25
- $2.00
- $3.85
- $8.00
The combination of a higher staking ratio, continued coin burns, and low usage costs presents a set of factors worth watching.
Technically, a successful rebound from the upper boundary of the Falling Wedge would be an important signal confirming the start of a recovery.
Aptos is approaching an important technical zone on the weekly timeframe, after the price reached the upper boundary of a Falling Wedge pattern—a zone that could mark the start of a new rebound.
But the chart isn't the only thing drawing attention; there are important figures within the ecosystem:
🔹 63% of the supply is locked in staking.
🔹 The total number of burned coins has exceeded 2.1 million APT.
🔹 Transaction fees remain extremely low, despite the significant increase in network fees.
🎯 Target price levels:
- $0.80
- $1.25
- $2.00
- $3.85
- $8.00
The combination of a higher staking ratio, continued coin burns, and low usage costs presents a set of factors worth watching.
Technically, a successful rebound from the upper boundary of the Falling Wedge would be an important signal confirming the start of a recovery.
5
723
·
--
📉 $ICP .. A long consolidation doesn’t necessarily mean the decline is over!
The price structure of Internet Computer is still bearish, and most of the price action throughout the year has remained confined to a sideways range, without a return to an uptrend.
According to Elliott Wave analysis, the fifth downward wave may be developing as an ABC pattern, with the possibility that wave B forms a Triangle before the decline resumes.
🔻 The key level right now:
The $1.95–$2.00 zone.
A break below the most recent lows in this zone would be an important signal that the downward wave has resumed its course.
If a breakdown occurs, the lower line of the Large Wedge represents the next major support zone.
Bottom line:
$ICP still needs to prove it can break out of the bearish structure.
The $1.95–$2.00 zone is the most important level to watch, and losing it could open the door to a new downward wave.
📉 $ICP .. A long consolidation doesn’t necessarily mean the decline is over!
The price structure of Internet Computer is still bearish, and most of the price action throughout the year has remained confined to a sideways range, without a return to an uptrend.
According to Elliott Wave analysis, the fifth downward wave may be developing as an ABC pattern, with the possibility that wave B forms a Triangle before the decline resumes.
🔻 The key level right now:
The $1.95–$2.00 zone.
A break below the most recent lows in this zone would be an important signal that the downward wave has resumed its course.
If a breakdown occurs, the lower line of the Large Wedge represents the next major support zone.
Bottom line:
$ICP still needs to prove it can break out of the bearish structure.
The $1.95–$2.00 zone is the most important level to watch, and losing it could open the door to a new downward wave.
The price structure of Internet Computer is still bearish, and most of the price action throughout the year has remained confined to a sideways range, without a return to an uptrend.
According to Elliott Wave analysis, the fifth downward wave may be developing as an ABC pattern, with the possibility that wave B forms a Triangle before the decline resumes.
🔻 The key level right now:
The $1.95–$2.00 zone.
A break below the most recent lows in this zone would be an important signal that the downward wave has resumed its course.
If a breakdown occurs, the lower line of the Large Wedge represents the next major support zone.
Bottom line:
$ICP still needs to prove it can break out of the bearish structure.
The $1.95–$2.00 zone is the most important level to watch, and losing it could open the door to a new downward wave.
2
317
Log in to explore more content
Join global crypto users on Binance Square
⚡️ Get latest and useful information about crypto.
💬 Trusted by the world’s largest crypto exchange.
👍 Discover real insights from verified creators.
Email / Phone number
Trending Topics
NvidiaLoses$2.7TrillionInMonthAndAHalf
29 views
7 Discussing
Nvidia’s nonstop drama is keeping buyers away from a historically cheap stock
BinncerPhX
·0 Likes
·102 views
CanBTCReboundAfterFallingBelow60K?
474,329 views
2,048 Discussing
GlobalStocksFaceLongestLosingStreakSince2023
163,420 views
1,423 Discussing