
扑天雕
533 Posts

扑天雕
Report
Block User
BTC 现货交易为主
92 Following
19 Followers
27 Liked
Posts
·
--
$JCT broke below the 0.002 level (current price: 0.002037, now back above it).
Moves that break through and then pull back are not uncommon; this time, it failed to hold above the level as well.
The candle close matters more than the wick: a firm close shows the direction is genuine.
Just listen—don’t buy based on this. Make your own judgment.
$JCT broke below the 0.002 level (current price: 0.002037, now back above it).
Moves that break through and then pull back are not uncommon; this time, it failed to hold above the level as well.
The candle close matters more than the wick: a firm close shows the direction is genuine.
Just listen—don’t buy based on this. Make your own judgment.
Moves that break through and then pull back are not uncommon; this time, it failed to hold above the level as well.
The candle close matters more than the wick: a firm close shows the direction is genuine.
Just listen—don’t buy based on this. Make your own judgment.
175
·
--
$SOXLB set a new 24-hour low of 57.63, breaking below the previous low of 58.42.
The market action seems off. A sharp drop is often followed by a rebound, but a rebound doesn’t necessarily mean a reversal. How do you usually deal with sharp drops?
Just sharing thoughts—make your own decisions about buying and selling.
$SOXLB set a new 24-hour low of 57.63, breaking below the previous low of 58.42.
The market action seems off. A sharp drop is often followed by a rebound, but a rebound doesn’t necessarily mean a reversal. How do you usually deal with sharp drops?
Just sharing thoughts—make your own decisions about buying and selling.
The market action seems off. A sharp drop is often followed by a rebound, but a rebound doesn’t necessarily mean a reversal. How do you usually deal with sharp drops?
Just sharing thoughts—make your own decisions about buying and selling.
47
·
--
A different take: Fed’s Collins says tackling inflation is more important than addressing housing issues
Seemingly insignificant news like this can sometimes be underestimated; its significance may only become clear in hindsight.
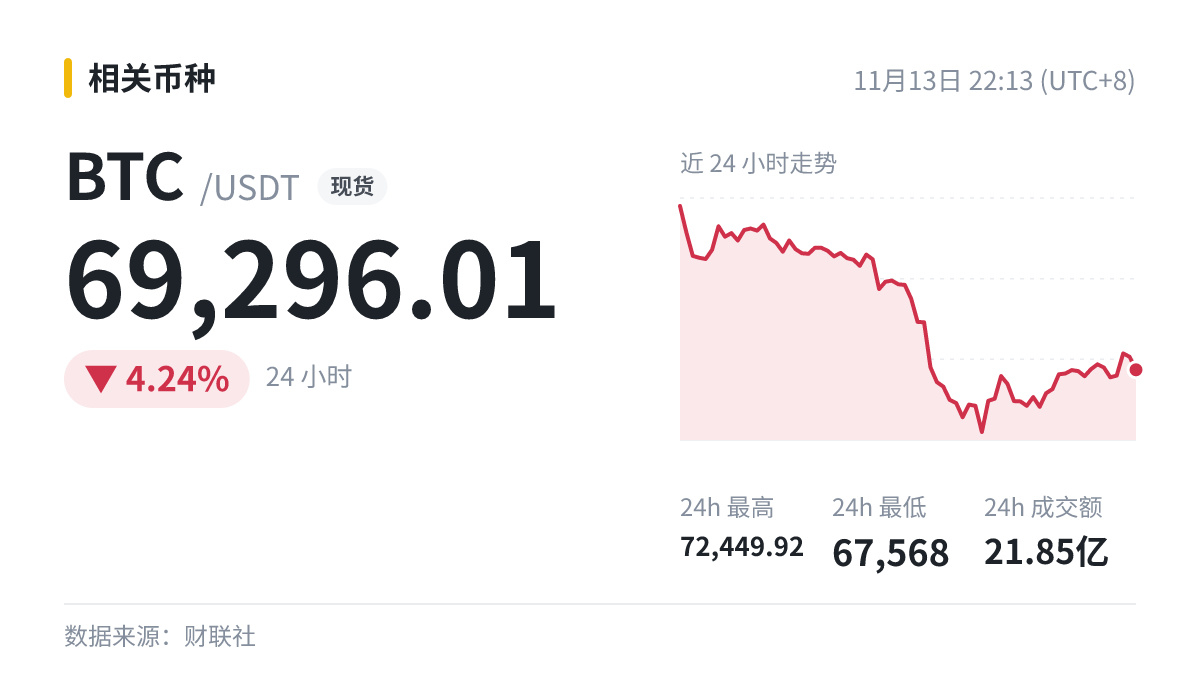
$BTC 24h -4.24%. Watch the trading volume and pay less attention to the chatter, and you’ll avoid quite a few pitfalls.
This is not investment advice. Don’t follow it blindly.
A different take: Fed’s Collins says tackling inflation is more important than addressing housing issues
Seemingly insignificant news like this can sometimes be underestimated; its significance may only become clear in hindsight.
$BTC 24h -4.24%. Watch the trading volume and pay less attention to the chatter, and you’ll avoid quite a few pitfalls.
This is not investment advice. Don’t follow it blindly.
Seemingly insignificant news like this can sometimes be underestimated; its significance may only become clear in hindsight.
$BTC 24h -4.24%. Watch the trading volume and pay less attention to the chatter, and you’ll avoid quite a few pitfalls.
This is not investment advice. Don’t follow it blindly.
60
·
--
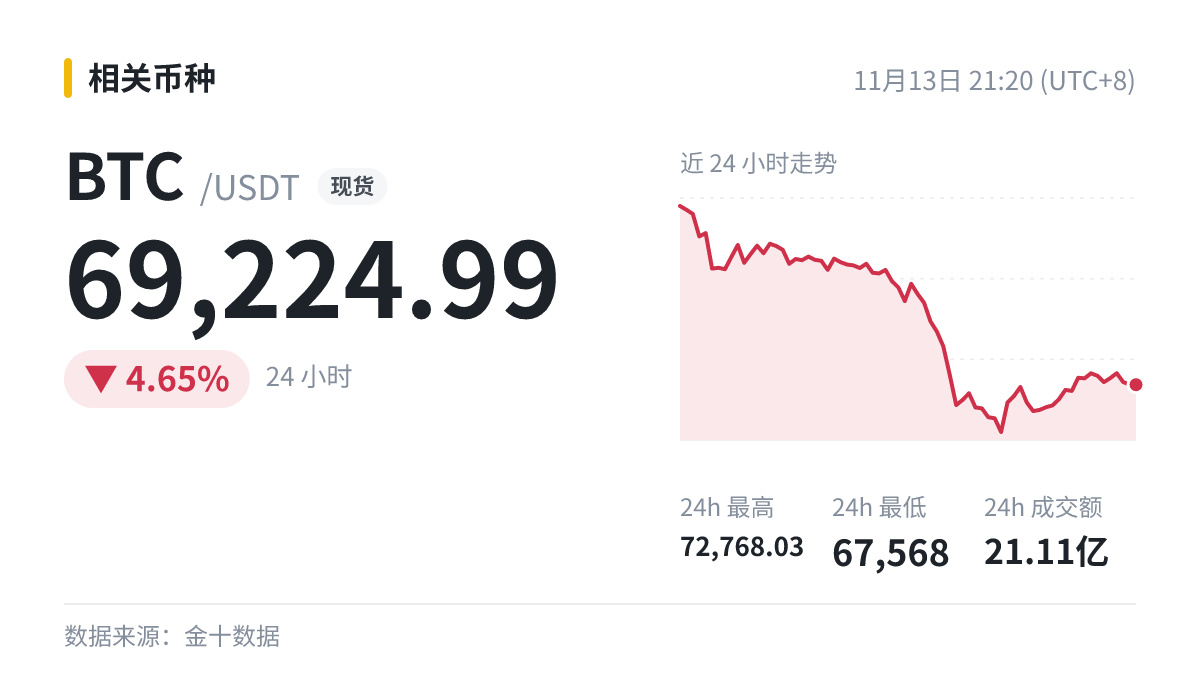
U.S. Treasury Secretary Bessent: The Fed should understand that this is an energy supply shock|$BTC , 24h -4.65%
The directional bias is weak, so just keep this in mind as a reference. Set your stop-loss outside the structure, and don’t panic no matter how noisy the news gets. Agree? If you disagree, feel free to share your thoughts in the comments.
Just casual discussion—not financial advice.
U.S. Treasury Secretary Bessent: The Fed should understand that this is an energy supply shock|$BTC , 24h -4.65%
The directional bias is weak, so just keep this in mind as a reference. Set your stop-loss outside the structure, and don’t panic no matter how noisy the news gets. Agree? If you disagree, feel free to share your thoughts in the comments.
Just casual discussion—not financial advice.
The directional bias is weak, so just keep this in mind as a reference. Set your stop-loss outside the structure, and don’t panic no matter how noisy the news gets. Agree? If you disagree, feel free to share your thoughts in the comments.
Just casual discussion—not financial advice.
46
·
--
The U.S.-India trade deal is close to being finalized, with the U.S. reportedly pledging lower tariffs for India.
Where are the previous high and key moving averages? The news won't change them—those are the levels to watch.
News like this first impacts highly leveraged positions. You can take a look at the liquidation data.
$BTC is currently at 69278.01, down 4.94% over 24h. What do you think? Bullish or bearish?
#BTC
No guarantee I'm right—make your own judgment.
The U.S.-India trade deal is close to being finalized, with the U.S. reportedly pledging lower tariffs for India.
Where are the previous high and key moving averages? The news won't change them—those are the levels to watch.
News like this first impacts highly leveraged positions. You can take a look at the liquidation data.
$BTC is currently at 69278.01, down 4.94% over 24h. What do you think? Bullish or bearish?
#BTC
No guarantee I'm right—make your own judgment.
Where are the previous high and key moving averages? The news won't change them—those are the levels to watch.
News like this first impacts highly leveraged positions. You can take a look at the liquidation data.
$BTC is currently at 69278.01, down 4.94% over 24h. What do you think? Bullish or bearish?
#BTC
No guarantee I'm right—make your own judgment.
3
·
--
I don’t predict highs or lows; I just respond to the direction price points.
Here’s one right in front of us: $JCT plunged 3.26% in 15 minutes to 0.002344.
This may not be accurate, so don’t follow it blindly.
I don’t predict highs or lows; I just respond to the direction price points.
Here’s one right in front of us: $JCT plunged 3.26% in 15 minutes to 0.002344.
This may not be accurate, so don’t follow it blindly.
Here’s one right in front of us: $JCT plunged 3.26% in 15 minutes to 0.002344.
This may not be accurate, so don’t follow it blindly.
5
·
--
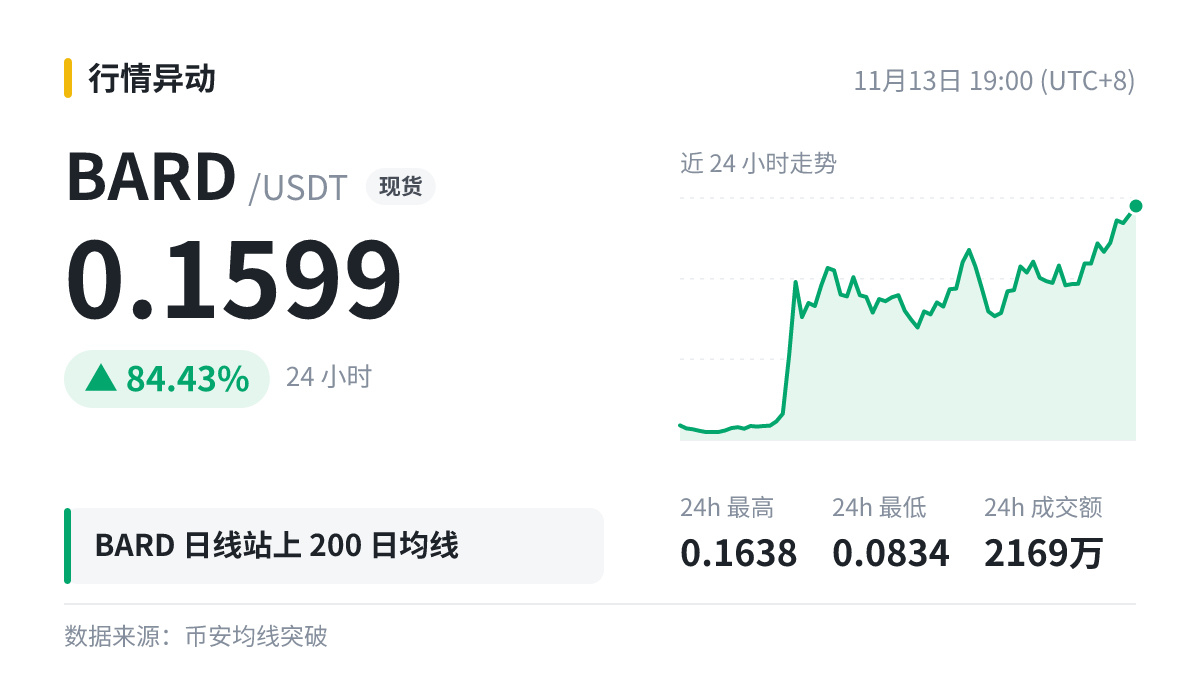
$BARD On the daily chart, price has moved above MA200 (0.1476).
Let’s break down the moving averages based on this data.
The direction of the moving average itself is also worth watching: a price moving above it while it’s still trending downward is not the same as moving above it when it has already flattened out.
Moving above a long-term moving average is often interpreted as a sign that the trend is strengthening, while falling below it is often seen as a sign of weakness. But a single crossover is far from enough to tell us much.
Extreme readings often come with larger swings. At times like these, it’s better to reduce your position size rather than make a big bet.
Just chatting—whether you make or lose money, you have to bear the consequences yourself.
$BARD On the daily chart, price has moved above MA200 (0.1476).
Let’s break down the moving averages based on this data.
The direction of the moving average itself is also worth watching: a price moving above it while it’s still trending downward is not the same as moving above it when it has already flattened out.
Moving above a long-term moving average is often interpreted as a sign that the trend is strengthening, while falling below it is often seen as a sign of weakness. But a single crossover is far from enough to tell us much.
Extreme readings often come with larger swings. At times like these, it’s better to reduce your position size rather than make a big bet.
Just chatting—whether you make or lose money, you have to bear the consequences yourself.
Let’s break down the moving averages based on this data.
The direction of the moving average itself is also worth watching: a price moving above it while it’s still trending downward is not the same as moving above it when it has already flattened out.
Moving above a long-term moving average is often interpreted as a sign that the trend is strengthening, while falling below it is often seen as a sign of weakness. But a single crossover is far from enough to tell us much.
Extreme readings often come with larger swings. At times like these, it’s better to reduce your position size rather than make a big bet.
Just chatting—whether you make or lose money, you have to bear the consequences yourself.
1
·
--
$ERA lost the 0.08 level. Two scenarios from here:
① A rebound fails to reclaim 0.08 → the level turns into resistance, with the 24h low at 0.0779 as the next downside target
② A quick reclaim of 0.08 → this was probably a false breakdown, and short positions could get squeezed
I'm paying closer attention to buying support on the first rebound.
It's your money—make your own decisions.
$ERA lost the 0.08 level. Two scenarios from here:
① A rebound fails to reclaim 0.08 → the level turns into resistance, with the 24h low at 0.0779 as the next downside target
② A quick reclaim of 0.08 → this was probably a false breakdown, and short positions could get squeezed
I'm paying closer attention to buying support on the first rebound.
It's your money—make your own decisions.
① A rebound fails to reclaim 0.08 → the level turns into resistance, with the 24h low at 0.0779 as the next downside target
② A quick reclaim of 0.08 → this was probably a false breakdown, and short positions could get squeezed
I'm paying closer attention to buying support on the first rebound.
It's your money—make your own decisions.
·
--
$UAI 5 minutes, up 3.15%, at 0.03919.
After it rises, whether it can hold steady matters more than how high it spikes.
#UAI
I could be wrong, so don't act on this.
$UAI 5 minutes, up 3.15%, at 0.03919.
After it rises, whether it can hold steady matters more than how high it spikes.
#UAI
I could be wrong, so don't act on this.
After it rises, whether it can hold steady matters more than how high it spikes.
#UAI
I could be wrong, so don't act on this.
·
--
In the past 4 hours, $69.91 million in Binance futures positions were liquidated. Long positions accounted for 85.4%, and the largest liquidation was $BTC ($40.12 million).
Price action after liquidations is often healthier than before them. Would you make a move at a level like this?
#BTC
Just a quick note—what you do is up to you.
In the past 4 hours, $69.91 million in Binance futures positions were liquidated. Long positions accounted for 85.4%, and the largest liquidation was $BTC ($40.12 million).
Price action after liquidations is often healthier than before them. Would you make a move at a level like this?
#BTC
Just a quick note—what you do is up to you.
Price action after liquidations is often healthier than before them. Would you make a move at a level like this?
#BTC
Just a quick note—what you do is up to you.
239
·
--
“A long-dormant whale sold 16,700 ETH in a single transaction, worth over $32.3 million”
Here are clear answers to the three questions everyone cares about most—
Q1: Is this bullish or bearish?
A: Somewhat bearish, but sentiment is often amplified.
Q2: Will it immediately affect the price?
A: Not necessarily. There’s often a time lag between news and price movements, so first keep an eye on whether large-holder addresses show any unusual activity.
Q3: What should we watch next?
A: How the market has moved when similar things happened in the past.
Q4: Should you adjust your position because of this?
A: I wouldn’t change my plan based on a single news item, unless the price makes a confirmed move. $ETH is currently at 1941.26, down 5.02% over 24 hours. Keep a close eye on it.
Just sharing my thoughts—make your own decisions about buying and selling.
“A long-dormant whale sold 16,700 ETH in a single transaction, worth over $32.3 million”
Here are clear answers to the three questions everyone cares about most—
Q1: Is this bullish or bearish?
A: Somewhat bearish, but sentiment is often amplified.
Q2: Will it immediately affect the price?
A: Not necessarily. There’s often a time lag between news and price movements, so first keep an eye on whether large-holder addresses show any unusual activity.
Q3: What should we watch next?
A: How the market has moved when similar things happened in the past.
Q4: Should you adjust your position because of this?
A: I wouldn’t change my plan based on a single news item, unless the price makes a confirmed move. $ETH is currently at 1941.26, down 5.02% over 24 hours. Keep a close eye on it.
Just sharing my thoughts—make your own decisions about buying and selling.
Here are clear answers to the three questions everyone cares about most—
Q1: Is this bullish or bearish?
A: Somewhat bearish, but sentiment is often amplified.
Q2: Will it immediately affect the price?
A: Not necessarily. There’s often a time lag between news and price movements, so first keep an eye on whether large-holder addresses show any unusual activity.
Q3: What should we watch next?
A: How the market has moved when similar things happened in the past.
Q4: Should you adjust your position because of this?
A: I wouldn’t change my plan based on a single news item, unless the price makes a confirmed move. $ETH is currently at 1941.26, down 5.02% over 24 hours. Keep a close eye on it.
Just sharing my thoughts—make your own decisions about buying and selling.
10
·
--
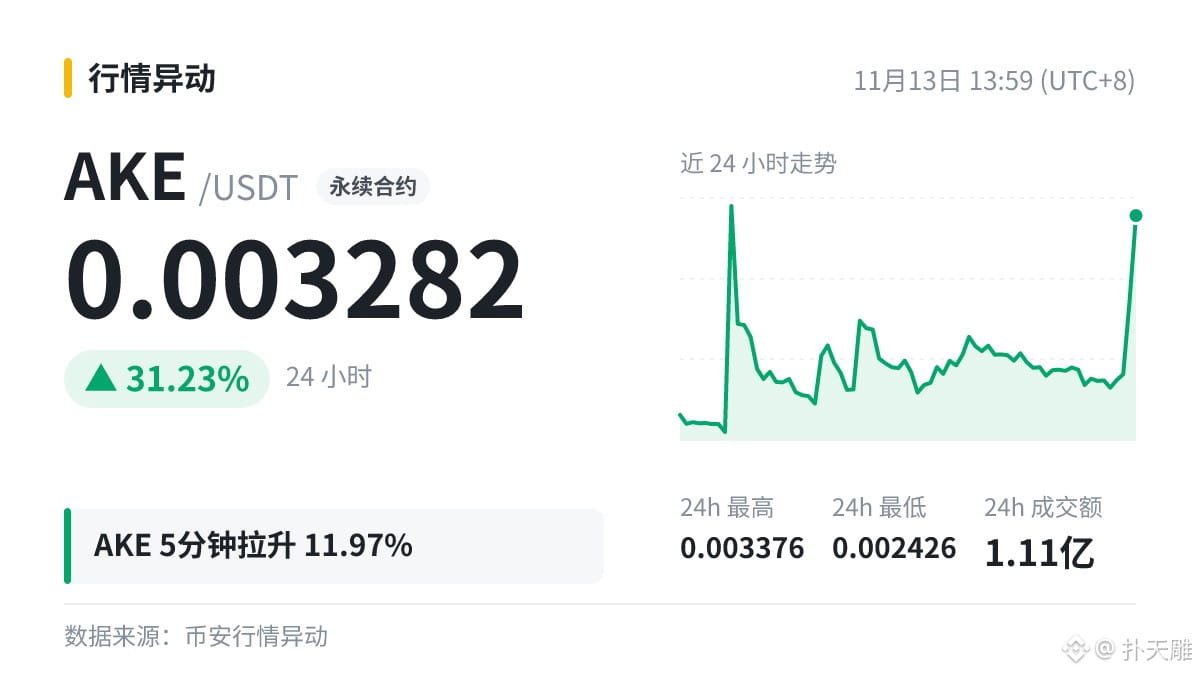
$AKE short-term upward breakout signal
5-minute +11.97% to 0.003282, 4h +22.1%.
The daily chart is strengthening in sync (24h +31.23%), with short- and long-term timeframes moving together, suggesting better follow-through.
Where do you see the key dividing line?
Just taking a look—don’t follow this blindly; make your own judgment.
$AKE short-term upward breakout signal
5-minute +11.97% to 0.003282, 4h +22.1%.
The daily chart is strengthening in sync (24h +31.23%), with short- and long-term timeframes moving together, suggesting better follow-through.
Where do you see the key dividing line?
Just taking a look—don’t follow this blindly; make your own judgment.
5-minute +11.97% to 0.003282, 4h +22.1%.
The daily chart is strengthening in sync (24h +31.23%), with short- and long-term timeframes moving together, suggesting better follow-through.
Where do you see the key dividing line?
Just taking a look—don’t follow this blindly; make your own judgment.
7
·
--
After hitting a $AIOT 24-hour low, it bounced back.
24h: -8.86%; current price: 0.1502, previous low: 0.144.
Structurally, it quickly reclaimed the previous low after breaking below it, hinting at a false breakdown. If it holds, this could signal a bottom; if not, the decline may continue. Which way do you think it’ll go? Let me know.
Just sharing my thoughts; this is not investment advice.
After hitting a $AIOT 24-hour low, it bounced back.
24h: -8.86%; current price: 0.1502, previous low: 0.144.
Structurally, it quickly reclaimed the previous low after breaking below it, hinting at a false breakdown. If it holds, this could signal a bottom; if not, the decline may continue. Which way do you think it’ll go? Let me know.
Just sharing my thoughts; this is not investment advice.
24h: -8.86%; current price: 0.1502, previous low: 0.144.
Structurally, it quickly reclaimed the previous low after breaking below it, hinting at a false breakdown. If it holds, this could signal a bottom; if not, the decline may continue. Which way do you think it’ll go? Let me know.
Just sharing my thoughts; this is not investment advice.
·
--
Technical Perspective | $BARD
1h +7.11%, 4h +3.73%, 24h +53.74%
Intraday strength doesn't mean the trend has changed; the daily chart structure should also be considered.
Do you trust volume or price more?
Data is for reference only—don't take it all at face value.
Technical Perspective | $BARD
1h +7.11%, 4h +3.73%, 24h +53.74%
Intraday strength doesn't mean the trend has changed; the daily chart structure should also be considered.
Do you trust volume or price more?
Data is for reference only—don't take it all at face value.
1h +7.11%, 4h +3.73%, 24h +53.74%
Intraday strength doesn't mean the trend has changed; the daily chart structure should also be considered.
Do you trust volume or price more?
Data is for reference only—don't take it all at face value.
62
·
--
$BTC 68941.84|“Crypto and U.S. stocks are both falling. What will drive the next rebound?”
Trending topics change several times a day, but few can actually move the market.
Don’t take what I’m saying as advice.
$BTC 68941.84|“Crypto and U.S. stocks are both falling. What will drive the next rebound?”
Trending topics change several times a day, but few can actually move the market.
Don’t take what I’m saying as advice.
Trending topics change several times a day, but few can actually move the market.
Don’t take what I’m saying as advice.
202
·
--
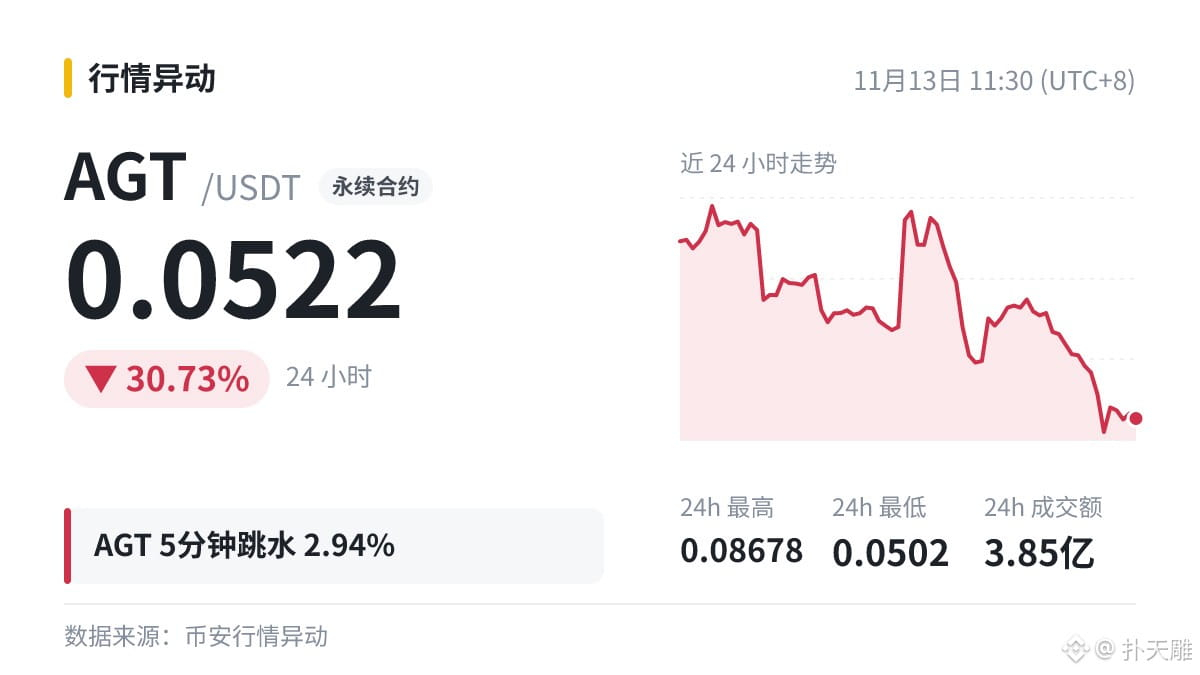
$AGT 5-minute plunge of 2.94%, current price 0.0522, 24-hour range 0.0502 ~ 0.08678.
When reading candlestick charts, the candle body matters more than the wicks: a solid close means the move has real strength.
After a drop, holding steady matters more than how much it rebounds.
Don't take this as investment advice.
$AGT 5-minute plunge of 2.94%, current price 0.0522, 24-hour range 0.0502 ~ 0.08678.
When reading candlestick charts, the candle body matters more than the wicks: a solid close means the move has real strength.
After a drop, holding steady matters more than how much it rebounds.
Don't take this as investment advice.
When reading candlestick charts, the candle body matters more than the wicks: a solid close means the move has real strength.
After a drop, holding steady matters more than how much it rebounds.
Don't take this as investment advice.
11
·
--
Two large BTC options trades were executed on an exchange, with a combined notional value of $45.2656 million.
A quick look at the impact: the news is somewhat positive and may help sentiment recover in the short term. Whether that turns into a trend still depends on whether trading volume can be sustained.
$BTC Current price: 70,230.28; 24-hour range: 69,900–73,884.01.
#比特币
Just sharing my thoughts—this is not investment advice.
Two large BTC options trades were executed on an exchange, with a combined notional value of $45.2656 million.
A quick look at the impact: the news is somewhat positive and may help sentiment recover in the short term. Whether that turns into a trend still depends on whether trading volume can be sustained.
$BTC Current price: 70,230.28; 24-hour range: 69,900–73,884.01.
#比特币
Just sharing my thoughts—this is not investment advice.
A quick look at the impact: the news is somewhat positive and may help sentiment recover in the short term. Whether that turns into a trend still depends on whether trading volume can be sustained.
$BTC Current price: 70,230.28; 24-hour range: 69,900–73,884.01.
#比特币
Just sharing my thoughts—this is not investment advice.
14
·
--
$BIRB 5A sharp plunge on the minute chart, down 2.43%, with the current price at 0.07688.
Support below is around the 24-hour low of 0.07146. If that level breaks, it could open up further downside; if a rebound fails to reclaim the breakdown level, the weak trend is likely to continue.
Which side are you on? Let me know in the comments.
You bear the risk yourself—I'm just chatting.
$BIRB 5A sharp plunge on the minute chart, down 2.43%, with the current price at 0.07688.
Support below is around the 24-hour low of 0.07146. If that level breaks, it could open up further downside; if a rebound fails to reclaim the breakdown level, the weak trend is likely to continue.
Which side are you on? Let me know in the comments.
You bear the risk yourself—I'm just chatting.
Support below is around the 24-hour low of 0.07146. If that level breaks, it could open up further downside; if a rebound fails to reclaim the breakdown level, the weak trend is likely to continue.
Which side are you on? Let me know in the comments.
You bear the risk yourself—I'm just chatting.
71
·
--
Q: The Osmosis network has stopped producing blocks, and a South Korean crypto exchange has suspended OSMO deposits and withdrawals. What impact will this have on the market?
A: The short-term impact on the price is limited, but it may affect everyone's expectations going forward. It's worth participating only when the news and candlestick trend move in the same direction; when they diverge, be extra cautious.
$OSMO Latest: 0.0357 (24h +7.53%).
#OSMO
It's your money, so you decide.
Q: The Osmosis network has stopped producing blocks, and a South Korean crypto exchange has suspended OSMO deposits and withdrawals. What impact will this have on the market?
A: The short-term impact on the price is limited, but it may affect everyone's expectations going forward. It's worth participating only when the news and candlestick trend move in the same direction; when they diverge, be extra cautious.
$OSMO Latest: 0.0357 (24h +7.53%).
#OSMO
It's your money, so you decide.
A: The short-term impact on the price is limited, but it may affect everyone's expectations going forward. It's worth participating only when the news and candlestick trend move in the same direction; when they diverge, be extra cautious.
$OSMO Latest: 0.0357 (24h +7.53%).
#OSMO
It's your money, so you decide.
28
·
--
About Merkle trees:
If any transaction in a block is altered, its hash changes, which affects the hashes at each level up to the Merkle root. The block hash changes as well.
The advantage of a Merkle tree is that a single, short root hash can “lock in” a large number of transactions, and any alteration—even to just one transaction—will be detected.
$BTC 71139.97(-3.41%)
#BTC
Not investment advice—don’t copy this blindly.
About Merkle trees:
If any transaction in a block is altered, its hash changes, which affects the hashes at each level up to the Merkle root. The block hash changes as well.
The advantage of a Merkle tree is that a single, short root hash can “lock in” a large number of transactions, and any alteration—even to just one transaction—will be detected.
$BTC 71139.97(-3.41%)
#BTC
Not investment advice—don’t copy this blindly.
If any transaction in a block is altered, its hash changes, which affects the hashes at each level up to the Merkle root. The block hash changes as well.
The advantage of a Merkle tree is that a single, short root hash can “lock in” a large number of transactions, and any alteration—even to just one transaction—will be detected.
$BTC 71139.97(-3.41%)
#BTC
Not investment advice—don’t copy this blindly.
38
Log in to explore more content
Join global crypto users on Binance Square
⚡️ Get latest and useful information about crypto.
💬 Trusted by the world’s largest crypto exchange.
👍 Discover real insights from verified creators.
Email / Phone number
Trending Topics
USPPIMissMayEaseBTCPressure
11,472 views
367 Discussing
US PPI Rises 6.5% a Year in October, Slightly Below 6.6% Forecast
Binance News
·11 Likes
·10.2k views
BitcoinCoreDisclosesTorTrafficVulnerability
2,652 views
132 Discussing
WhatWillDriveCryptoandStocks’NextRebound?
106,649 views
1,332 Discussing